1. Introduction
Nitrogen oxides (NO
x) are toxic atmospheric pollutants produced by fuel combustion in industry and diesel engines. The main dangers of nitric oxide come from its facile oxidation to the highly toxic NO
2 gas, as well as the presence of nitric oxide (NO) in photochemical smog and its role in the formation of ground-level ozone [
1,
2,
3,
4,
5]. In addition, nitric oxide is a biologically important compound produced within living cells. For humans, monitoring the biomarker NO molecules in exhaled breath is a promising approach for non-invasive diagnostics of asthma and other respiratory diseases [
6,
7].
Since nitrogen oxides have prominent redox activity, resistive-type sensors based on semiconductor metal oxides (SMOx) are suitable for sensing NO
x. A wide range of sensor materials was elaborated with advantageous sensing behavior to NO
2, including tin dioxide, indium oxide, and composites with noble metals and organic-inorganic perovskites [
8,
9]. Tungsten oxide has been established as one of the most sensitive materials for NO
2 sensors [
1,
2,
10,
11]. Numerous works demonstrate the advantageous sensitivity and selectivity of WO
3-based sensors to NO [
2,
6,
12,
13,
14]. WO
3 is an
n-type semiconductor with a bandgap width of 2.62 eV [
15]. An intrinsic oxygen deficiency of tungsten oxide that can be expressed as WO
3−δ is associated with the partial reduction of W
6+ cations to W
5+. The occurrence of such donor states providing loosely bound electrons is favorable for chemisorption of atmospheric oxygen. The formation of chemisorbed oxygen species (O
2−, O
− or O
2−) was believed to be the initial stage in the sensing mechanism by WO
3-based sensors [
3,
5,
16]. NO
2 has stronger electron acceptor behavior than that of oxygen. The standard redox potential of the pair NO
2/NO
2− is 0.87 V versus NHE, which exceeds that of O
2/O
2− (−0.16 V vs. NHE [
17]). The electron affinity of NO
2 (2.3 eV) is higher than that of O
2 (0.45 eV) [
18]. Thus, chemisorption of NO
2 on the surface of
n−type SMOx and electron trapping by the adsorbate is more energetically preferable, than that of the chemisorption of O
2. Nitrogen dioxide in air is always detected as an oxidizing gas, i.e., by the increase of resistance of n-type SMOx. The sensing mechanism includes oxidation of the WO
3 surface via the formation of NO
2− species and fulfillment of oxygen vacancies through the dissociative chemisorption of NO
2 [
19].
The explanation of sensing behavior to NO faces the issue of the attribution of this gas to a particular redox group. In most works, NO was detected as an oxidizing gas by various
n-type SMOx [
3,
6,
12,
14,
20,
21,
22,
23,
24,
25]. This is explained by negative charge accumulation on the solid surface due to NO chemisorption in the form of molecular ions (NO
−) and/or in the form of residuals of its dissociation into O
− and N
2 [
2,
3,
6,
22,
23,
25]. An alternate explanation is that NO is readily oxidized to NO
2 in oxygen-containing ambient, and the latter is detected by the sensors as the oxidizing gas [
24,
26]. However, it has been emphasized that despite the thermodynamic feasibility of NO oxidation to NO
2 by O
2, this process is kinetically hampered [
27]. For this reason, the sensors that realized the principle of NO to NO
2 conversion were functionalized by catalytic additives [
24,
27]. There are some reports on NO being detected as a reducing gas by sensors based on pristine WO
3 [
27] and WO
3-based composites [
13]. The standard NO/NO
− redox potential (−0.76 V vs. NHE) is lower than that of O
2/O
2− (−0.16 V vs. NHE) [
17]. The electron affinity of NO (0.03 eV) is lower than that of O
2 (0.45 eV) [
18]. Thus, NO has weaker electron acceptor behavior than that of O
2, and it is unlikely that NO can replace oxygen in the competitive adsorption on
n-type SMOx. Moreover, thermodynamics of NO oxidation by oxygen to NO
2 suggest that it is energetically preferable for nitric oxide to be a reducing gas in the reaction with oxygen species O
2− (and a fortiori O
−) on the surface of SMOx.
In this study, we focused on a comparative study of NO2 and NO sensing pathways using tungsten oxide. Nanocrystalline WO3 was synthesized with different particle sizes in the range of 7–35 nm. In the sensing tests, the responses of WO3 sensors to NO and NO2 with respect to the oxidizing gases were observed. Similar dependencies of sensor signals on temperature and humidity were found in the sensing tests to NO2 and NO. The effect of WO3 particle size on sensitivity was correlated to the concentration of partially reduced cations W5+. Similar interaction routes of WO3 with NO and NO2 were inferred from the results of in situ infrared (DRIFT) spectroscopy. However, from distinct effects of reaction conditions on DRIFT spectra and the concentrations of target gases on sensitivity it was deduced that NO sensing by WO3 was not due to the gas-phase conversion of NO to NO2.
2. Materials and Methods
The nanocrystalline WO
3 was obtained by aqueous deposition of tungstic acid followed by thermal decomposition at different temperatures [
28]. Nitric acid (7.8 M) was dropwise added to the stirred 16 mM aqueous solution of (NH
4)
10H
2W
12O
42 (Sigma−Aldrich, >99%) at 80 °C. The resultant mixture of 10 mM ammonium paratungstate and 3 M HNO
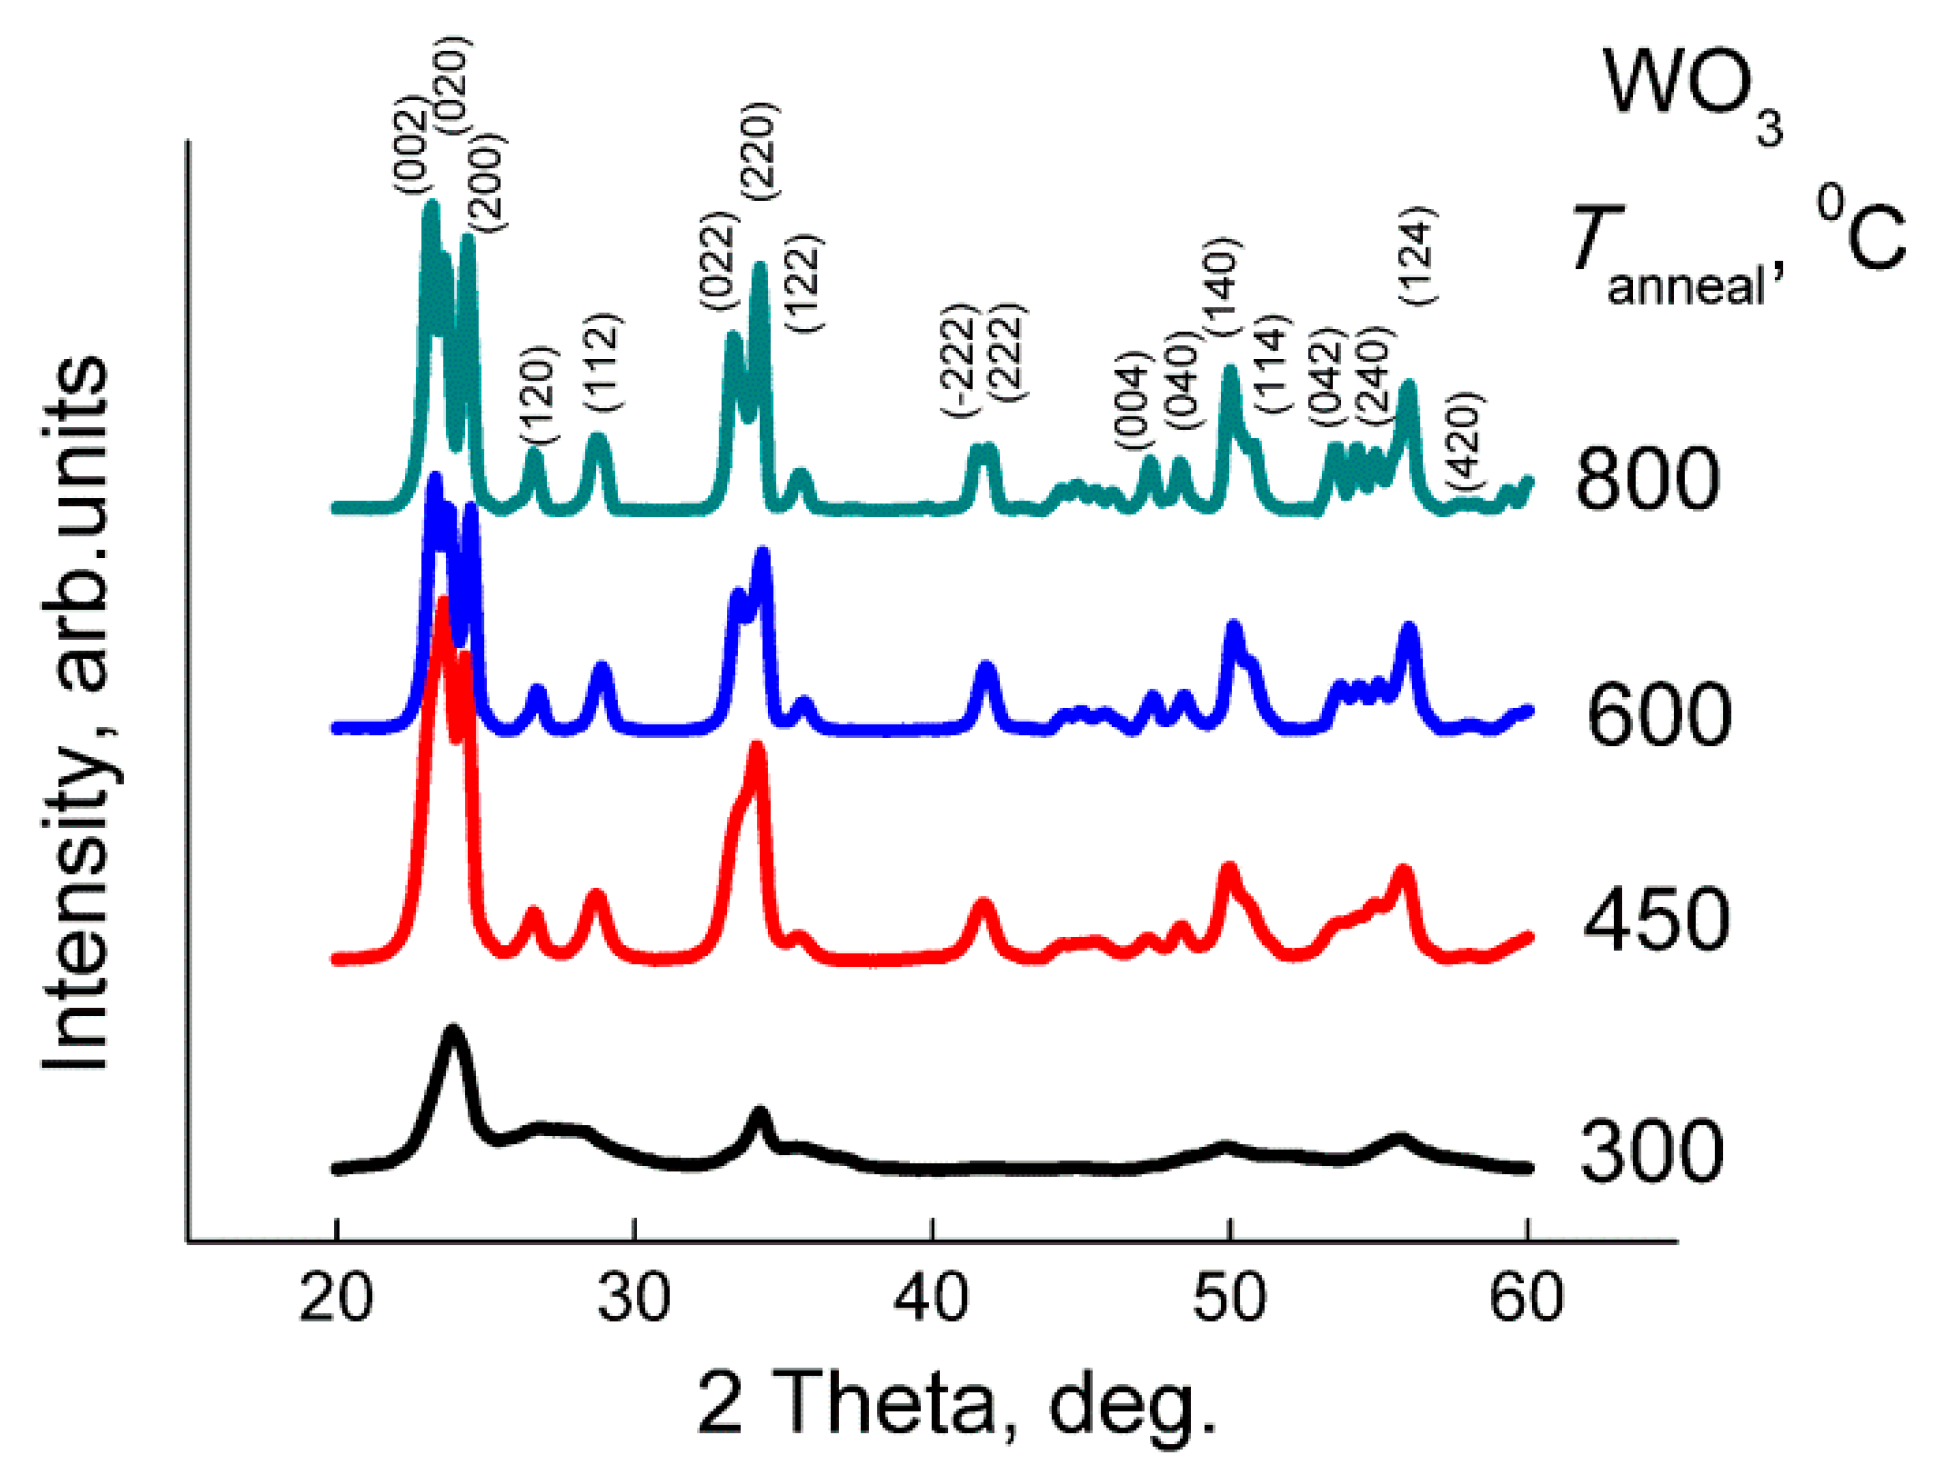
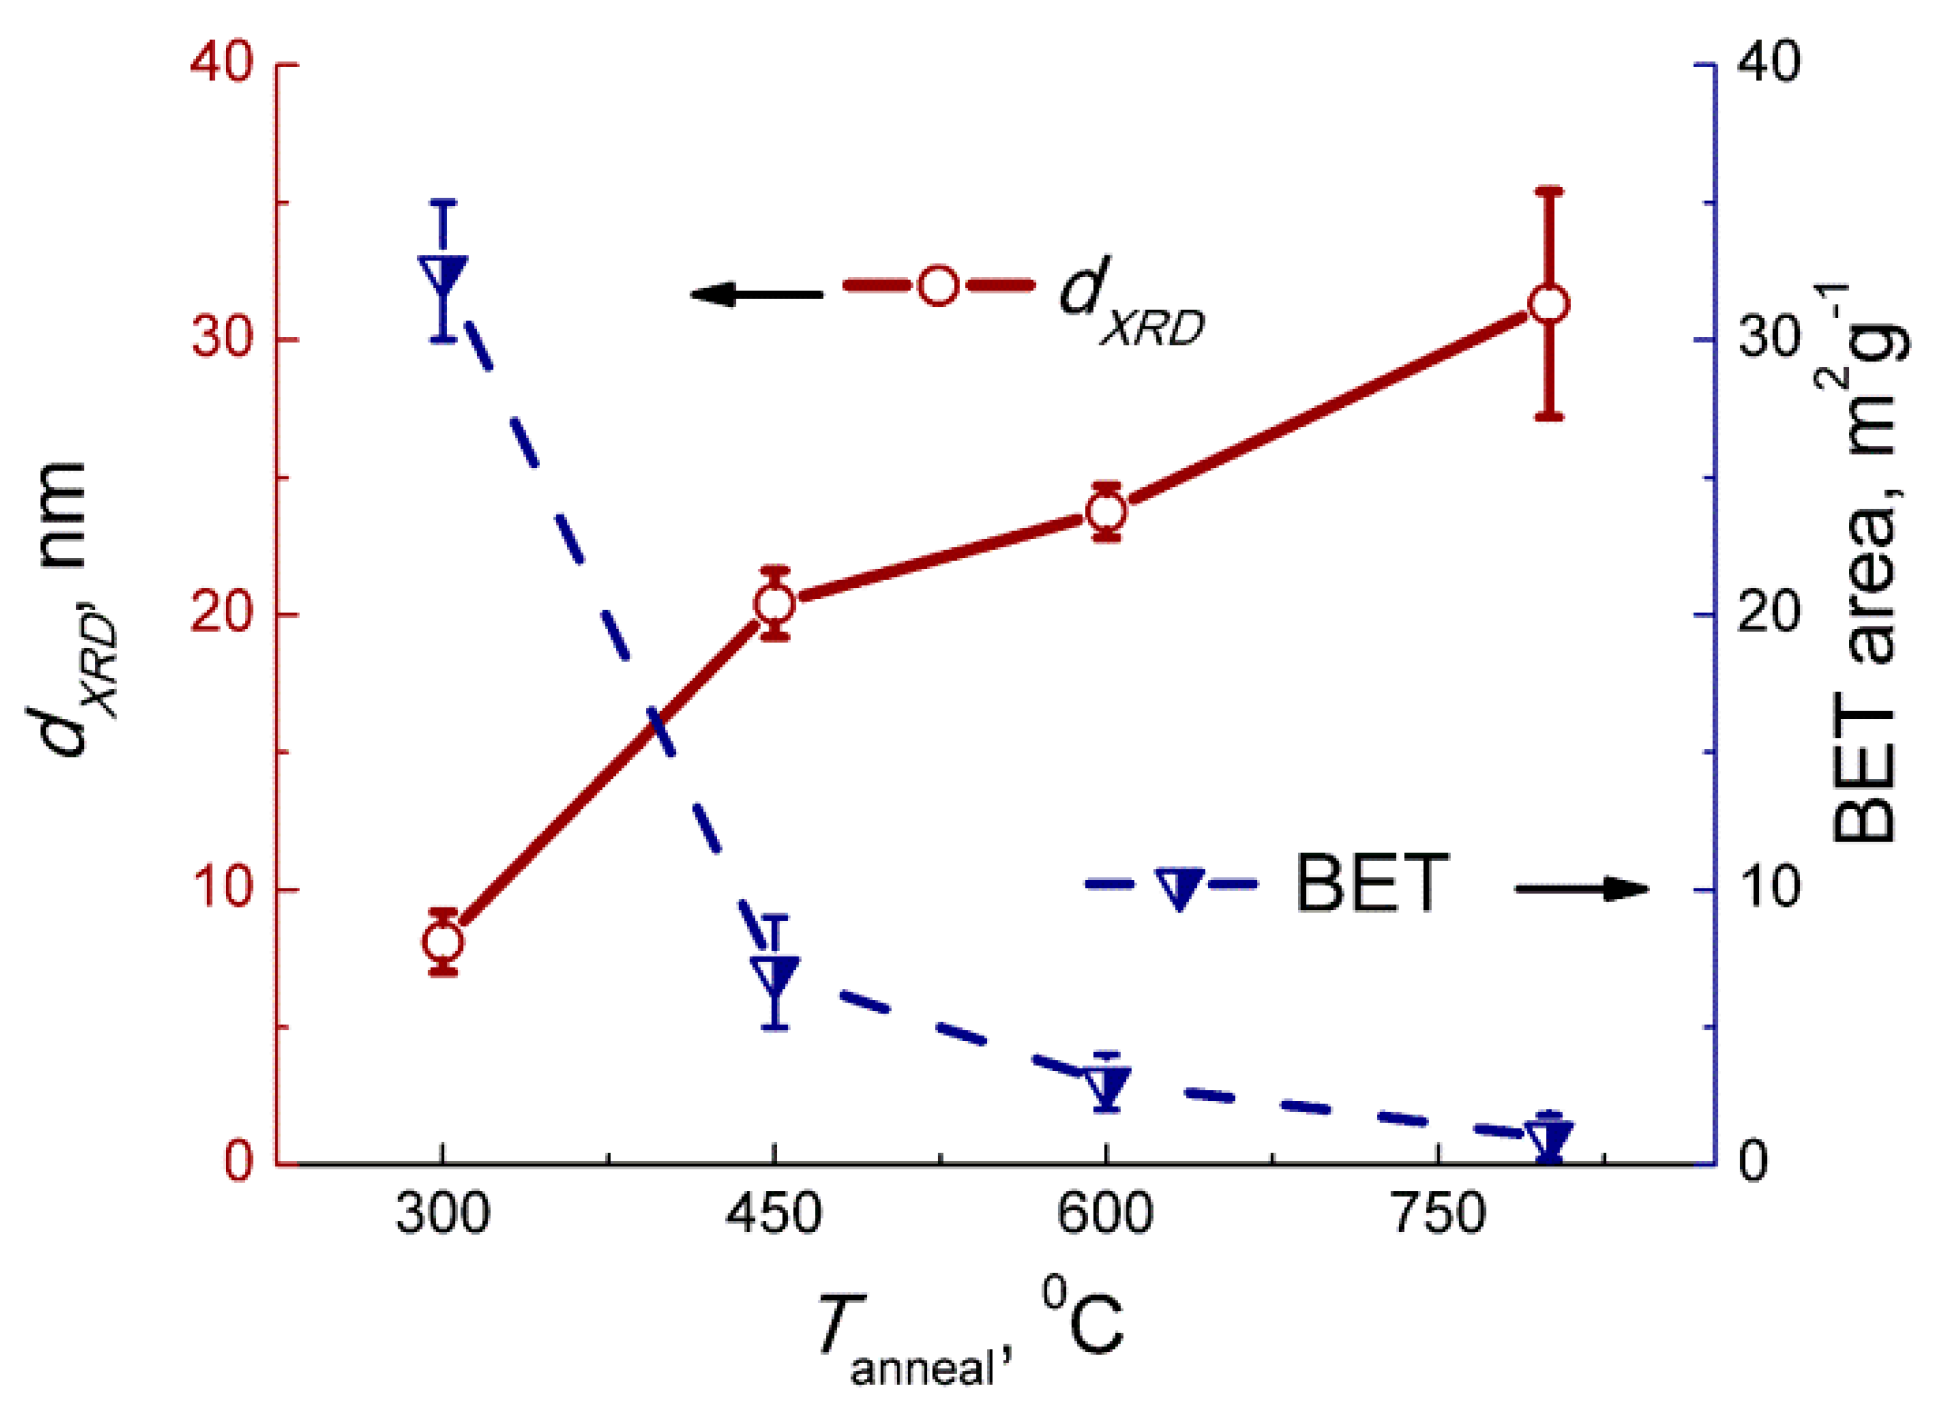
3 was stirred at 80 °C for 30 min and cooled down to room temperature for 1 h. The obtained yellow precipitate of tungstic acid was centrifuged, washed by deionized water, and dried at 80 °C for 12 h. It was divided into four parts, which were annealed in air for 24 h at different temperatures: 300, 450, 600, and 800 °C.
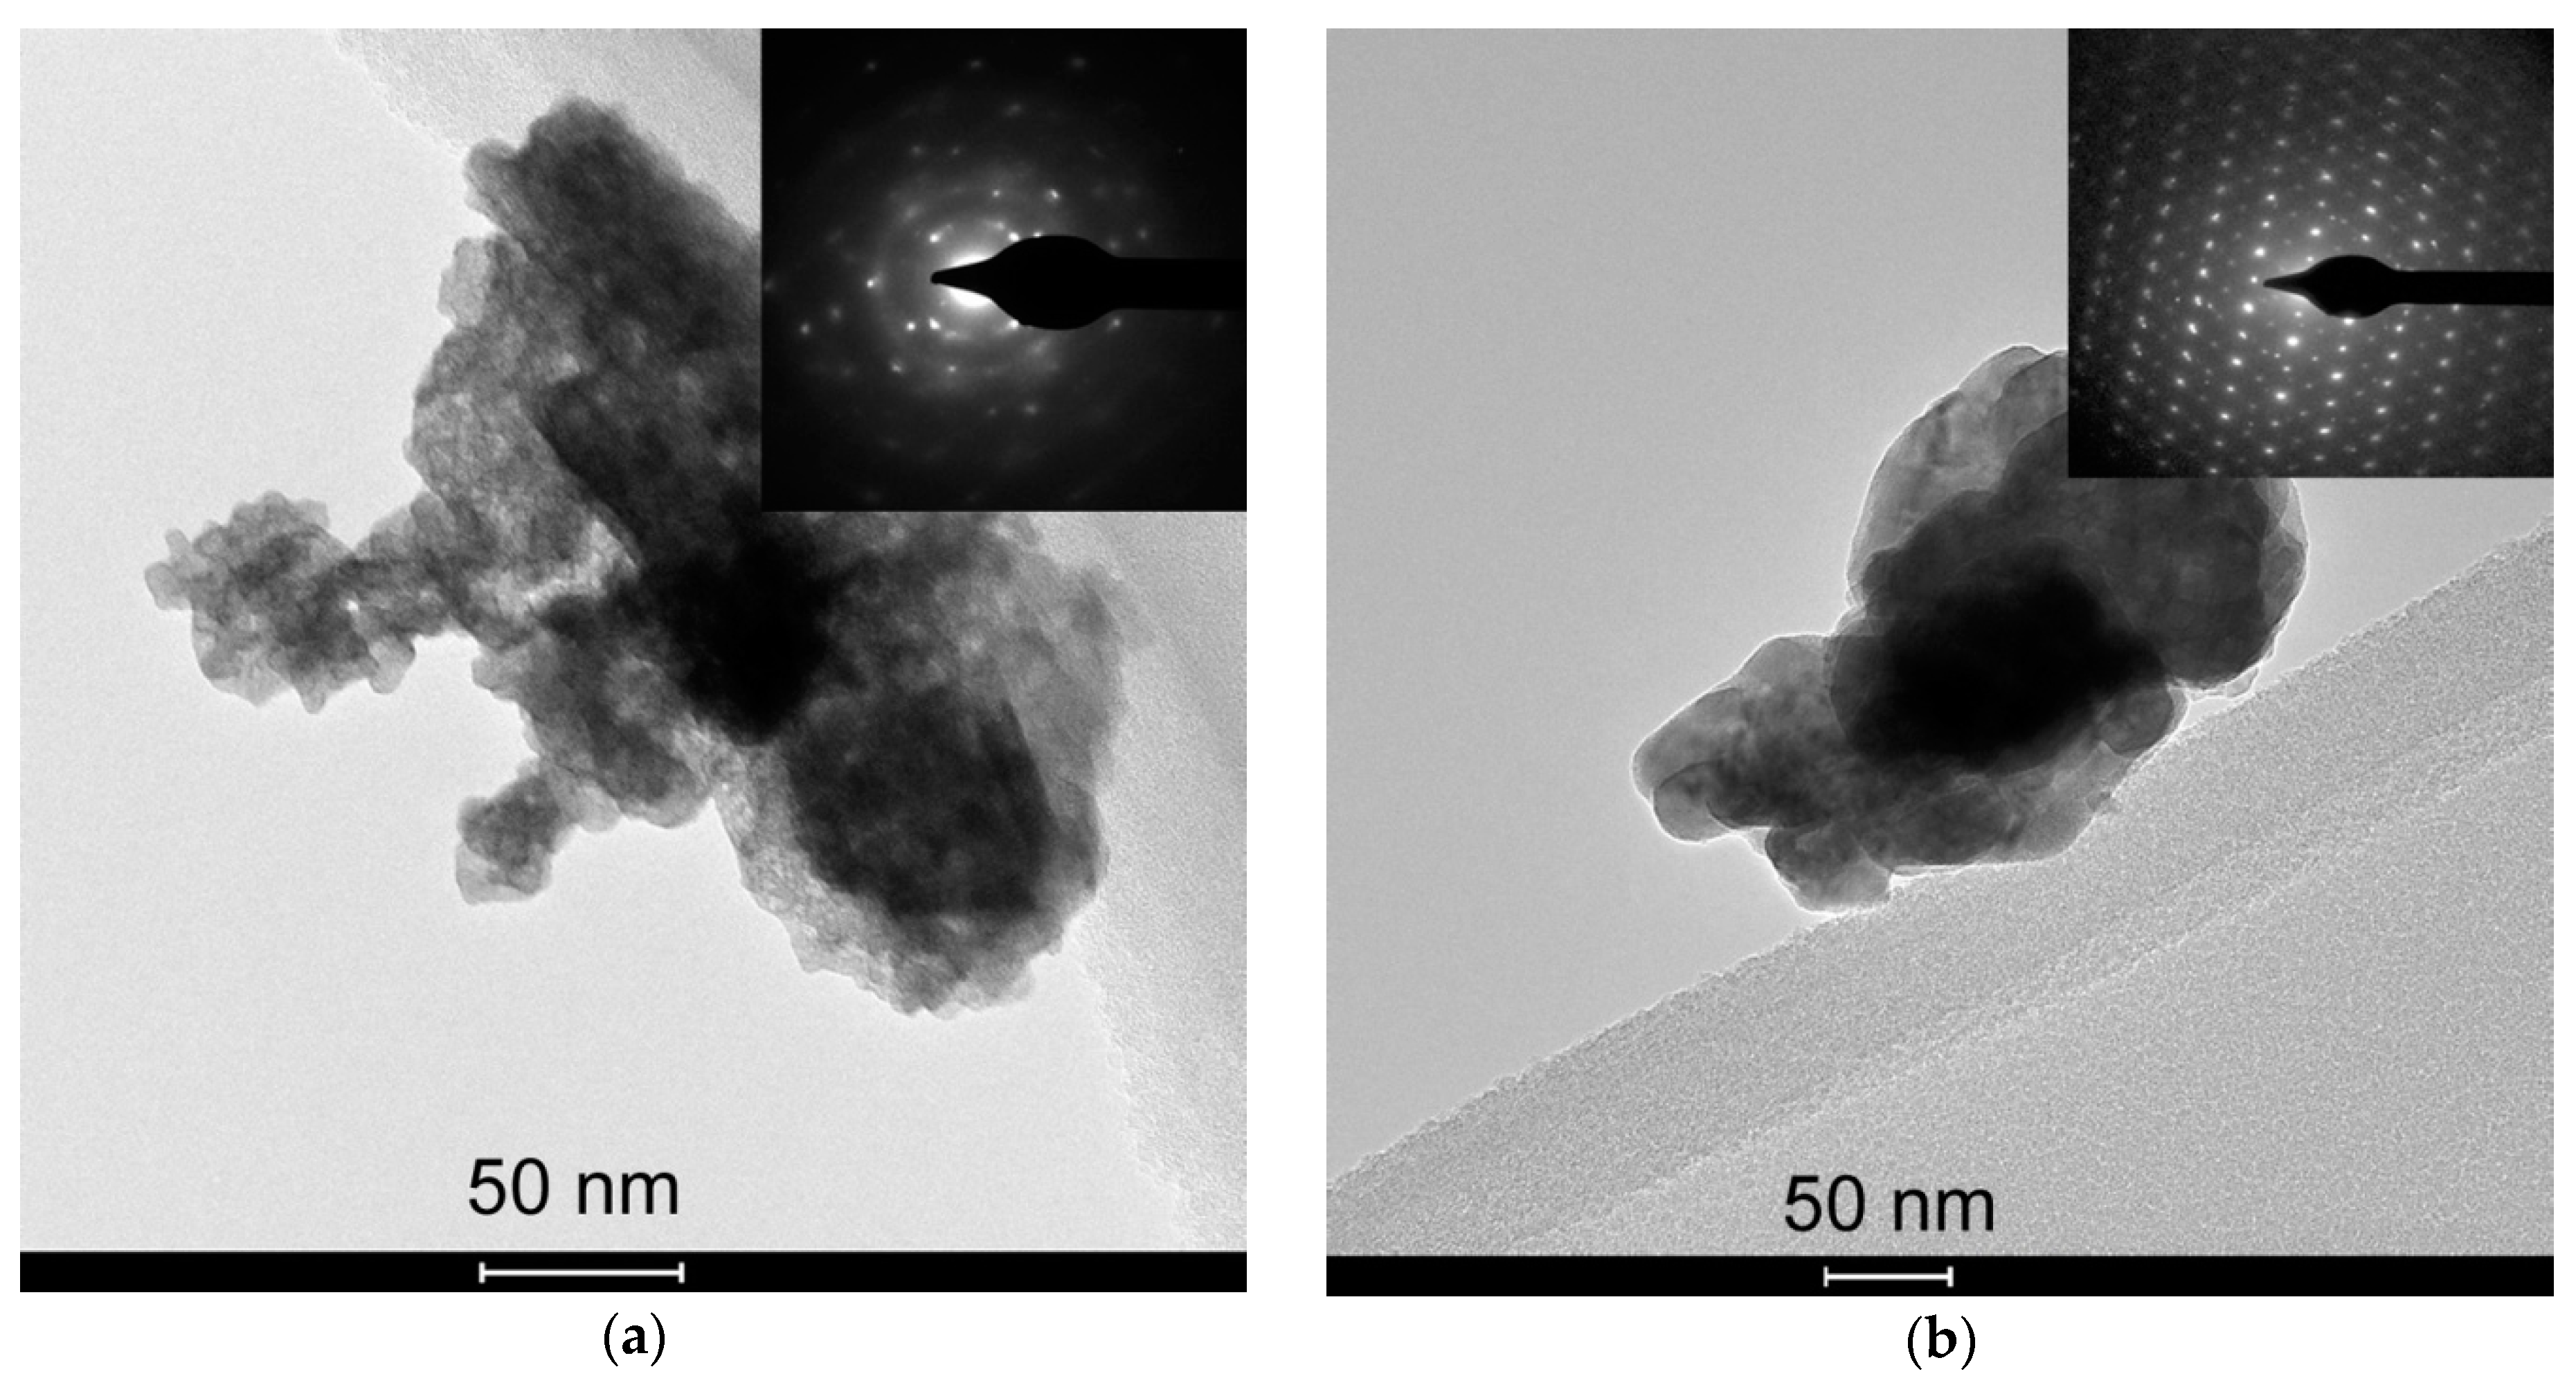
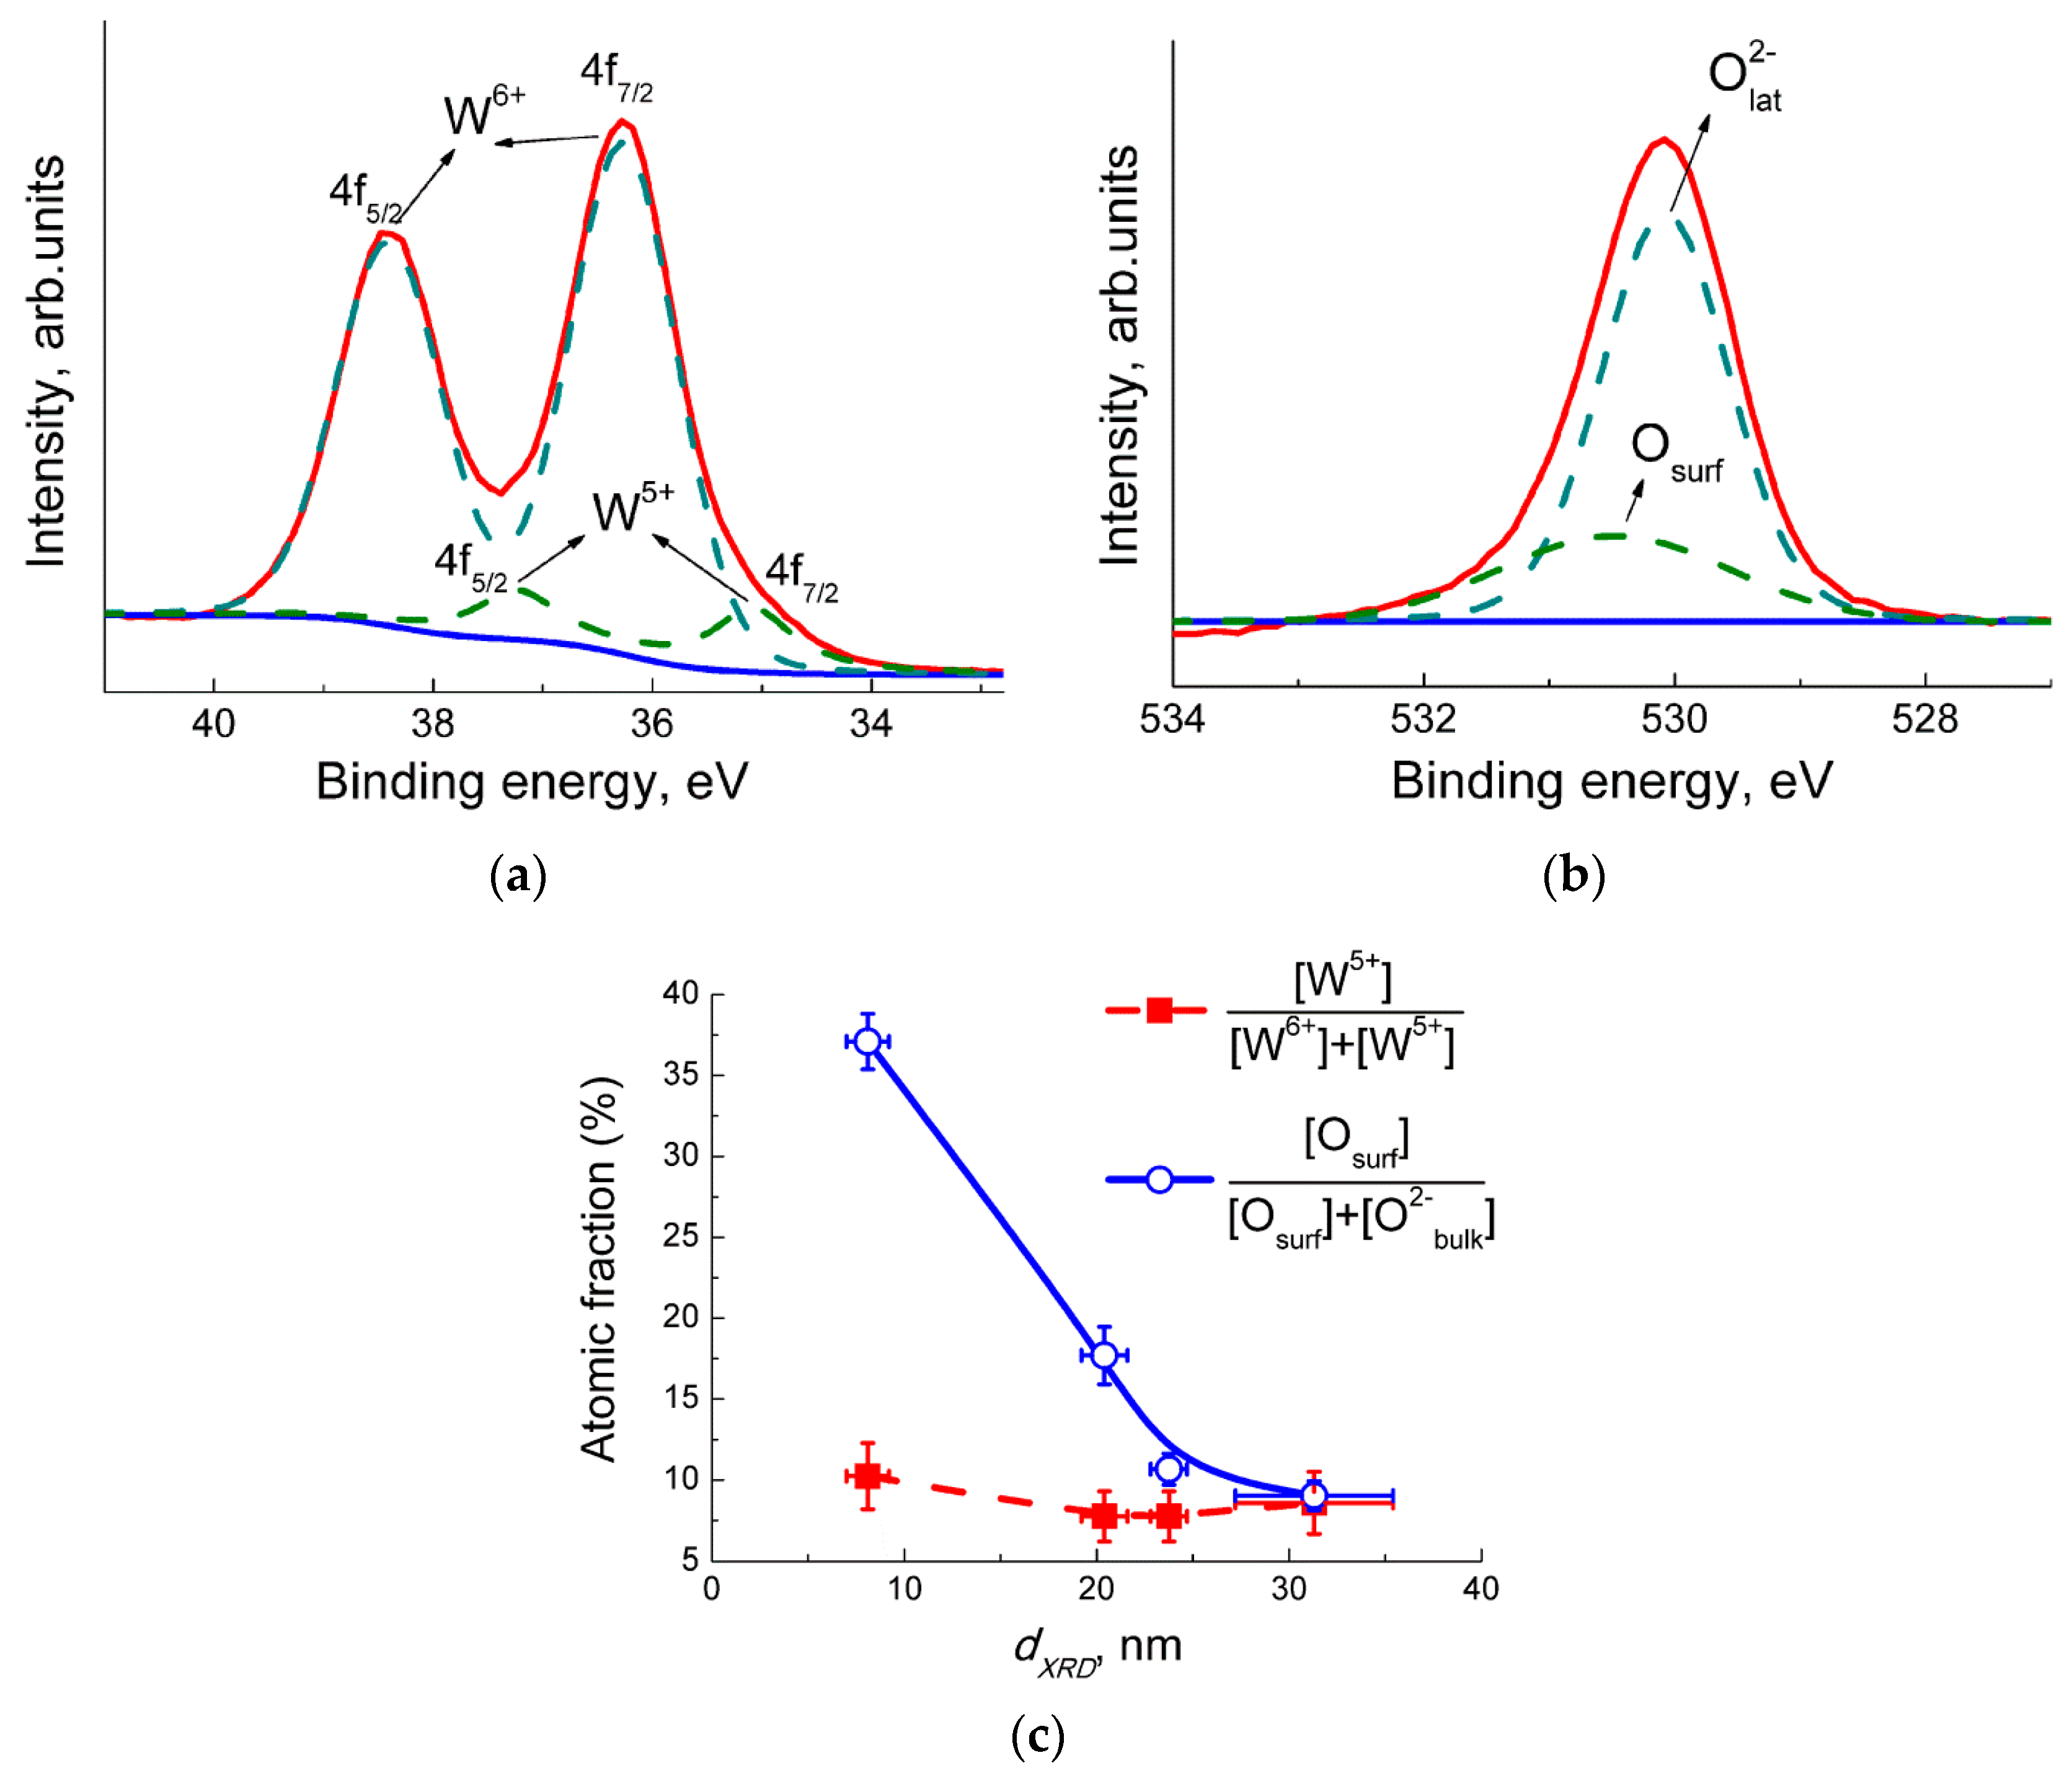
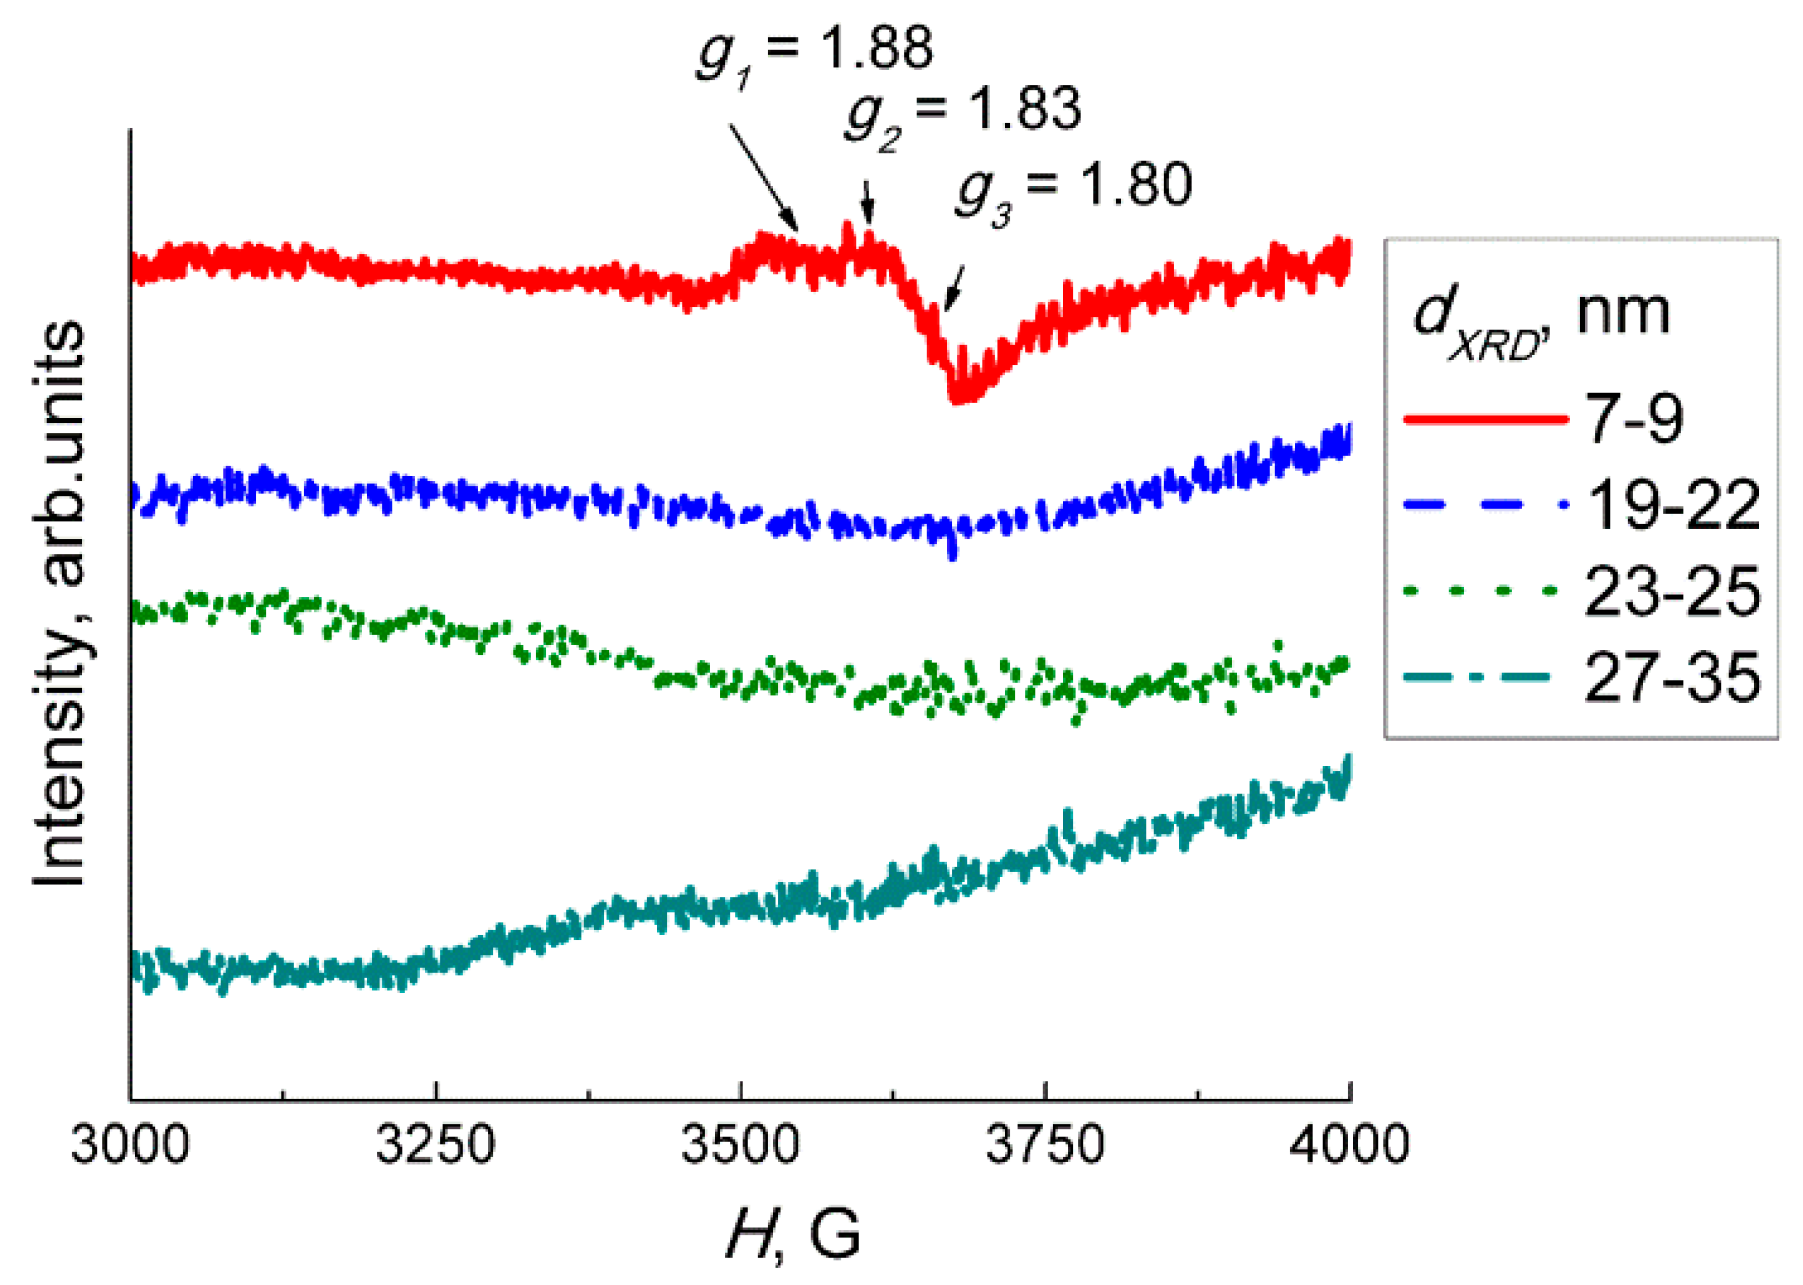
The X−ray powder diffraction (XRD) was measured using a DRON−3M diffractometer, Cu Kα radiation. Grain size was calculated by the Sherrer equation using full width at half maximum of the peaks (002), (020), (200), (022), (220) of monoclinic WO3 phase (ICDD 43−1035). Specific surface area was measured following the nitrogen adsorption Brunauer−Emmett−Teller (BET) method. Single-point measurements at p(N2) = 0.3 atm were performed using the instrument Chemisorb 2750 (Micromeritics). Transmission electron microscopy (TEM) images and electron diffraction (ED) patterns were acquired using a FEI Tecnai G2 microscope operated at 200 kV. The X−ray photoelectron spectra (XPS) were registered with Axis Ultra DLD (Kratos, UK) spectrometer with Al Kα source. Binding energy was calibrated by C 1s signal at 285.0 eV. The electron paramagnetic resonance (EPR) spectra were recorded at 40 K by the Bruker EPR spectrometer ELEXSYS−580 (X-band, sensitivity is ~1010 spin/G). The values of g-factors and spin center concentrations were calculated using standard samples Mn2+ and CuCl2·2H2O, respectively.
Diffuse reflectance infrared Fourier transformed (DRIFT) spectra were registered by a Frontier (Perkin Elmer) spectrometer with the DiffusIR annex and flow chamber HC900 (Pike Technologies) sealed by a ZnSe window. The DRIFT spectra were registered in the wavenumber range of 1000–4000 cm−1 with a resolution of 4 cm−1 and averaging 30 scans at ambient conditions with automatic H2O/CO2 compensation. The powders (30 mg) were placed in alumina crucibles (5 mm diameter). The DRIFT spectra were registered at room temperature and at 100 °С under an exposure to gas flow (100 mL/min) of NO (20 ppm) or NO2 (2 ppm). Before the spectra collection, the samples were heated under pure air flow at 200 °C for 1.5 h to clean the surface from adsorbed humidity.
To perform the sensor test, the samples were dispersed in terpineol and drop deposited on alumina substrates provided with Pt contacts (size 0.3 × 0.2 mm, gap 0.2 mm) and Pt heaters. The sensors were placed in a PC-controlled 4 sensor electrometer equipped with a flow chamber with a volume of 130 cm3. Sensors were annealed in air at 300 °C for 14 h to remove the binder. The sensing layer had an area of 1 × 0.5 mm2 and a thickness of ~10 μm. The DC resistance was measured at the applied voltage of 1.3 V at a fixed temperature in the range 25–300 °C. The gas flow rate was 100 mL/min. The background and carrier gases were pure air from a pure air generator model “2.0–3.5” (Himelectronica, Moscow, Russia), with impurity concentrations within the limits of 10 ppm H2O, 2 ppm CO2, and 0.1 ppm hydrocarbons. Certified gas mixtures were used as the source of target gas, NO:N2 (101 ± 6 ppm) and NO2:N2 (21 ± 2 ppm) (Linde Gas Rus, Moscow, Russia). The gas flowrates were controlled by mass flow controllers EL−FLOW (Bronkhorst, AK Ruurlo, The Netherlands). The flows of the pure air and the target gas were mixed with each other using the pipelines and fittings (Camozzi, Brescia, Italy). The humidity of the carrier gas was controlled by mixing two air flows with different flowrates, i.e., the dry one from the generator of pure air, and the humid one purged through a bubbler filled by deionized water. All measurements were performed under steady relative humidity values in the range 0–100% r.h. (room temperature), that was verified using a humidity meter IVTM−7K (Eksis, Moscow, Russia).
4. Discussion
In this study, we discuss the interaction routes of NO
2 and NO with the surface of WO
3 inferred from DRIFT spectra, and we propose the possible sensing mechanisms. Both nitrogen oxides behaved as oxidizing gases relative to WO
3 under the following sensing test conditions: concentration of NO
x in air within the range 0.04–10 ppm, temperature in the range 25–300 °С, and relative humidity in the range 0–90%. The oxidizing behavior of NO
2 agrees with the higher electron affinity and NO
2/NO
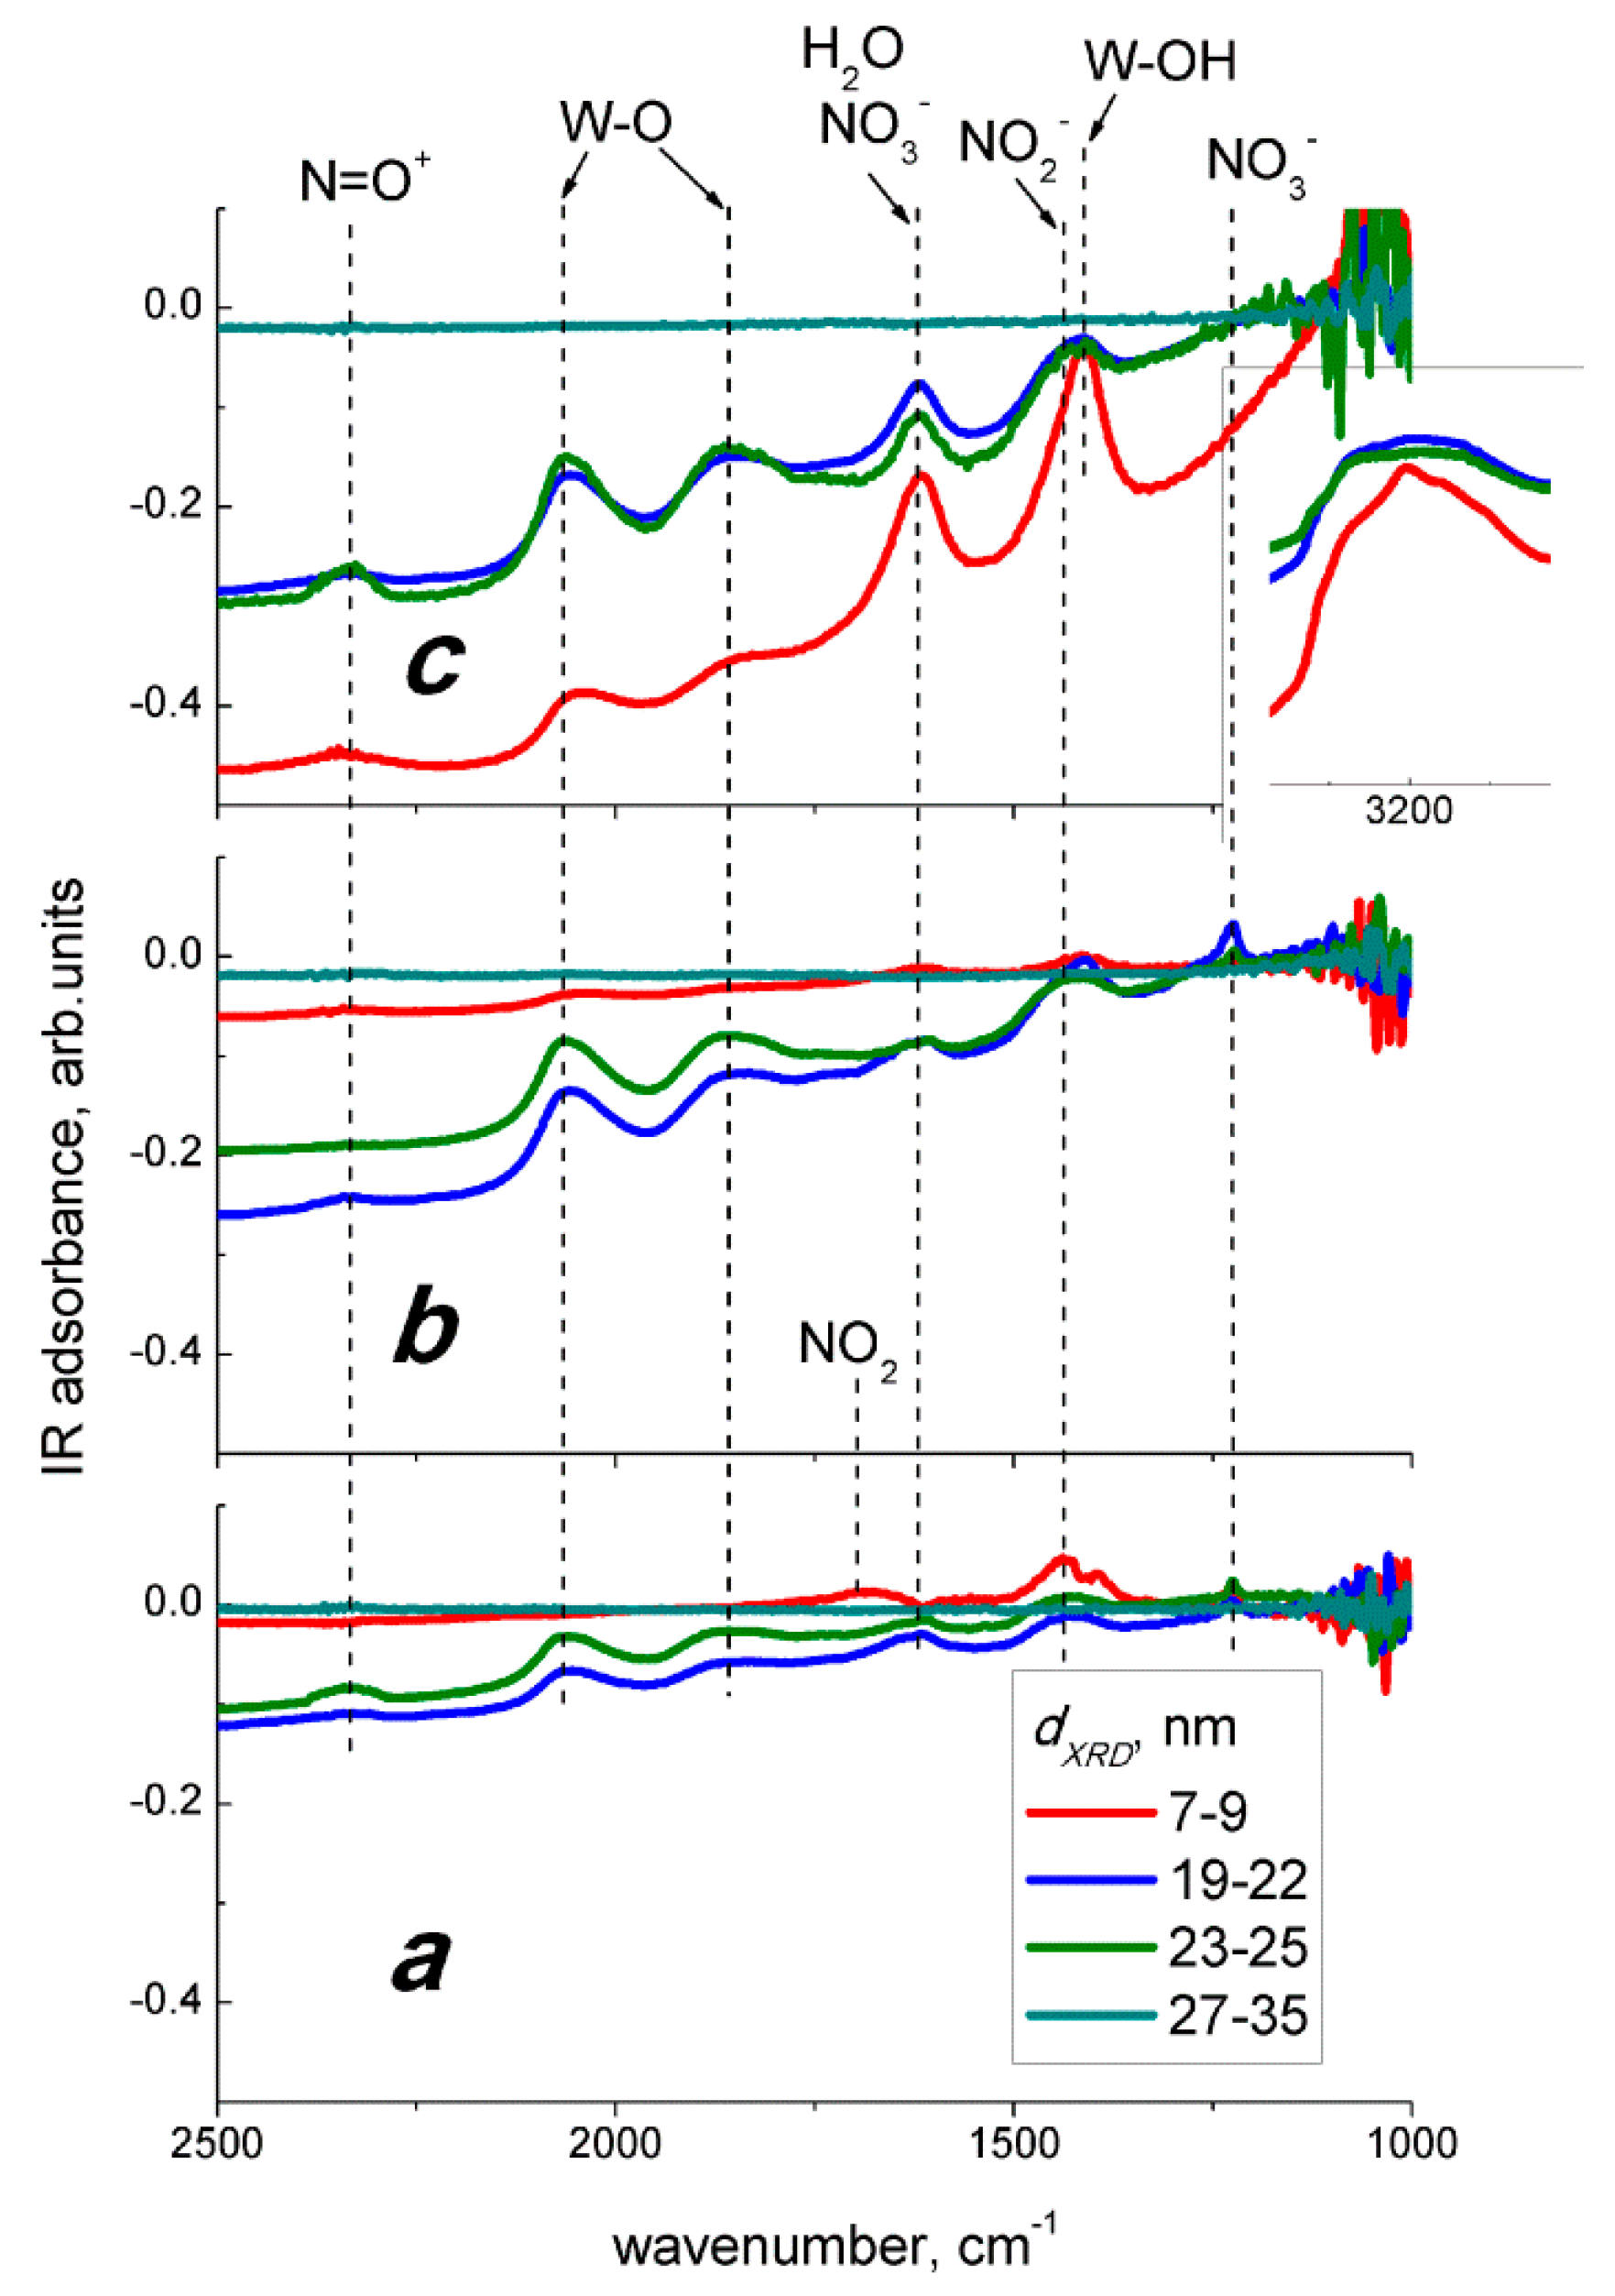
2− redox potential as compared to oxygen (the parameters are given in the Introduction). The surface species observed on DRIFT spectra at room temperature (
Figure 9a) suggest that the adsorption of NO
2 on WO
3 proceeds via the following possible routes:
where,
e− denotes free electron in
n−type WO
3 and may be interpreted as an extra electron associated with W
5+ sites observed by XPS and EPR. The evolution of nitro groups, nitrate species, and surface oxidation of WO
3 on DRIFT spectra registered at 100 °C (
Figure 9b) implied that the interaction with NO
2 under sensing test conditions proceeded via the reaction (Equations (3) and (4)), along with the disproportionation of NO
2 or oxidation of NO
2−:
The interaction of WO
3 with nitrogen dioxide in humid air involved the reactions with NO
2 according to Equations (3)–(6) and the chemisorption of water, as suggested by the peaks observed on DRIFT spectra in
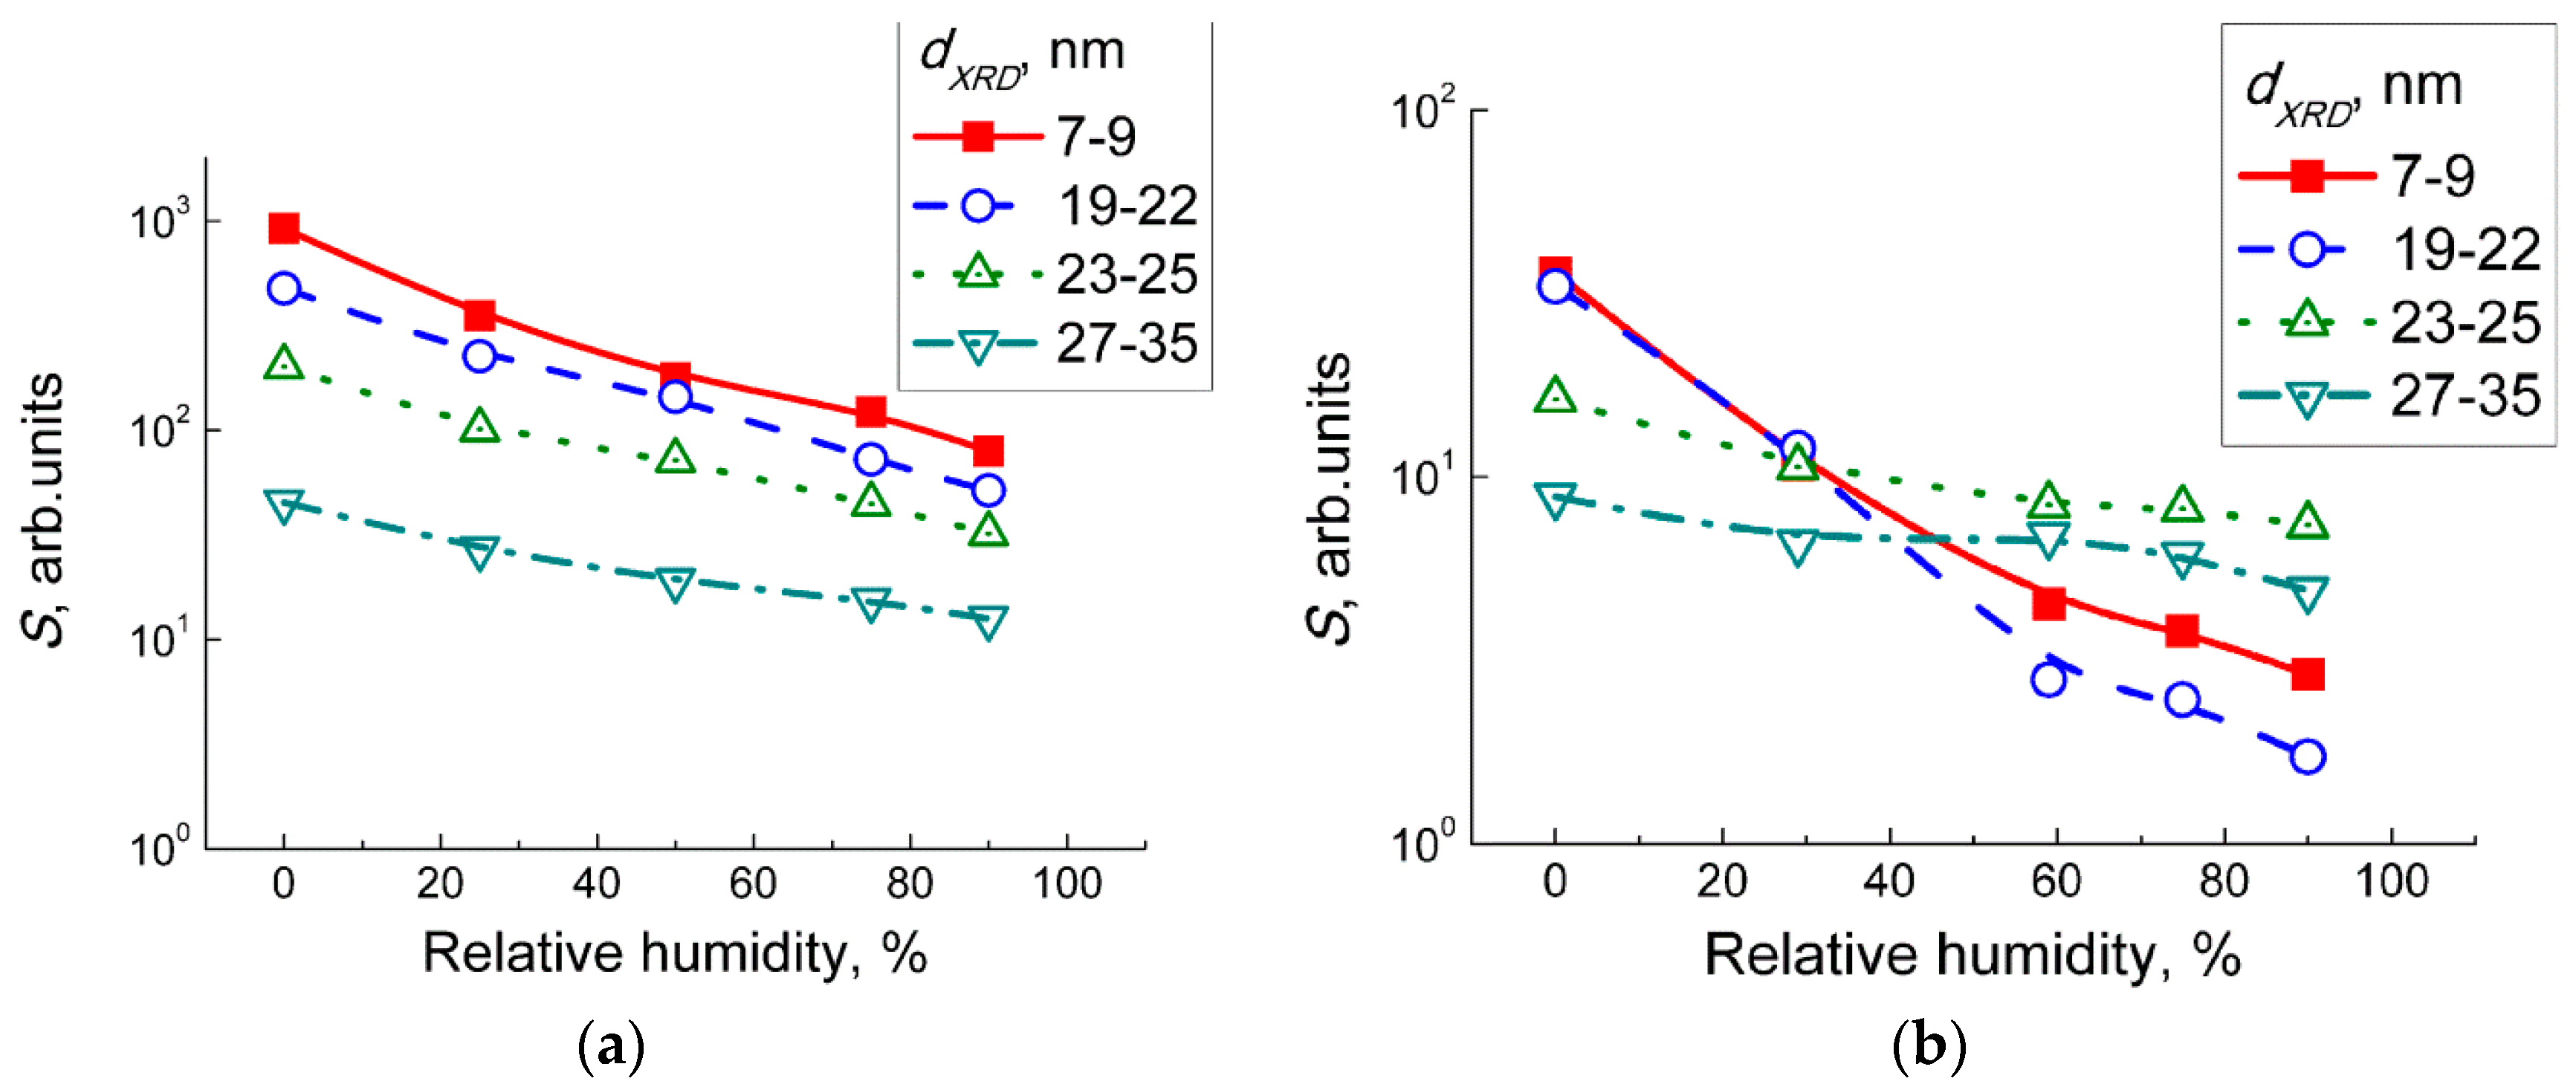
Figure 9c. The fact that the observed peaks intensities were not deteriorated in humid air, accounts for the persistence of WO
3 sensitivity to NO
2 in the wide range of humidity (
Figure 8). The chemisorption of H
2O promoted by the presence of NO
2 is explained by the disproportionation reaction on the surface of WO
3:
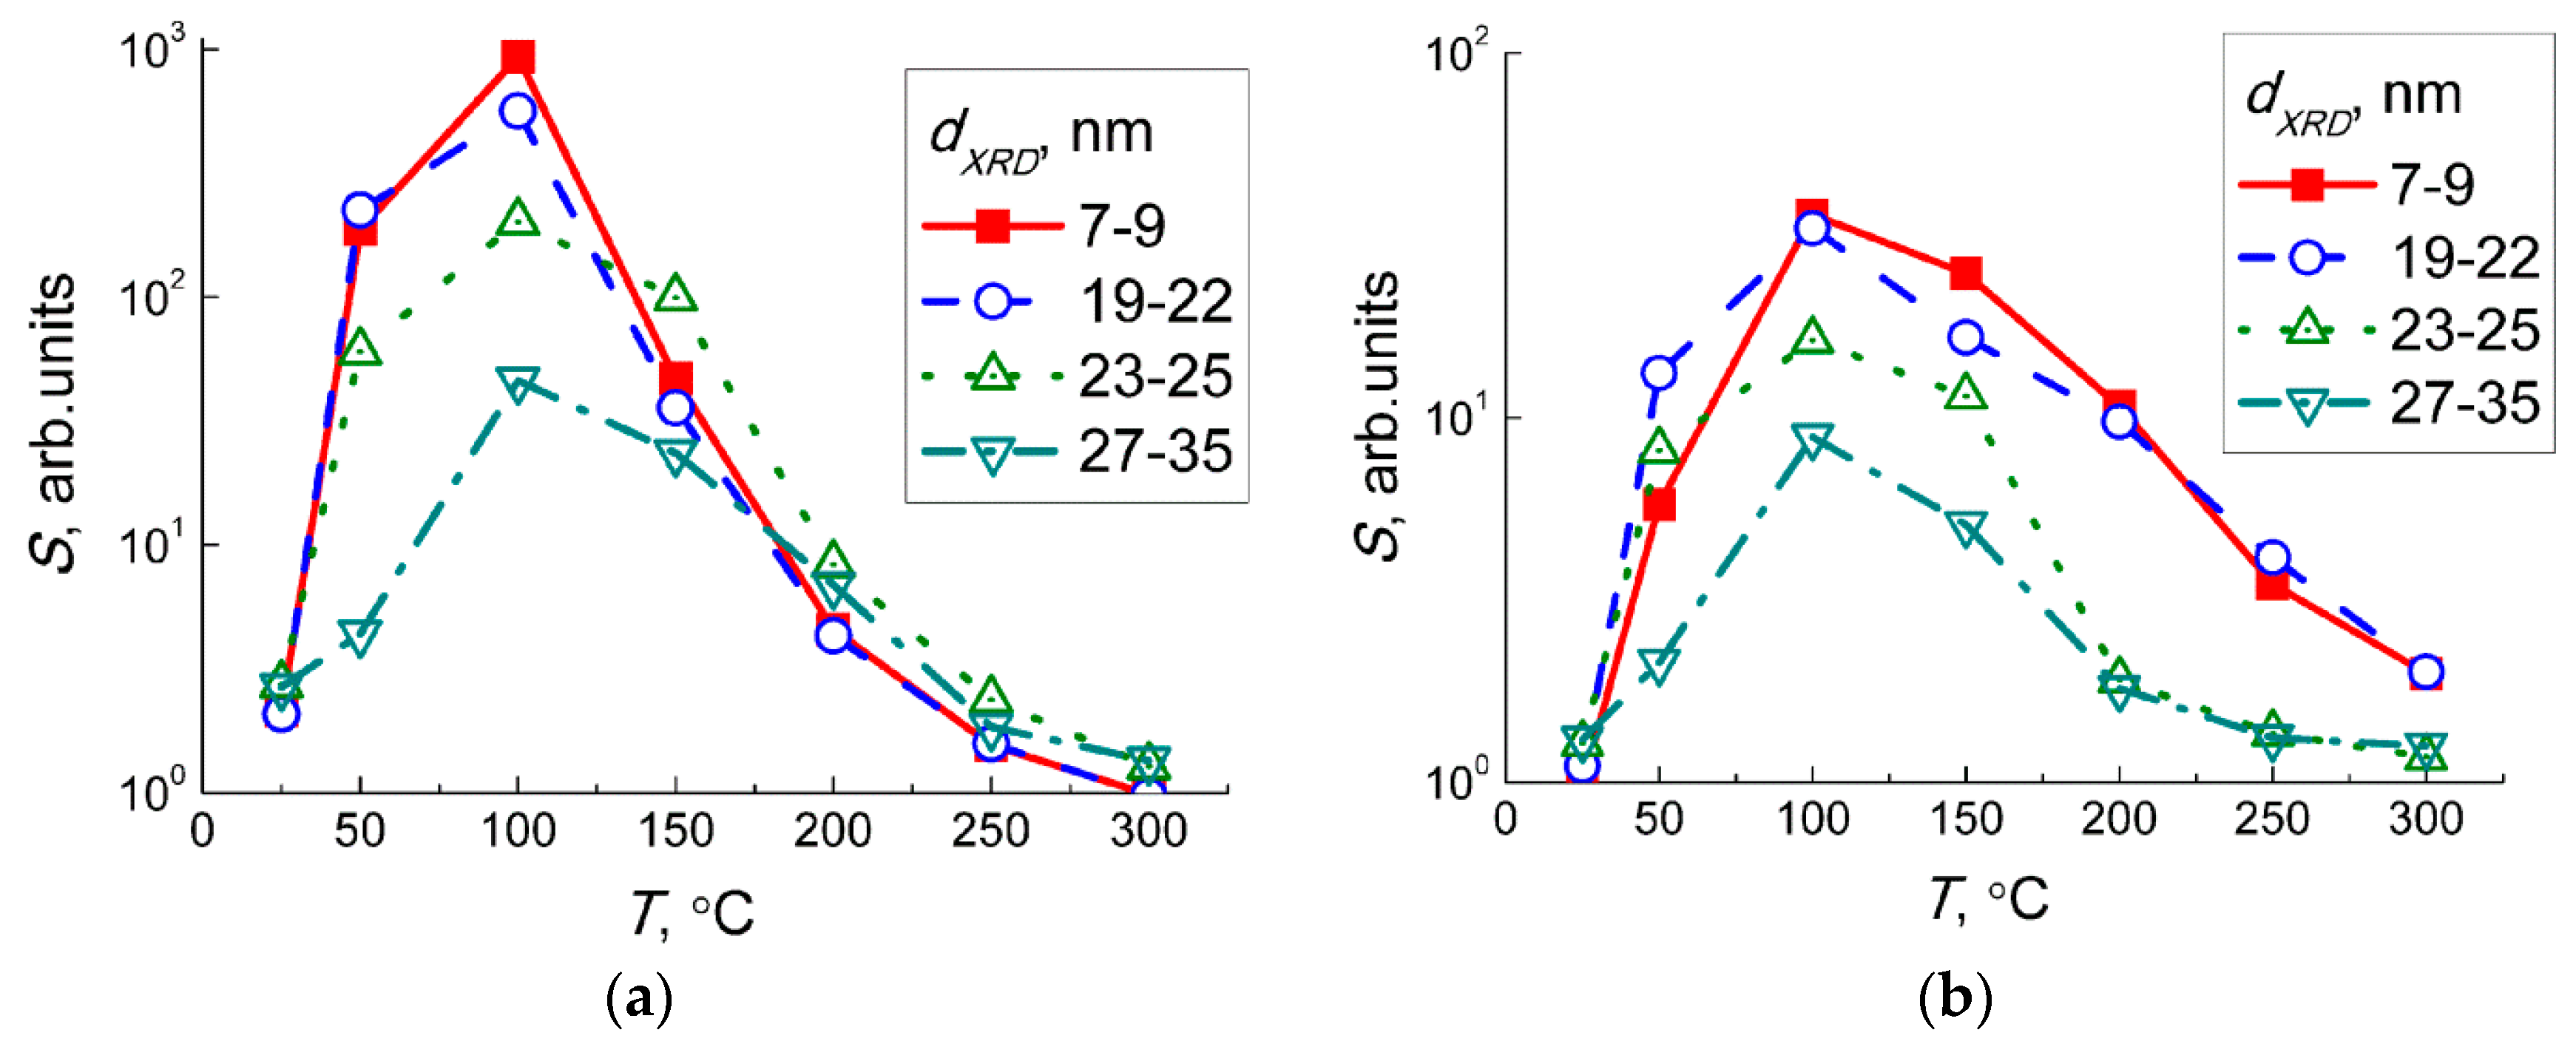
The trend of temperature dependencies of sensor signals to NO
2 (
Figure 7a) and NO (
Figure 7b) coincided, demonstrating maximum sensitivity at about 100 °C. It allows assuming that the sensing mechanisms were similar, or that in both cases the sensor response was due to NO
2. In the case of NO sensing, some concentration of NO
2 can result from the gas-phase reaction when nitric oxide was diluted by air:
Moreover, the sensitivity of WO
3 sensors to 1 ppm NO
2 (
Figure 7a) was one to two orders of magnitude higher than the sensitivity to 5 ppm NO (
Figure 7b). This implies that even traces of NO
2 yielded in the reaction (Equation (2)) could guide the responses of WO
3 sensors exposed to NO + air gas mixture. To check this hypothesis, we analyzed the dependencies of sensor signals on concentrations of target gases at 100 °C (
Figure 6a,b). The sensor signals fitted to a power-law dependent on the concentration of NO
2 (inset in
Figure 6a) and NO (inset in
Figure 6b), which is typical for porous sensing layers based on nanocrystalline
n−type SMOx [
31]. Assuming that the sensor signals to NO were masked by those to incipient NO
2, i.e.,
S(NO) ≈
S(NO
2 from NO oxidation), we estimated the concentration of NO
2 in the gas flow of NO + air using the dependence of the sensor signal on NO
2 concentration (inset in
Figure 6a).
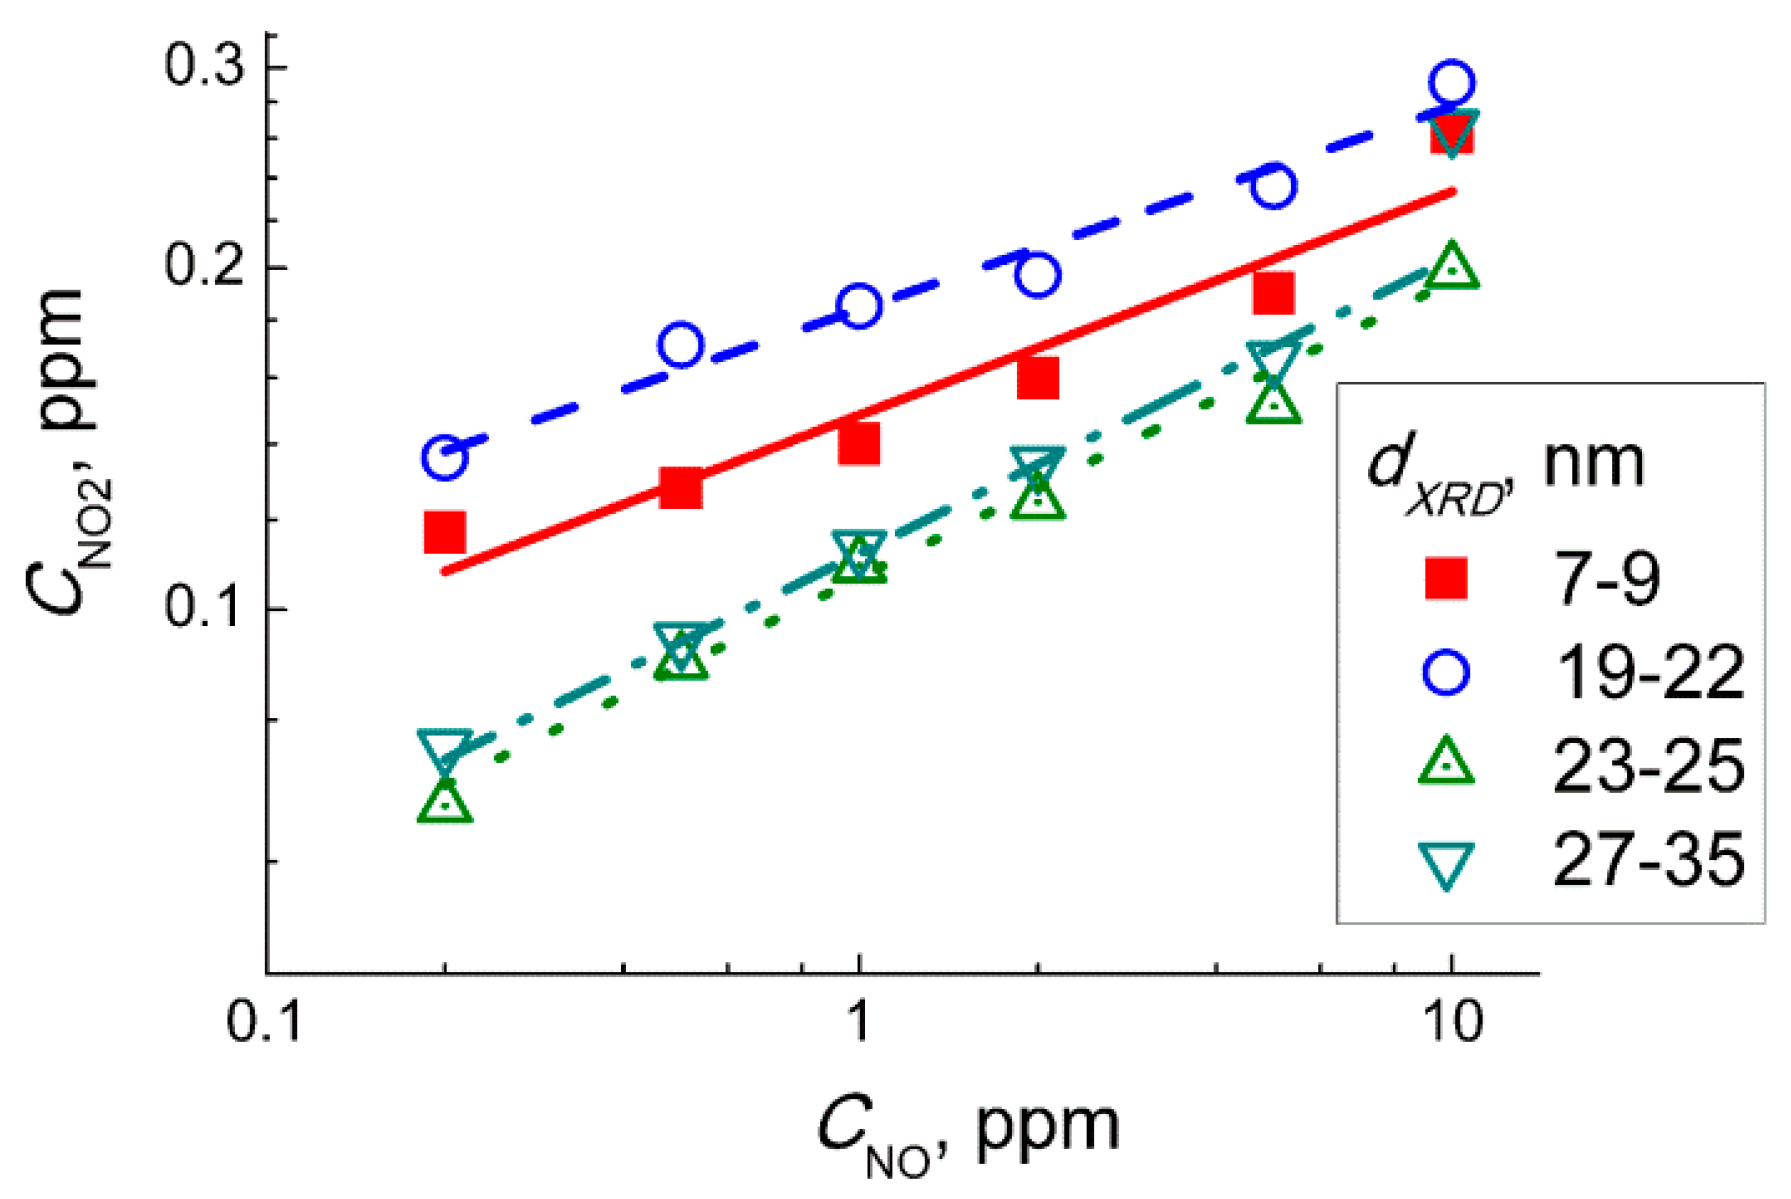
Figure 11 shows the plots of the relationship between the estimated incipient NO
2 concentration and the concentration of NO in the target gas mixtures NO + air. The plots could be linearized in the logarithmic axes implying the relation:
The power α in Equation (9) was in the range α = 0.18–0.22 for WO
3 sensors with different particle size. However, Equation (2) is of the second order by NO concentration [
32], according to mass action law:
Hence, at a fixed time period (flowrate of target gas and the volume of measuring setup were constant) the concentration of incipient NO2 should be proportional to square NO concentration (α = 2). Thus, from the inconsistence of experimental and theoretical values of the parameter α, we conclude that the response of WO3 sensors to NO was not controlled by NO2 from the gas-phase oxidation reaction (Equation (8)).
However, the occurrence of NO
2 in gas mixture NO + air due to gas-phase oxidation was evidenced by the similar DRIFT spectral changes observed on exposure to NO
2 (
Figure 9) and NO (
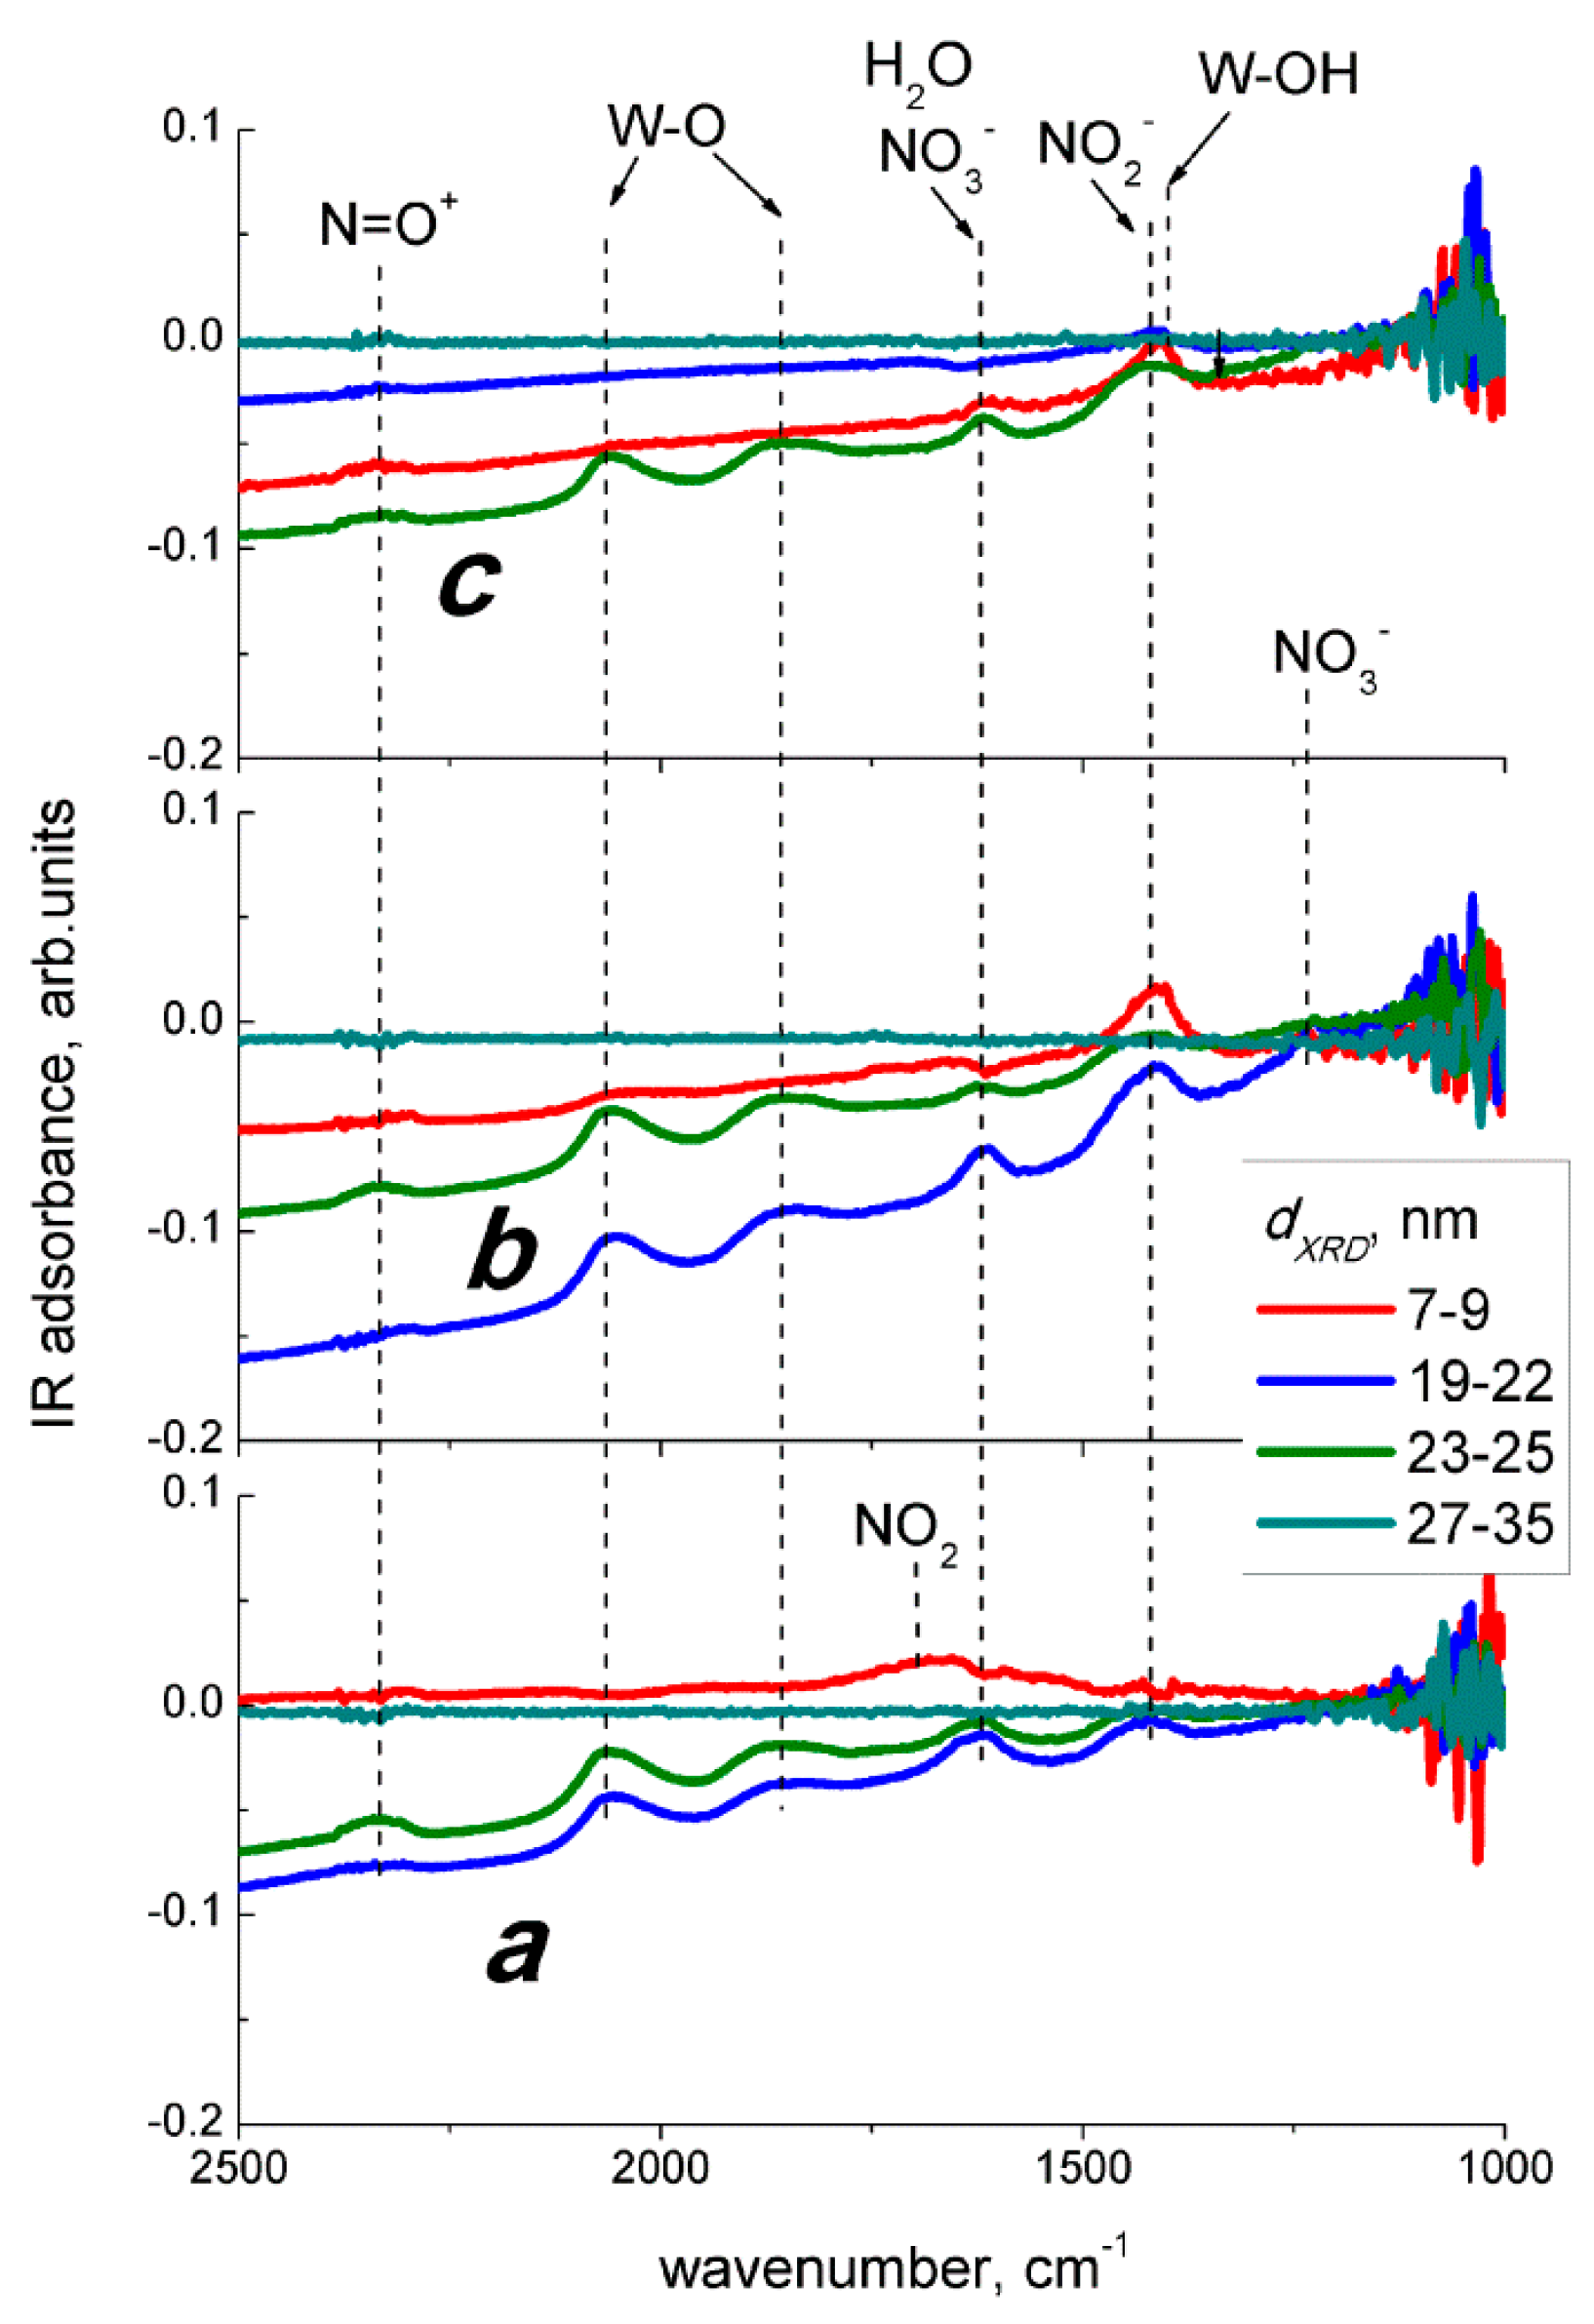
Figure 10). At room temperature, the NO adsorption on WO
3 yielded similar surface species (
Figure 10a), as did the adsorption of NO
2 (
Figure 9a). The DRIFT spectra of WO
3 interacting with NO at 100 °C in dry air (
Figure 10b) resembled those under the exposure to NO
2, except for the case of WO
3 with the smallest particle size (
Figure 9b). It is likely that NO was, to some extent, oxidized in the gas phase, according to Equation (8), and the interaction with resultant NO
2 proceeded as expressed in Equations (2)–(6). The extent of NO conversion to NO
2 could be estimated to the order of 10%, since the evolution of peaks with comparable intensities, as seen in
Figure 9 and
Figure 10, were caused by the reaction with 2 ppm NO
2 and with a 10-fold higher concentration of NO (20 ppm), respectively. Notably, the difference between sensor signals to 5 ppm NO (
Figure 7b) and 1 ppm NO
2 (
Figure 7a) exceeded the order of 10%, which opposes the attribution of NO sensing route to gas-phase oxidation (Equation (8)) followed by the interaction of WO
3 with incipient NO
2 (Equations (2)–(6)). However, the main difference was found for the effect of humidity on the interaction with NO (
Figure 10c). Suppressed evolution of nitro groups and the disappearance of the nitrate species suggest that humidity prevents the adsorption of NO
2 resultant from the gas-phase NO oxidation, when the latter was the main component of the target gas. The contrast to the case of interaction with NO
2 + H
2O may be due to the fact that NO is not an acid-related oxide and it is not reactive to water, as in Equation (7).
Thus, based on DRIFT study in dry air, the interaction of WO
3 with NO might be tangled by the reaction with NO
2 originated from gas−phase NO oxidation in air (Equation (8)). However, the concentrations of NO
2 approximated from the sensor signals mismatch those of NO in air (
Figure 11), and the distinct effects of humidity were found on the DRIFT spectra of WO
3 interacting with two nitrogen oxides. It prevents adjusting the NO sensing route to that of NO
2 (Equations (2)–(6)) preceded by NO oxidation (Equation (8)). To account for the increase of sensors resistance and the evolution of nitro species (NO
2−) in the DRIFT spectra (
Figure 10b,c), we assume that NO sensing is determined by the reaction on the surface of WO
3 as follows:
The further transformations of nitro groups on WO
3 surface could proceed according to Equations (7) and (9) that account for the occurrence of nitrate NO
3− and probably NO
+ species, as well as W-O bond formation when WO
3 was exposed to NO. In humid air, the reaction with NO (Equation (11)) may be deteriorated by the competitive water adsorption, as follows from the decrease of the bands on the oxidized nitrogen species and W-O bonds in DRIFT spectra (
Figure 10c). The difference with the gas-phase oxidation (Equation (8)) is that in reaction (Equation (11)) the role of WO
3 surface is significant (adsorption sites, W
5+ donor sites), and instead of gaseous O
2 it can involve chemisorbed oxygen. In such a case, the sensing route of NO can be subtly dependent on the bulk and surface properties of a solid and on the sensing test conditions. This can account for the disagreement between the proposed sensing routes and even in attributing NO to the oxidizing or reducing gases, when the latter was detected by different SMOx as reported in [
12,
13,
14,
20,
21,
22,
23,
24,
25,
26]. The lower sensitivity of WO
3 sensors to NO, in comparison to NO
2, should therefore be due to distinct initial steps in the sensing routes. In the reaction with NO
2, it was the one-electron reduction (Equation (3)) favored by strong oxidizing activity of nitrogen dioxide and the presence of donor sites in WO
3 (W
5+, oxygen vacancies). The interaction with NO (Equation (11)) is essentially the oxidation of the target gas mediated by oxygen on the surface of WO
3. This should be the main reason for different sensitivity to NO
2 and NO, although the surface species formed in both interaction routes are similar. The overall reaction (Equation (11)) might proceed through different steps. For example, NO reduction to NO
−, as proposed in [
2,
3,
6,
22,
23,
25], but not supported by the presently reported DRIFT study. Hence, the assumingly formed NO
− anions should be immediately oxidized by oxygen to NO
2− and NO
3− species. Further research of nitric oxide adsorption and sensing by tungsten oxide in oxygen-lean and inert media may be valuable to verify the proposed sensing mechanism.

 ,
, 


