Novel Image Processing Method for Detecting Strep Throat (Streptococcal Pharyngitis) Using Smartphone


Abstract
1. Introduction
2. Materials and Methods
2.1. Data Acquisition
2.2. Preprocessing
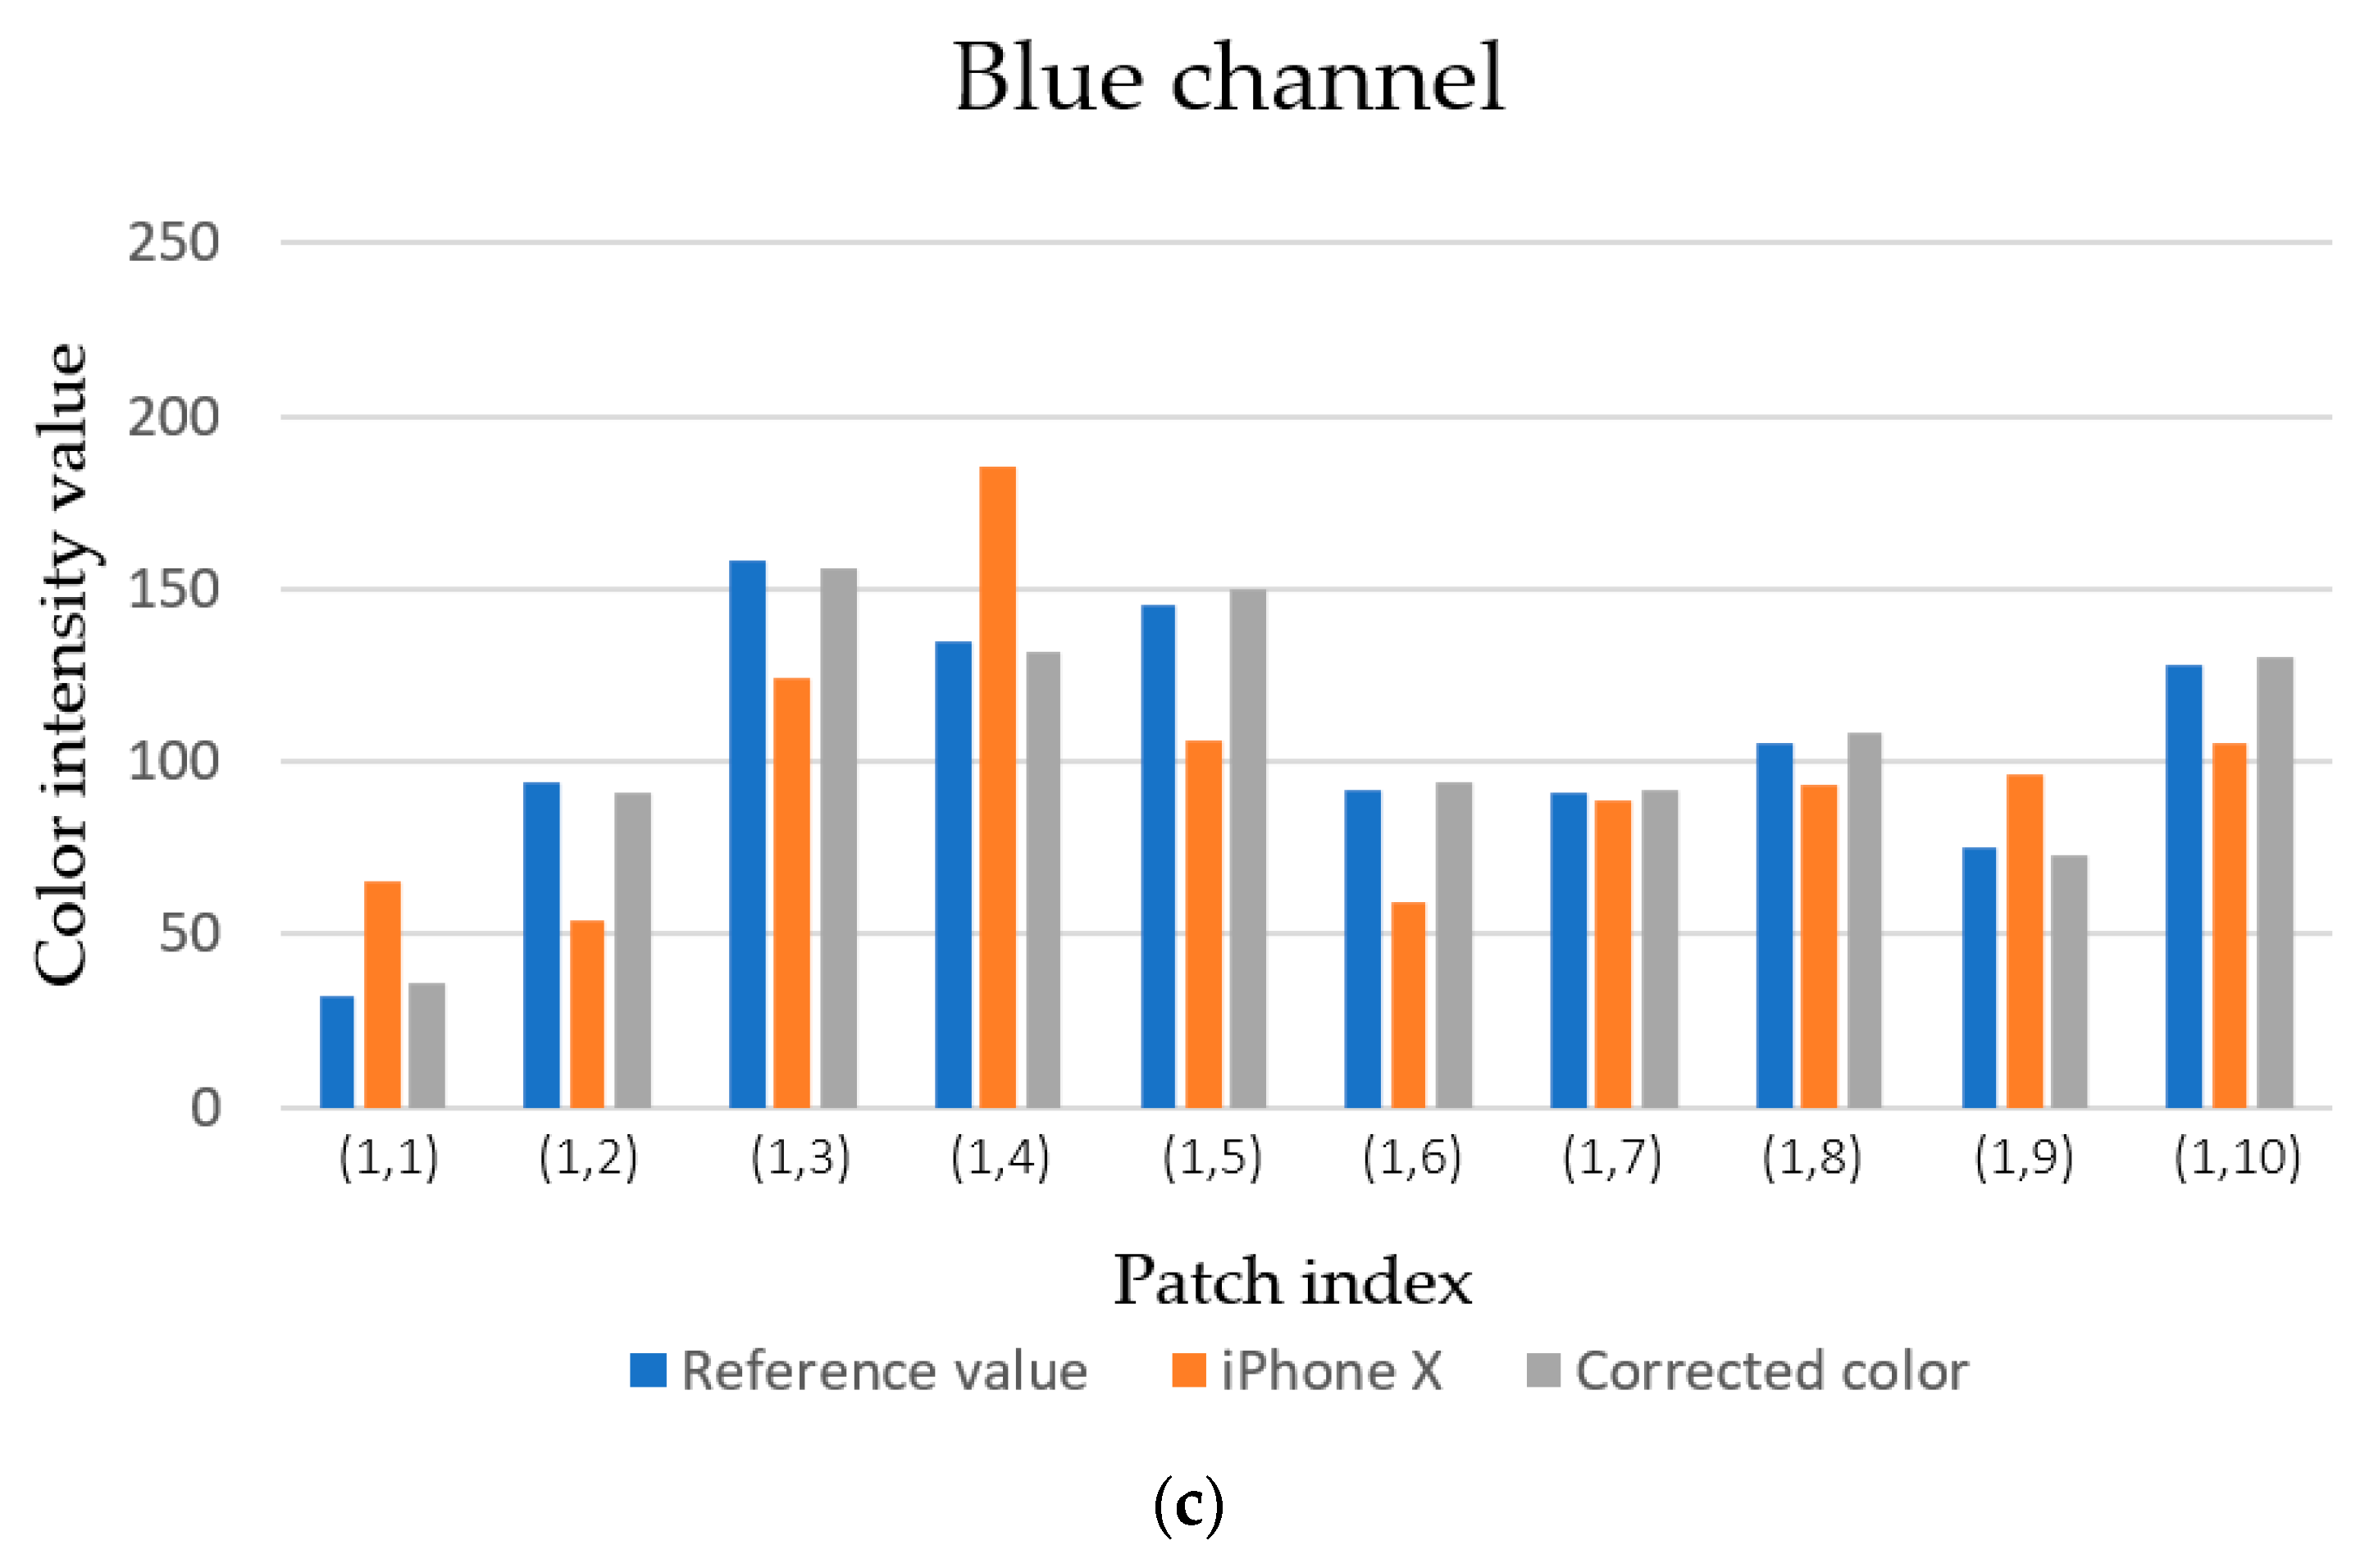
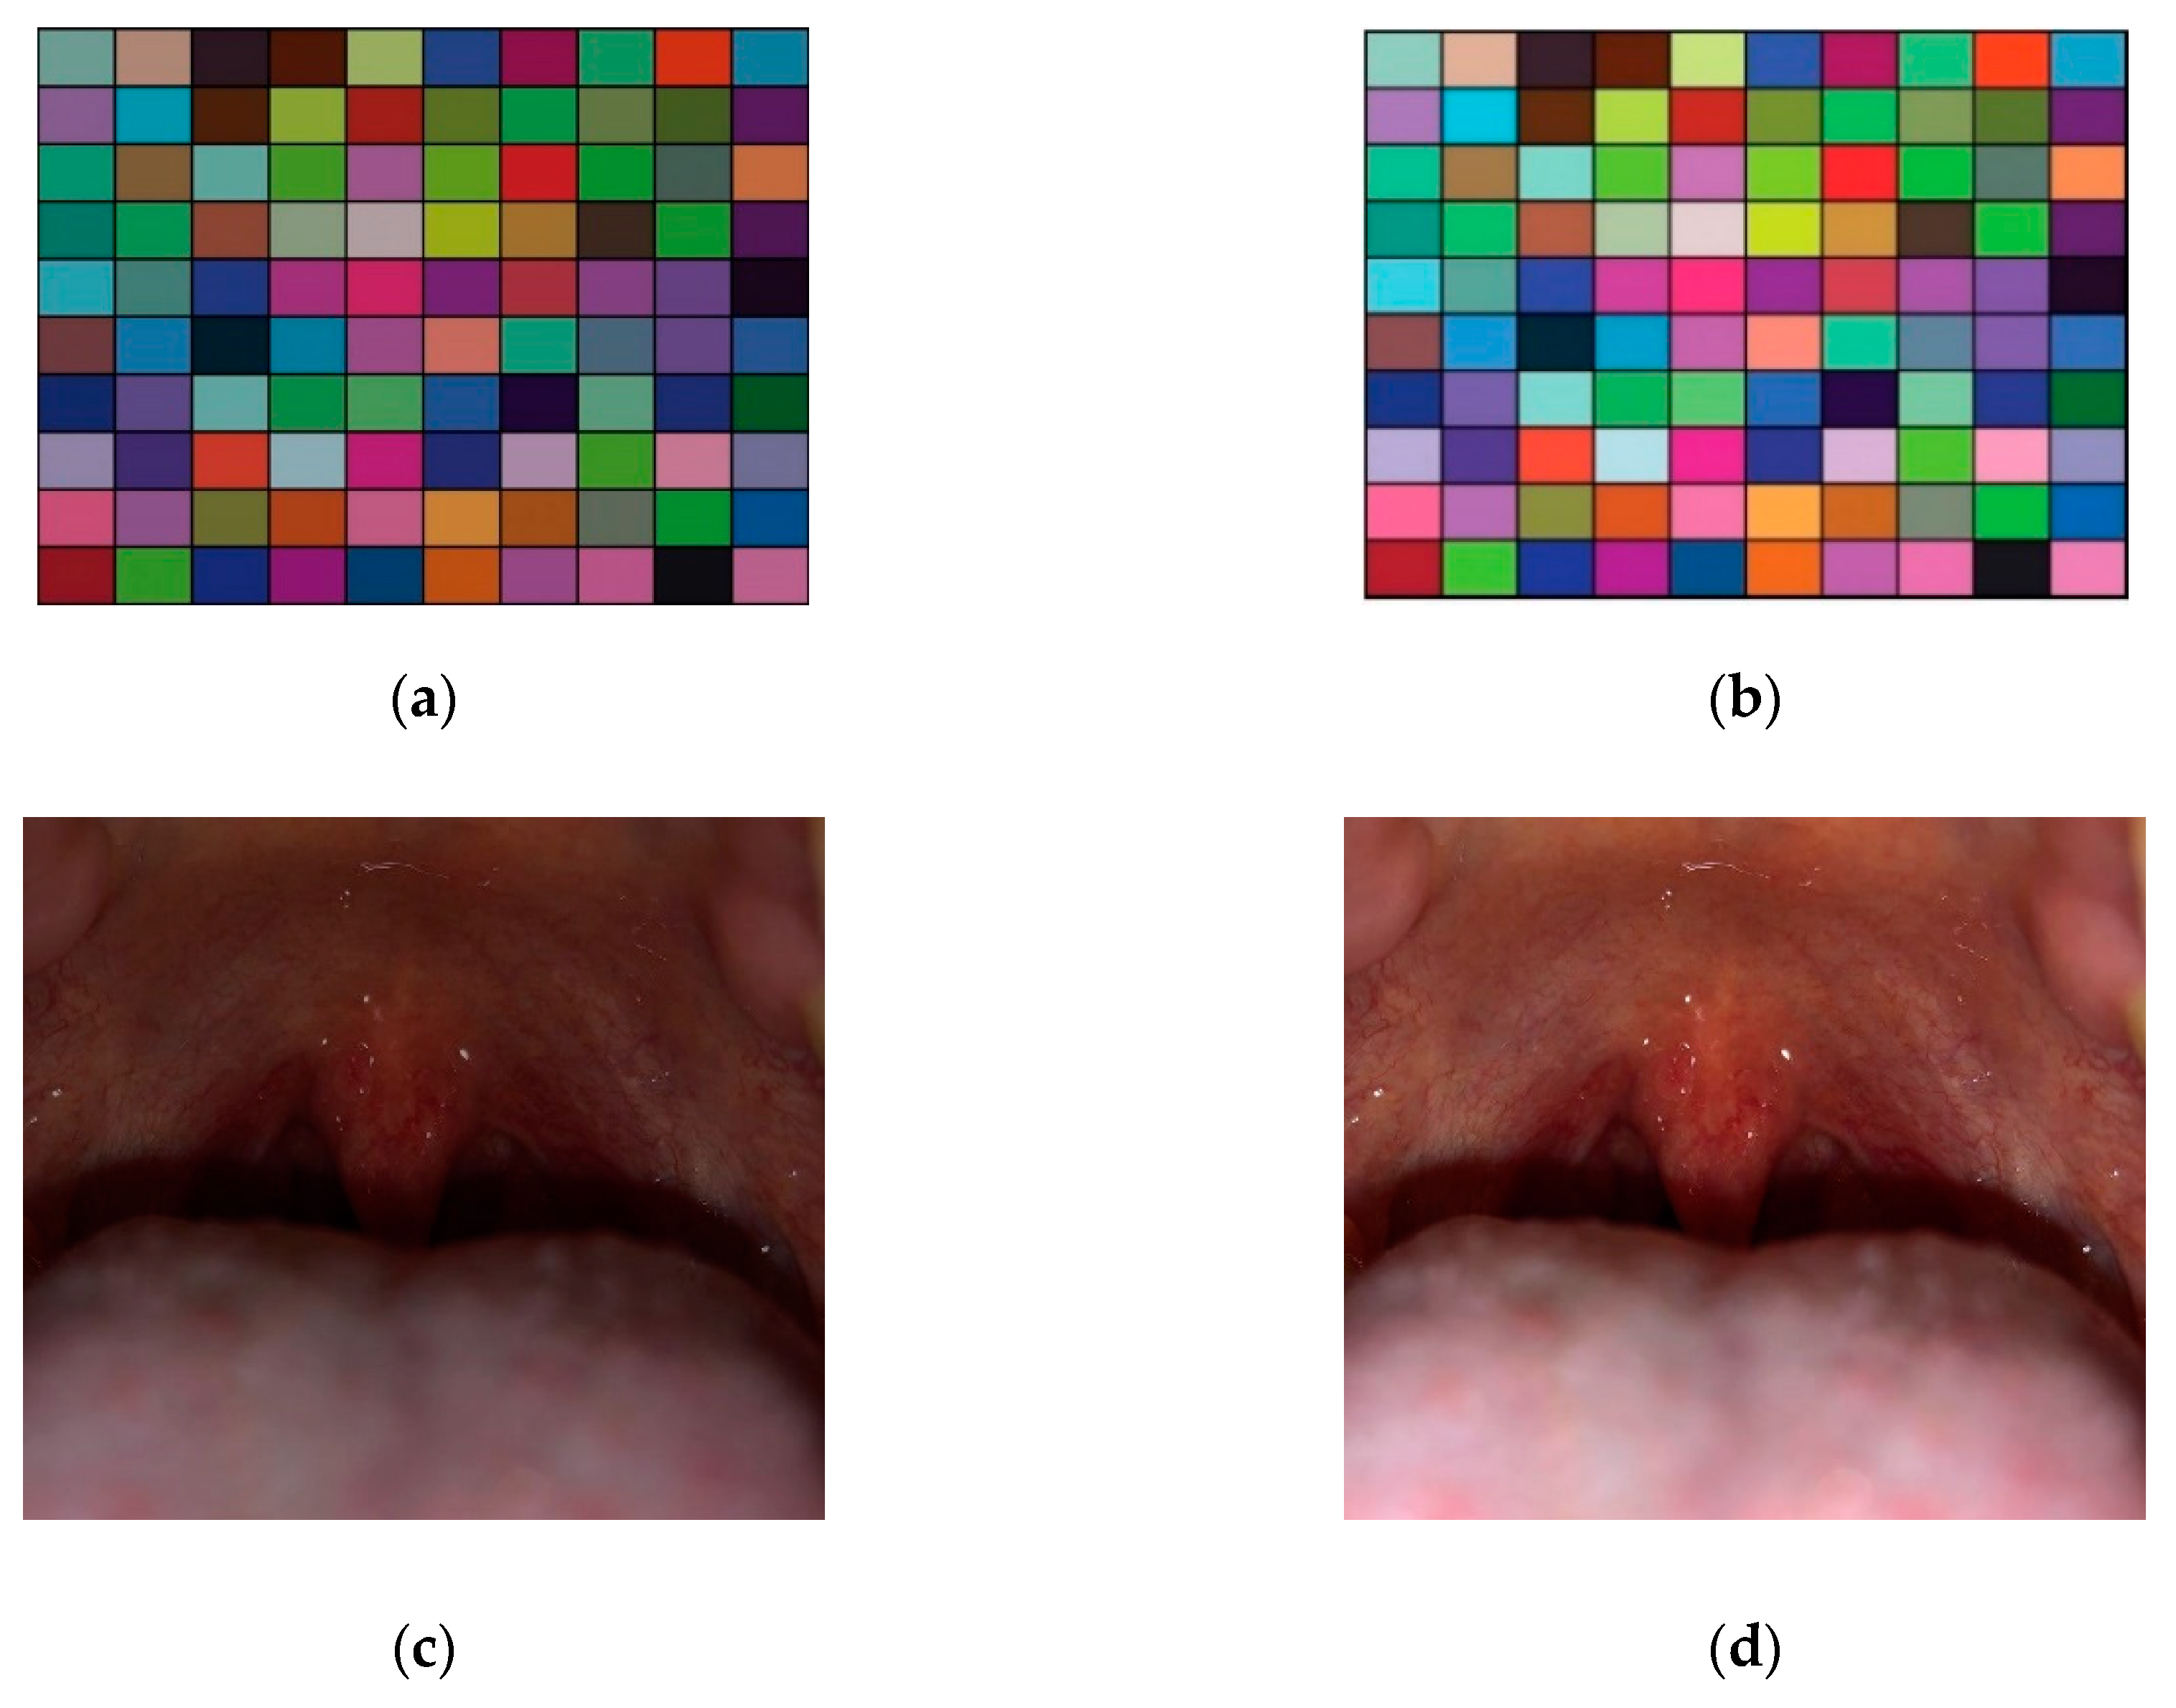
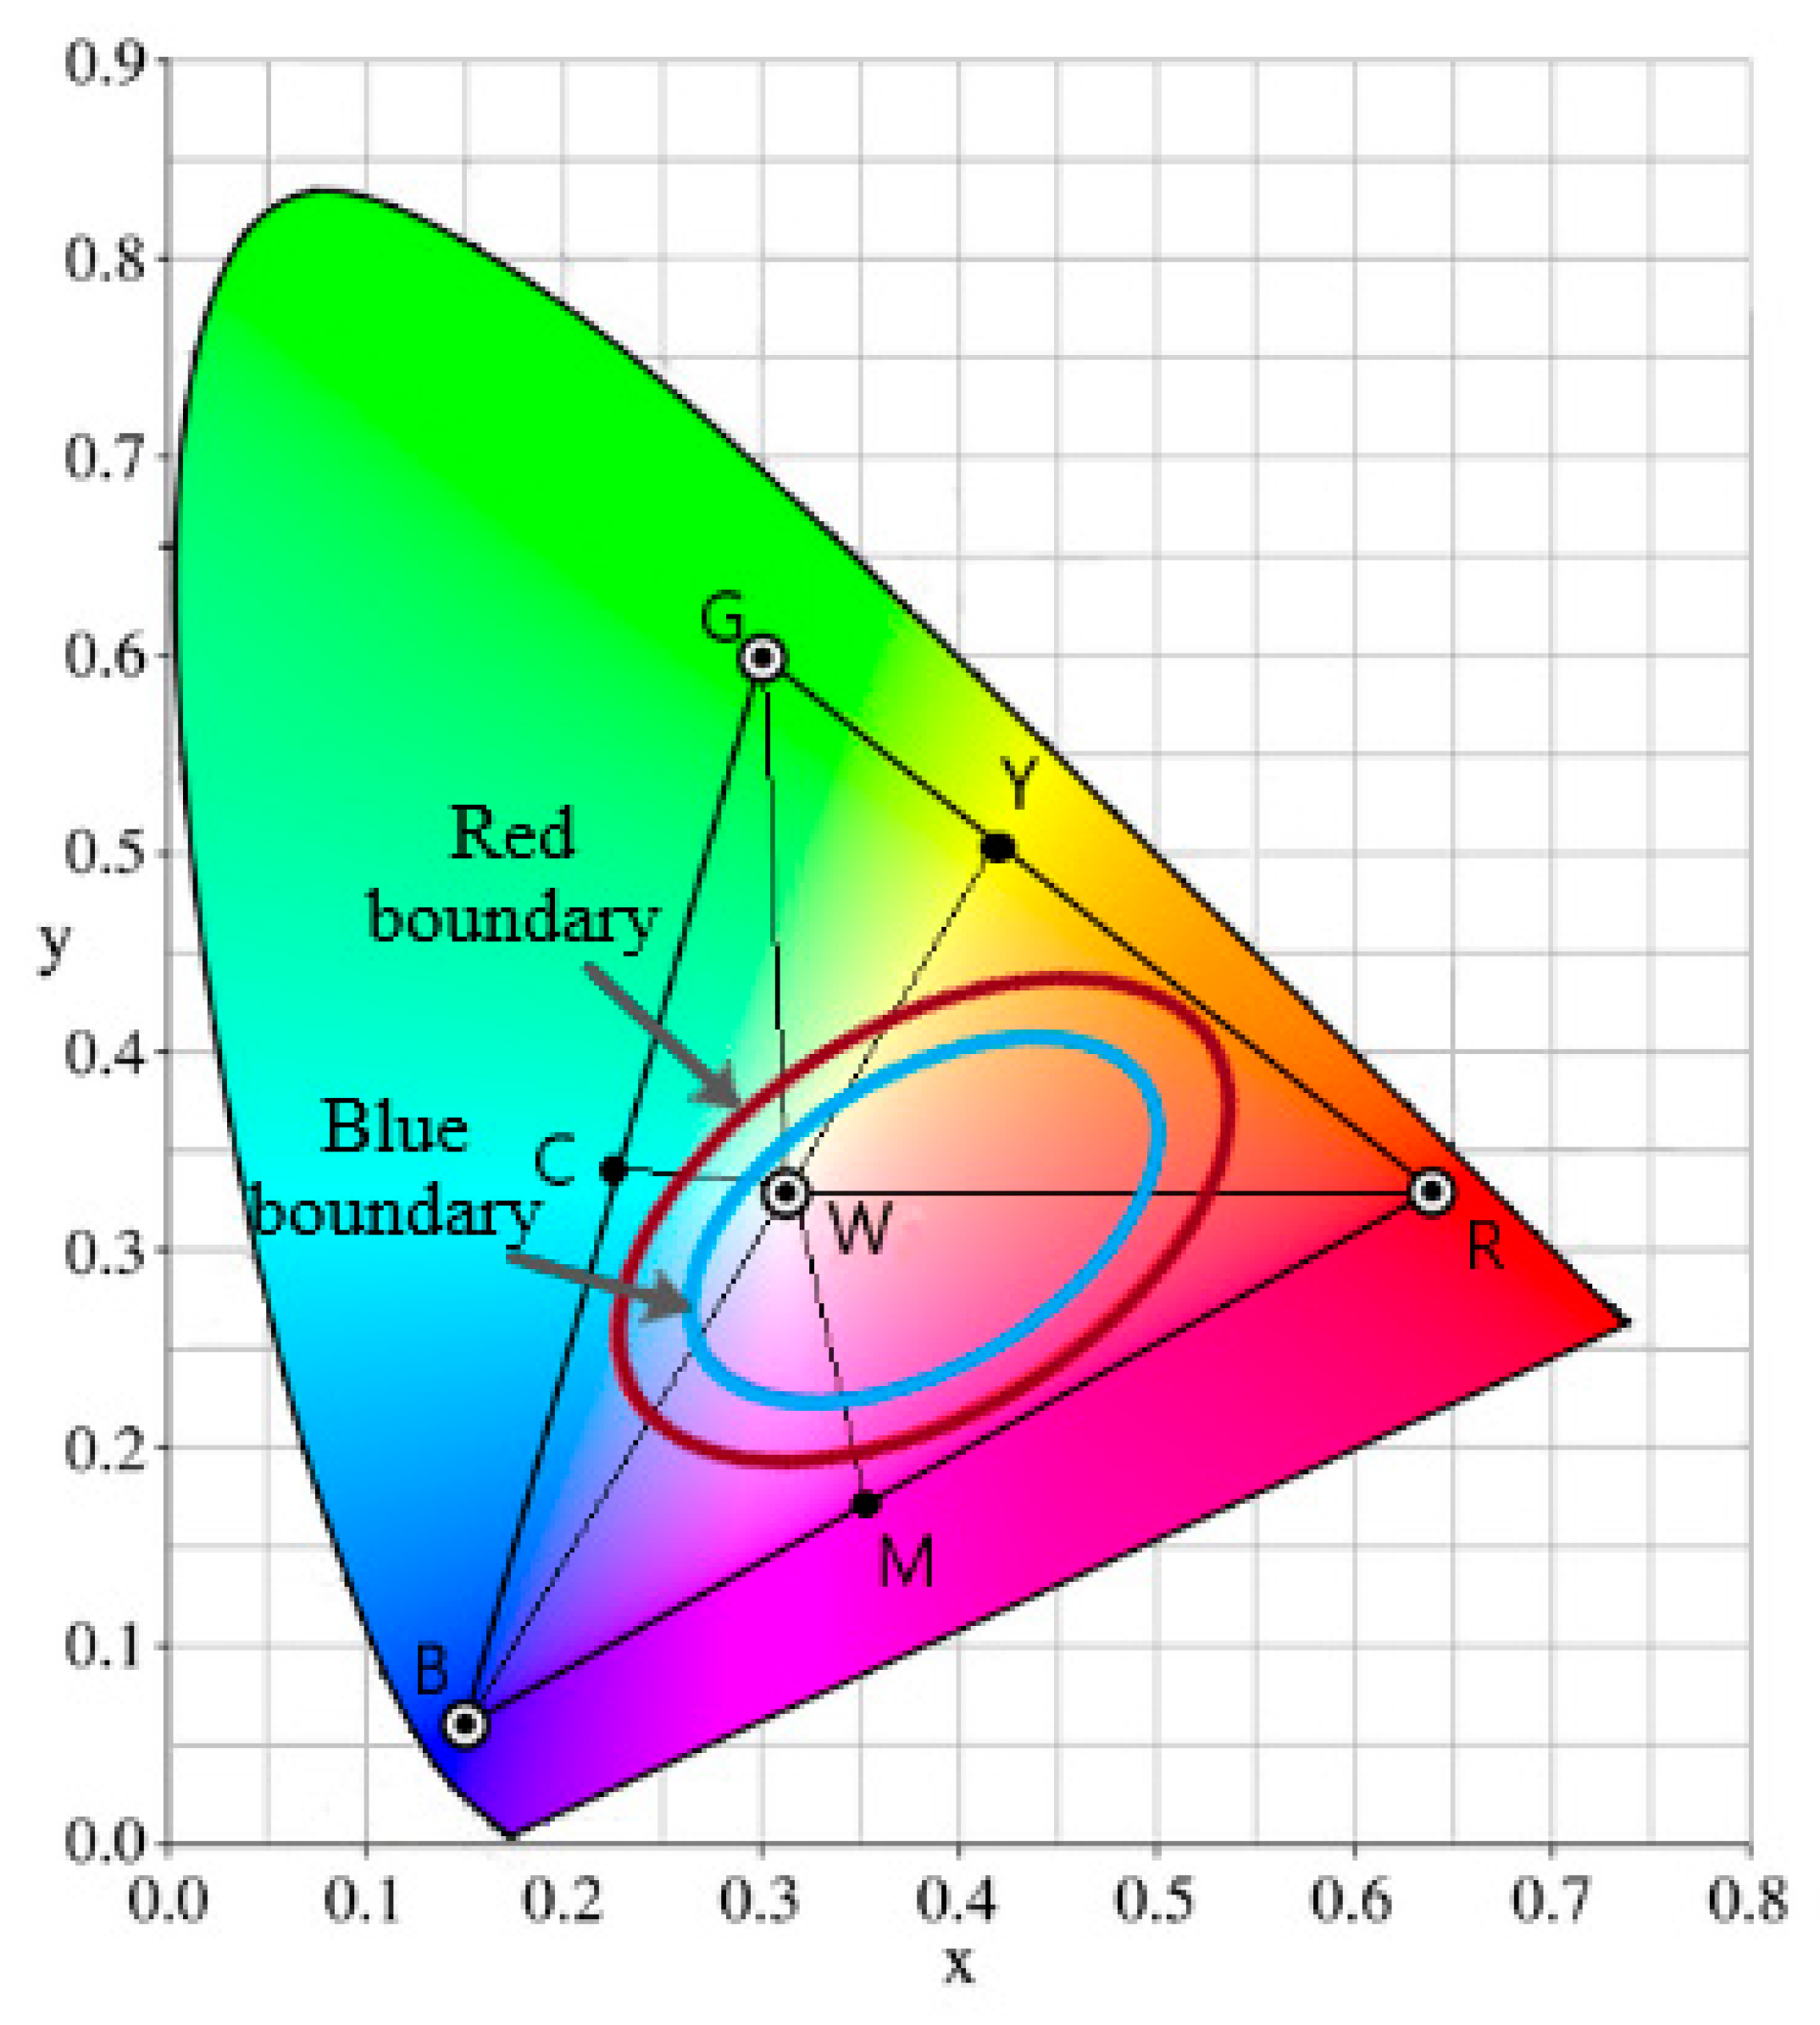
2.2.1. Color Correction
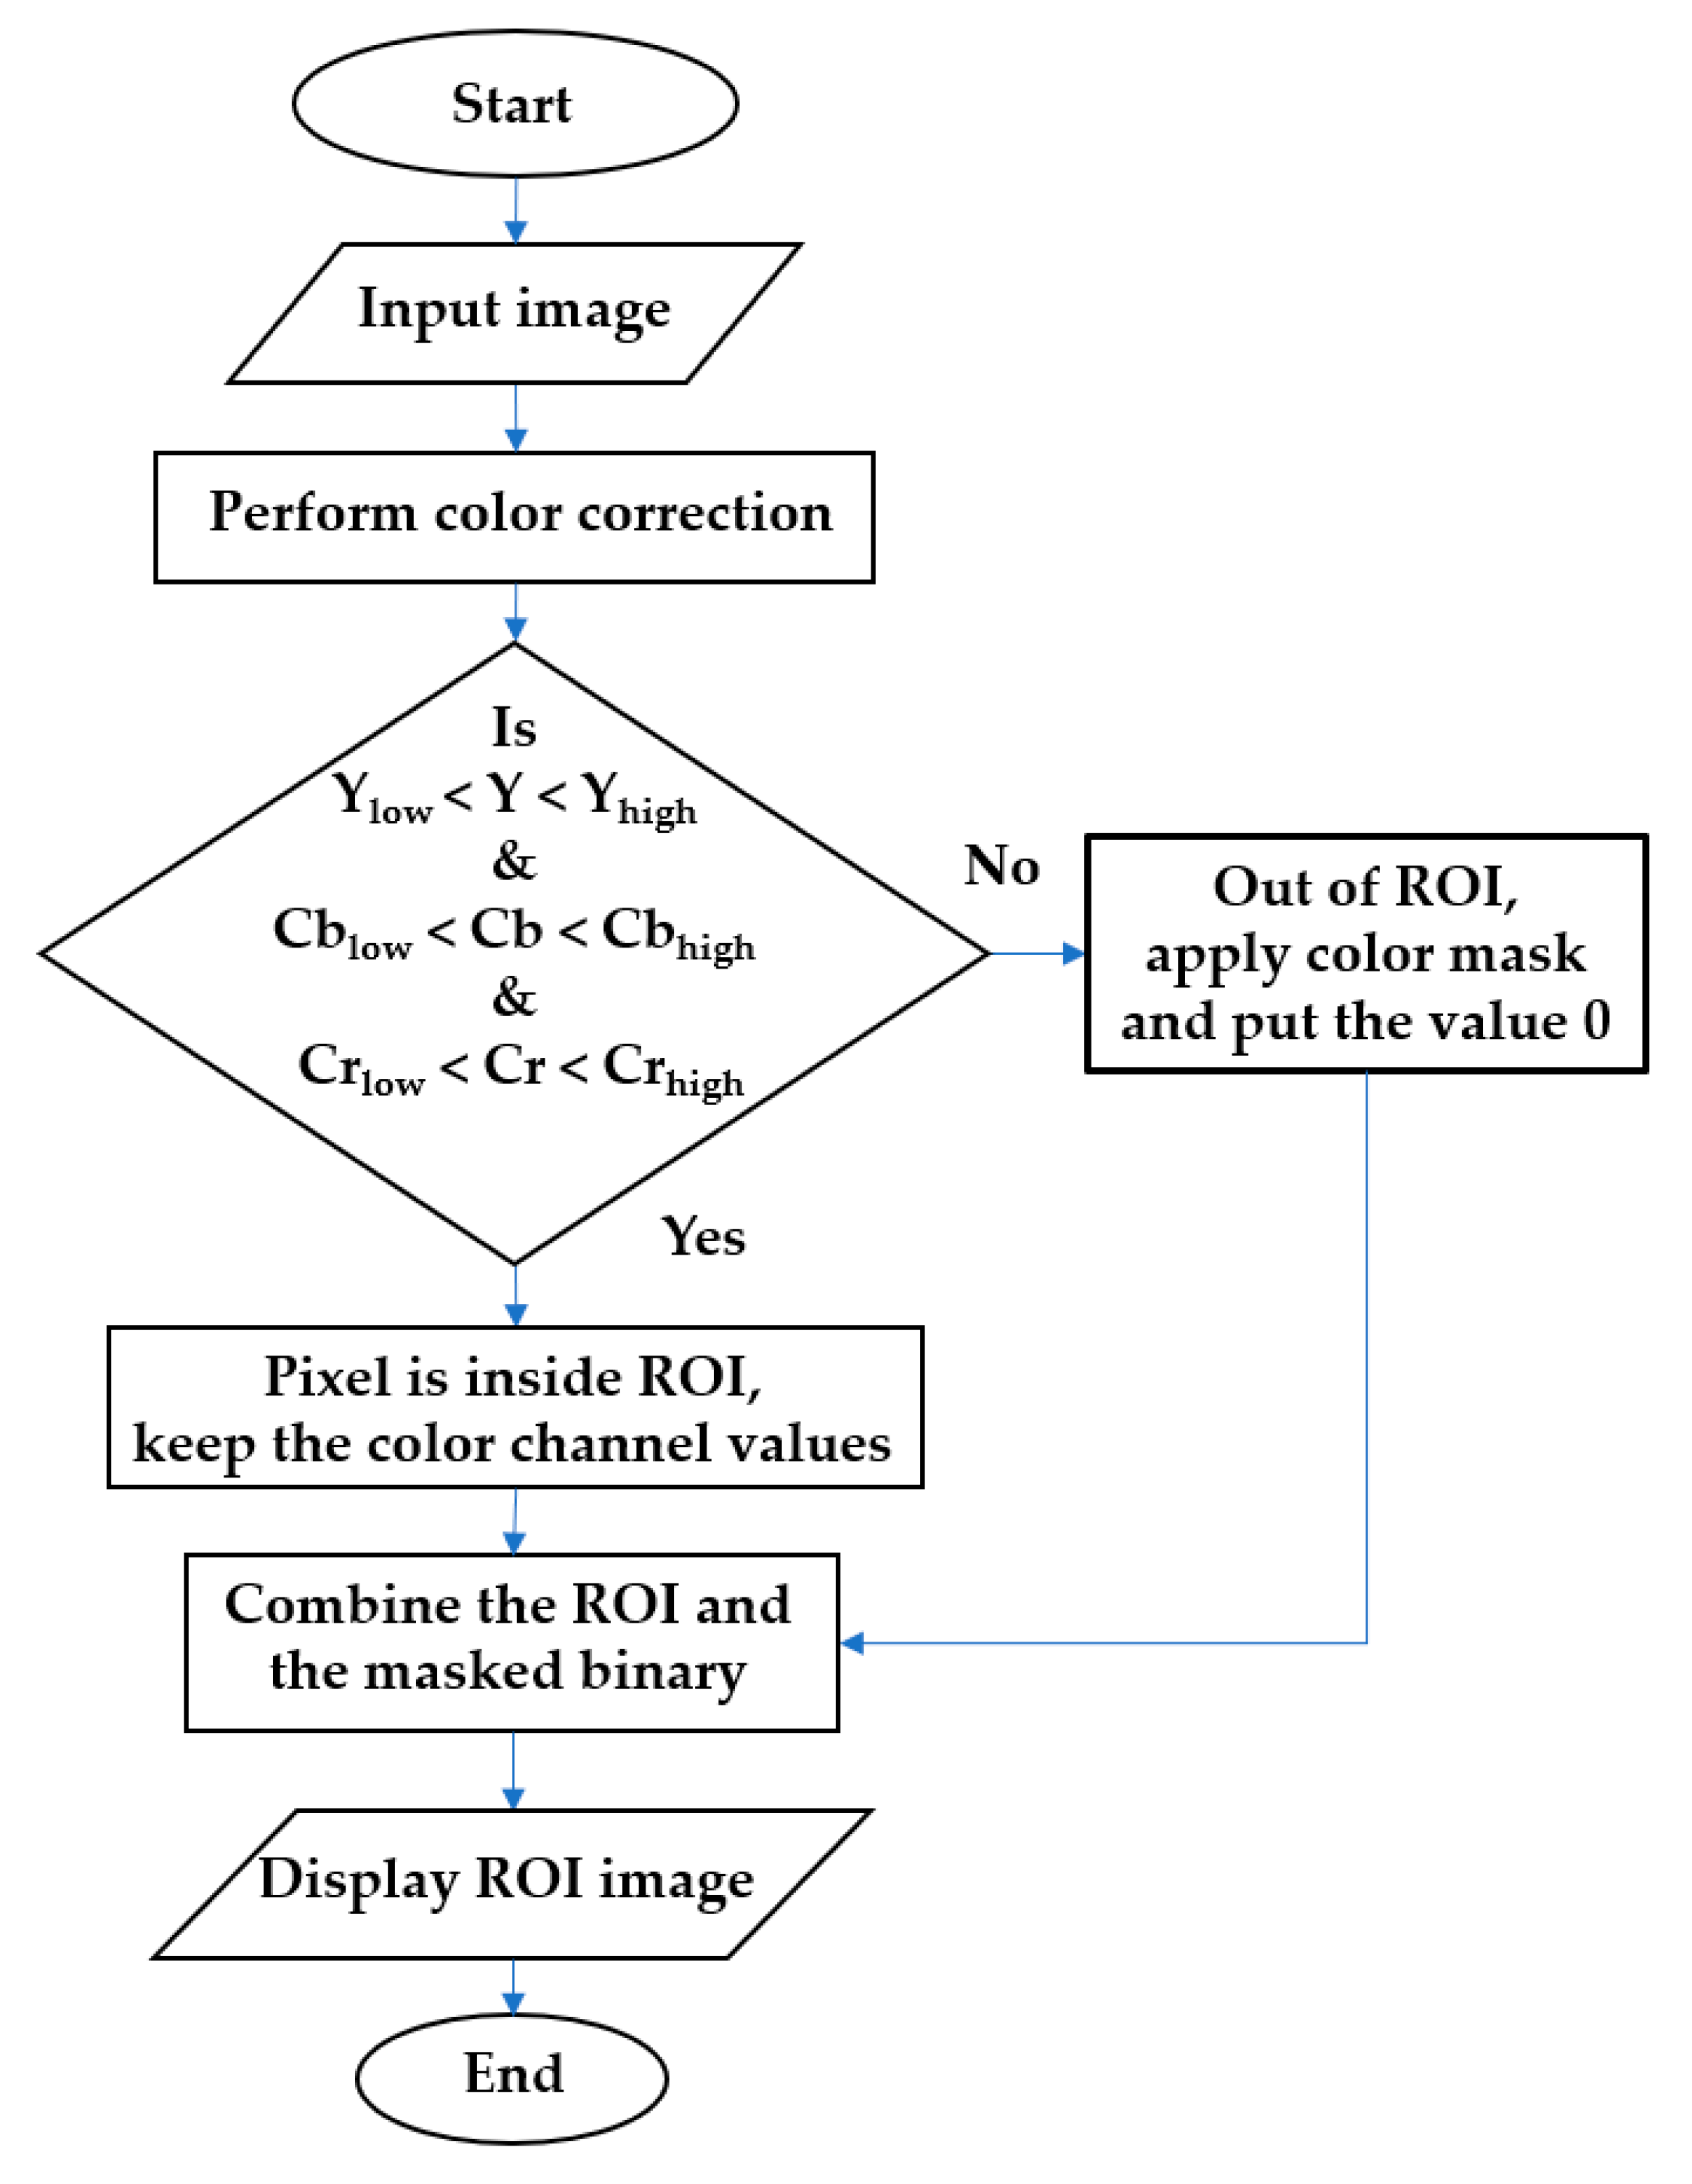
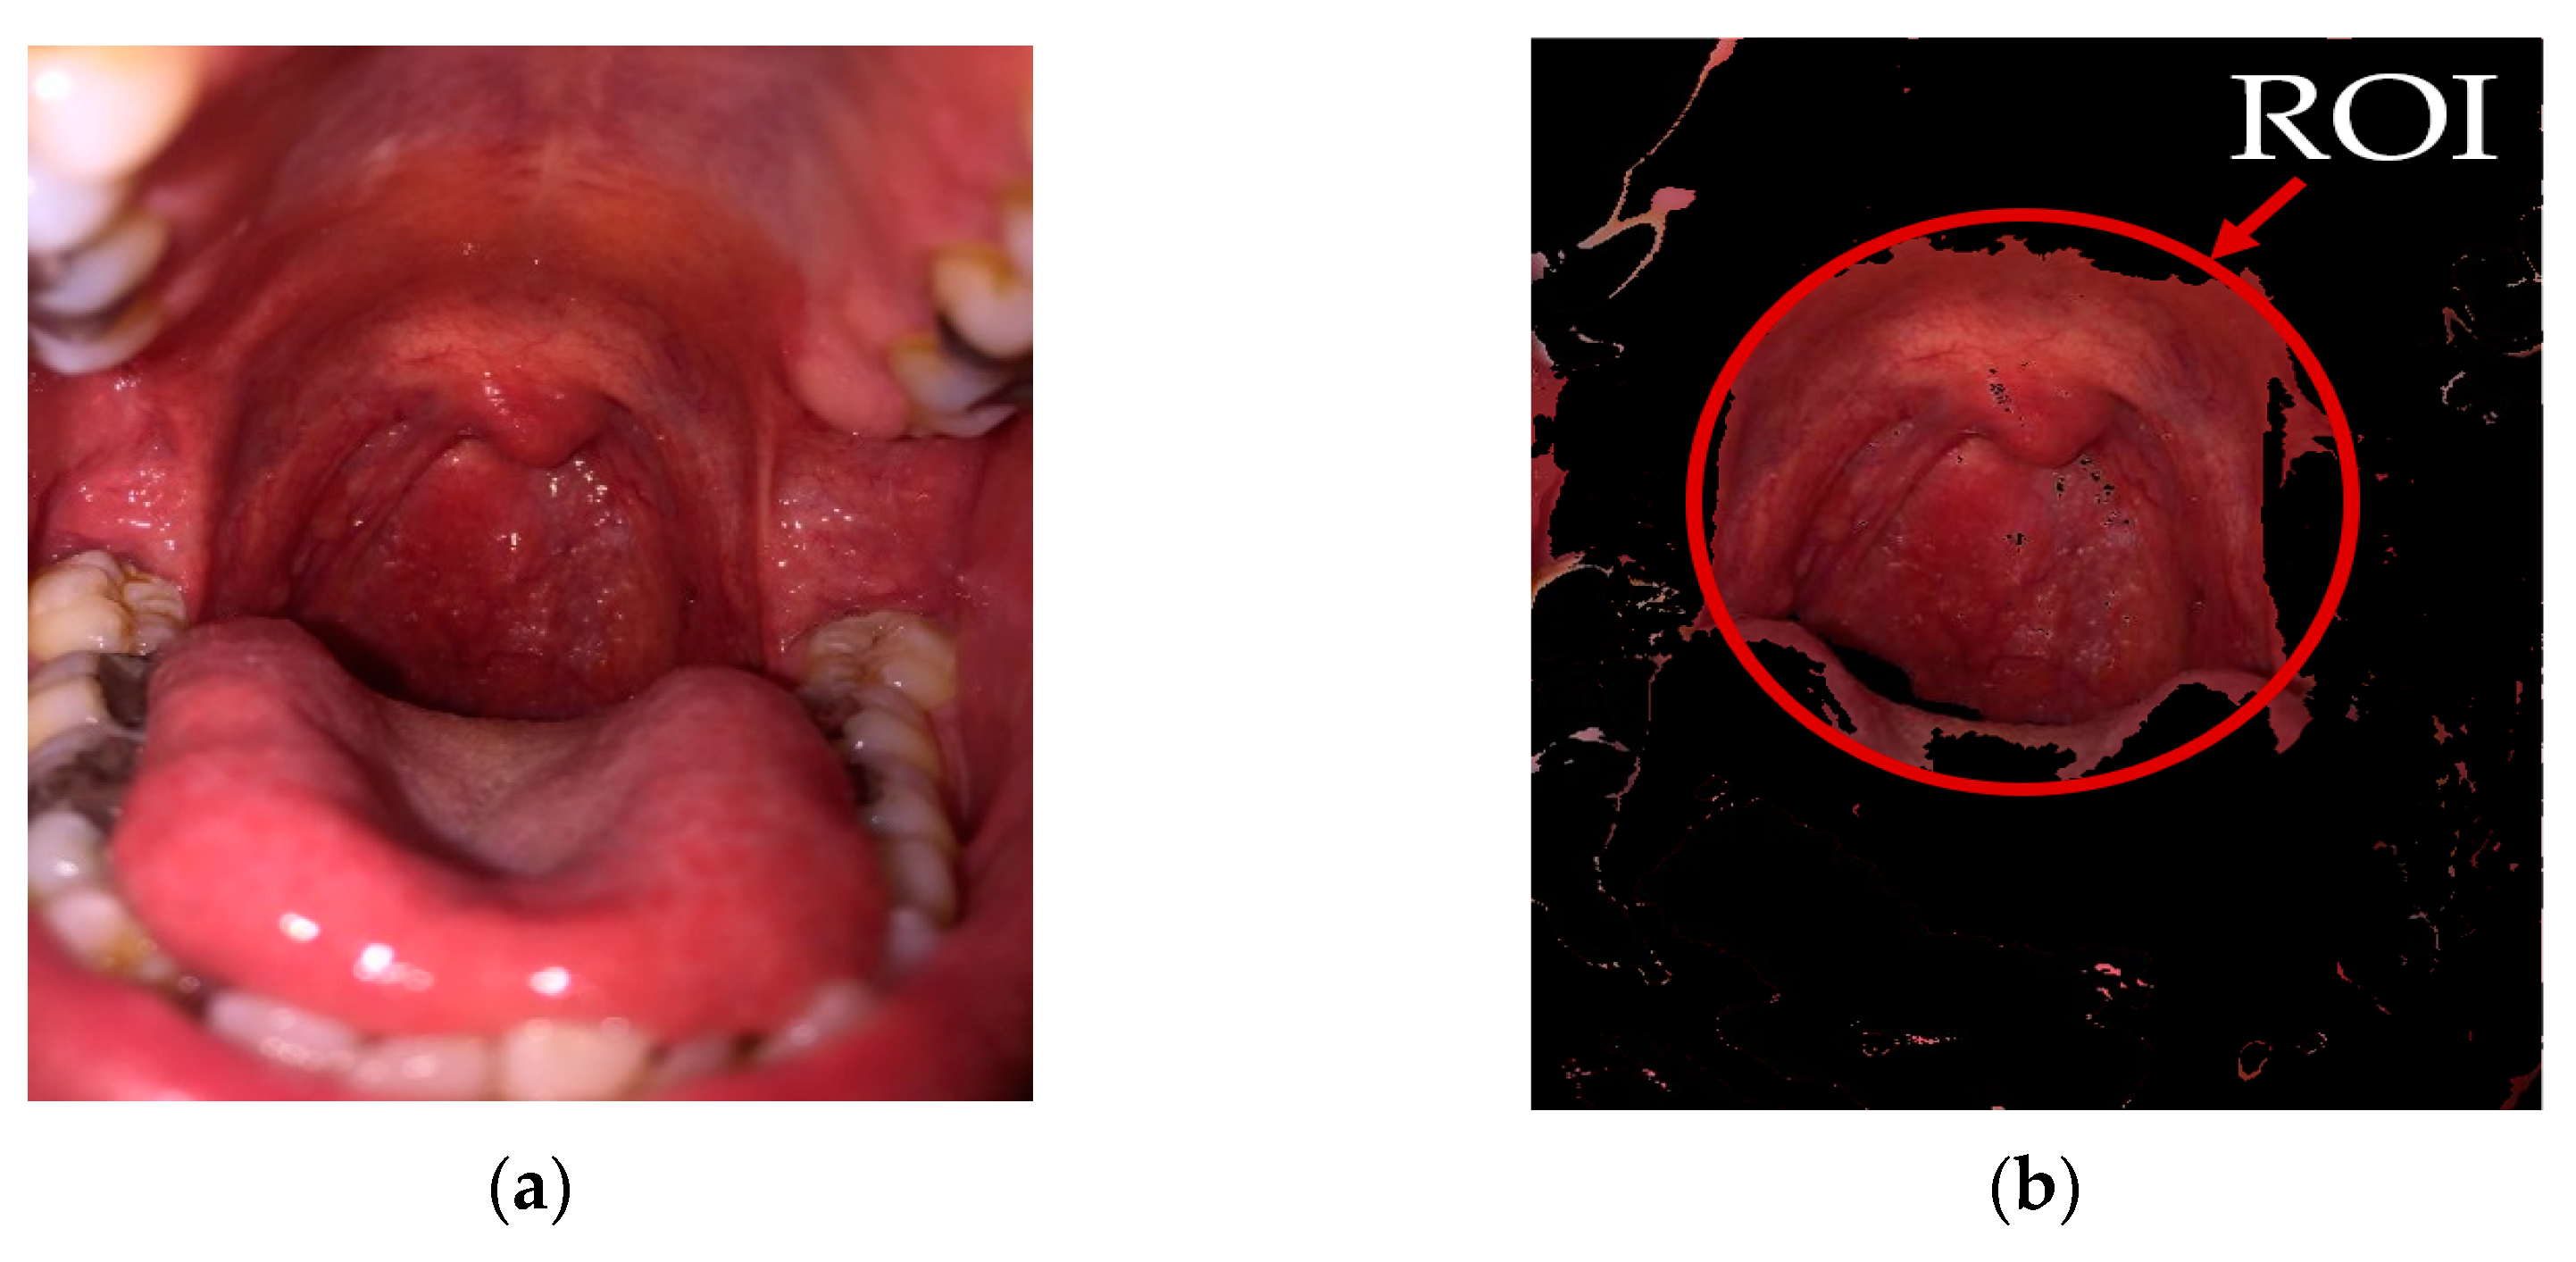
2.2.2. Image Segmentation
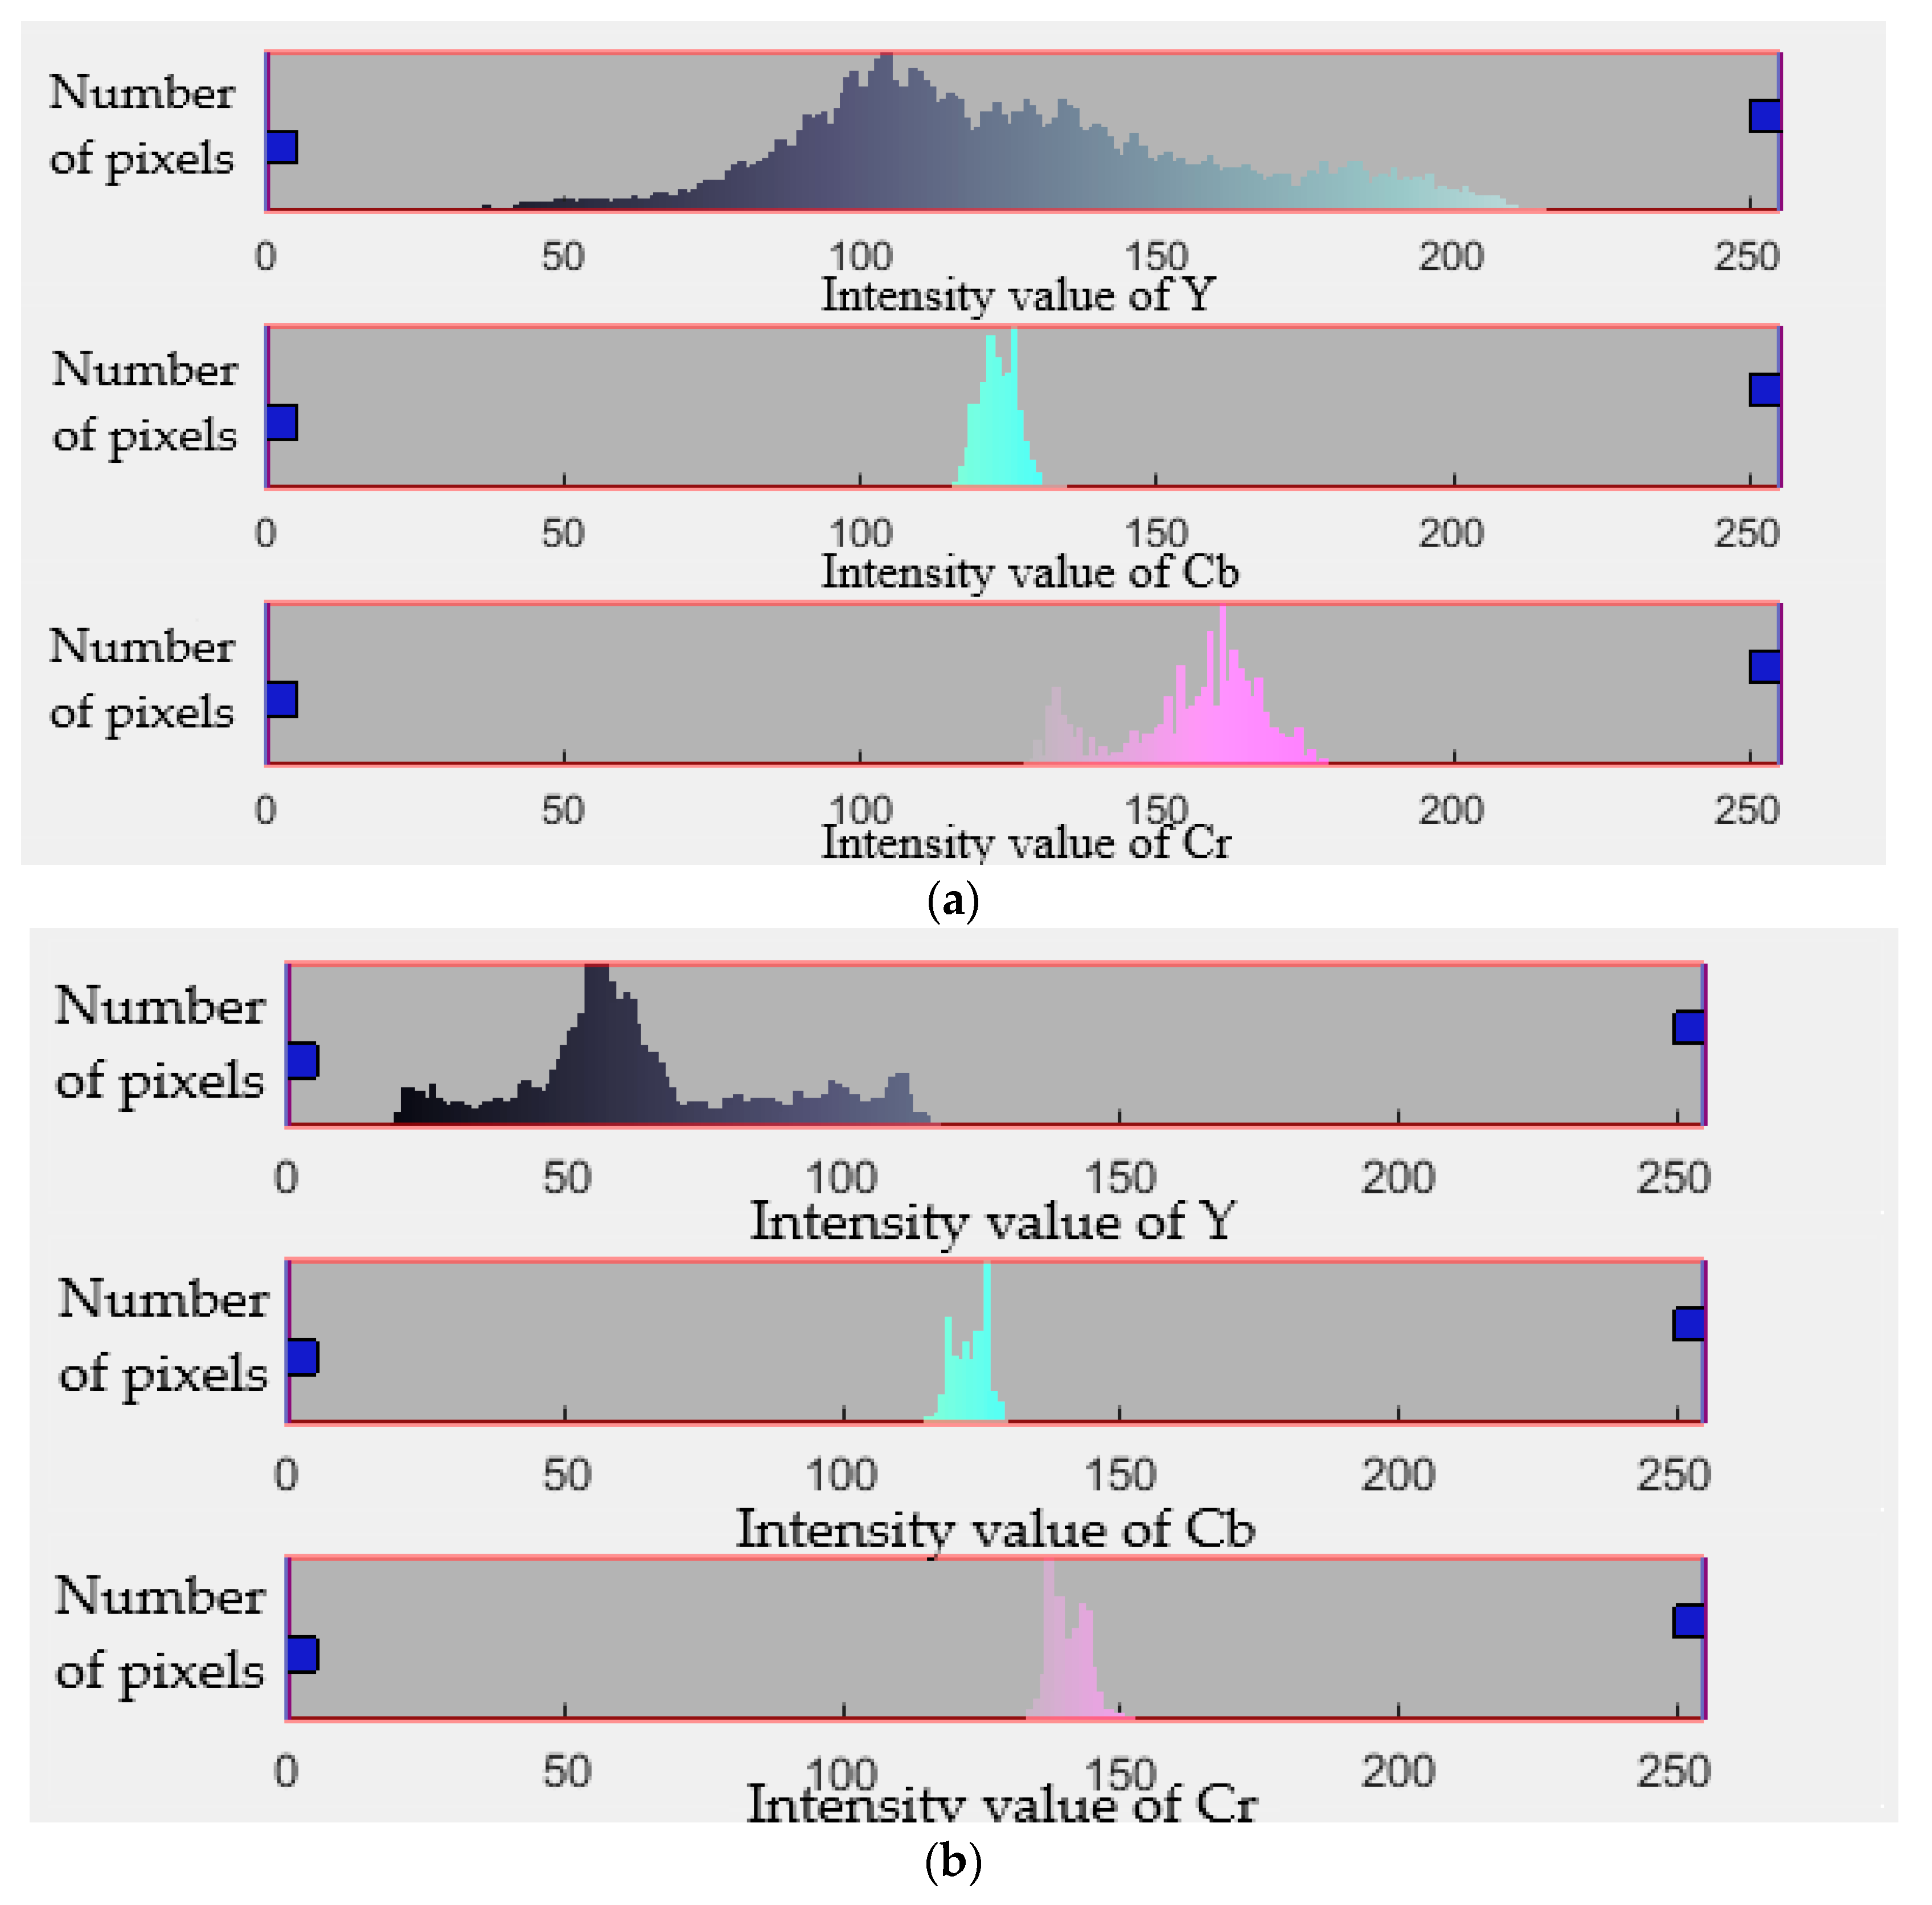
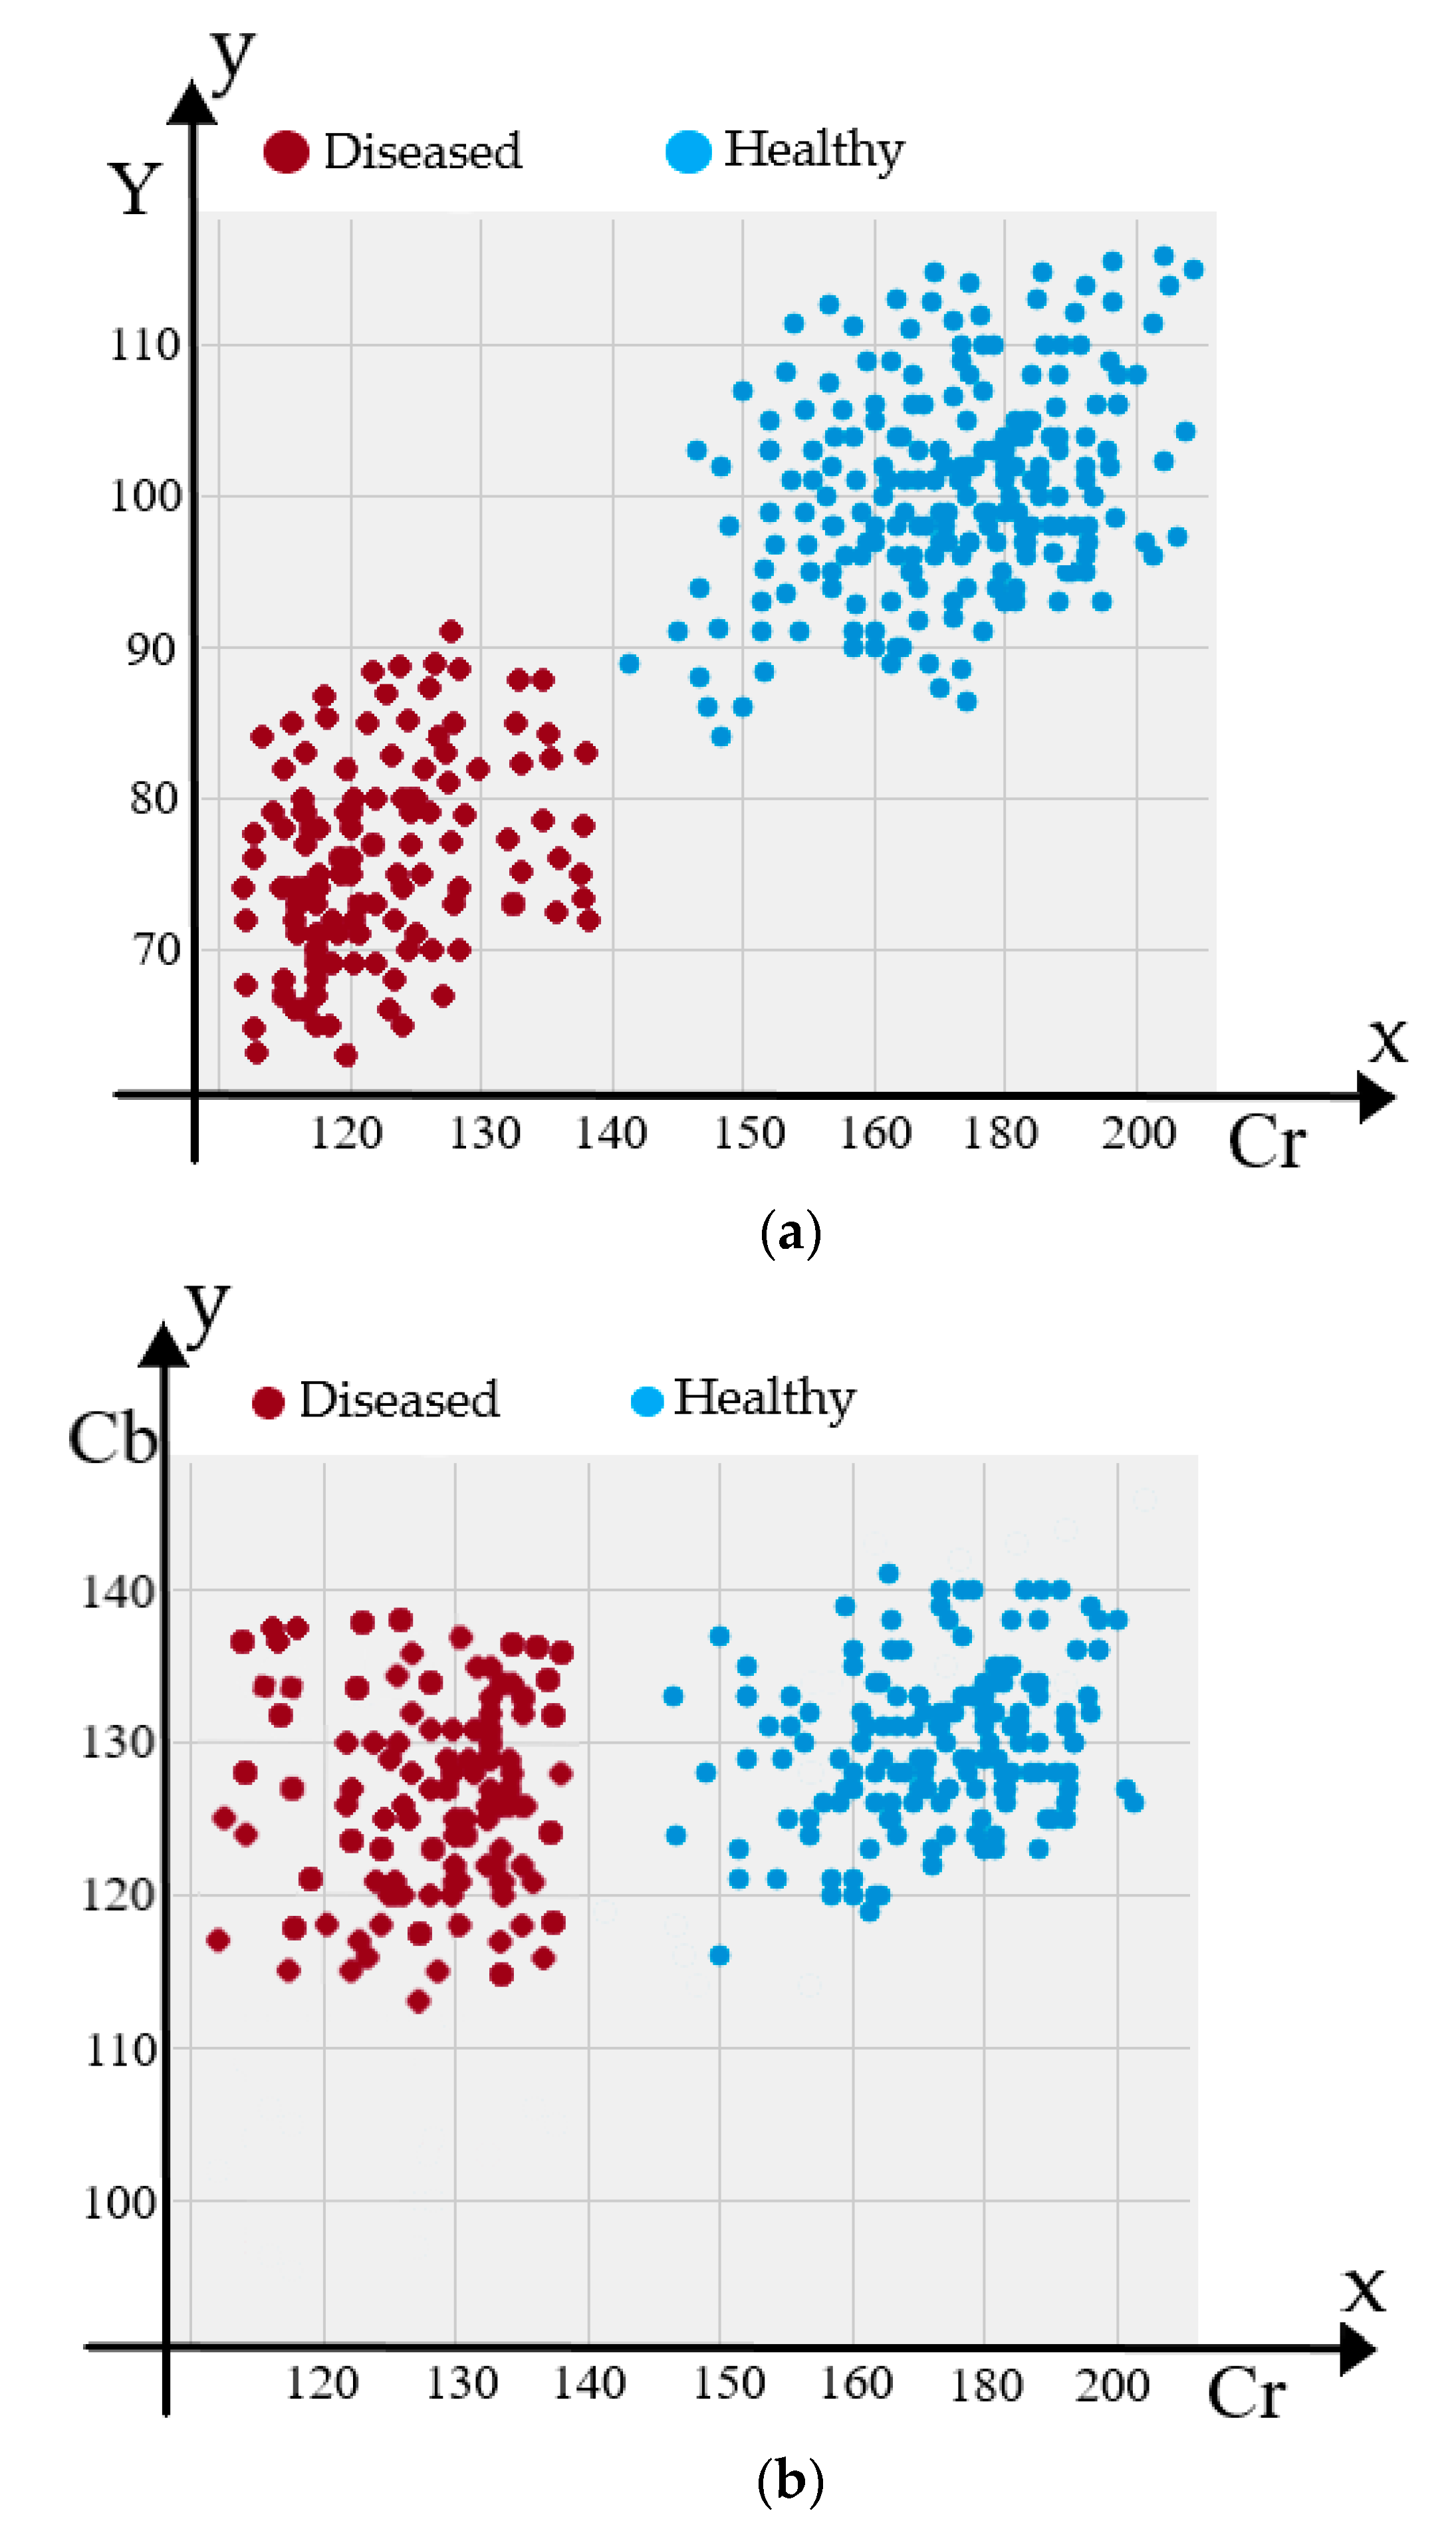
2.3. Feature Extraction
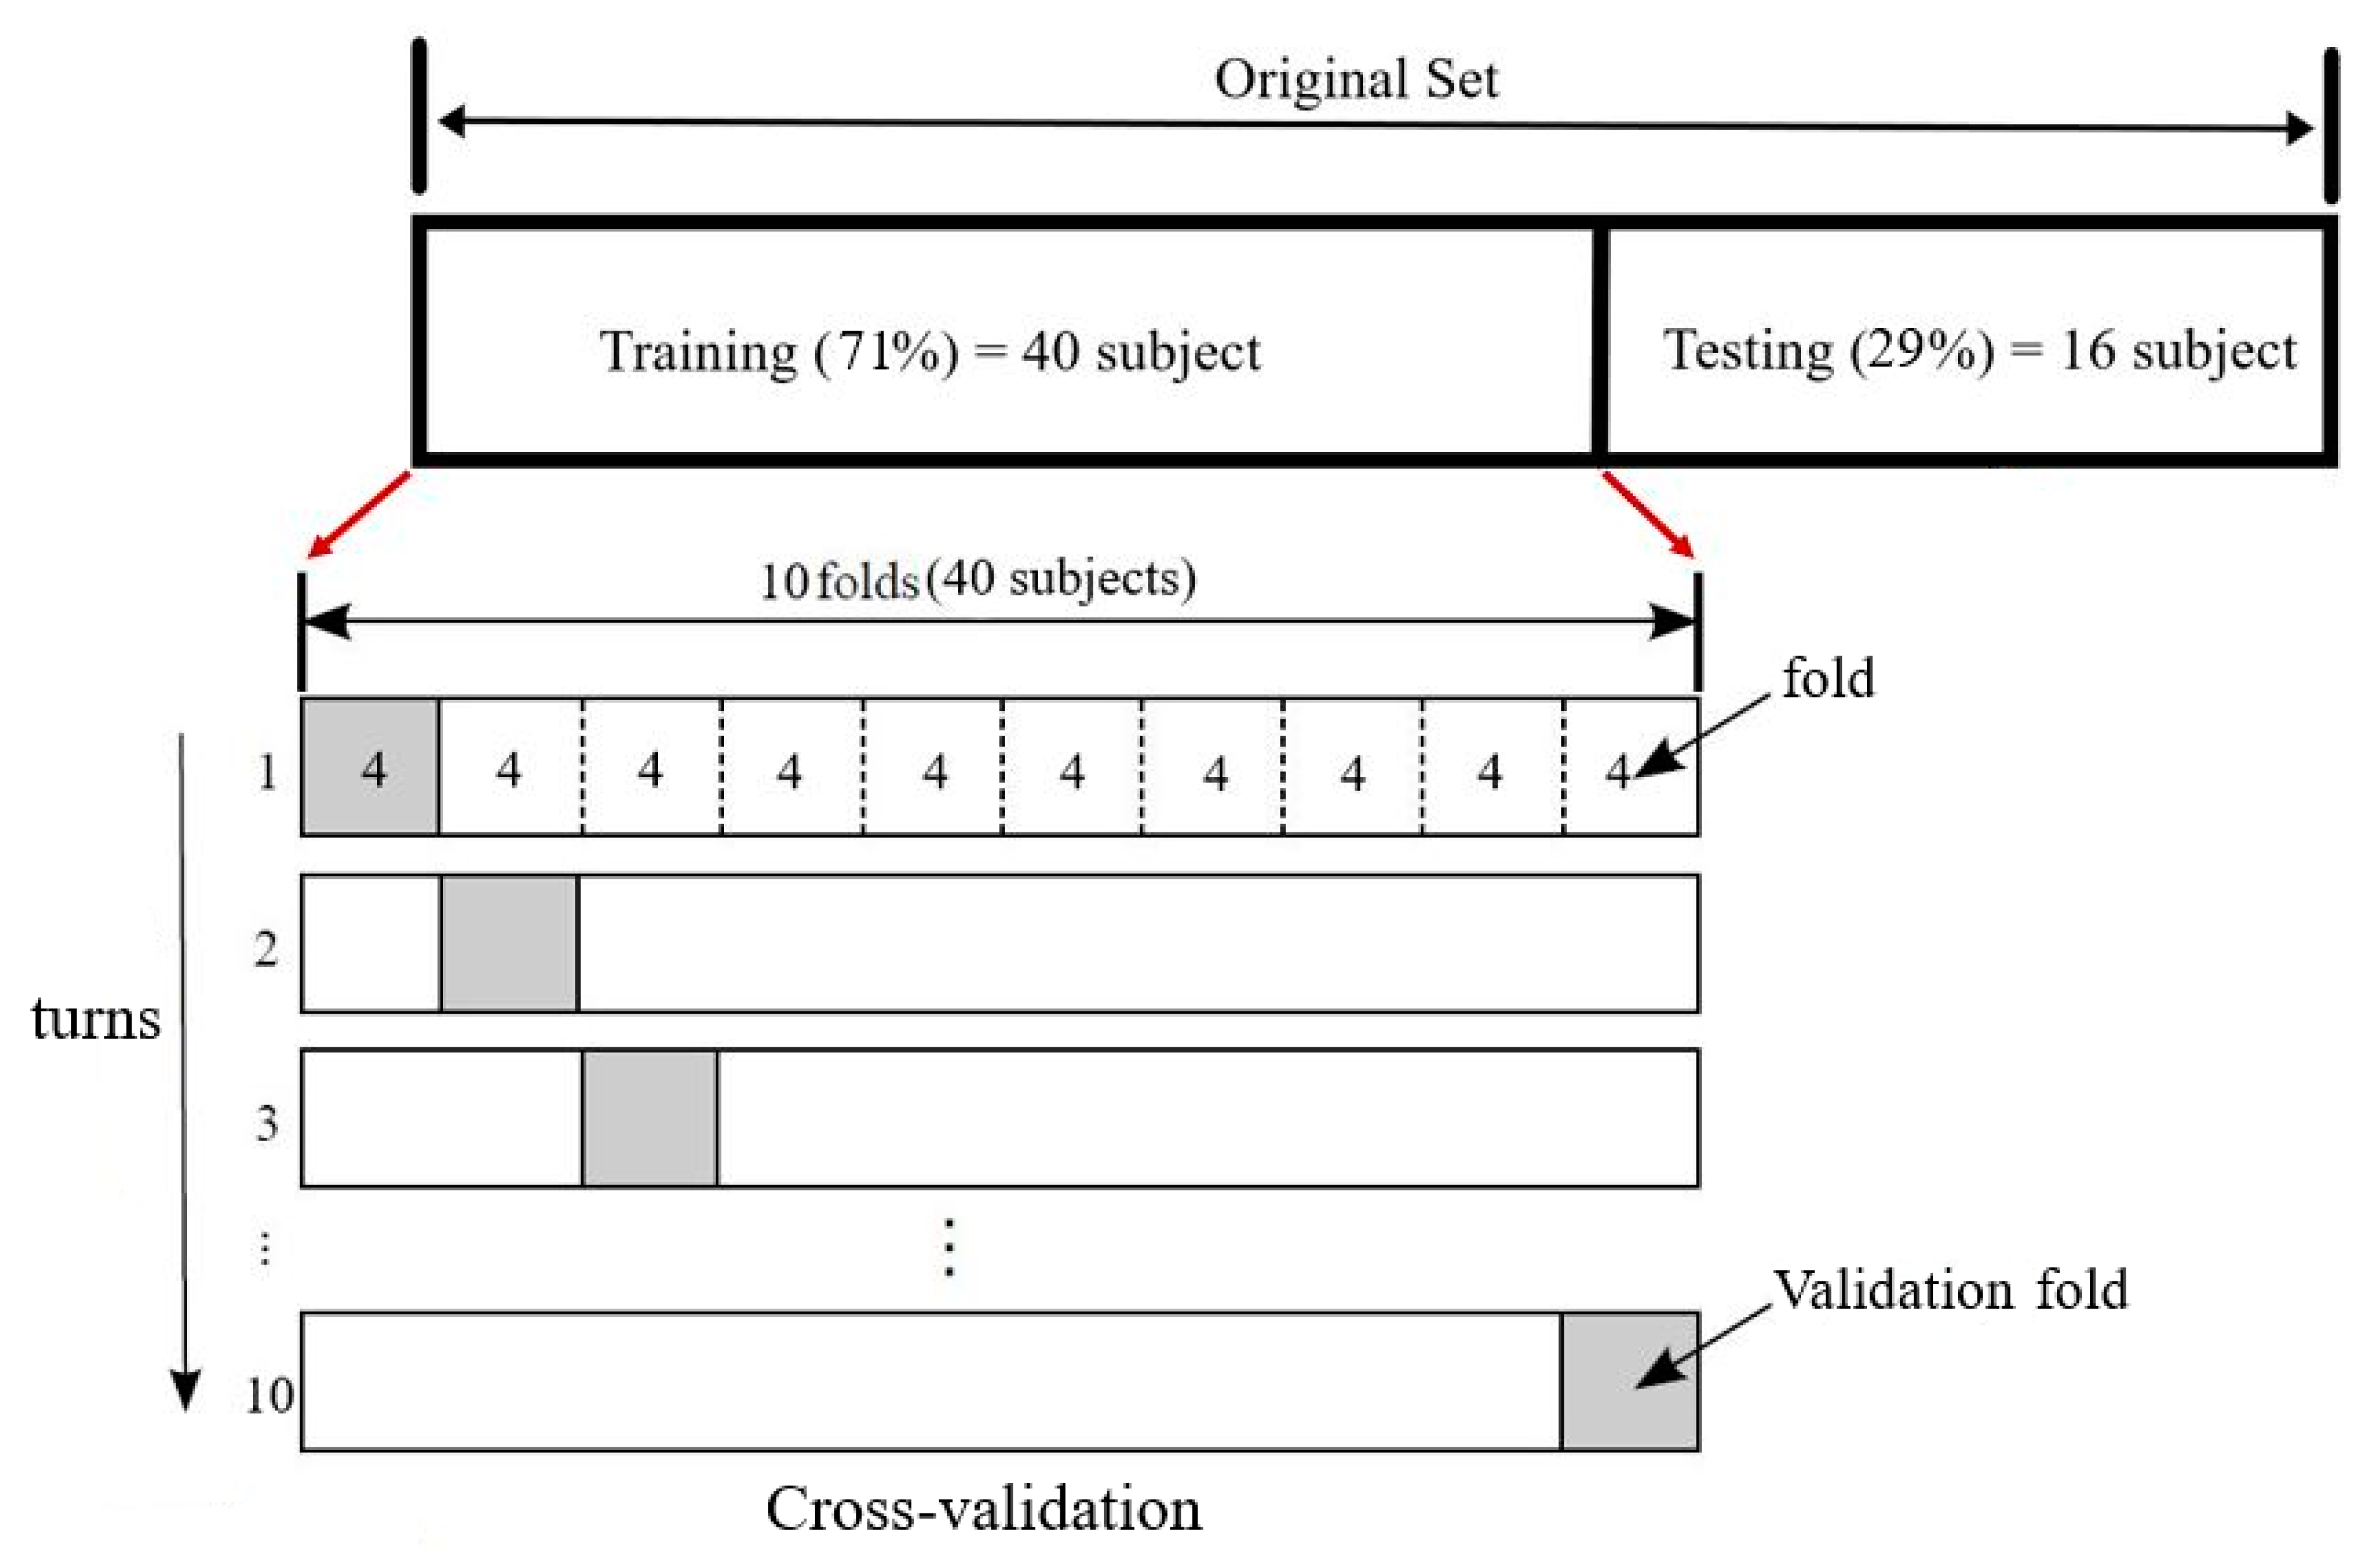
2.4. Classification
3. Results
4. Conclusion and Discussion
Author Contributions
Funding
Acknowledgments
Conflicts of Interest
References
- Niska, R.; Bhuiya, F.; Xu, J. National hospital ambulatory medical care survey: 2007 emergency department summary. Natl. Health Stat. Rep. 2010, 26, 358. [Google Scholar]
- Kalra, M.G.; Higgins, K.E.; Perez, E.D. Common Questions About Streptococcal Pharyngitis. Am. Fam. Physician 2016, 94, 24–31. [Google Scholar]
- Choby, B.A. Diagnosis and treatment of streptococcal pharyngitis. Am. Fam. Physician 2009, 79, 383–390. [Google Scholar] [PubMed]
- Hing, E.; Cherry, D.K.; Woodwell, D.A. National Ambulatory Medical Care Survey: 2004 summary. Adv. Data 2006, 374, 1–33. [Google Scholar]
- Dajani, A.; Taubert, K.; Ferrieri, P.; Peter, G.; Shulman, S.; Association, A.H. Treatment of acute streptococcal pharyngitis and prevention of rheumatic fever: A statement for health professionals. Pediatrics 1995, 96, 758–764. [Google Scholar] [PubMed]
- Watkins, D.A.; Johnson, C.O.; Colquhoun, S.M.; Karthikeyan, G.; Beaton, A.; Bukhman, G.; Forouzanfar, M.H.; Longenecker, C.T.; Mayosi, B.M.; Mensah, G.A. Global, regional, and national burden of rheumatic heart disease, 1990–2015. N. Engl. J. Med. 2017, 377, 713–722. [Google Scholar] [CrossRef] [PubMed]
- Carapetis, J.R.; Steer, A.C.; Mulholland, E.K.; Weber, M. The global burden of group A streptococcal diseases. Lancet Infect. Dis. 2005, 5, 685–694. [Google Scholar] [CrossRef]
- Klepser, D.G.; Klepser, M.E.; Dering-Anderson, A.M.; Morse, J.A.; Smith, J.K.; Klepser, S.A. Community pharmacist-physician collaborative streptococcal pharyngitis management program. J. Am. Pharm. Assoc. 2016, 56, 323–329. [Google Scholar] [CrossRef]
- Spellerberg, B.; Brandt, C. Streptococcus. In Manual of Clinical Microbiology, 11th ed.; American Society of Microbiology: Washington, DC, USA, 2015; pp. 383–402. [Google Scholar]
- Fine, A.M.; Nizet, V.; Mandl, K.D. Large-scale validation of the Centor and McIsaac scores to predict group A streptococcal pharyngitis. Arch. Intern. Med. 2012, 172, 847–852. [Google Scholar] [CrossRef]
- Aalbers, J.; O’Brien, K.K.; Chan, W.-S.; Falk, G.A.; Teljeur, C.; Dimitrov, B.D.; Fahey, T. Predicting streptococcal pharyngitis in adults in primary care: A systematic review of the diagnostic accuracy of symptoms and signs and validation of the Centor score. BMC Med. 2011, 9, 67. [Google Scholar] [CrossRef]
- Bisno, A.L. Diagnosing strep throat in the adult patient: Do clinical criteria really suffice? Ann. Intern. Med. 2003, 139, 150–151. [Google Scholar] [CrossRef]
- Ebell, M.H. Strep throat: Point of Care Guides. Am. Fam. Physician 2003, 68, 937–938. [Google Scholar] [PubMed]
- Jarmusch, A.K.; Pirro, V.; Kerian, K.S.; Cooks, R.G. Detection of strep throat causing bacterium directly from medical swabs by touch spray-mass spectrometry. Analyst 2014, 139, 4785–4789. [Google Scholar] [CrossRef] [PubMed]
- Kellogg, J.A. Suitability of throat culture procedures for detection of group A streptococci and as reference standards for evaluation of streptococcal antigen detection kits. J. Clin. Microbiol. 1990, 28, 165. [Google Scholar] [PubMed]
- Ebell, M.H.; Smith, M.A.; Barry, H.C.; Ives, K.; Carey, M. Does this patient have strep throat? JAMA 2000, 284, 2912–2918. [Google Scholar] [CrossRef] [PubMed]
- Zhang, D.; Zhang, H.; Zhang, B. Tongue Image Analysis; Springer: Berlin/Heidelberg, Germany, 2017. [Google Scholar]
- Seo, S.E.; Tabei, F.; Park, S.J.; Askarian, B.; Kim, K.H.; Moallem, G.; Chong, J.W.; Kwon, O.S. Smartphone with Optical, Physical, and Electrochemical Nanobiosensors. J. Ind. Eng. Chem. 2019, 77, 1–11. [Google Scholar] [CrossRef]
- Gong, Y.-P.; Lian, Y.-S.; Chen, S.-Z. Research and Analysis of Relationship between Colour of Tongue Fix Quantity, Disease and Syndrome. Chin. J. Inf. Tcm 2005, 7, 45–52. [Google Scholar]
- Li, C.H.; Yuen, P.C. Tongue image matching using color content. Pattern Recognit. 2002, 35, 407–419. [Google Scholar] [CrossRef]
- Li, Q.; Liu, Z. Tongue color analysis and discrimination based on hyperspectral images. Comput. Med. Imaging Graph. 2009, 33, 217–221. [Google Scholar] [CrossRef]
- Tang, J.-L.; Liu, B.-Y.; Ma, K.-W. Traditional chinese medicine. Lancet 2008, 372, 1938–1940. [Google Scholar] [CrossRef]
- Lo, L.-C.; Chen, Y.-F.; Chen, W.-J.; Cheng, T.-L.; Chiang, J.Y. The study on the agreement between automatic tongue diagnosis system and traditional chinese medicine practitioners. Evid.-Based Complement. Altern. Med. 2012, 2012, 505063. [Google Scholar] [CrossRef] [PubMed]
- Kim, M.; Cobbin, D.; Zaslawski, C. Traditional Chinese medicine tongue inspection: An examination of the inter-and intrapractitioner reliability for specific tongue characteristics. J. Altern. Complement. Med. 2008, 14, 527–536. [Google Scholar] [CrossRef] [PubMed]
- Askarian, B.; Tabei, F.; Askarian, A.; Chong, J.W. An affordable and easy-to-use diagnostic method for keratoconus detection using a smartphone. In Proceedings of the Medical Imaging 2018: Computer-Aided Diagnosis, Houston, TX, USA, 10–15 February 2018; p. 1057512. [Google Scholar]
- Chong, J.W.; Cho, C.H.; Tabei, F.; Le-Anh, D.; Esa, N.; McManus, D.D.; Chon, K.H. Motion and Noise Artifact-Resilient Atrial Fibrillation Detection using a Smartphone. IEEE J. Emerg. Sel. Top. Circuits Syst. 2018. [Google Scholar] [CrossRef] [PubMed]
- Tabei, F.; Kumar, R.; Phan, T.N.; McManus, D.D.; Chong, J.W. A Novel Personalized Motion and Noise Artifact (MNA) Detection Method for Smartphone Photoplethysmograph (PPG) Signals. IEEE Access 2018, 6, 60498–60512. [Google Scholar] [CrossRef] [PubMed]
- Tabei, F.; Zaman, R.; Foysal, K.H.; Kumar, R.; Kim, Y.; Chong, J.W. A novel diversity method for smartphone camera-based heart rhythm signals in the presence of motion and noise artifacts. PLoS ONE 2019, 14, e0218248. [Google Scholar] [CrossRef] [PubMed]
- Askarian, B.; Jung, K.; Chong, J.W. Monitoring of Heart Rate from Photoplethysmographic Signals Using a Samsung Galaxy Note8 in Underwater Environments. Sensors 2019, 19, 2846. [Google Scholar] [CrossRef] [PubMed]
- Hui, S.C.; He, Y.; Thach, D.T.C. Machine learning for tongue diagnosis. In Proceedings of the 2007 6th International Conference on Information, Communications & Signal Processing, Singapore, 10–13 December 2007; pp. 1–5. [Google Scholar]
- Pang, B.; Zhang, D.; Li, N.; Wang, K. Computerized tongue diagnosis based on Bayesian networks. IEEE Trans. Biomed. Eng. 2004, 51, 1803–1810. [Google Scholar] [CrossRef]
- Wang, K.; Zhang, D.; Li, N.; Pang, B. Tongue diagnosis based on biometric pattern recognition technology. In Pattern Recognition: From Classical to Modern Approaches; World Scientific: Singapore, 2001; pp. 575–598. [Google Scholar]
- Zhang, H.-Z.; Wang, K.-Q.; Jin, X.-S.; Zhang, D. SVR based color calibration for tongue image. In Proceedings of the 2005 International Conference on Machine Learning and Cybernetics, Guangzhou, China, 18–21 August 2005; pp. 5065–5070. [Google Scholar]
- Zhang, B.; Wang, X.; You, J.; Zhang, D. Tongue color analysis for medical application. Evid.-Based Complement. Altern. Med. 2013, 2013, 264742. [Google Scholar] [CrossRef]
- Wang, Y.-G.; Yang, J.; Zhou, Y.; Wang, Y.-Z. Region partition and feature matching based color recognition of tongue image. Pattern Recognit. Lett. 2007, 28, 11–19. [Google Scholar] [CrossRef]
- Wessels, M.R. Streptococcal pharyngitis. N. E. J. Med. 2011, 364, 648–655. [Google Scholar] [CrossRef]
- Dang, D.; Cho, C.H.; Kim, D.; Kwon, O.S.; Chong, J.W. Efficient color correction method for smartphone camera-based health monitoring application. In Proceedings of the 2017 39th Annual International Conference of the IEEE Engineering in Medicine and Biology Society (EMBC), Jeju Island, Korea, 11–15 July 2017; pp. 799–802. [Google Scholar]
- Wolf, S. Color Correction Matrix for Digital Still and Video Imaging Systems; National Telecommunications and Information Administration: Washington, DC, USA, 2003.
- MathWorks. MATLAB 2017. Available online: https://www.mathworks.com/products/new_products/release2017b.html (accessed on 19 December 2017).
- Bhandari, A.K.; Kumar, A.; Chaudhary, S.; Singh, G.K. A novel color image multilevel thresholding based segmentation using nature inspired optimization algorithms. Expert Syst. Appl. 2016, 63, 112–133. [Google Scholar] [CrossRef]
- Schachtel, B.P.; Fillingim, J.M.; Beiter, D.J.; Lane, A.C.; Schwartz, L.A. Subjective and objective features of sore throat. Arch. Intern. Med. 1984, 144, 497–500. [Google Scholar] [CrossRef] [PubMed]
- File:CIExy1931.png. Available online: https://commons.wikimedia.org/wiki/File:CIExy1931.png (accessed on 24 March 2019).
- Tsai, C.-F.; Hsu, Y.-F.; Lin, C.-Y.; Lin, W.-Y. Intrusion detection by machine learning: A review. Expert Syst. Appl. 2009, 36, 11994–12000. [Google Scholar] [CrossRef]
- Deng, Z.; Zhu, X.; Cheng, D.; Zong, M.; Zhang, S. Efficient kNN classification algorithm for big data. Neurocomputing 2016, 195, 143–148. [Google Scholar] [CrossRef]
- Vrooman, H.A.; Cocosco, C.A.; van der Lijn, F.; Stokking, R.; Ikram, M.A.; Vernooij, M.W.; Breteler, M.M.; Niessen, W.J. Multi-spectral brain tissue segmentation using automatically trained k-Nearest-Neighbor classification. Neuroimage 2007, 37, 71–81. [Google Scholar] [CrossRef] [PubMed]
- Rajini, N.H.; Bhavani, R. Classification of MRI brain images using k-nearest neighbor and artificial neural network. In Proceedings of the 2011 International Conference on Recent Trends in Information Technology (ICRTIT), Chennai, India, 3–5 June 2011; pp. 563–568. [Google Scholar]
- Medrano, C.; Igual, R.; Plaza, I.; Castro, M.; Fardoun, H.M. Personalizable smartphone application for detecting falls. In Proceedings of the 2014 IEEE-EMBS International Conference on Biomedical and Health Informatics (BHI), Valencia, Spain, 1–4 June 2014; pp. 169–172. [Google Scholar]
- Borovicka, T.; Jirina, M., Jr.; Kordik, P.; Jirina, M. Selecting representative data sets. In Advances in Data Mining Knowledge Discovery and Applications; IntechOpen: London, UK, 2012. [Google Scholar]
- Scott, D.W.; Terrell, G.R. Biased and unbiased cross-validation in density estimation. J. Am. Stat. Assoc. 1987, 82, 1131–1146. [Google Scholar] [CrossRef]
- Pang, B.; Zhang, D.; Wang, K. Tongue image analysis for appendicitis diagnosis. Inf. Sci. 2005, 175, 160–176. [Google Scholar] [CrossRef]
- Cho, C.H.; Tabei, F.; Phan, T.N.; Kim, Y.; Chong, J.W. A Novel Re-Targetable Application Development Platform for Healthcare Mobile Applications. Int. J. Comput. Sci. Softw. Eng. 2017, 6, 196–201, arXiv:1903.05783. [Google Scholar]


| Color Channel | Y | Cb | Cr |
|---|---|---|---|
| Healthy (Mean ± STD) | 133.5 ± 12 | 127 ± 5 | 168.5 ± 11 |
| Diseased (Mean ± STD) | 97 ± 5 | 137 ± 6 | 141 ± 8 |
| Healthy (range) | 122–145 | 112–142 | 155–185 |
| Diseased (range) | 92–103 | 118–132 | 135–147 |
| Strep Throat Symptoms | (Mean ± STD) | (Mean ± STD) |
|---|---|---|
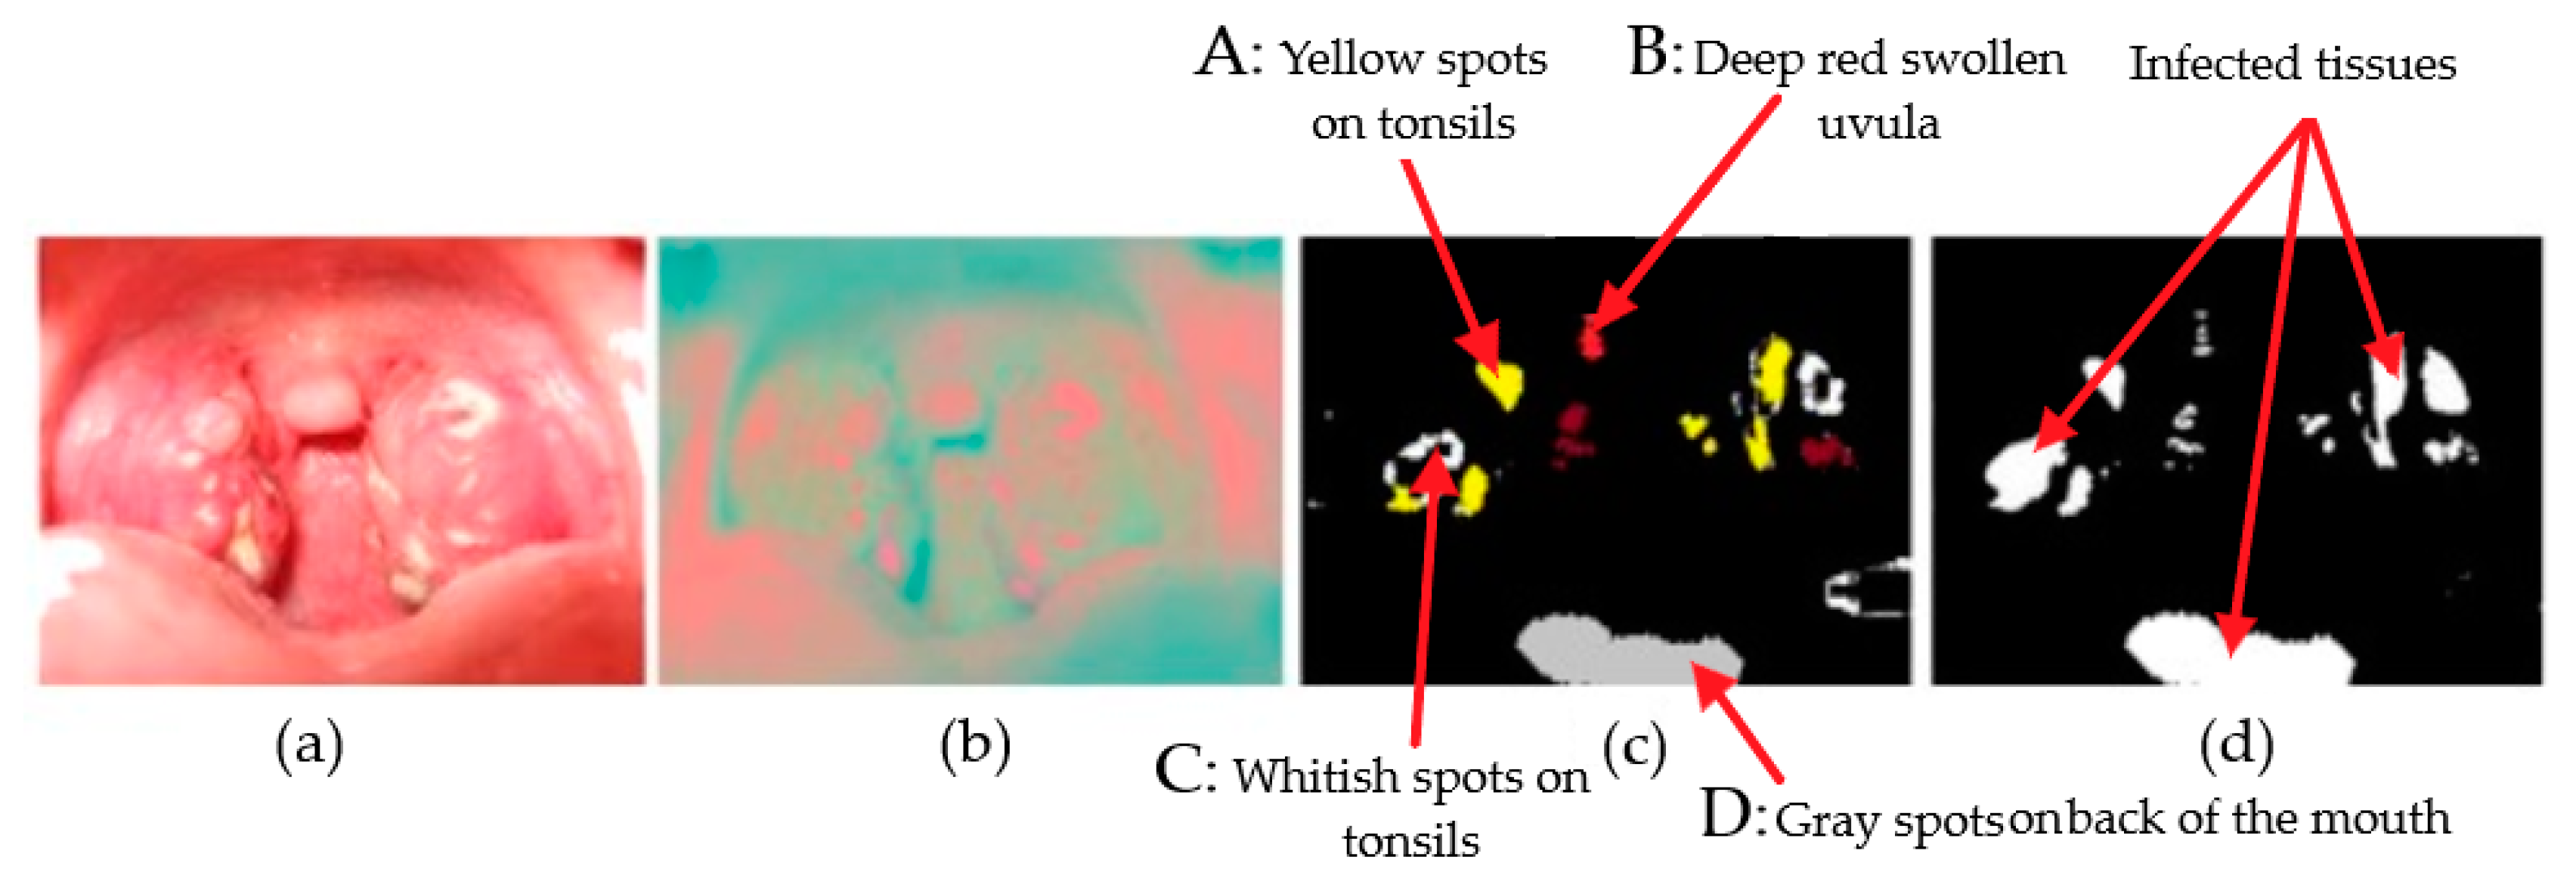
| A in Figure 12 | 154 ± 6.8 | 141 ± 4.3 |
| B in Figure 12 | 165 ± 7.6 | 143 ± 5.1 |
| C in Figure 12 | 136.2 ± 4.4 | 152.6 ± 6.7 |
| D in Figure 12 | 151.2 ± 6.6 | 134.6 ± 5.4 |
| Cross Validation Accuracy (Mean± STD) | Average Test Accuracy | Average Test Sensitivity | Average Test Specificity |
|---|---|---|---|
| 0.978 ± 0.014 | 0.9375 | 0.875 | 0.88 |
© 2019 by the authors. Licensee MDPI, Basel, Switzerland. This article is an open access article distributed under the terms and conditions of the Creative Commons Attribution (CC BY) license (http://creativecommons.org/licenses/by/4.0/).
Share and Cite
Askarian, B.; Yoo, S.-C.; Chong, J.W. Novel Image Processing Method for Detecting Strep Throat (Streptococcal Pharyngitis) Using Smartphone. Sensors 2019, 19, 3307. https://doi.org/10.3390/s19153307
Askarian B, Yoo S-C, Chong JW. Novel Image Processing Method for Detecting Strep Throat (Streptococcal Pharyngitis) Using Smartphone. Sensors. 2019; 19(15):3307. https://doi.org/10.3390/s19153307
Chicago/Turabian StyleAskarian, Behnam, Seung-Chul Yoo, and Jo Woon Chong. 2019. "Novel Image Processing Method for Detecting Strep Throat (Streptococcal Pharyngitis) Using Smartphone" Sensors 19, no. 15: 3307. https://doi.org/10.3390/s19153307
APA StyleAskarian, B., Yoo, S.-C., & Chong, J. W. (2019). Novel Image Processing Method for Detecting Strep Throat (Streptococcal Pharyngitis) Using Smartphone. Sensors, 19(15), 3307. https://doi.org/10.3390/s19153307