Fault Detection in Power Equipment via an Unmanned Aerial System Using Multi Modal Data


 ,
,  ,
,  , and
, and
Abstract
1. Introduction
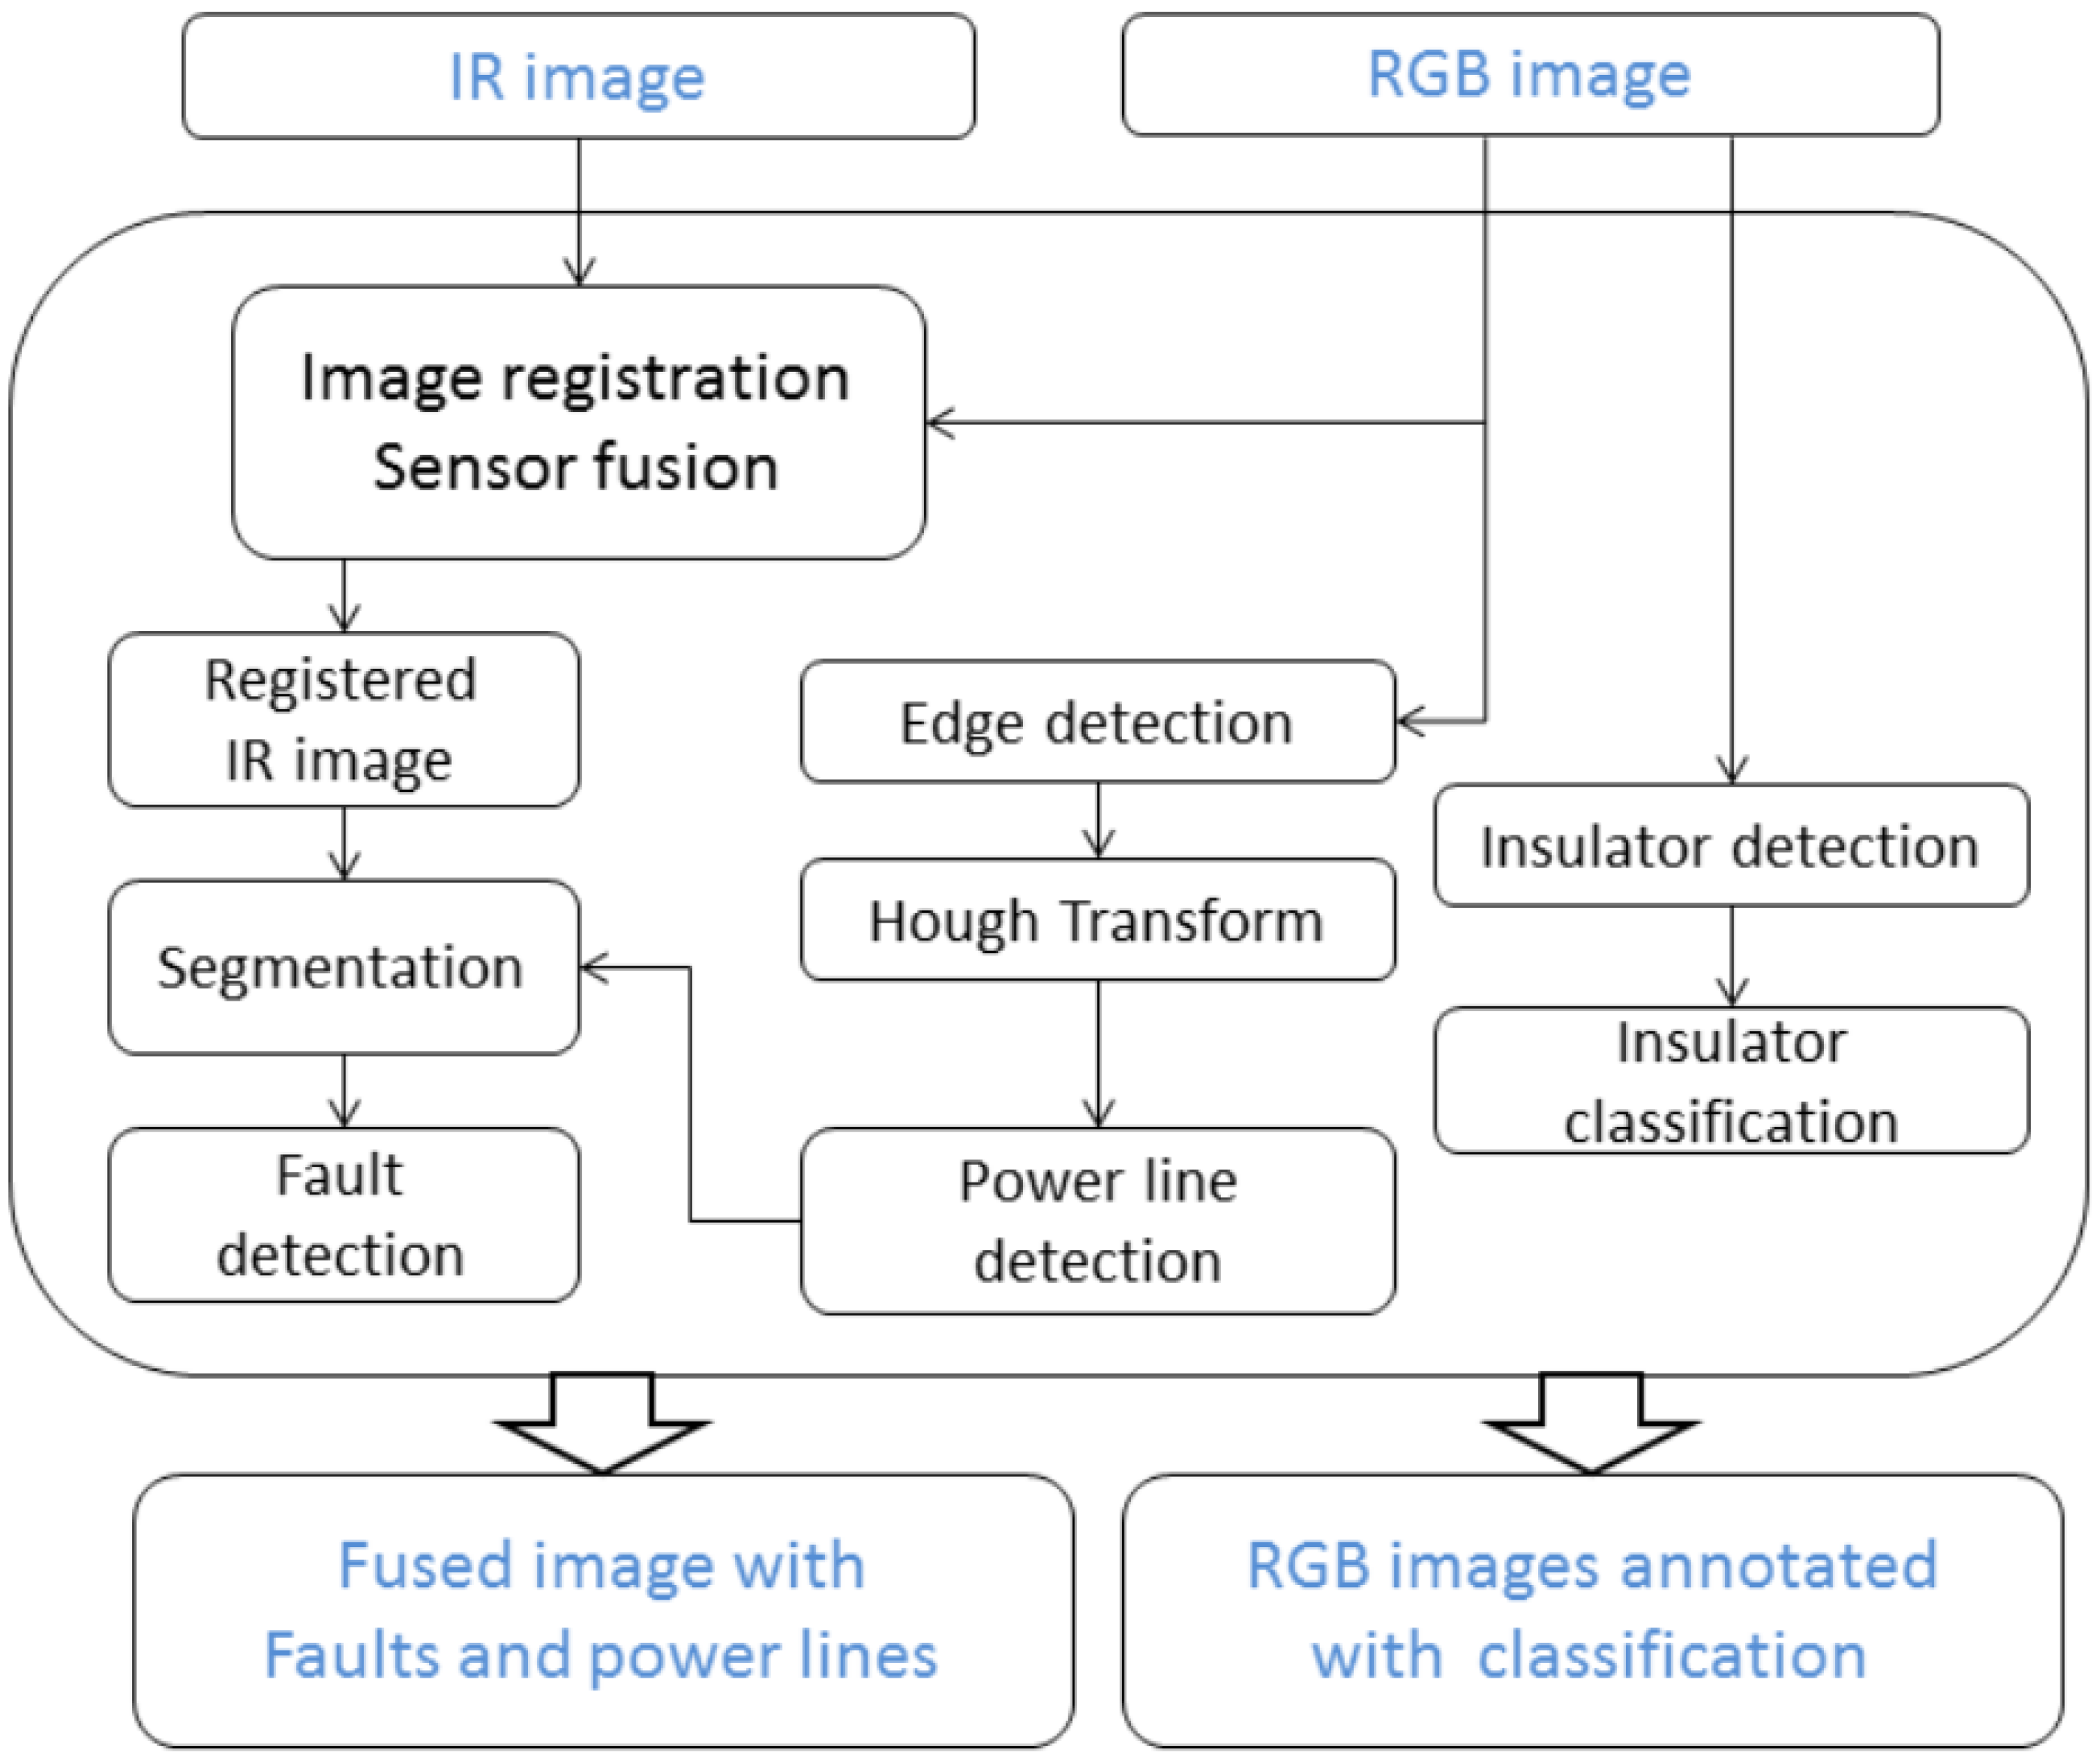
2. Methods
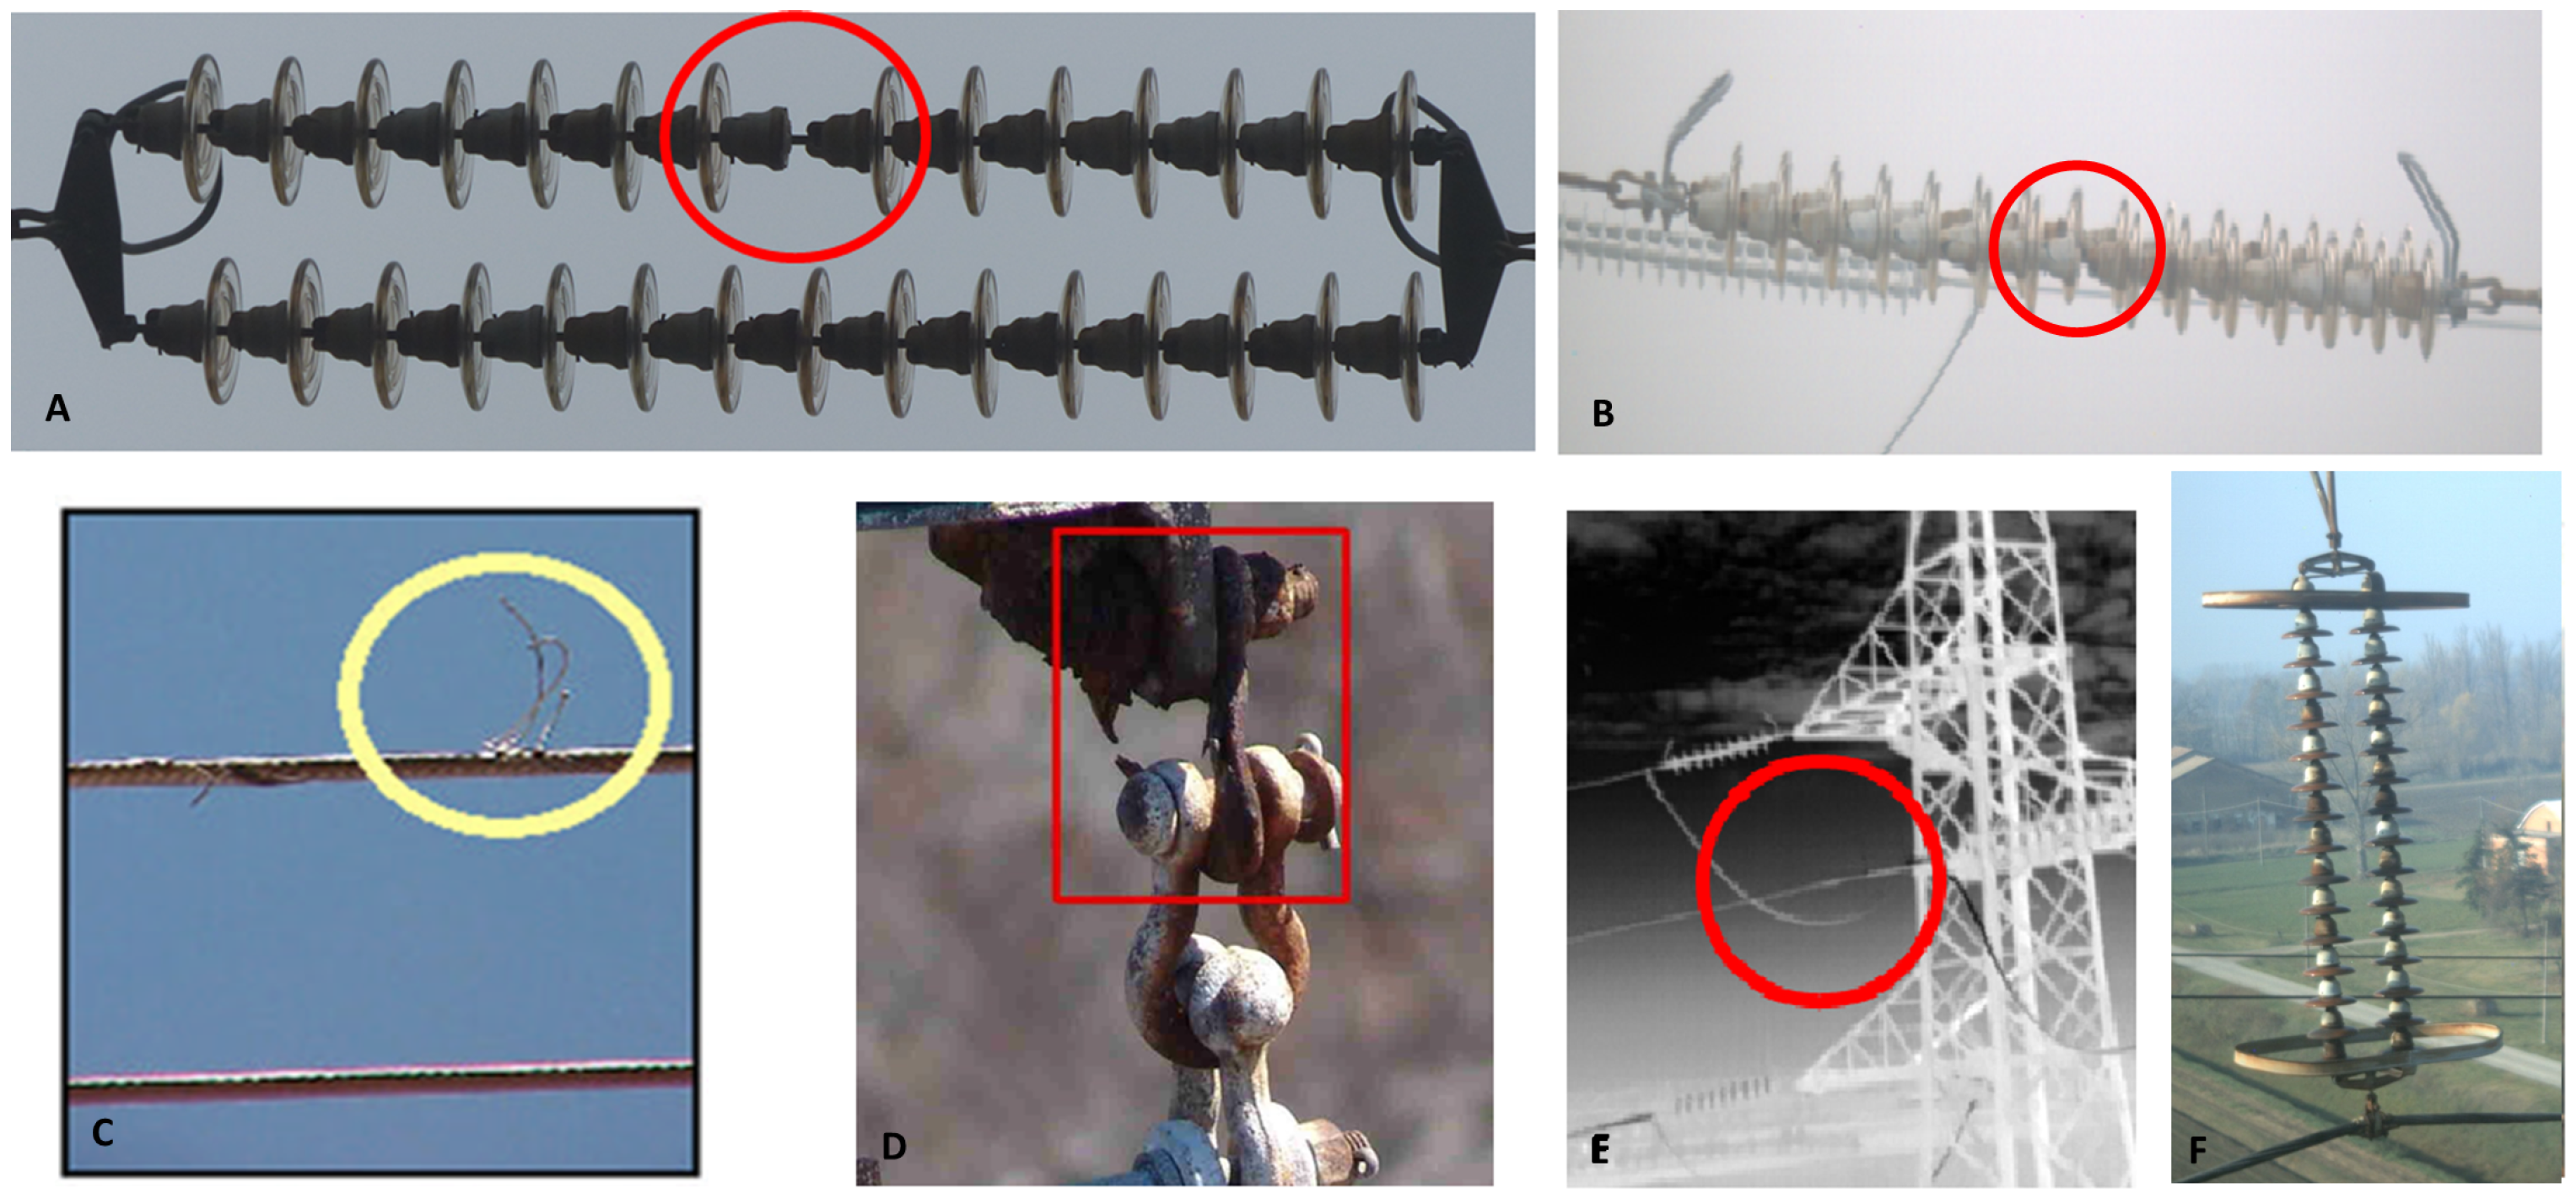
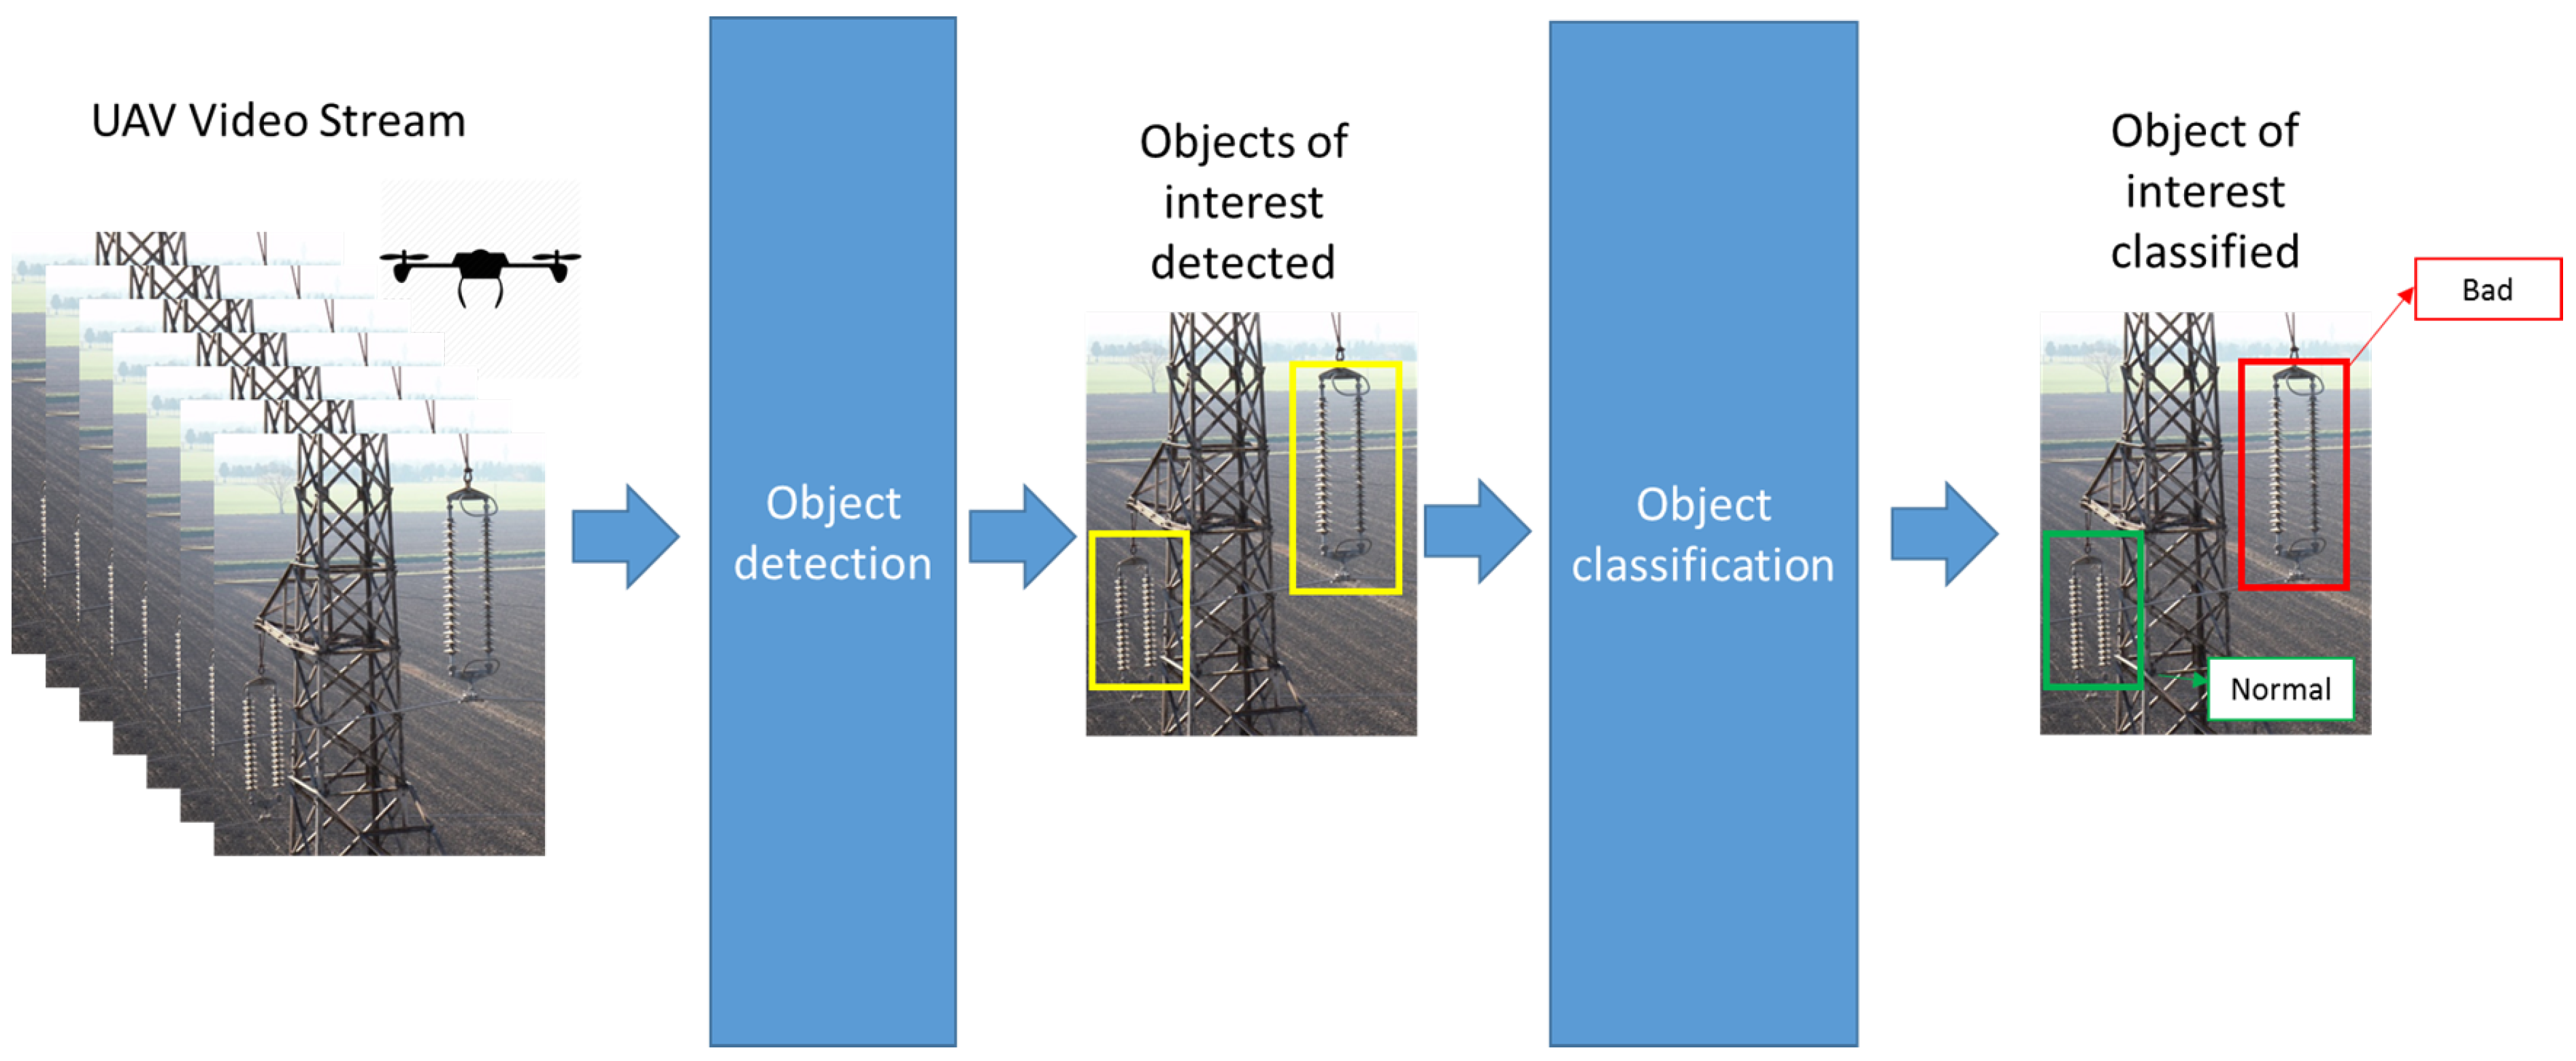
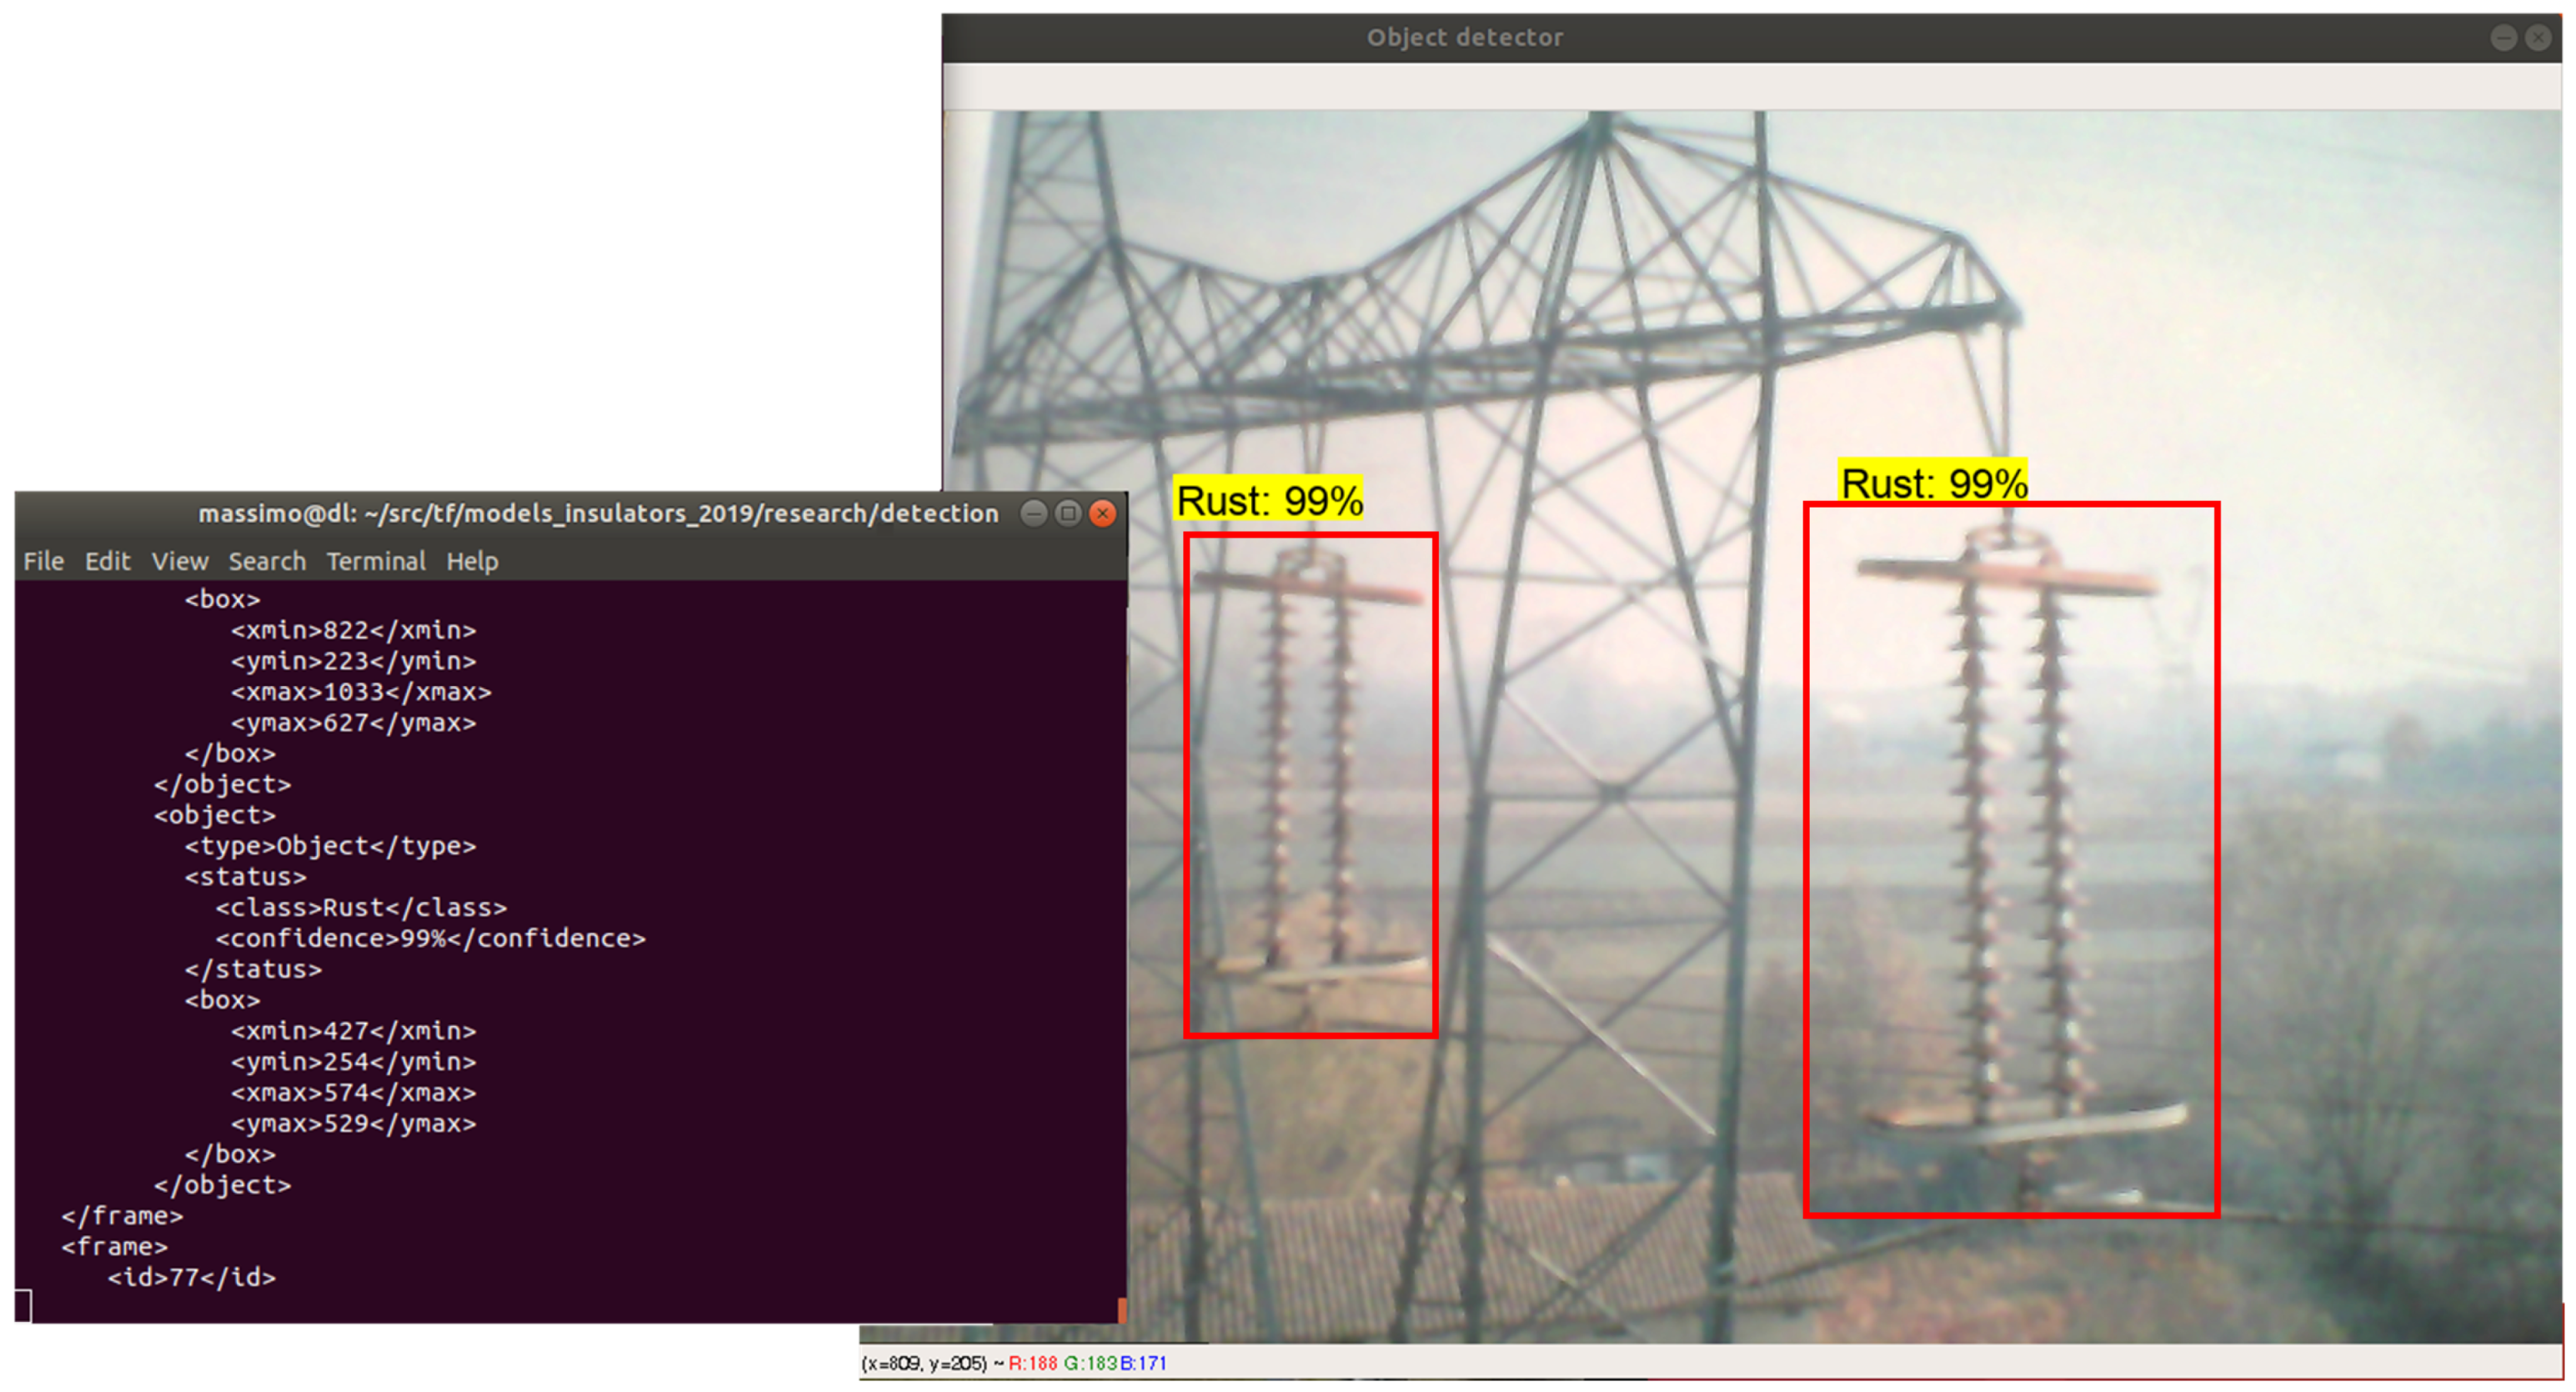
2.1. Insulators
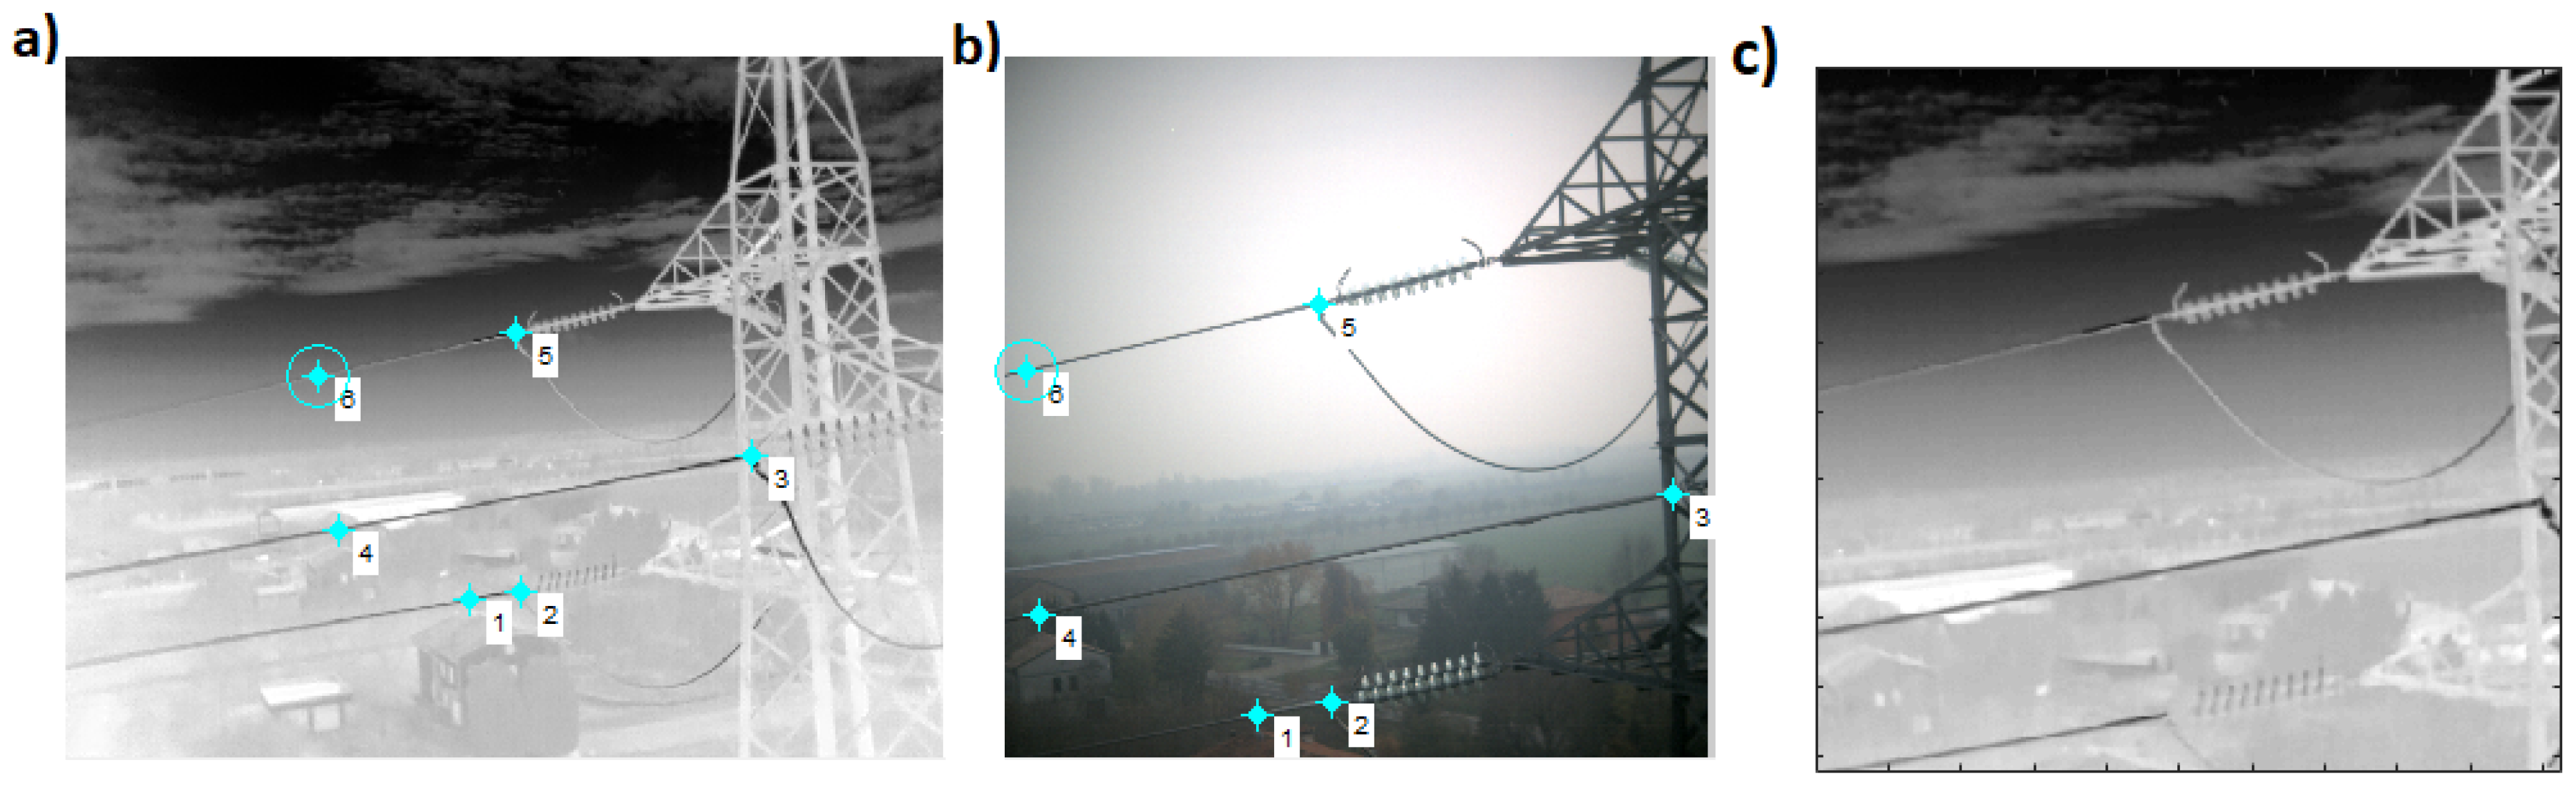
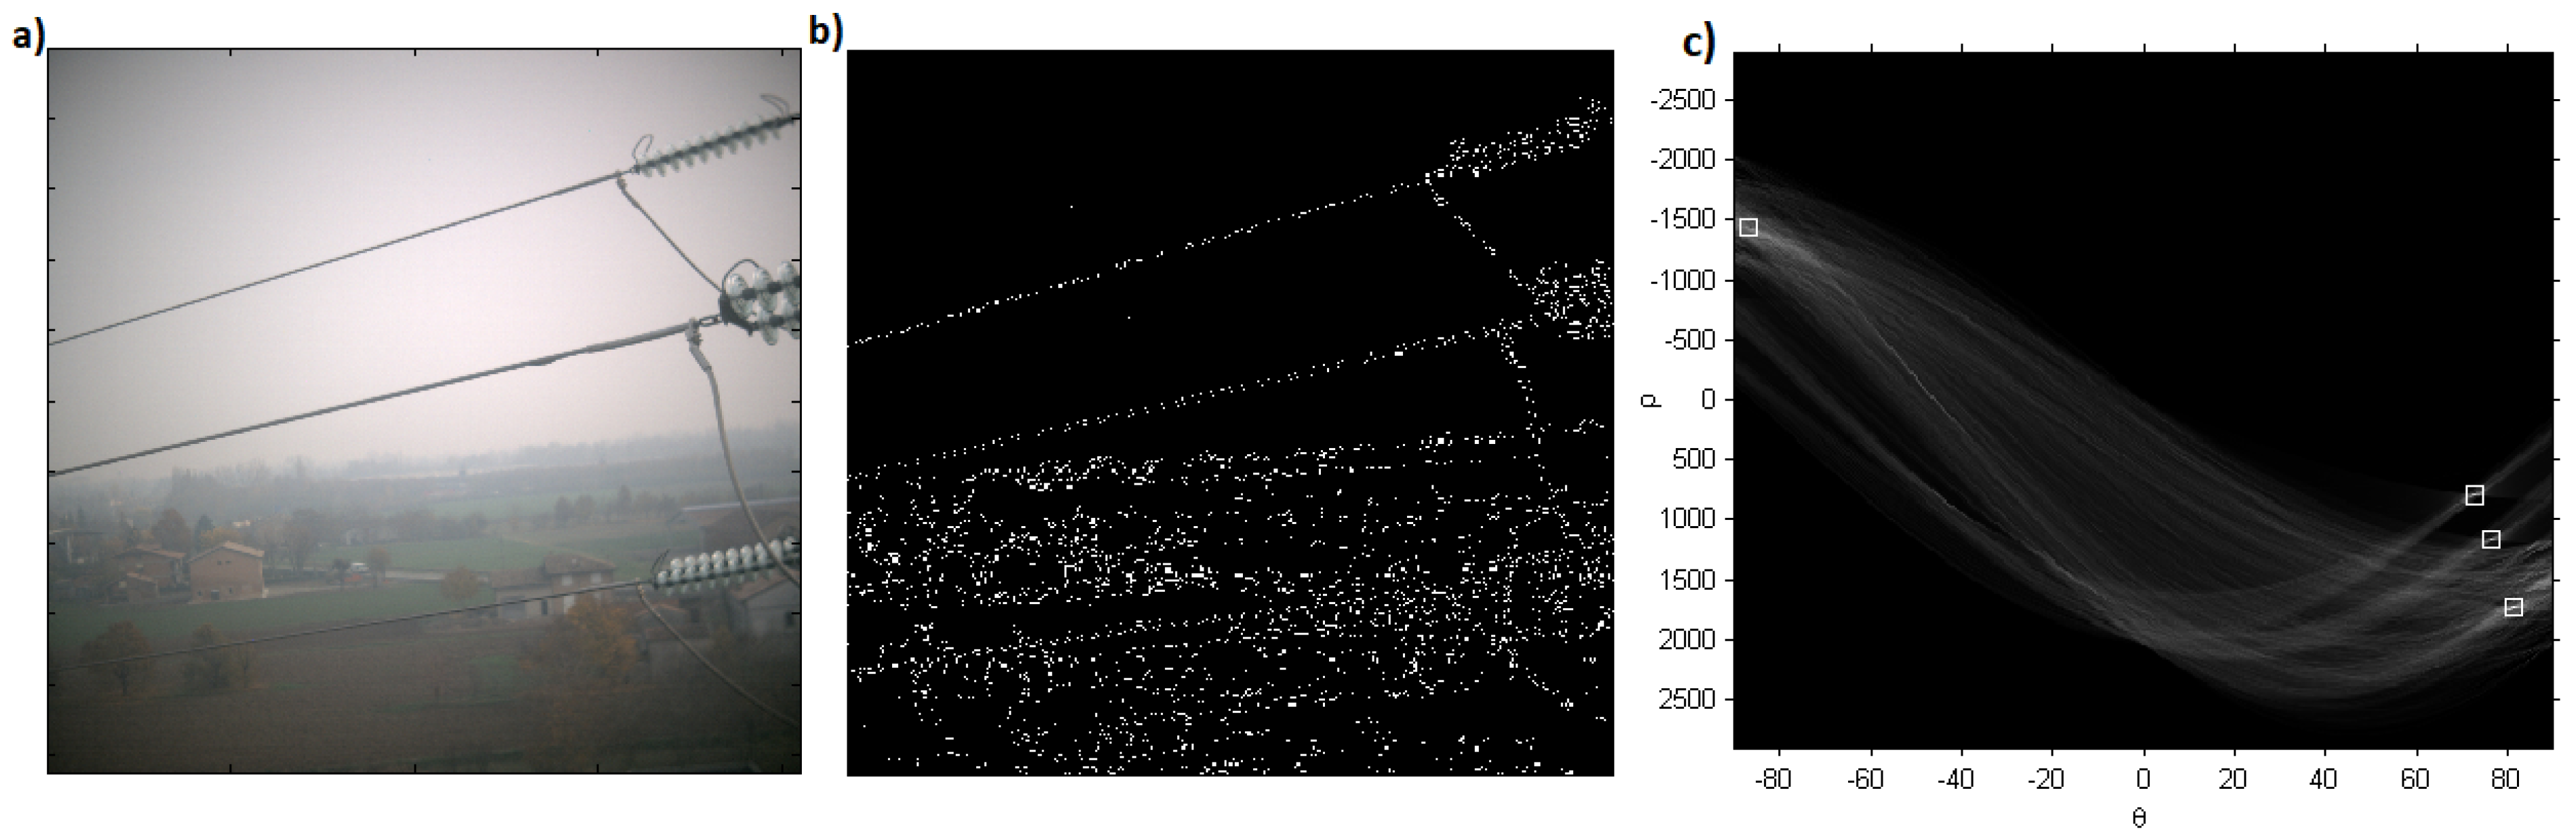
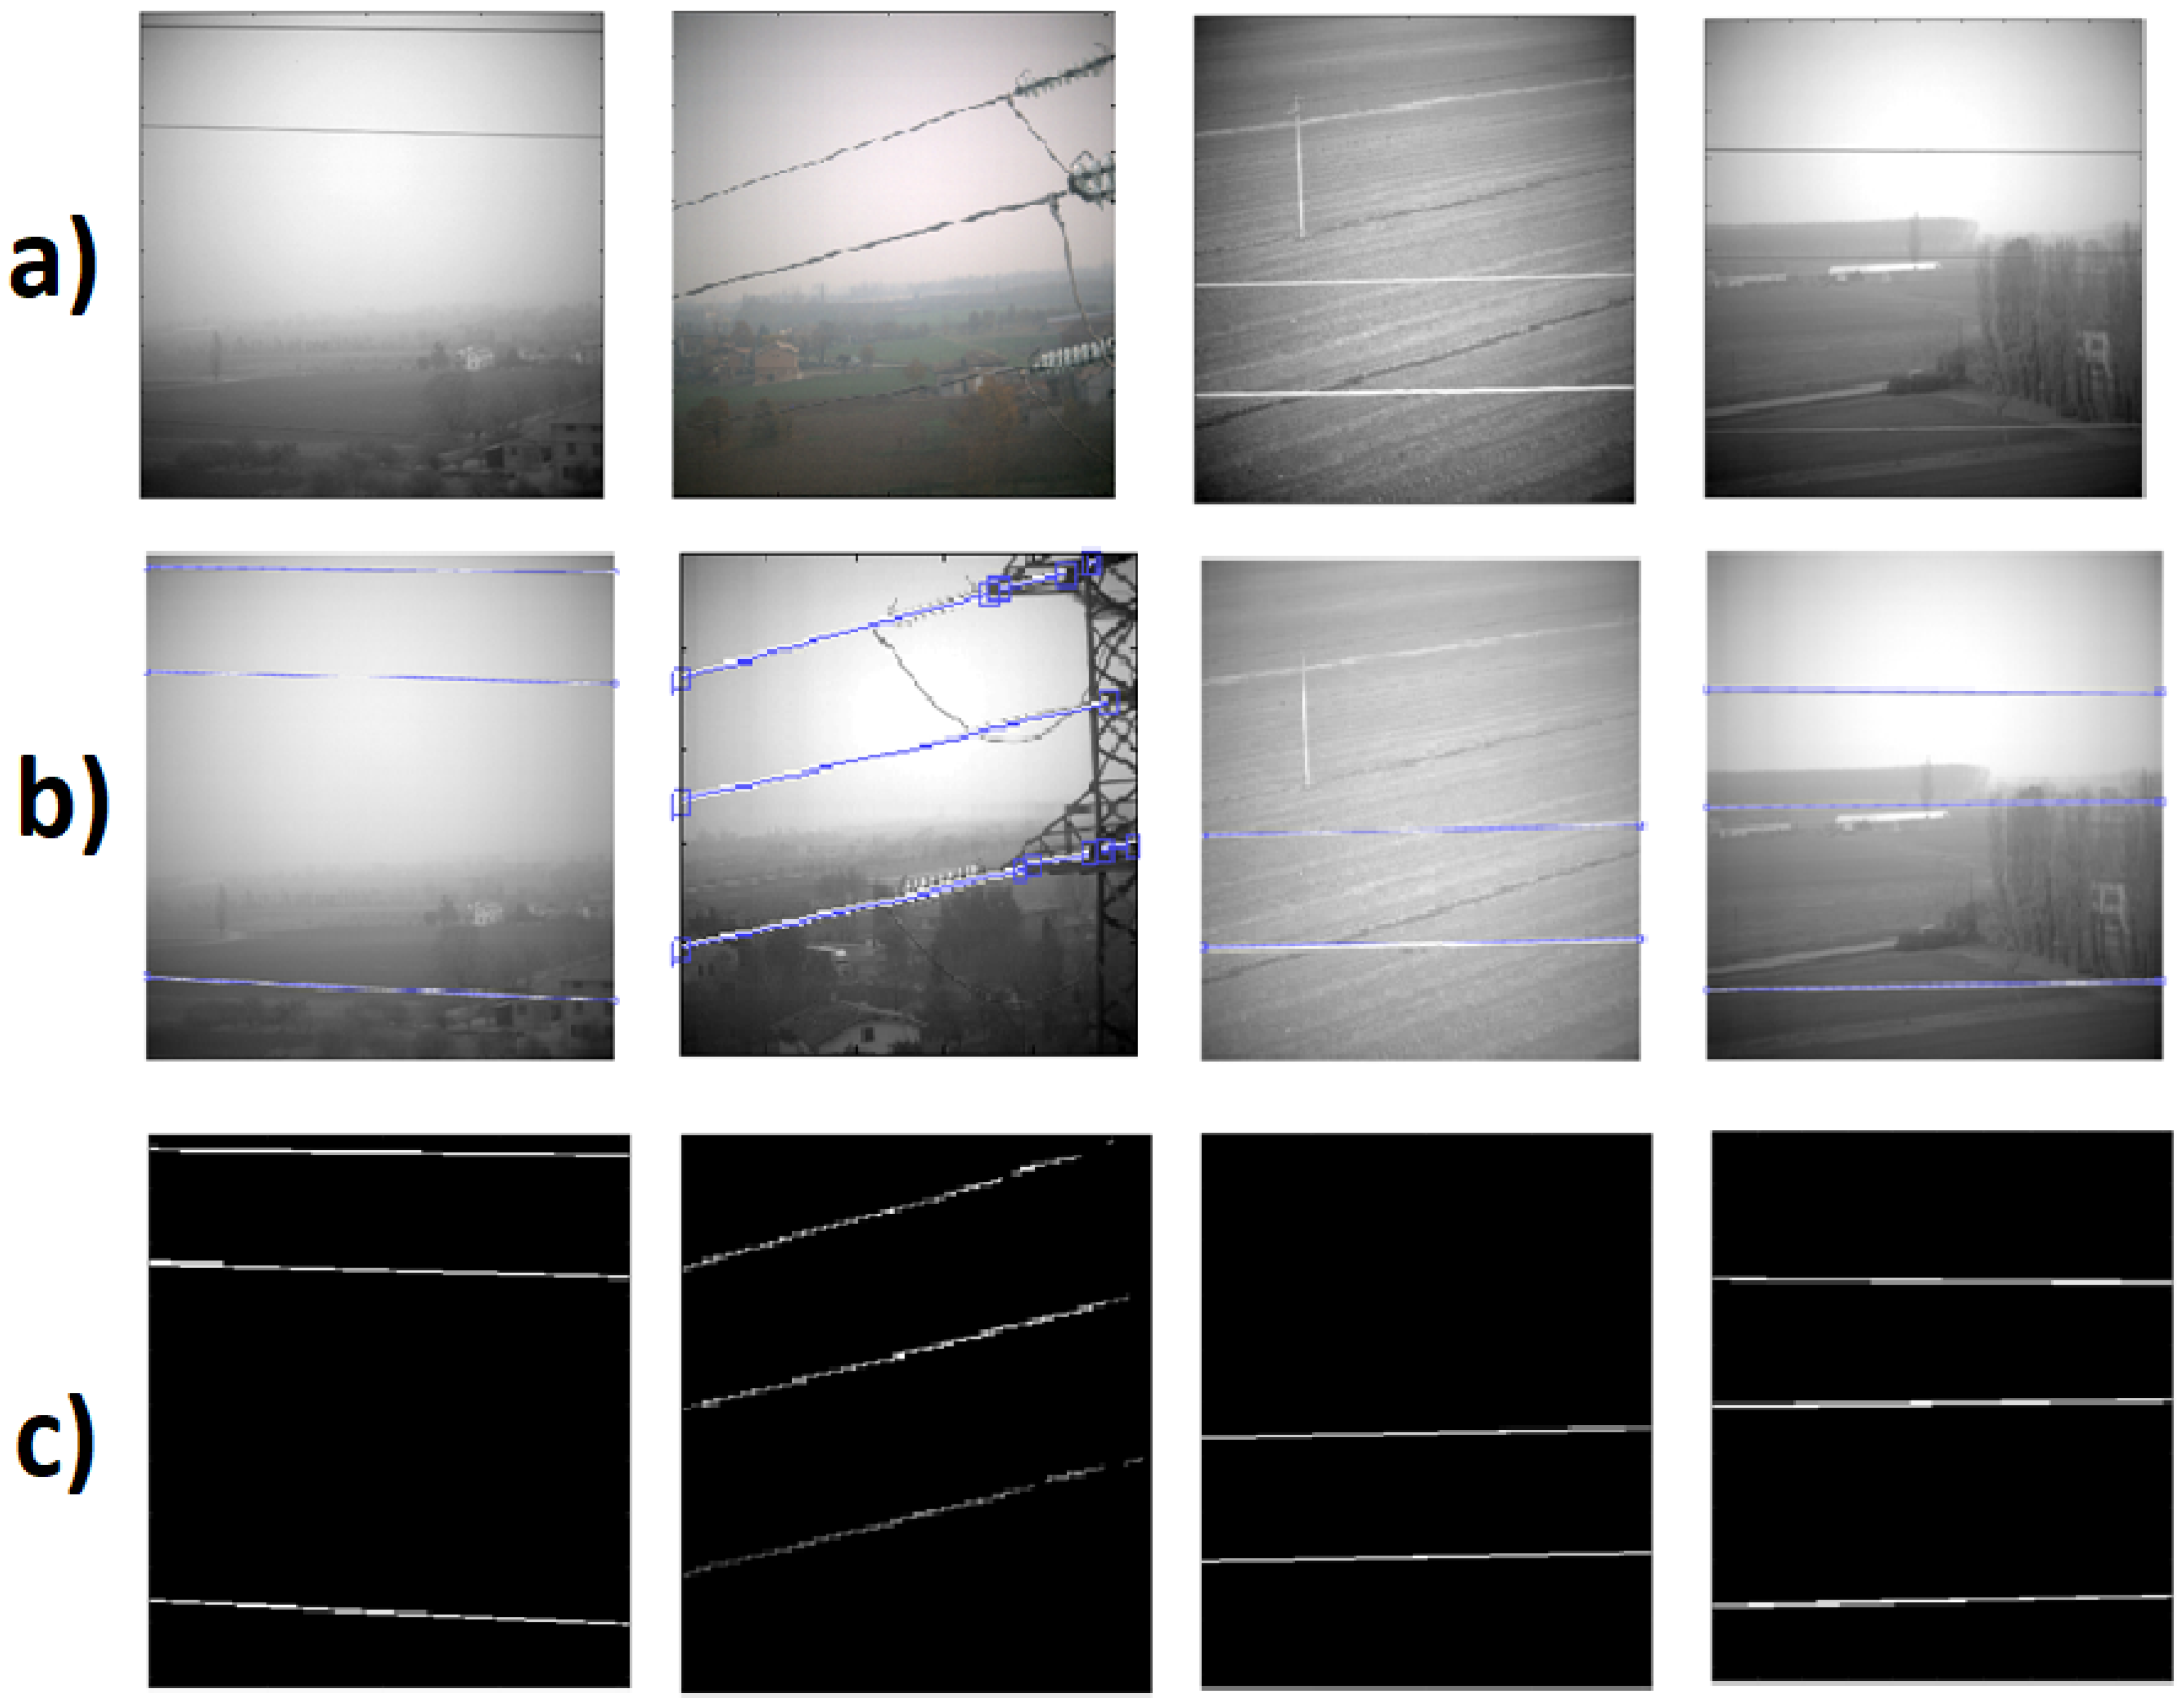
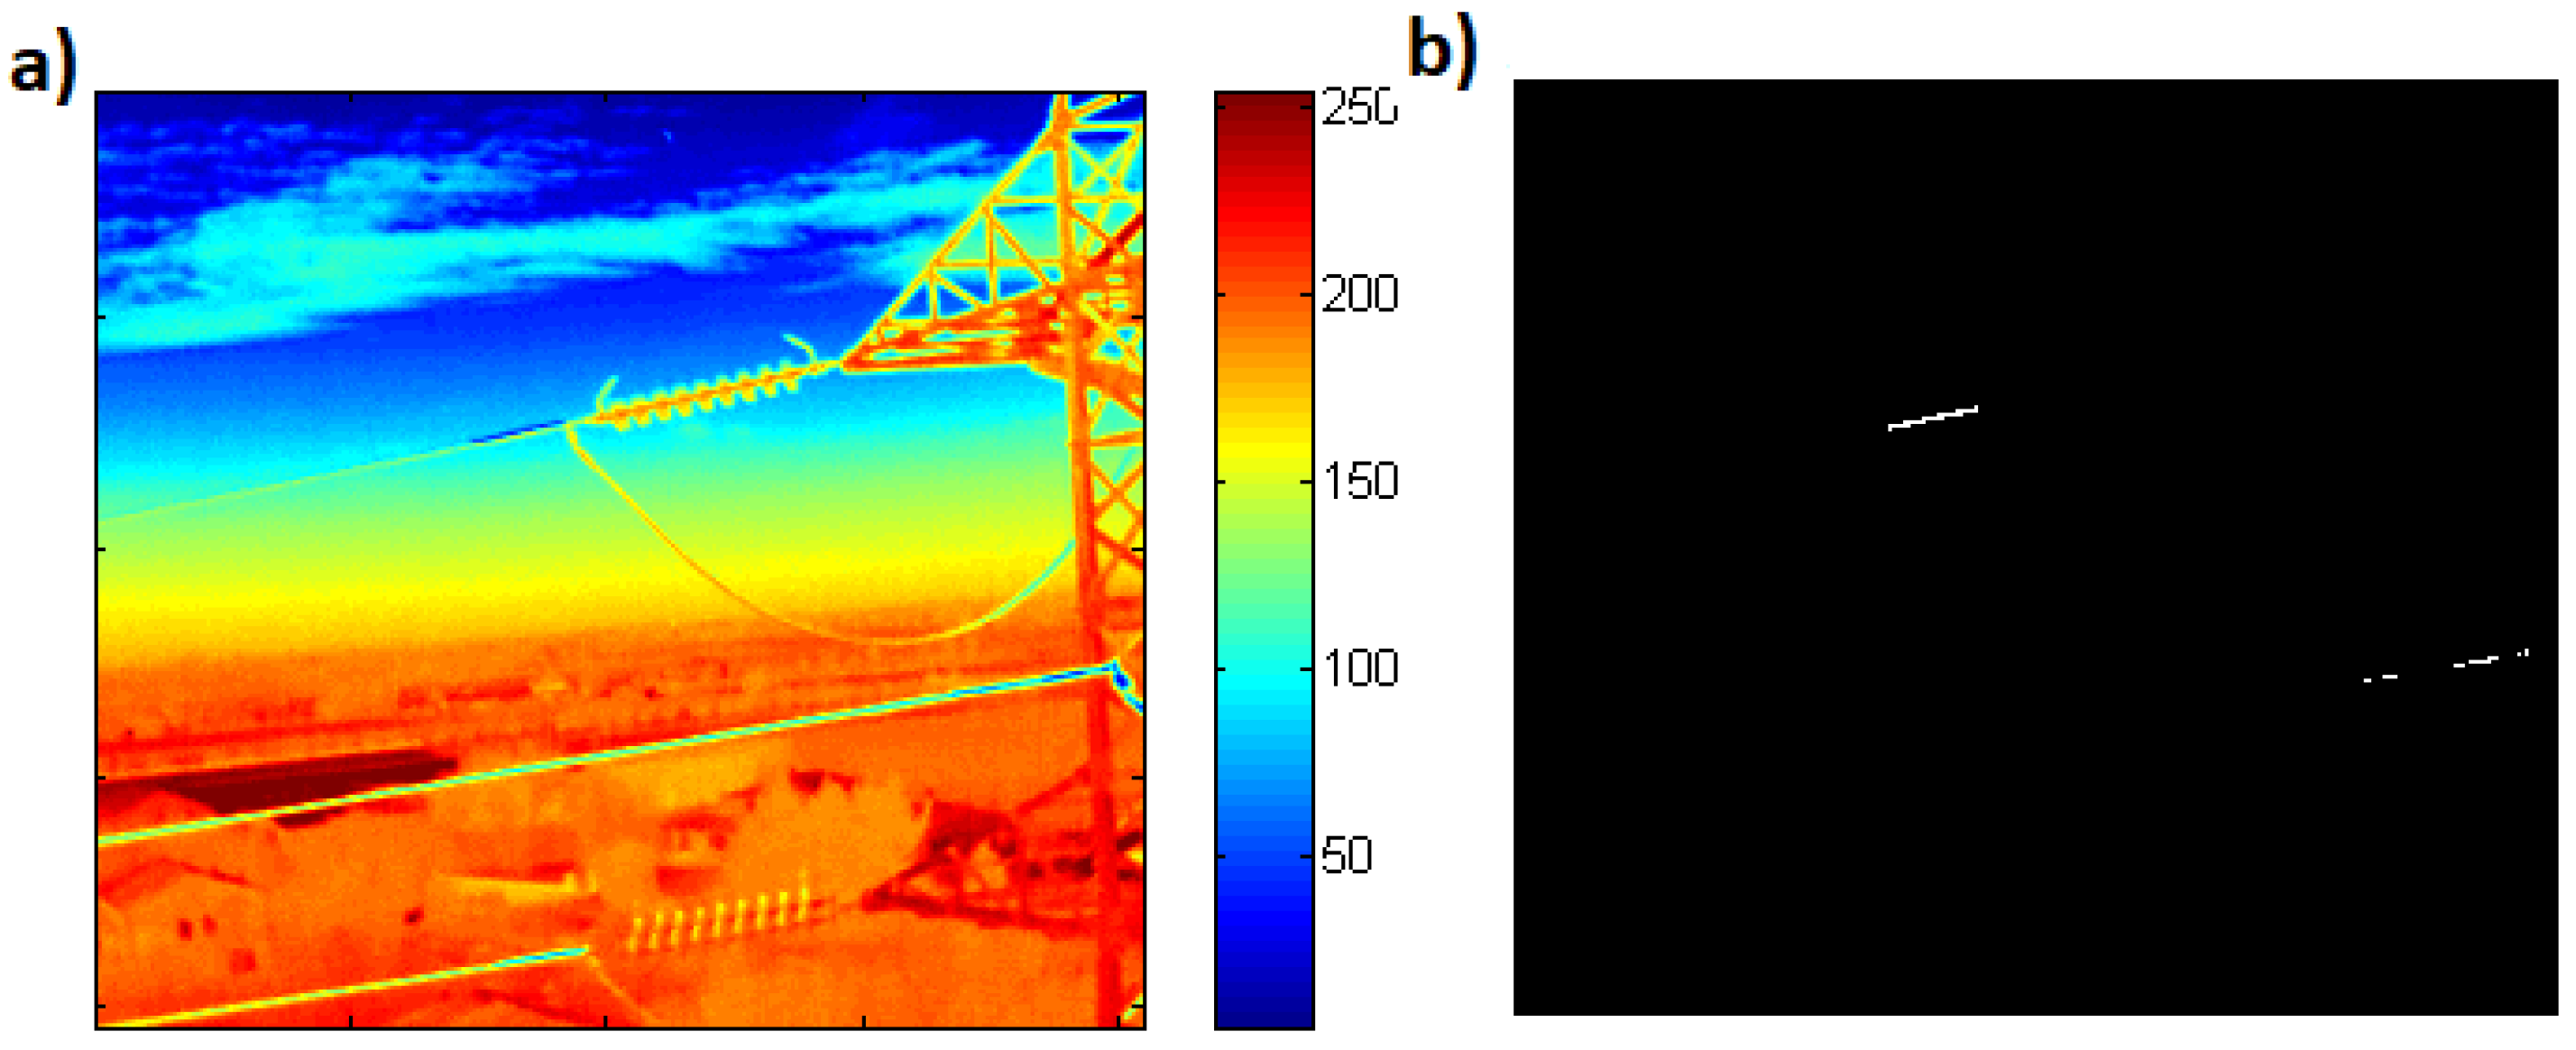
2.2. Power Lines
- Infrared and visible image-based fusion.
- Generation of edge map using Canny edge detector.
- Hough transform to detect lines in the images.
- Extraction of power lines.
- Identifying faults by thresholding.
3. Experimentation and Results
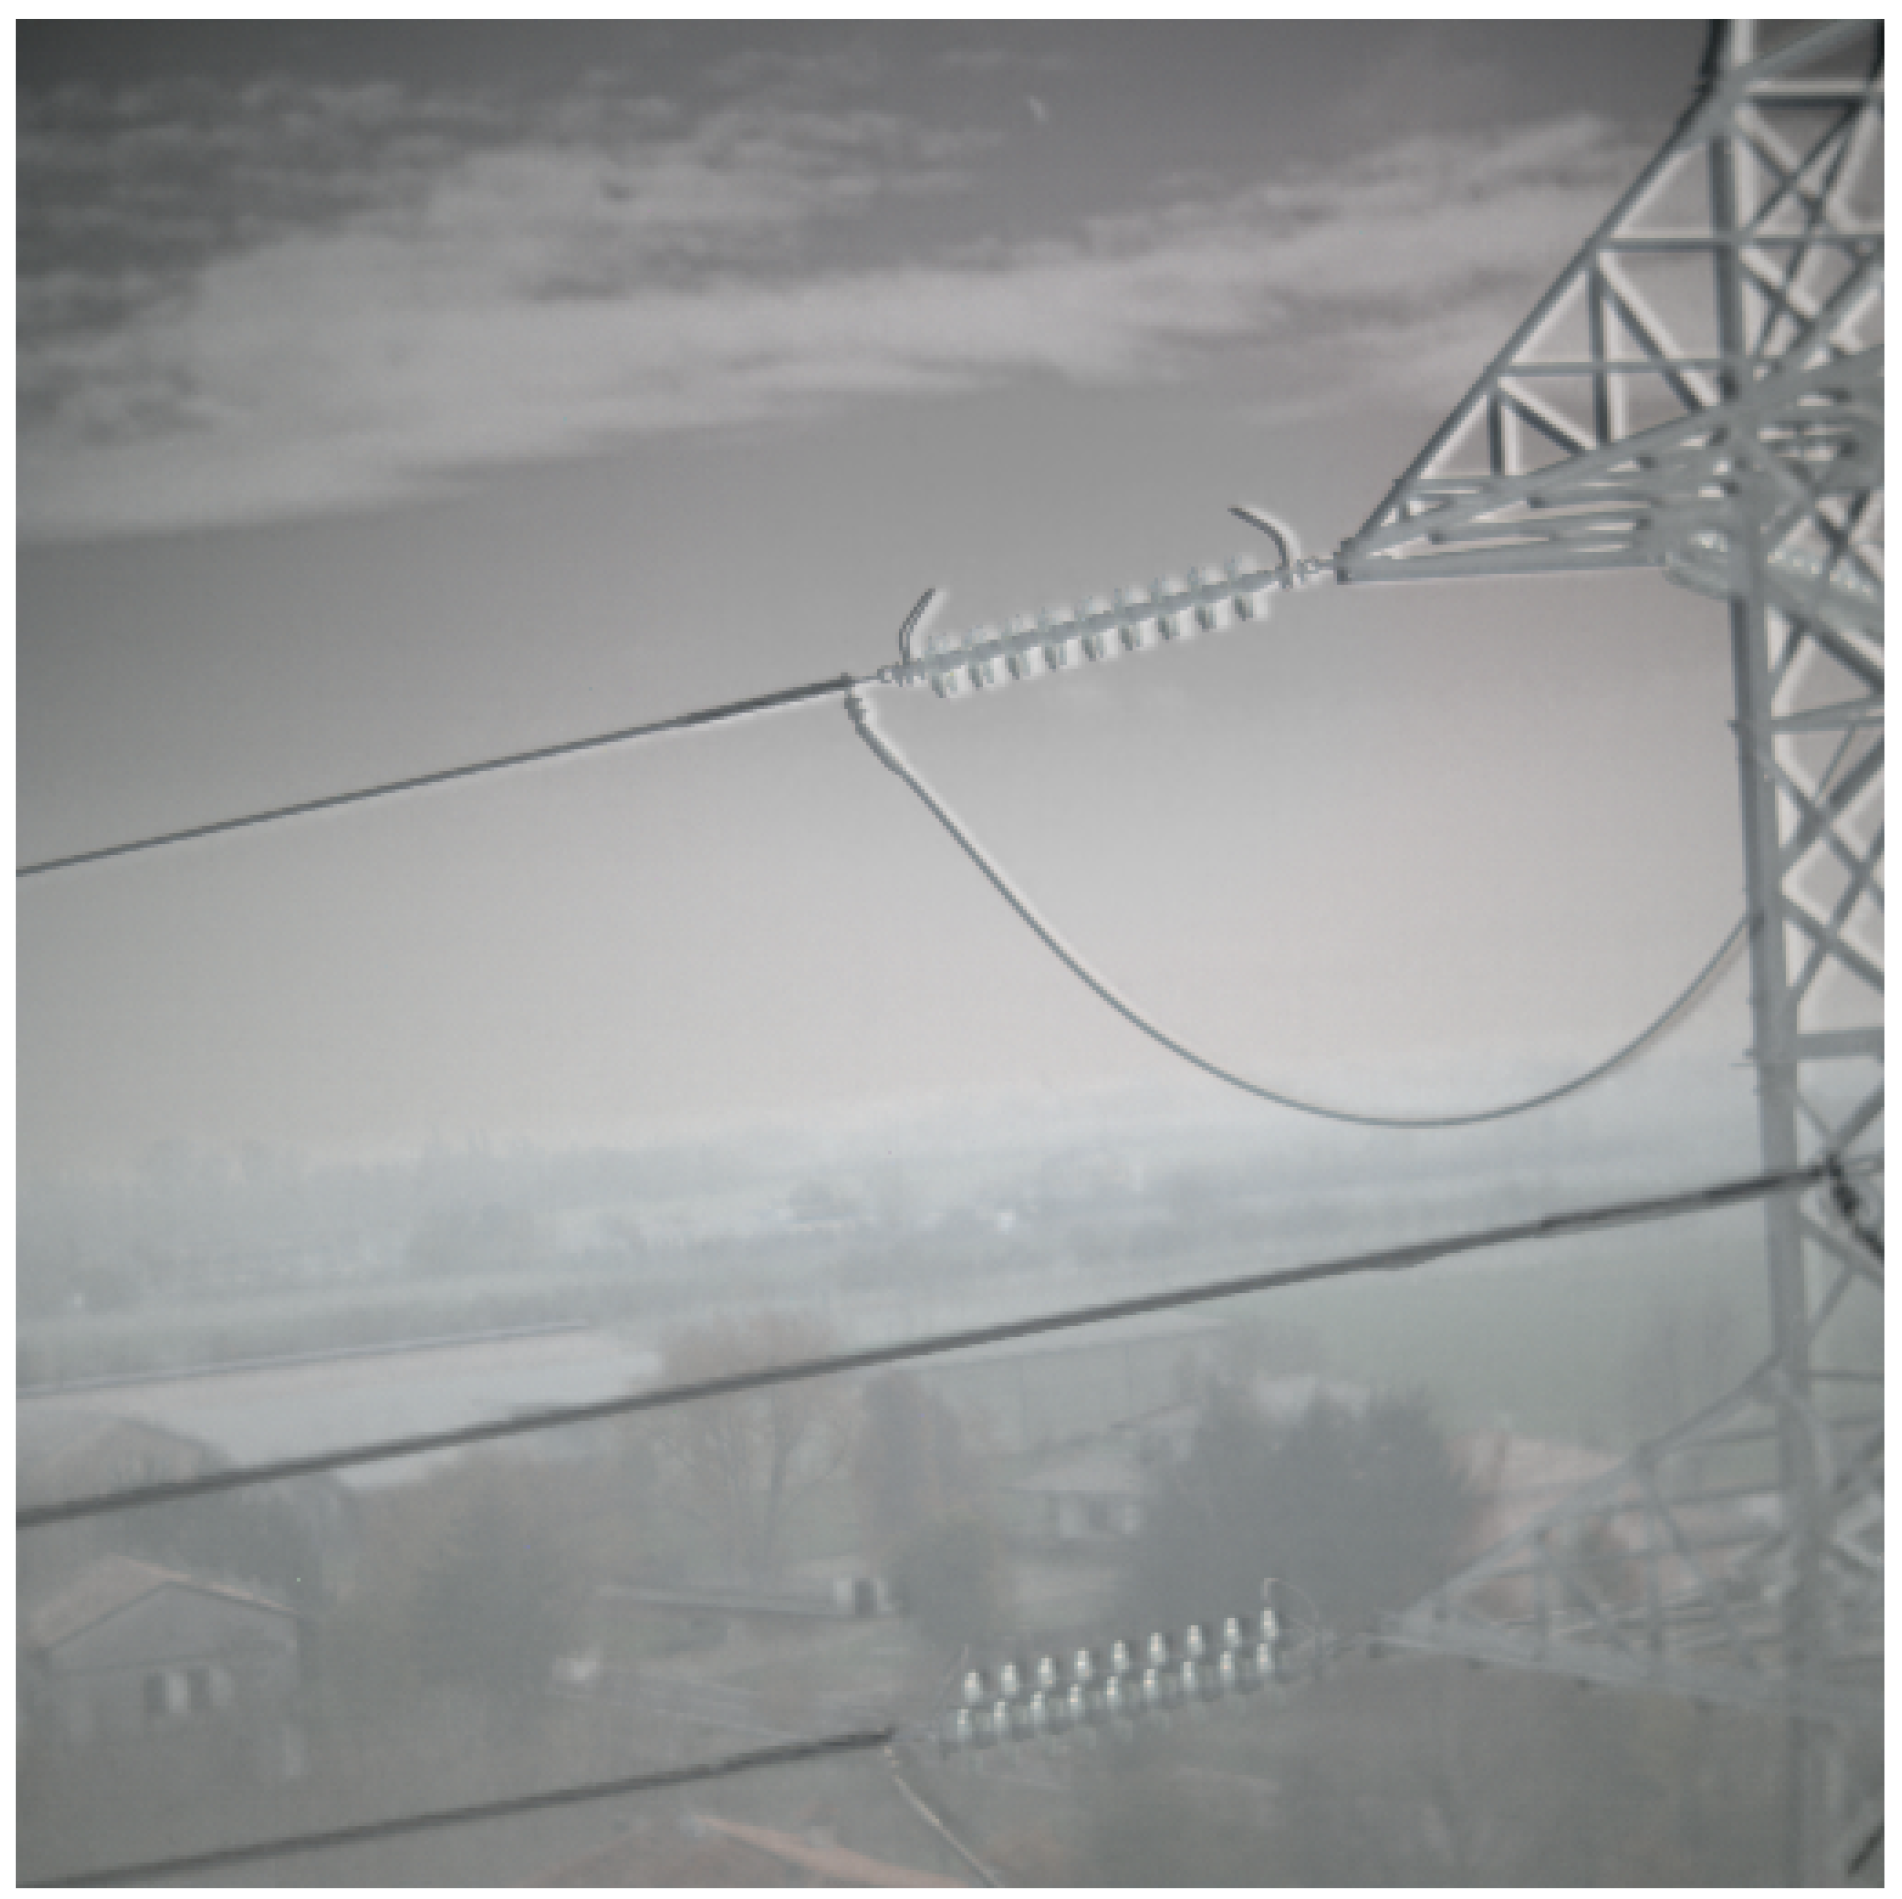
3.1. Data Acquisition
3.2. Classification of Insulator
- Train accuracy = 100.0%
- Validation accuracy = 90.9%
- Final test accuracy = 97.3%
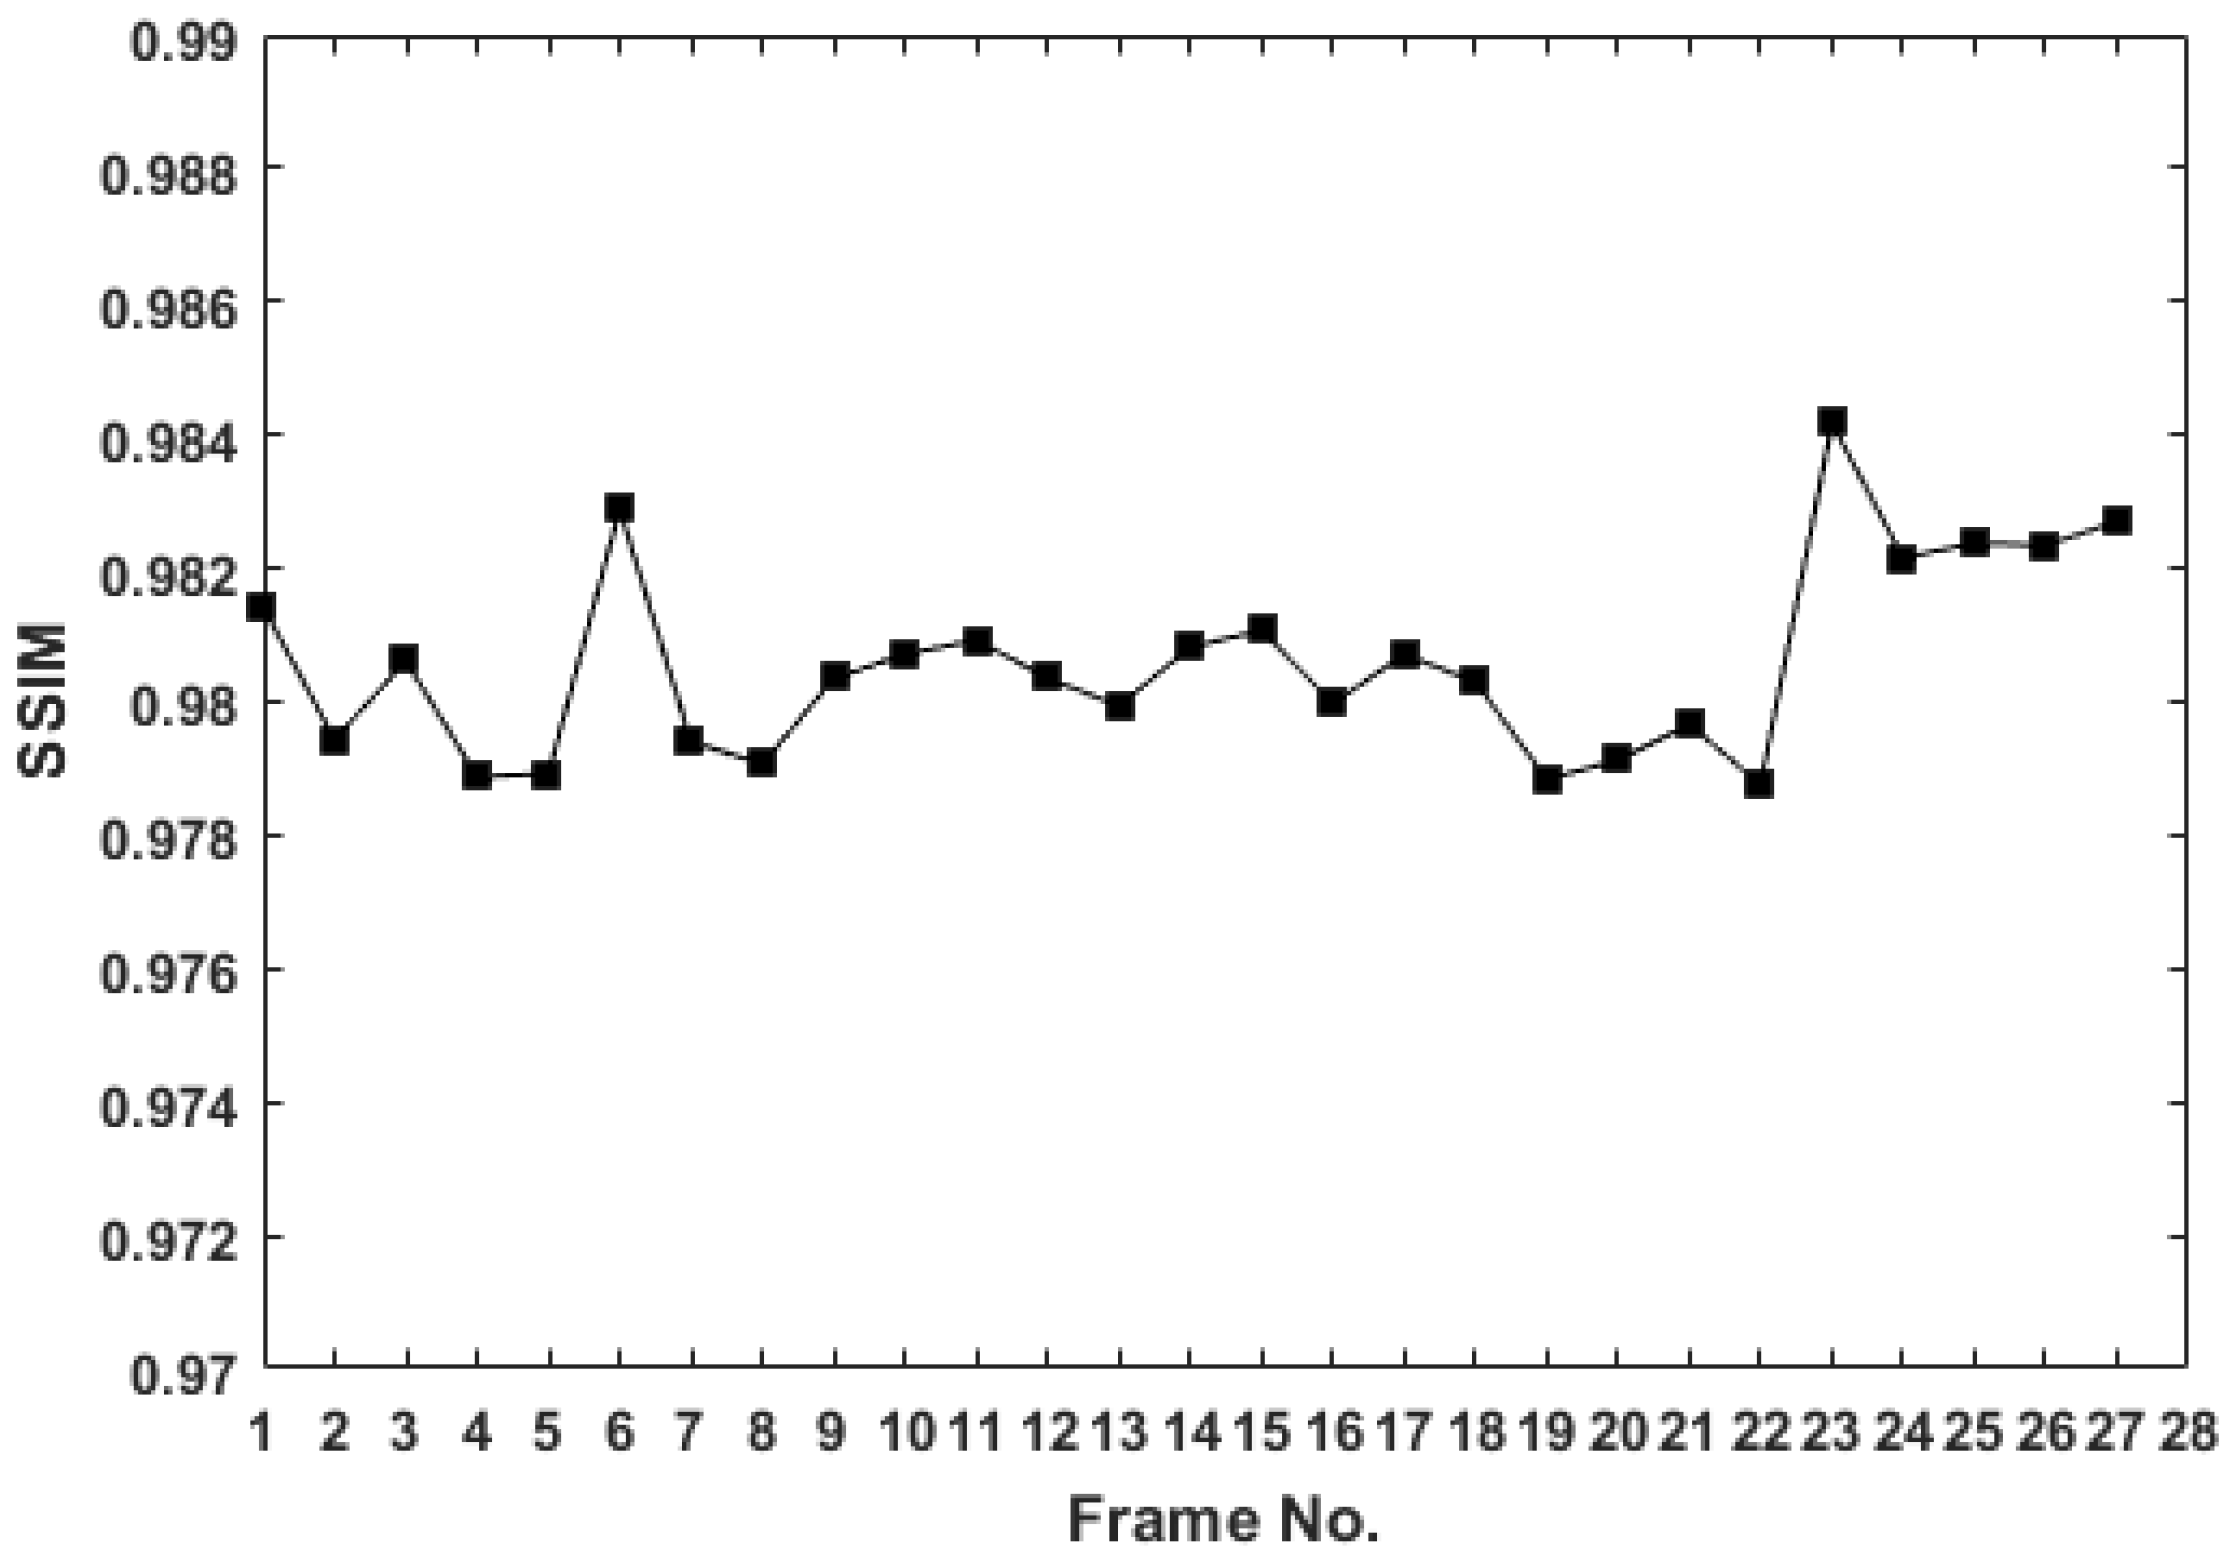
3.3. Power Lines Analysis
4. Discussion and Conclusions
Author Contributions
Funding
Acknowledgments
Conflicts of Interest
References
- Asiegbu, G.O.; Haidar, A.M.A.; Hawari, K. A Review of Defect Detection on Electrical Components Using Image Processing Technology. In Proceedings of the Fourth International Conference on Signal and Image Processing 2012 (ICSIP 2012); Lecture Notes in Electrical Engineering; Springer: New Delhi, India, 2013; Volume 221. [Google Scholar]
- Jadin, M.S.; Taib, S.; Kabir, S.; Yusof, M.A.B. Image Processing Methods for Evaluating Infrared Thermographic Image of Electrical Equipments. In Proceedings of the Progress in Electromagnetics Research Symposium Proceedings, Marrakesh, Morocco, 20–23 March 2011. [Google Scholar]
- Xie, X.; Liu, Z.; Xu, C.; Zhang, Y. A Multiple Sensors Platform Method for Power Line Inspection Based on a Large Unmanned Helicopter. Sensors 2017, 6, 1222. [Google Scholar] [CrossRef] [PubMed]
- Katrasnik, J.; Pernus, F.; Likar, B. A Survey of Mobile Robots for Distribution Power Line Inspection. IEEE Trans. Power Deliv. 2010, 25, 485–493. [Google Scholar] [CrossRef]
- Qin, X.; Wu, G.; Lei, J.; Fan, F.; Ye, X.; Mei, Q. A Novel Method of Autonomous Inspection for Transmission Line based on Cable Inspection Robot LiDAR Data. Sensors 2018, 18, 596. [Google Scholar] [CrossRef] [PubMed]
- Li, Z.; Liu, Y.; Walker, R.; Hayward, R.; Zhang, J. Towards automatic power line detection for a UAV surveillance system using pulse coupled neural filter and an improved Hough transform. Mach. Vis. Appl. 2010, 21, 677–686. [Google Scholar] [CrossRef]
- Candamo, J.; Kasturi, R.; Goldgof, D.; Sarkar, S. Detection of thin lines using low-quality video from low-altitude aircraft in urban settings. IEEE Trans. Aerosp. Electron. Syst. 2009, 45, 937–949. [Google Scholar] [CrossRef]
- Jalil, B.; Moroni, D.; Pascali, M.; Salvetti, O. Multimodal image analysis for power line inspection. In Proceedings of the International Conference on Pattern Recognition and Artificial Intelligence, Montreal, QC, Canada, 13–17 May 2018. [Google Scholar]
- Mirallès, F.; Pouliot, N.; Montambault, S. State-of-the-art review of computer vision for the management of power transmission lines. In Proceedings of the 2014 3rd International Conference on Applied Robotics for the Power Industry (CARPI), Foz do Iguassu, Brazil, 14–16 October 2014; pp. 1–6. [Google Scholar]
- Zhang, J.; Liu, L.; Wang, B.; Chen, X.; Wang, Q.; Zheng, T. High speed automatic power line detection and tracking for a UAV-based inspection. In Proceedings of the 2012 International Conference on Industrial Control and Electronics Engineering (ICICEE), Xi’an, China, 23–25 August 2012; pp. 266–269. [Google Scholar]
- Sampedro, C.; Martinez, C.; Chauhan, A.; Campoy, P. A supervised approach to electric tower detection and classification for power line inspection. In Proceedings of the 2014 International Joint Conference on Neural Networks (IJCNN), Beijing, China, 6–11 July 2014; pp. 1970–1977. [Google Scholar]
- Wronkowicz, A. Vision Diagnostics of Power Transmission Lines: Approach to Recognition of Insulators. In Proceedings of the 9th International Conference on Computer Recognition Systems CORES 2015, Wroclaw, Poland, 25–27 May 2015; Springer: Cham, Switzerland, 2016; pp. 431–440. [Google Scholar]
- Yan, T.; Yang, G.; Yu, J. Feature fusion based insulator detection for aerial inspection. In Proceedings of the 2017 36th Chinese Control Conference (CCC), Dalian, China, 26–28 July 2017; pp. 10972–10977. [Google Scholar]
- Zhao, Z.; Liu, N. The recognition and localization of insulators adopting SURF and IFS based on correlation coefficient. Opt. Int. J. Light Electron Opt. 2014, 125, 6049–6052. [Google Scholar] [CrossRef]
- Zhao, Z.; Liu, N.; Wang, L. Localization of multiple insulators by orientation angle detection and binary shape prior knowledge. IEEE Trans. Dielectr. Electr. Insul. 2015, 22, 3421–3428. [Google Scholar] [CrossRef]
- Zhao, Z.; Xu, G.; Qi, Y.; Liu, N.; Zhang, T. Multi-patch deep features for power line insulator status classification from aerial images. In Proceedings of the 2016 International Joint Conference on Neural Networks, IJCNN 2016, Vancouver, BC, Canada, 24–29 July 2016; pp. 3187–3194. [Google Scholar]
- Liu, Y.; Yong, J.; Liu, L.; Zhao, J.; Li, Z. The method of insulator recognition based on deep learning. In Proceedings of the 2016 4th International Conference on Applied Robotics for the Power Industry (CARPI), Jinan, China, 11–13 October 2016; pp. 1–5. [Google Scholar]
- Levinshtein, A.; Stere, A.; Kutulakos, K.N.; Fleet, D.J.; Dickinson, S.J.; Siddiqi, K. TurboPixels: Fast Superpixels Using Geometric Flows. IEEE Trans. Pattern Anal. Mach. Intell. 2009, 31, 2290–2297. [Google Scholar] [CrossRef] [PubMed]
- Zitnick, C.L.; Dollár, P. Edge Boxes: Locating Object Proposals from Edges. In Proceedings of the European Conference on Computer Vision, ECCV 2014, Zurich, Switzerland, 6–12 September 2014; Fleet, D., Pajdla, T., Schiele, B., Tuytelaars, T., Eds.; Springer International Publishing: Cham, Switzerland, 2014; pp. 391–405. [Google Scholar]
- Ren, S.; He, K.; Girshick, R.; Sun, J. Faster R-CNN: Towards Real-Time Object Detection with Region Proposal Networks. In Advances in Neural Information Processing Systems 28; Cortes, C., Lawrence, N.D., Lee, D.D., Sugiyama, M., Garnett, R., Eds.; Curran Associates, Inc.: Red Hook, NY, USA, 2015; pp. 91–99. [Google Scholar]
- Ren, S.; He, K.; Girshick, R.; Sun, J. Faster R-CNN: Towards Real-Time Object Detection with Region Proposal Networks. IEEE Trans. Pattern Anal. Mach. Intell. 2017, 39, 1137–1149. [Google Scholar] [CrossRef] [PubMed]
- Uijlings, J.; van de Sande, K.; Gevers, T.; Smeulders, A. Selective Search for Object Recognition. Int. J. Comput. Vis. 2013, 104, 154–171. [Google Scholar] [CrossRef]
- Abadi, M.; Barham, P.; Chen, J.; Chen, Z.; Davis, A.; Dean, J.; Devin, M.; Ghemawat, S.; Irving, G.; Isard, M.; et al. TensorFlow: A System for Large-Scale Machine Learning. In Proceedings of the 12th USENIX Symposium on Operating Systems Design and Implementation (OSDI 16), Savannah, GA, USA, 2–4 November 2016; Volume 16, pp. 265–283. [Google Scholar]
- Lin, T.Y.; Maire, M.; Belongie, S.; Hays, J.; Perona, P.; Ramanan, D.; Dollár, P.; Zitnick, C.L. Microsoft COCO: Common objects in context. In Proceedings of the European Conference on Computer Vision, Zurich, Switzerland, 6–12 September 2014; Springer: Cham, Switzerland, 2014; pp. 740–755. [Google Scholar]
- Li, H.; Wang, B.; Li, L. Research on the infrared and visible power-equipment image fusion for inspection robots. In Proceedings of the 2010 1st International Conference on Applied Robotics for the Power Industry (CARPI), Montreal, QC, Canada, 5–7 October 2010; pp. 1–5. [Google Scholar]
- Larrauri, J.I.; Sorrosal, G.; González, M. Automatic system for overhead power line inspection using an Unmanned Aerial Vehicle—RELIFO project. In Proceedings of the 2013 International Conference on Unmanned Aircraft Systems (ICUAS), Atlanta, GA, USA, 28–31 May 2013; pp. 244–252. [Google Scholar]
- Otsu, N. A threshold selection method from gray-level histograms. IEEE Trans. Syst. Man Cybern. 1979, 9, 62–66. [Google Scholar] [CrossRef]
- De Oliveira, J.H.E.; Lages, W.F. Robotized inspection of power lines with infrared vision. In Proceedings of the 2010 1st International Conference on Applied Robotics for the Power Industry (CARPI), Montreal, QC, Canada, 5–7 October 2010; pp. 1–6. [Google Scholar]
- Liu, X.Z.; Tian, Z.; Wen, J.H.; Wu, J.M.; Zhang, Z.Y. SAR image registration based on affine invariant SIFT features. Opto-Electron. Eng. 2010, 37, 121–127. [Google Scholar] [CrossRef]
- Kim, K. Survey on Registration Techniques of Visible and Infrared Images. IT Converg. Pract. 2015, 3, 25–35. [Google Scholar]
- Hines, G. Multi-Image Registration for an Enhanced Vision System. Proc. SPIE 2013, 5108, 231–241. [Google Scholar]
- Canny, J. A computational approach to edge detection. IEEE Trans. Pattern Anal. Mach. Intell. 1986, PAMI-8, 679–698. [Google Scholar] [CrossRef]
- Hough, P.V.C. Method and Means for Recognizing Complex Patterns. U.S. Patent 3,069,654, 18 December 1962. [Google Scholar]


| Image | Error | SSIM | Time (s) | |
|---|---|---|---|---|
| Test 7 (Cluttered Background) | 1.32 | 0.973 | 0.993 | 2.5 |
| Test 6 (Non-cluttered Background) | 0.98 | 0.997 | 0.994 | 3 |
| Test 5 (Semi-cluttered Background) | 0.44 | 0.971 | 0.972 | 3.1 |
| Test 4 (Non-cluttered Background) | 0.14 | 0.993 | 0.969 | 2.7 |
| Test 3 (Non-cluttered Background) | 0.14 | 0.976 | 0.954 | 3.9 |
© 2019 by the authors. Licensee MDPI, Basel, Switzerland. This article is an open access article distributed under the terms and conditions of the Creative Commons Attribution (CC BY) license (http://creativecommons.org/licenses/by/4.0/).
Share and Cite
Jalil, B.; Leone, G.R.; Martinelli, M.; Moroni, D.; Pascali, M.A.; Berton, A. Fault Detection in Power Equipment via an Unmanned Aerial System Using Multi Modal Data. Sensors 2019, 19, 3014. https://doi.org/10.3390/s19133014
Jalil B, Leone GR, Martinelli M, Moroni D, Pascali MA, Berton A. Fault Detection in Power Equipment via an Unmanned Aerial System Using Multi Modal Data. Sensors. 2019; 19(13):3014. https://doi.org/10.3390/s19133014
Chicago/Turabian StyleJalil, Bushra, Giuseppe Riccardo Leone, Massimo Martinelli, Davide Moroni, Maria Antonietta Pascali, and Andrea Berton. 2019. "Fault Detection in Power Equipment via an Unmanned Aerial System Using Multi Modal Data" Sensors 19, no. 13: 3014. https://doi.org/10.3390/s19133014
APA StyleJalil, B., Leone, G. R., Martinelli, M., Moroni, D., Pascali, M. A., & Berton, A. (2019). Fault Detection in Power Equipment via an Unmanned Aerial System Using Multi Modal Data. Sensors, 19(13), 3014. https://doi.org/10.3390/s19133014