1. Introduction
Multiple input multiple output (MIMO) radar is the radar which can transmit multiple orthogonal signals and then receive them together to get multi-dimensional information. In order to obtain the properties of high range resolution and weak target detection, the corresponding waveform should be designed with a wider bandwidth and lower autocorrelation sidelobe peaks (ASP) than before. In addition, the cross-correlation peaks (CP) between each two waveforms need to be reduced to satisfy the orthogonality of the MIMO radar signals.
Traditionally, multiple sub-bandwidth approaches were divided to obtain the orthogonality among signals, which left limited bandwith and insufficient bandwidth for each signal. The orthogonal frequency division multiplexing (OFDM) signal was first proposed in the radar system to fully utilize the bandwidth for high range resolution [
1]. The OFDM signal suggests low mutual interference between nearby radar instruments which is verified by the ambiguity function. For the advantage and widespread use of OFDM signals, numerous new techniques were generated. Under uniform circular array (UCA) and near-field conditions, the OFDM signal was combined to design a closed-form algorithm for localization [
2]. A time and code OFDM algorithm was proposed to solve the large residual carrier errors existing in complex indoor environments [
3]. Literature [
4] designed a mutual-information OFDM waveform based on MIMO radar for low-grazing angle tracking and achieved performance improvements verified by realistic physical modeling due to adaptive OFDM waveform design. During different environments, there are many different spectrum sensing methods for OFDM signals proposed in [
5,
6,
7,
8], which improved the detection application of OFDM signals. Based on the orthogonality of it, OFDM signal was revised to complete micro-doppler estimation and the detection in frequency-selective fading channels [
9,
10]. In the application of passive radar signal processing, OFDM waveforms were chosen for being easily decoded to acquire a noise-free signal [
11]. Moreover, the OFDM signal was used to raise the resolution, due to its high range resolution, and was investigated for range ambiguity suppression for its diversity superiority in synthetic aperture radar (SAR) images [
12,
13]. In addition, [
14,
15,
16] completed the simulation and implementation of it in SAR.
Based on intrapulse radar-embedded communications, new waveforms were designed for covert and multiple target optimization, where the design criterion of the constrained maximization of the signal-to-interference ratio and constrained minimization of a suitable correlation index improve the signal detection performance [
17,
18]. Furthermore, it was designed to become more robust based on the polarimetric radar, considering the worst case signal-to-interference plus noise ratio [
19]. Thus, in order to obtain a better Doppler tolerance and constant modulus, a new OFDM signal combined with chirp signals was proposed, called OFDM chirp signals, which had great potential in radar application. For exploiting the full bandwidth for each waveform to improve the resolution in SAR, a novel OFDM chirp waveform was raised for multiple transmitters [
20]. In the study of [
21], the authors designed communication-embedded OFDM chirp waveforms for delay-Doppler radar applications. The benefit of fully using the bandwidth of a OFDM chirp signal is simultaneously using it for information transmission and radar sensing. OFDM chirp signals, based on MIMO radar, was simulated in a low-grazing angle target detection for its superiority of low peak-to-average-power ratio level and its larger time-bandwidth product [
22]. However, there were still some embedded problems left for OFDM chirp waveform. It has high ASP in the central region for basing chirp signal and high CP when the bandwidth is fully used. For the OFDM chirp signal, many improvement measures have been proposed. A Spread Spectrum-Coded OFDM chirp waveform was proposed in [
23]. By examining the ambiguity function and correlation function, the designed waveform could stay orthogonal on the receiver and have a large time-bandwidth product for separating closely spaced targets. In addition, based on random matrix modulation, a new OFDM chirp signal with low peak–average ratios and low frequency-shift correlation peaks was designed in [
24]. This was also an effective way to reduce high CP. Considering that high CP were caused by the same chirp rate of the OFDM chirp waveform, reference [
25] raised various sub-chirp durations or sub-chirp bandwidths. However, the above methods only consider the case of CP’s reduction and leave high ASP unsolved, since the spectrum structure of signal remains unchanged. Moreover, we found that the method for reducing ASP may restrict the reduction of CP and thus a model should be proposed to reduce both the ASP and CP for better detection.
In this paper, a series of methods are introduced to reduce ASP and CP of conventional OFDM chirp waveforms. Firstly, we derive and analyze the autocorrelation function formula and explore a suitable range of subchirp bandwidth so as to find the lowest autocorrelation central sidelobe peaks (ACSP). To remove multiple sub-cross-correlation peaks (MSCP), which produce high peaks in ASP as subchirp bandwidth are added, we propose a transmit-receive mode of transmitting the subchirp durations one by one and superimposing each matched filtering output at the receiver during the time domain. Next, the suitable interval is designed between the chirp rates of two signals to reduce the CP. Lastly, the designed signals’ properties are evaluated by simulation of the self-ambiguity function, correlation function, and one-dimensional range image, which shows remarkable improvement in range side lobe property and orthogonality as suitable MIMO radar signals. In addition, correlation function peaks’ value is compared with other recent studies, which proves the designed signal has a better correlation performance.
The rest of the sections of this paper are organized as follows.
Section 2 introduces the signal model and correlation function of the conventional OFDM chirp waveform. The autocorrelation function is explored and a new OFDM chirp waveform with lower ASP than a conventional one is proposed in
Section 3. In
Section 4, we explore the cross-correlation function and design a suitable range of interval between the chirp rates of two relative signals. The examples and corresponding simulation results are provided in
Section 5. Finally, this paper is concluded in
Section 6.
Notation: In the rest of the paper, boldface characters denote vectors. We use the upper indices to denote the type of variable and lower indices are used to denote the order. The upper indices ‘’, ‘’, ‘’, and ‘’ denote sub-autocorrelation, sub-cross-correlation, center range around main lobe, and designed one which is distinguished from the conventional one. denotes the jump function.
2. Conventional OFDM Chirp Signal Model
A conventional OFDM chirp signal is made up of several subchirps, which are in different subcarrier frequencies. Each subchirp has the same subchirp bandwidth and subchirp duration for simpler modulation. In addition, each waveform has a unique code sequence of the subcarrier frequencies for orthogonality to the waveforms of the other antennas. The
nth conventional OFDM chirp signal with
M subchirps can be expressed as:
where
,
n = 1, 2, …,
N is the
nth transmitting signal and
N is the number of transmitting signals.
is the
mth subchirp signal of
.
denotes the total duration,
is the subchirp duration, and
M is the number of subchirp. The
t, where
, represents the time samples of the signal. In addition,
is the jump function.
represents the bandwidth of the signal,
denotes the subchirp bandwidth of the
nth transmitting signal, and
denotes the minimum interval between two subcarrier frequencies of the
nth transmitting signal.
is a subcarrier frequency, which is the starting frequency of the
mth subchirp of the
nth signal.
,
is the subcarrier frequency code. Lastly, we define
as a chirp rate of the
nth transmitting signal since all subchirp rates are the same during an OFDM chirp signal.
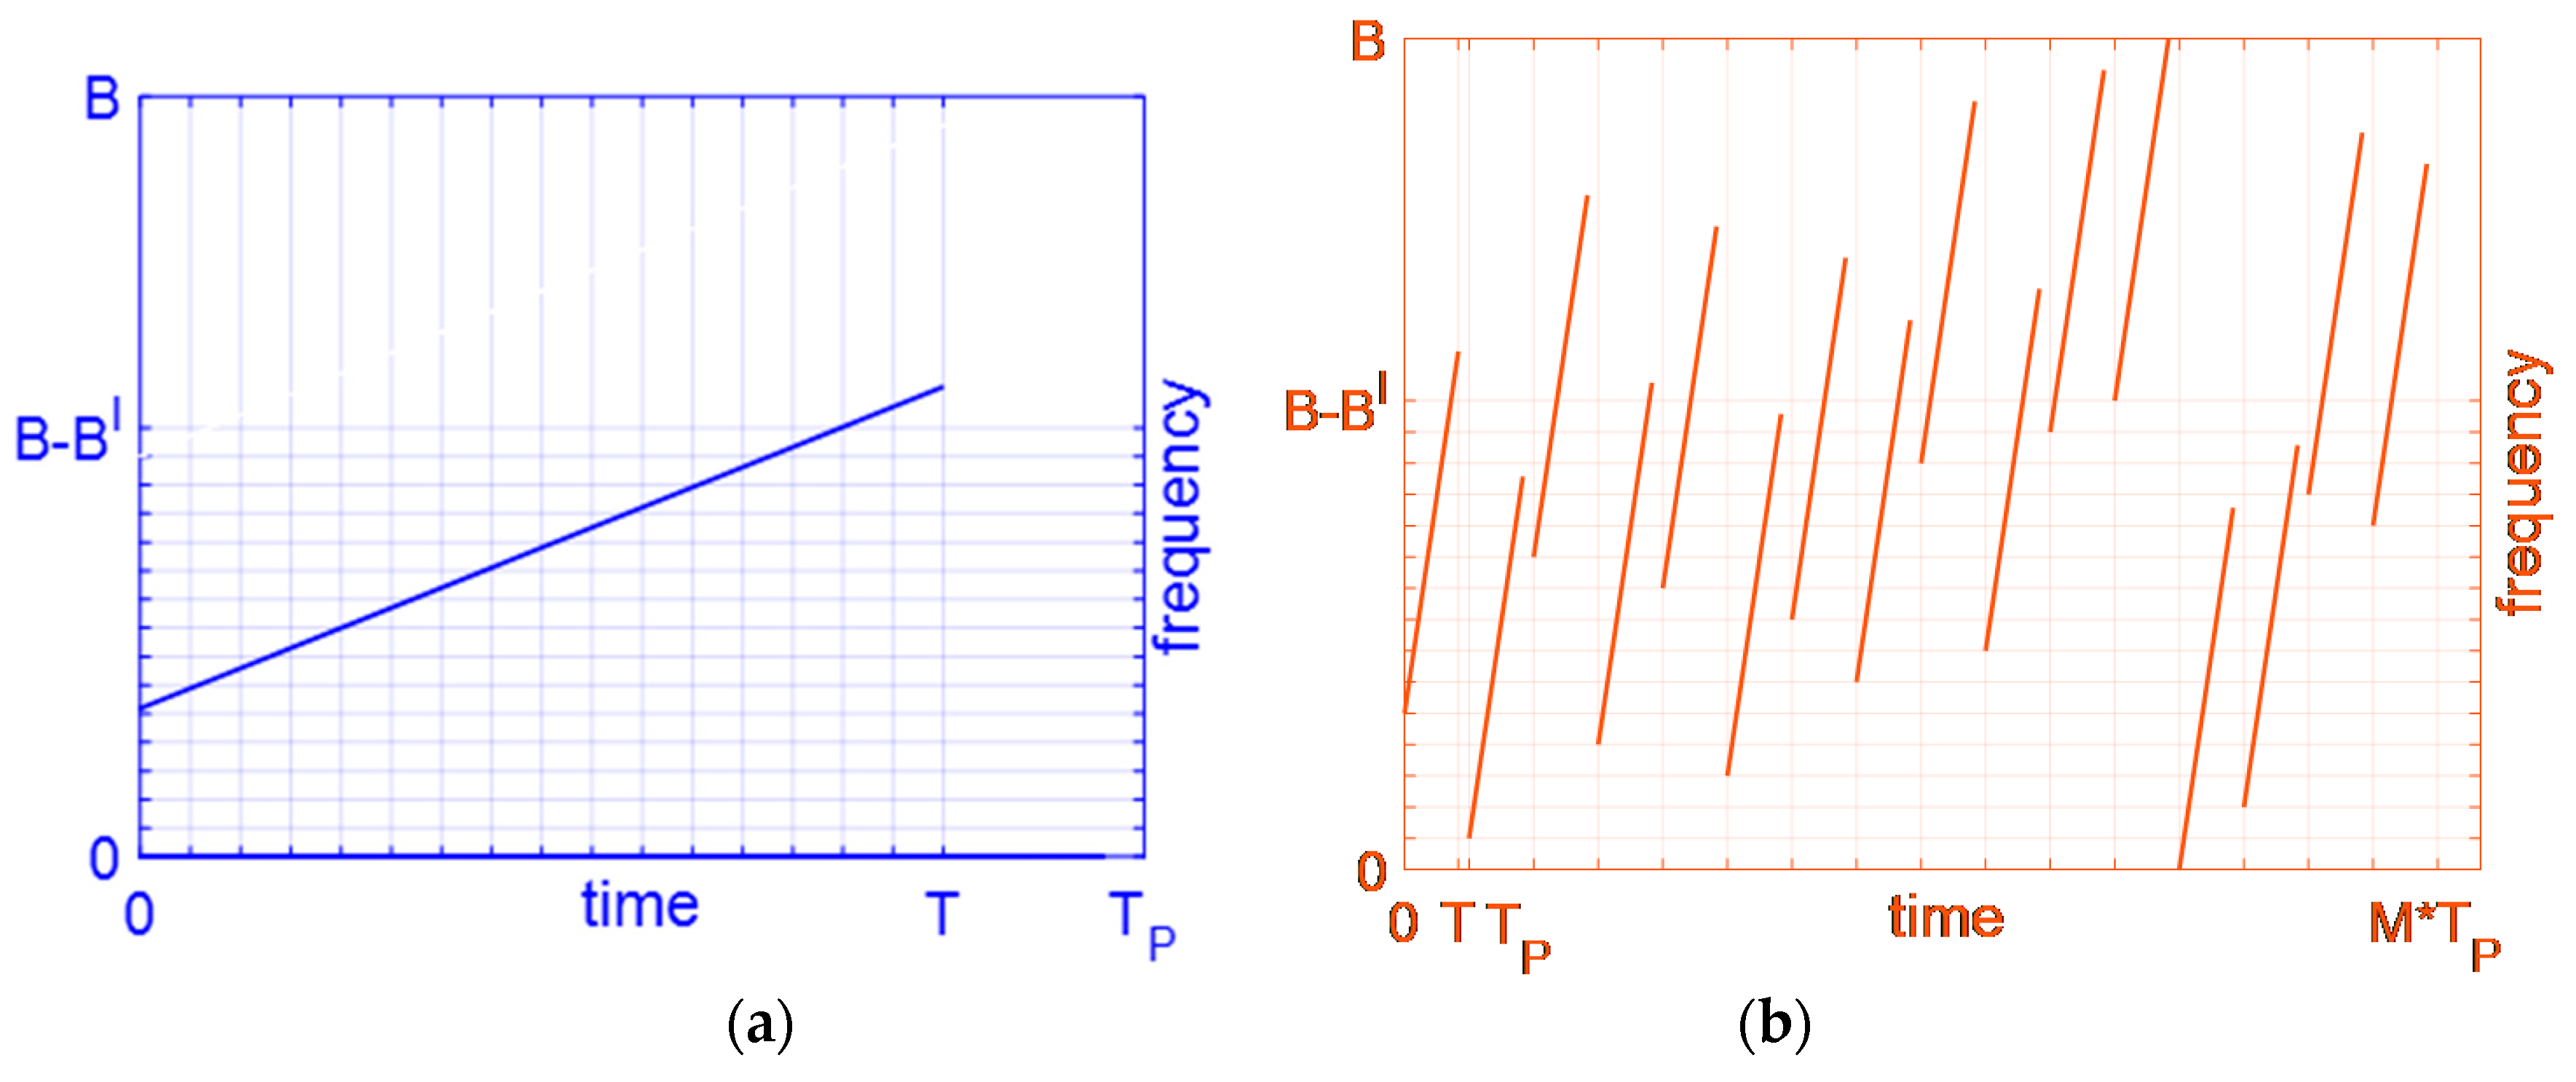
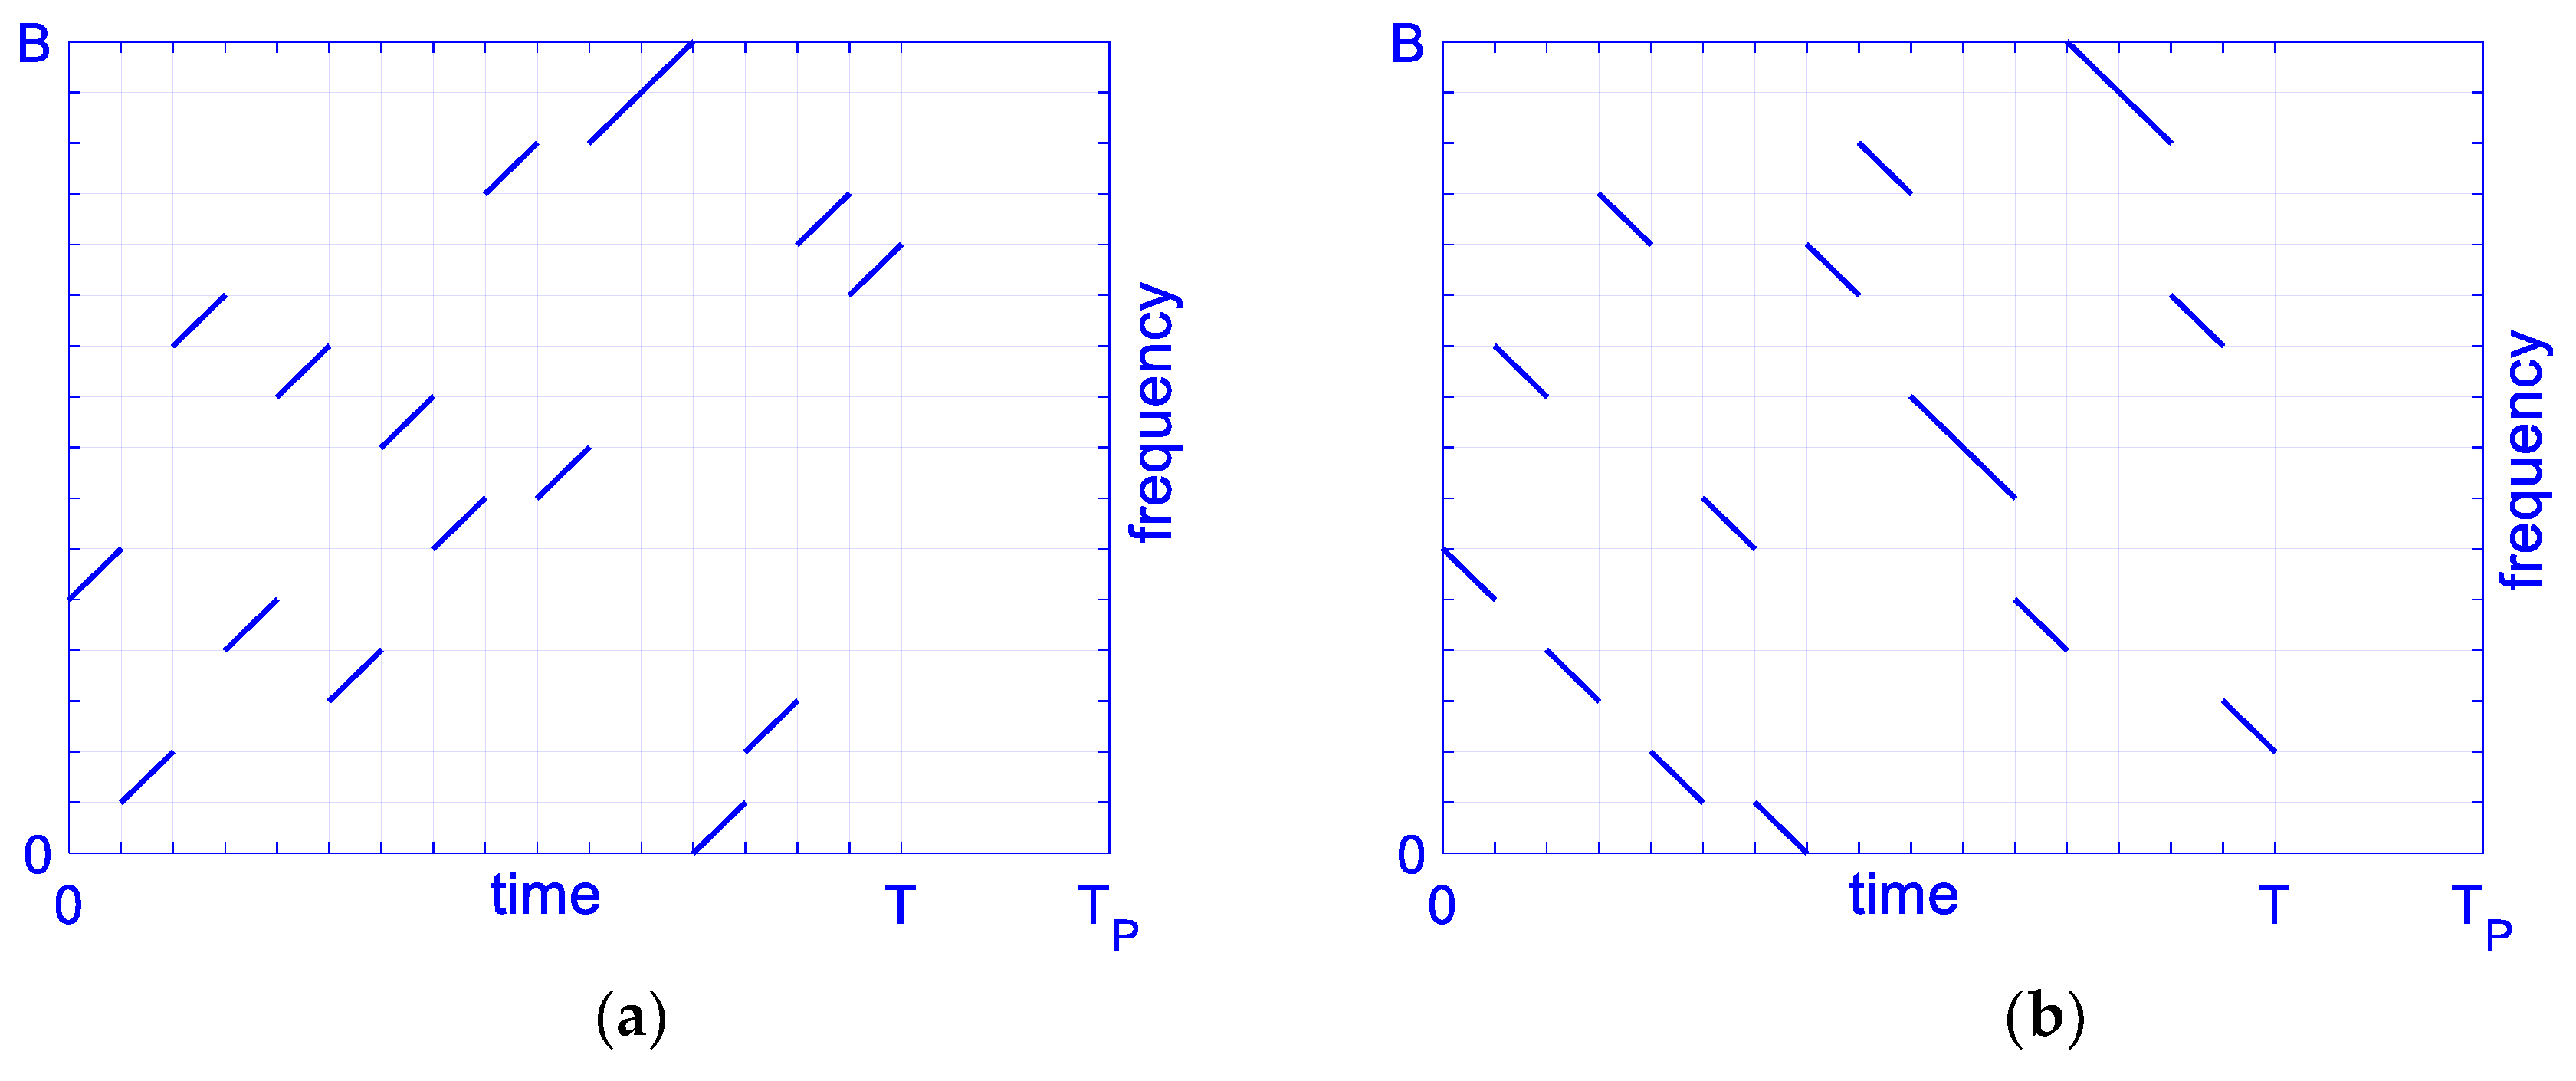
According to the signal model in Equation (1), conventional OFDM chirp waveforms with 16 subchirps are designed [
24]. Without loss of generality, the conventional OFDM chirp signals
and
are chosen to explore the correlation property. We define the parameter as:
,
,
M = 16,
N = 2, and
. The subcarrier frequency code sequences are given as:
= {6, 2, 11, 5, 10, 4, 9, 7, 14, 8, 15, 16, 1, 3, 13, 12} and
= {6, 10, 4, 13, 2, 7, 1, 12, 14, 9, 8, 5, 16, 15, 11, 3}. In order to do a comparison with designed signals below, we set signal
with plus subchirp rates and
with minus subchirp rates. Signals’ time-frequency structures diagram are shown in
Figure 1.
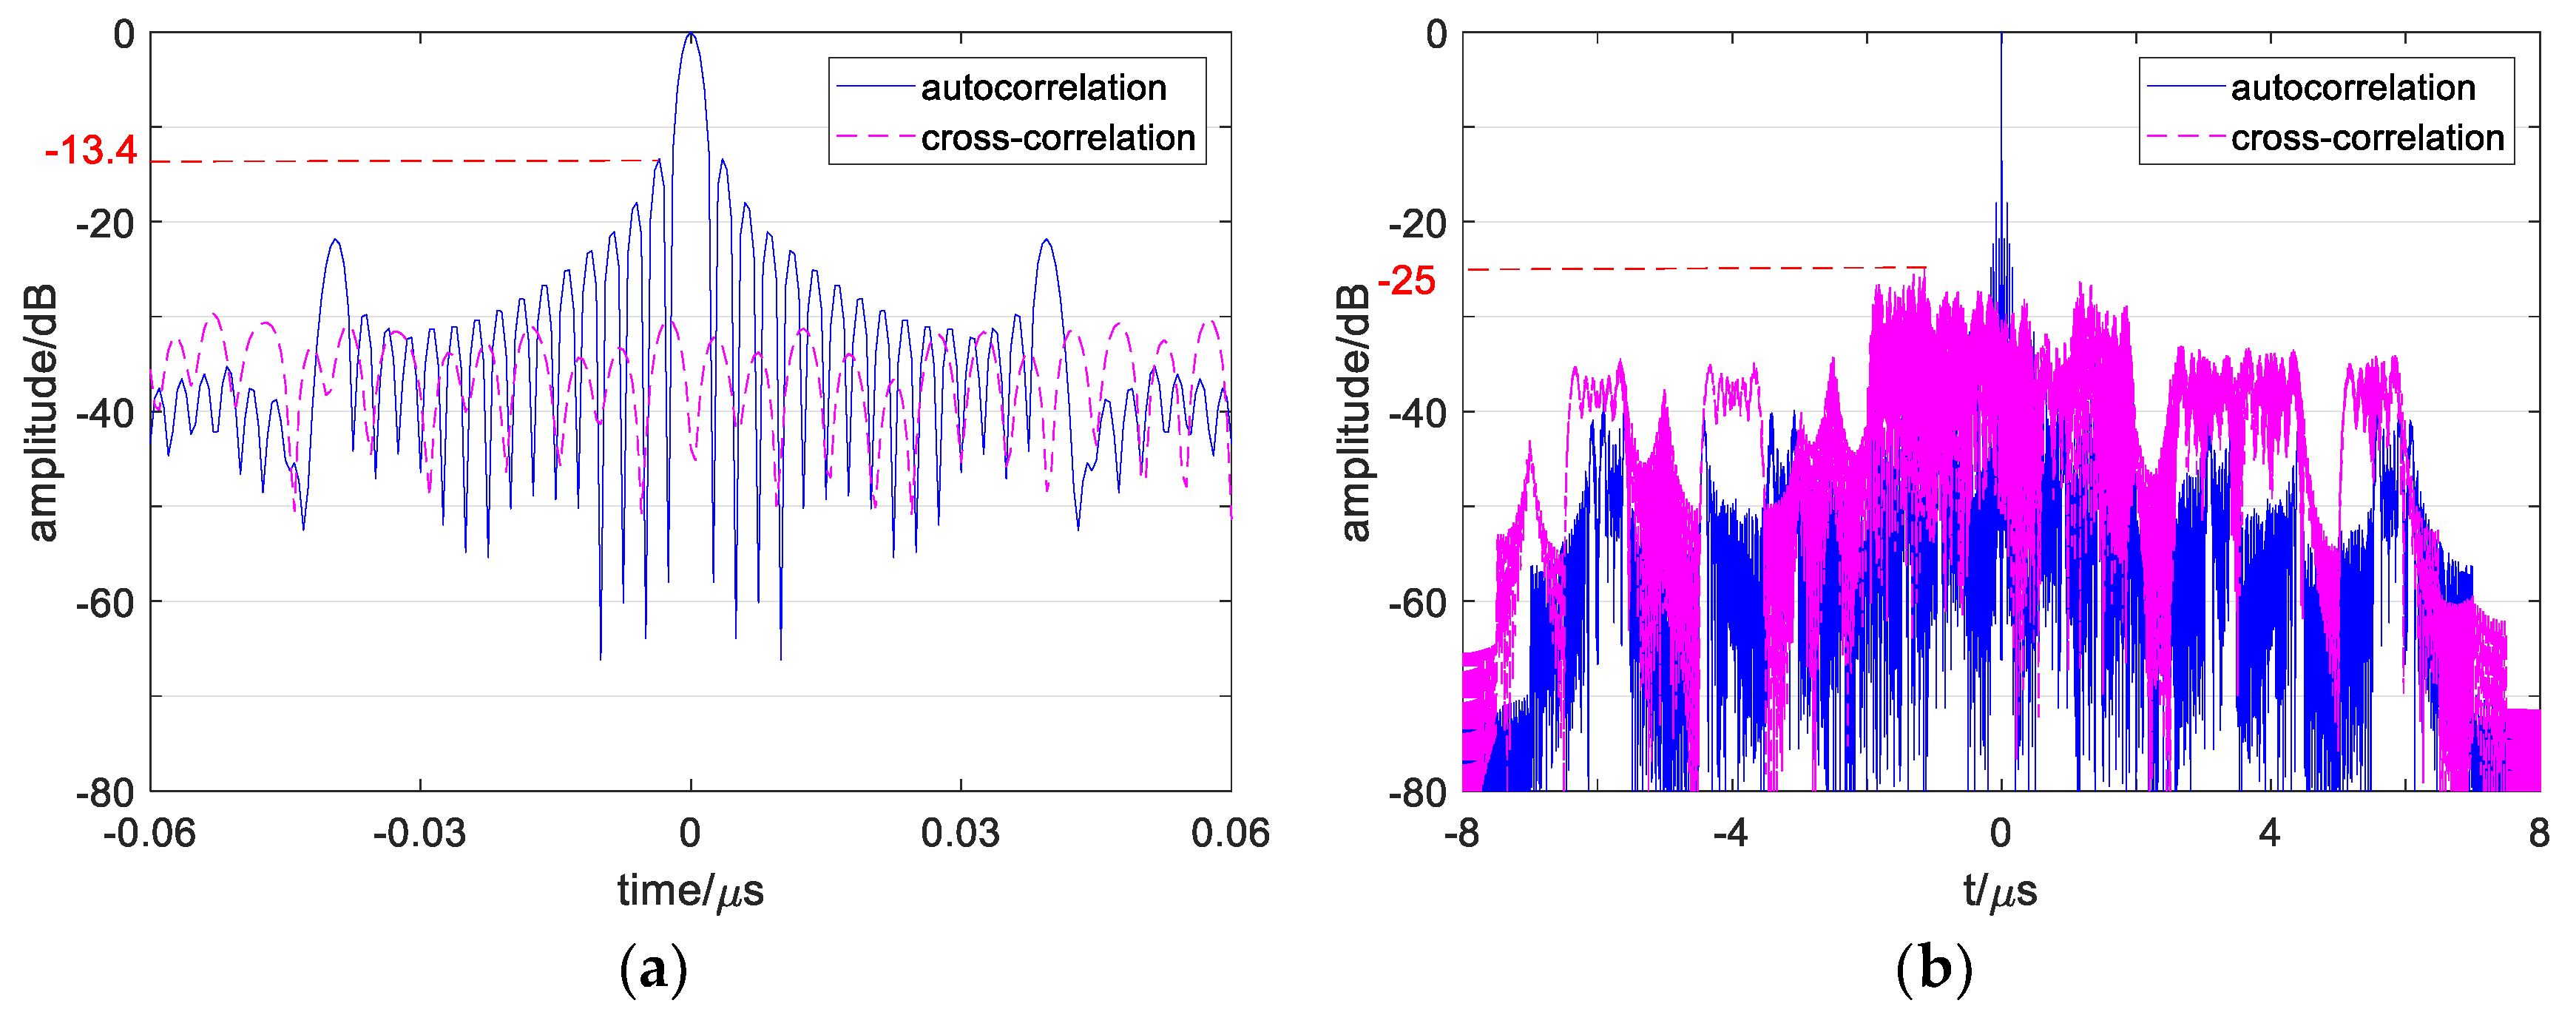
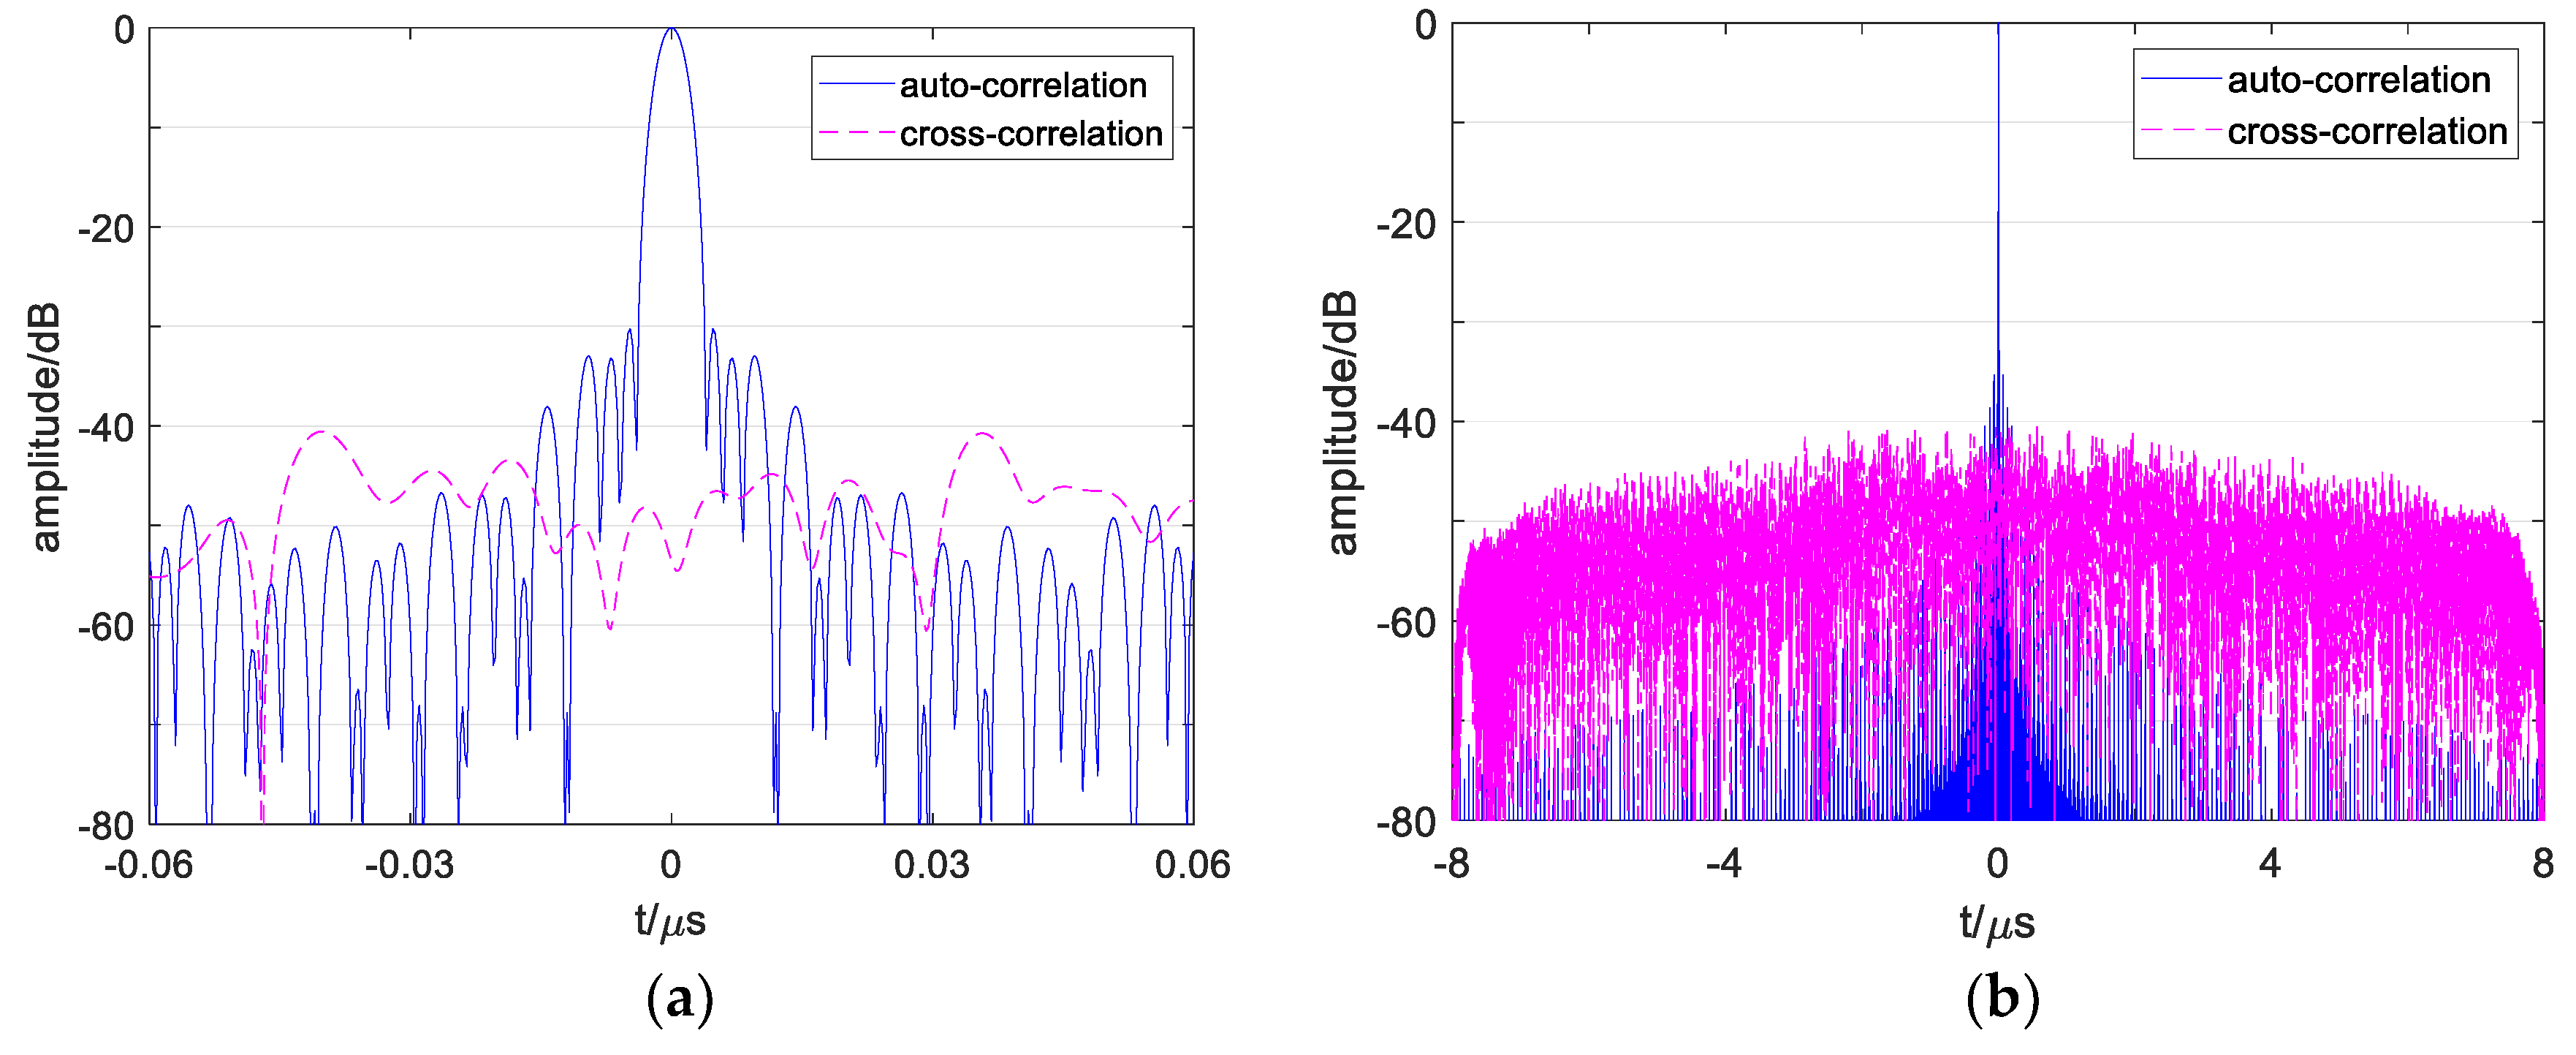
By fully using the bandwidth based on the subchirp signal, the conventional OFDM chirp signals have a high resolution with no range-Doppler coupling. To better evaluate the property of conventional OFDM chirp signals, the correlation function [
25] of the two waveforms are defined as:
where
is the time delay,
is the cross-correlation function under
, and it represents autocorrelation function after
. The autocorrelation function of
and cross-correlation function between
and
calculated by Equation (2) is obtained in
Figure 2.
As show in
Figure 2a, it can be found that a conventional OFDM signal’s ASP is up to −13.4 dB. In addition, the ASP appears in the central region near the main lobe (called ACSP), while the autocorrelation side peaks in the edge region are low enough. On the other hand,
Figure 2b shows the signal’s CP value as −25 dB with many high cross-correlation peaks in it.
These numerical results show that a high correlation influence exists in conventional OFDM signals, which will reduce its detection properties. As the signals’ number add, such as 4 signals in the
Section 5 simulation, the cross-correlation influence will be more serious. Moreover, in the one-dimensional range image, multiple point targets echo’s correlation sidelobes will overlap and become higher, which may cover up the weak targets and cause false detection. Thus, it is necessary to reduce the ASP and CP of a conventional OFDM signal and evaluate the multiple signals detection performance and one-dimensional imaging detection level of the designed signal. In addition, some recent study results should be compared with the simulation results of the designed signals.
3. Subchirp Bandwidth and Transmitting Structure Design for Reducing ASP
In this section, we begin with the derivation and analysis of the autocorrelation function of a conventional OFDM signal. Next, we separate the function into several parts and evaluate each part’s influence on the ASP. Lastly, we propose the designed signal structure and show corresponding autocorrelation performance evaluated by a transmit-receive structure diagram, time-frequency structure figure, and ASP curve.
Under the situation of
p =
q =
n, Equation (2) is the auto-correlation function of the signals. Since the function is probably symmetric by
, which is sufficient to study the peak value in
, Equation (2) can be written as:
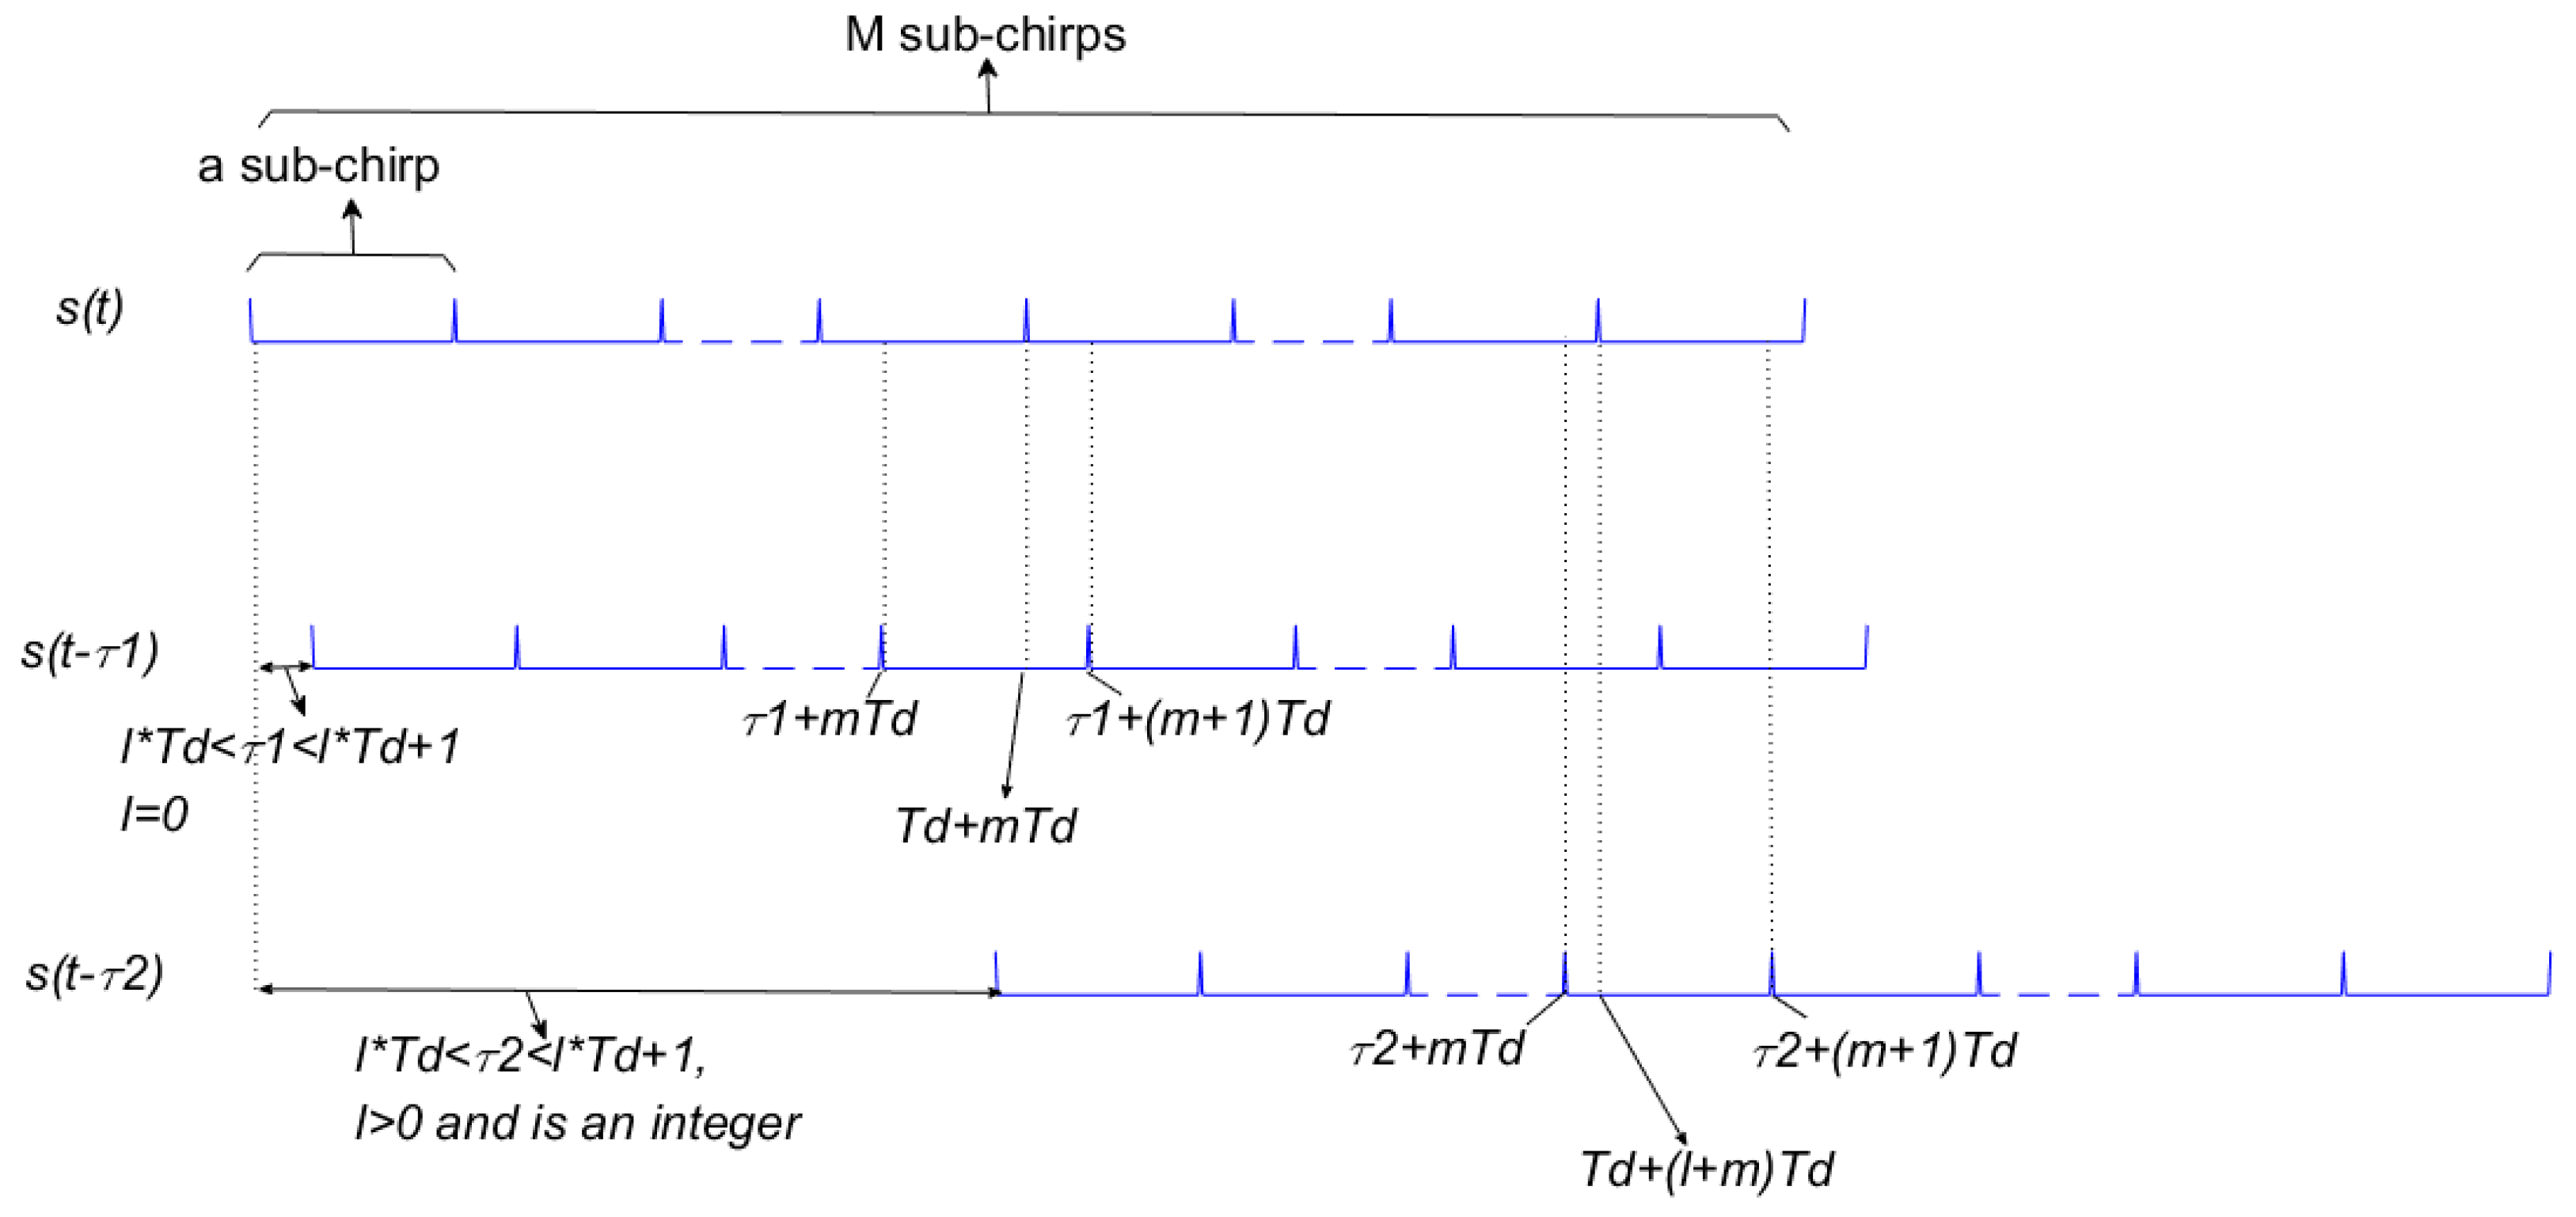
We assume
, where
l is an integer with
, and set the signal parameters as the same as in
Figure 1. Based on Equations (1) and (3), the signal’s autocorrelation function structure diagram is obtained in
Figure 3. Next, based on the different integral function as in
Figure 3, the region is divided into 2
M − 2
l − 1 regions and Equation (3) can be expanded as:
where
and
are the first and second part of
.
In
Figure 3, the conjugate multiplication of the two signals’ overlap with interval of
is the corresponding value of the autocorrelation function (AF). Moreover, we define the part of AF composed by two same subchirps as the multiple sub-autocorrelation function (MSAF), and the other one that is composed of two different subchirps as the multiple sub-cross-correlation function (MSCF). Under
of
Figure 3, AF is made up of the MSAF and MSCF. The part in
of AF is MSAF, which is the first part of Equation (4) and can be expressed as:
The one in
is the MSCF which is the second part of Equation (4) and can be expressed as:
Under
, the AF is made up of the MSCF only and can be expressed as:
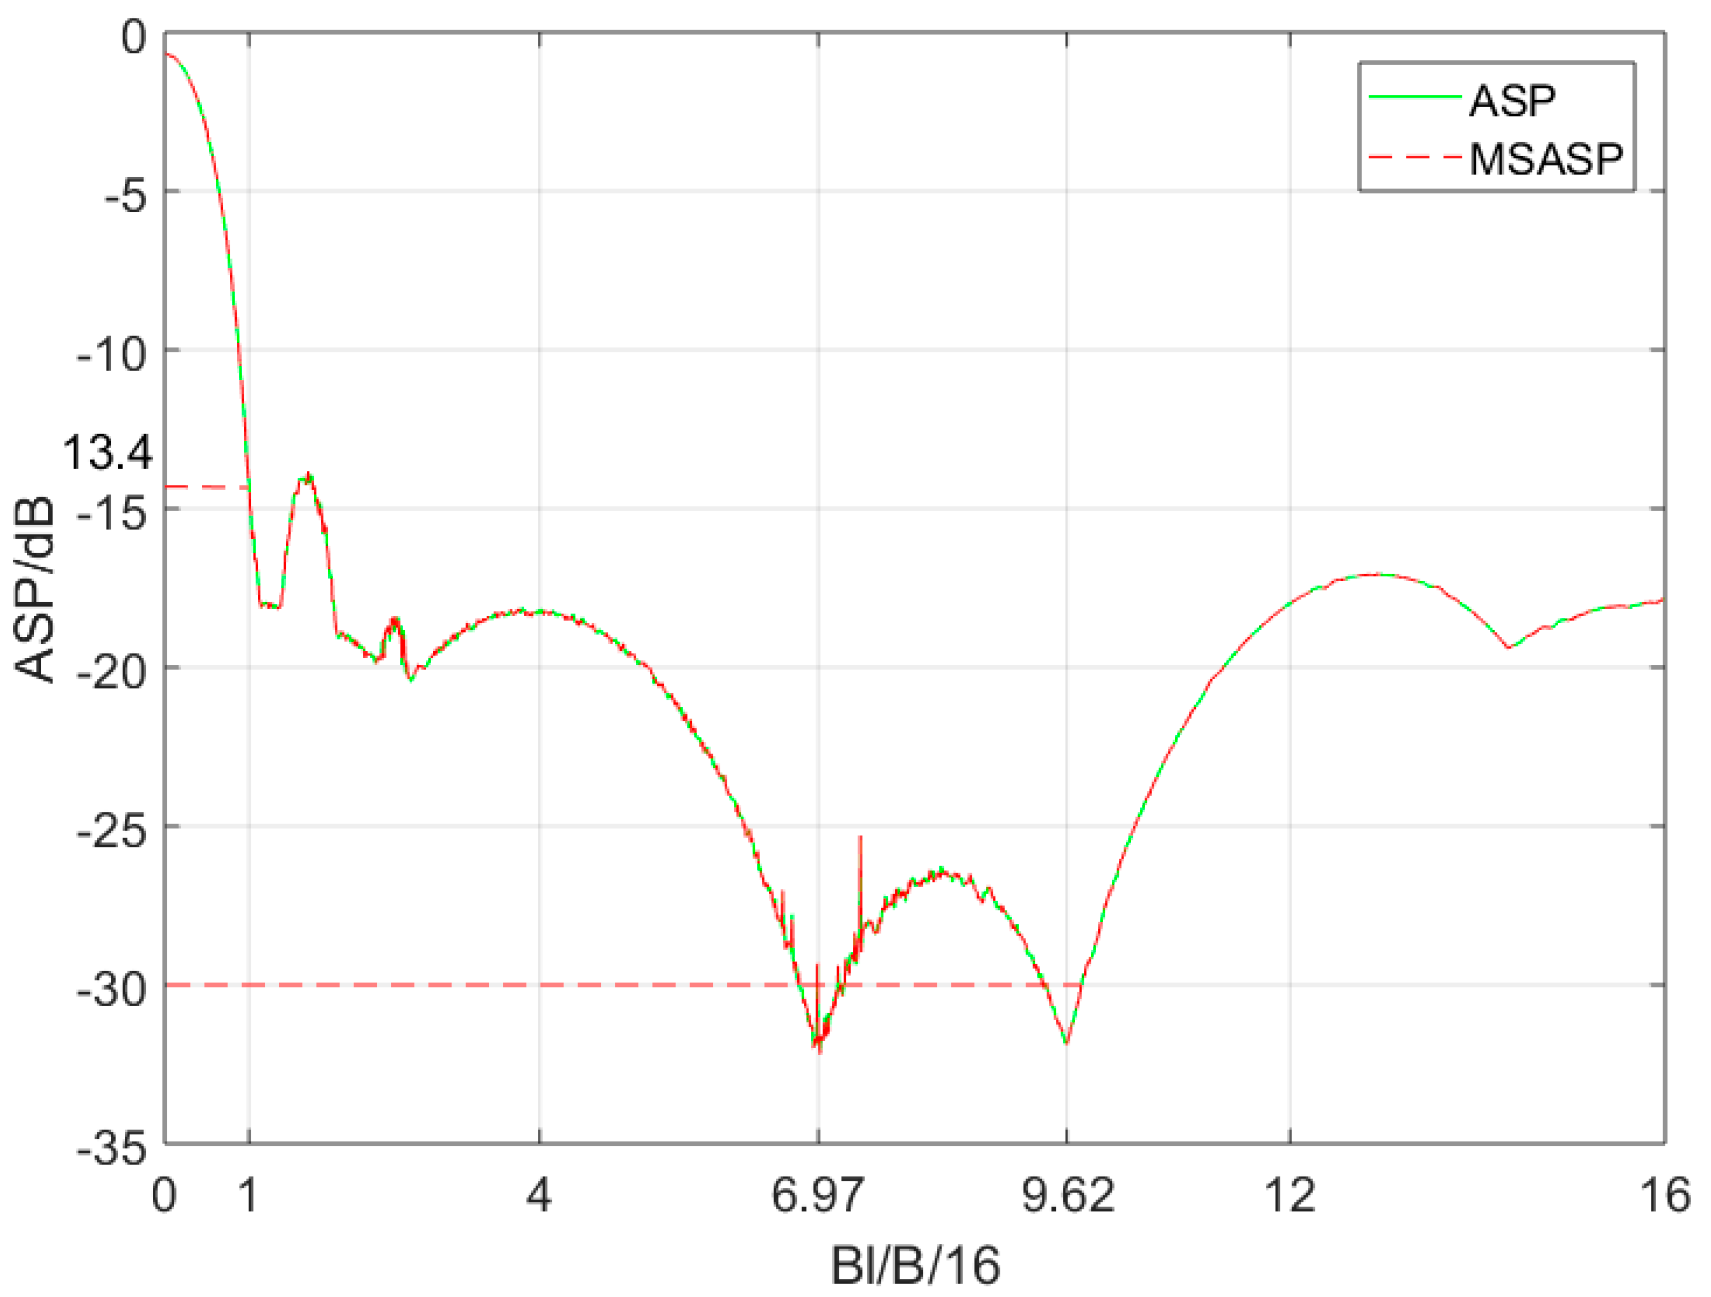
In order to reduce the ASP of the signals, the auto-correlation curve structure can be adjusted by changing its spectral structure. The subchirp bandwidth
has been changed to find a suitably low ASP value. We define:
where
is the autocorrelation sidelobe peak (ASP),
is the multiple sub-autocorrelation sidelobe peak (MSASP), and
is the multiple sub-cross-correlation peak (MSCP), where
. According to Equations (4)–(7), their curves change with
as shown in
Figure 4. The MSASP has two minimal values when
is near 6.97 or 9.62, and the MSCP and ASP have high value in these points.
According to
Figure 2a, the high ASP appears in the central region near the main lobe. We explore the 1/200
region centered on the main lobe where
is smaller than 1/200
and the second part of Equation (4) is about −46 dB in value of the first one. Thus, the AF in the central region can be obtained without the second part in Equation (4) as:
Comparing Equation (11) with Equation (5), it shows
during
. Thus, as the MSASP curve obtained in
Figure 4 shows, the central ASP can reduce to about −30 dB when
takes a suitable value. However, the MSCP curve will appear at high peaks when
which will cause new high ASP out of the central region of the main lobe.
Next, to find the reason for the high MSCP according to Equation (6), Equation (7) is qualitatively analyzed. We expand the multiple sub-cross-correlation function
during
as:
where
. When
,
and
, MSCF will not produce high peaks. However, when
,
, or
MSCP will produce high peaks. In addition, the conclusion is the same for
when
.
Thus, it can be concluded that a suitable value of can reduce the ASP in the central range of the main lobe in AF. However, the MSCP will keep a high value as the increases to more than , which cause new edge high ASP values. A designed transmit-receive structure needs to be proposed to remove the MSCF part from the AF.
The autocorrelation function of
mth subchirp signal can be written as:
And Equation (3) can be expanded and rewritten as:
where MSAF is the sum of
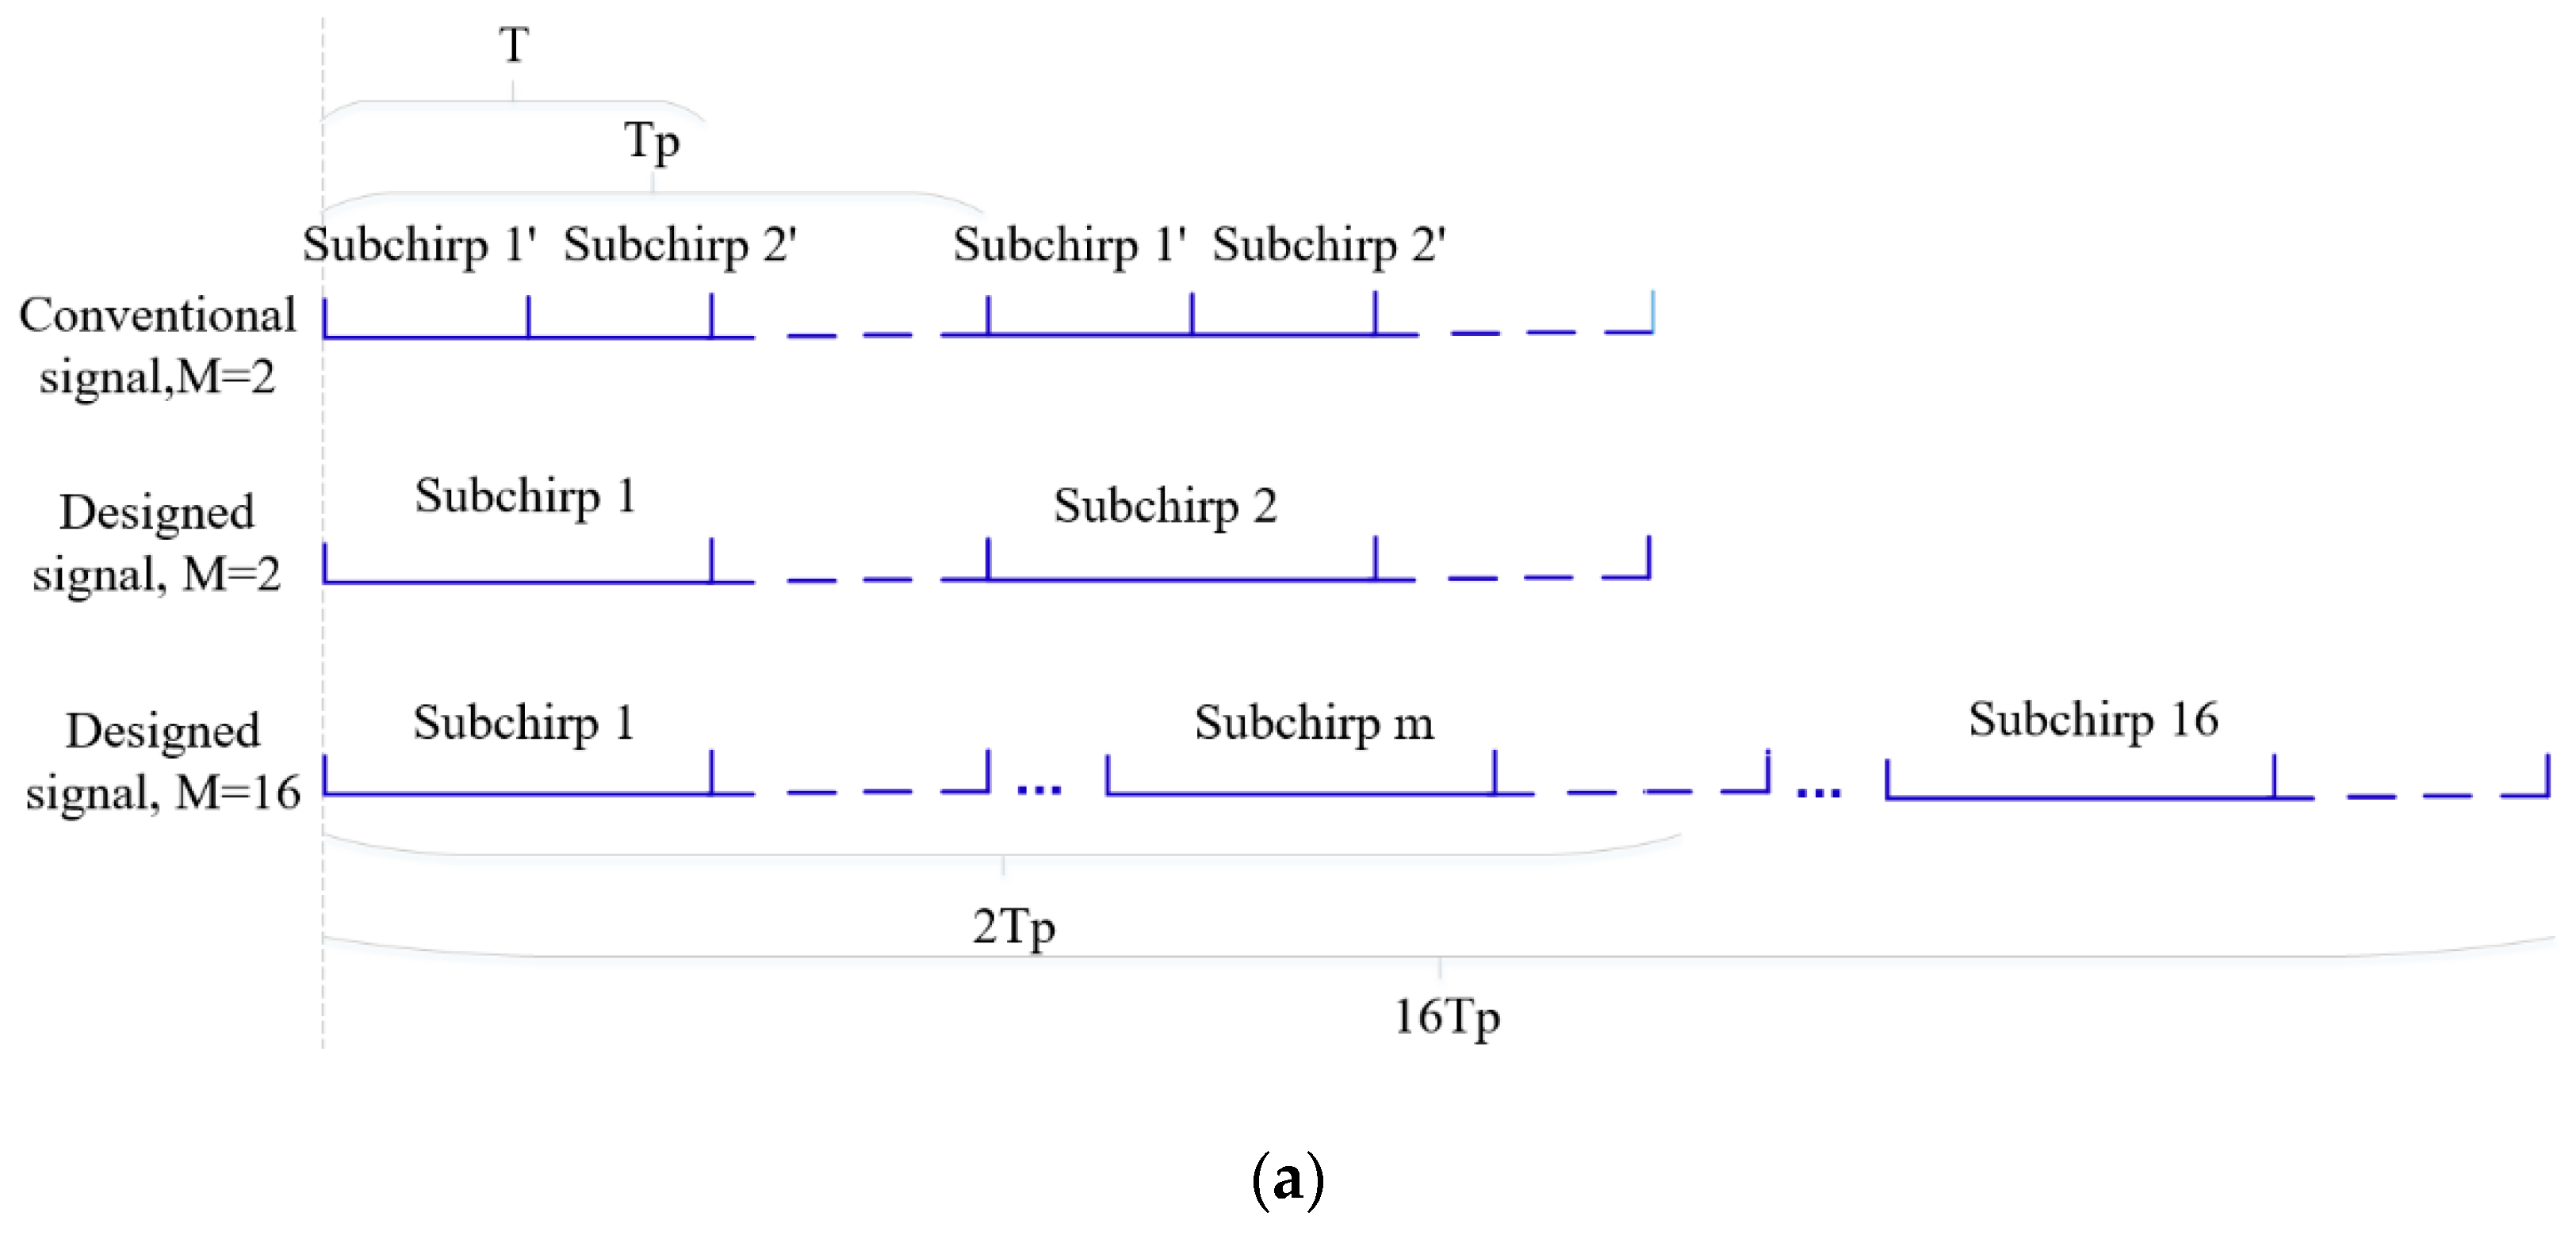
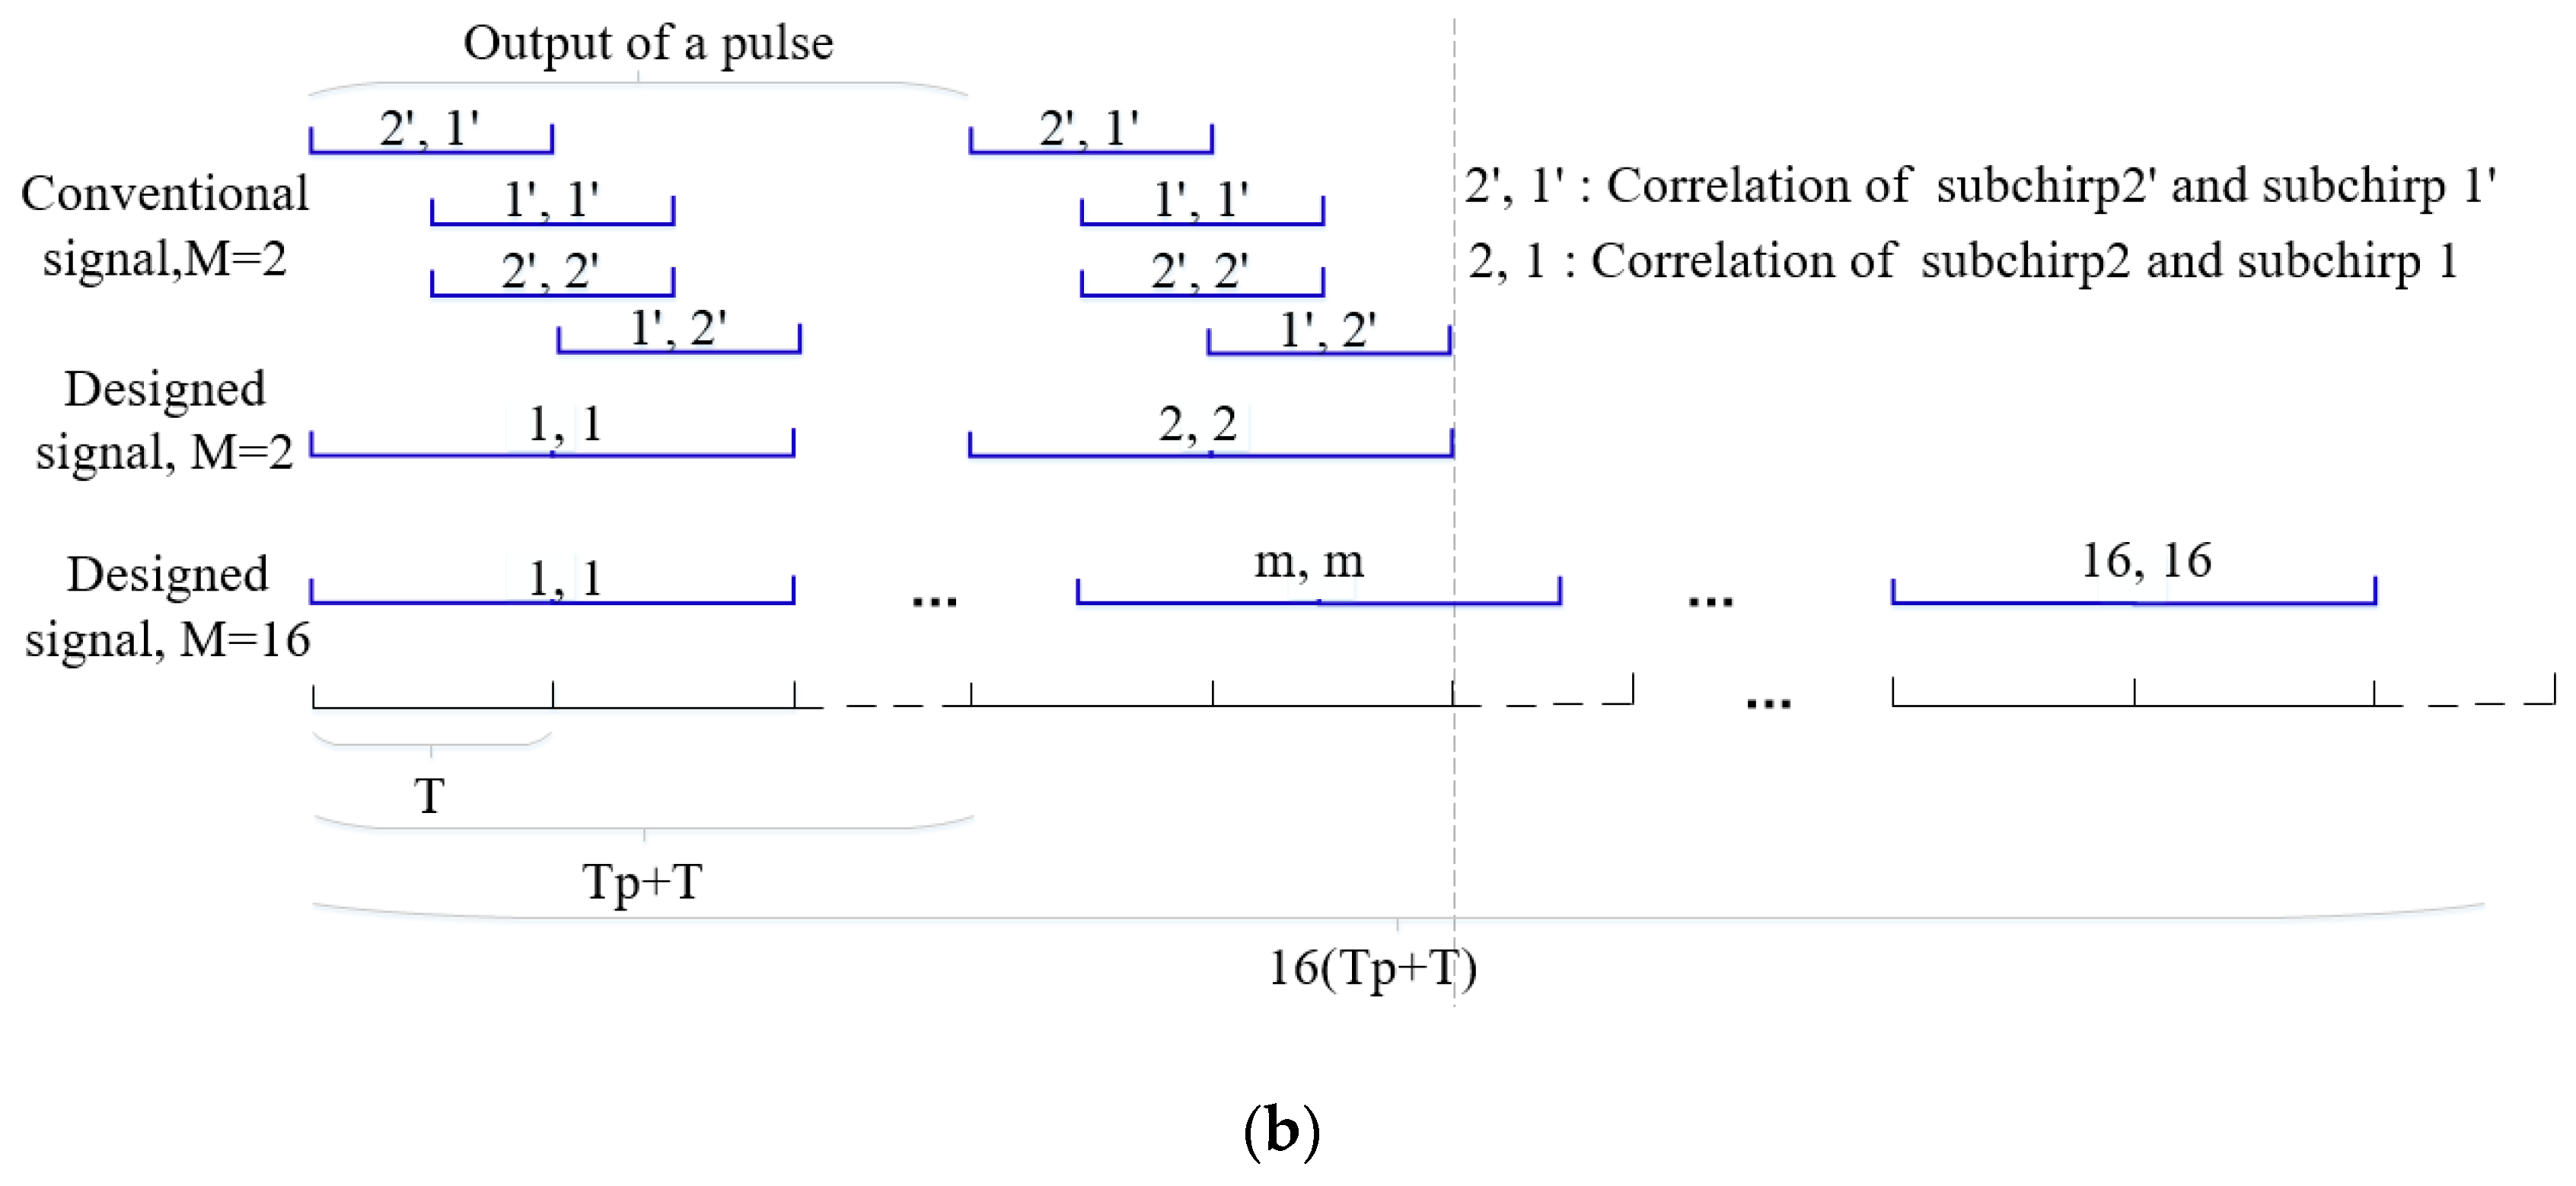
M subchirp autocorrelation functions. Inspired by Equation (14), designed signals can be designed for removing the MSCF part by a new transmit-receive mode based on the OFDM chirp signal as shown in
Figure 5 where it is compared with a conventional signal.
(1) In
Figure 5a, all subchirps are continuously transmitted in a pulse with each subchirp duration
in the transmission of the conventional OFDM signal. However, in the transmission of designed signal, each subchirp duration is
and is transmitted in different pulses according to the code order. Where
is the pulse duration and is set to
M = 2 to simplify the autocorrelation structure;
(2) In
Figure 5b, the same matched filter output is obtained in a pulse in conventional OFDM signal processing. However, in the designed signal processing,
M different matched filter outputs are produced among
M pulses of time domain in the order of the transmitting subchirps;
(3) After matched filtering, M pulse durations outputs are accumulated at the receive. Both signals will improve the SNR and the designed one can also achieve a low ASP.
As mentioned above, the designed signal can be formulated as:
where
,
n = 1, 2, …,
N is the
nth designed OFDM chirp transmitting signals. The pulse duration is
and the subchirp duration is
, where
. The range of
t is
. In addition,
will be chosen during the suitable range to reduce the ASP.
To explore the autocorrelation property of the designed signals, we set the parameters as:
,
,
M = 16,
N = 1, and
according to the conclusion in
Figure 4. In addition, the subchirp carrier frequency code sequences are the same as the conventional OFDM chirp signal
in
Figure 1. The time-frequency structure of the designed waveform is plotted in
Figure 6. Where
Figure 6a is the first part of
Figure 6b during
, which shows each subchirp duration of the designed waveform exists in a unique pulse. Moreover,
Figure 6b plots the whole time-frequency structure of the designed signal during
. It shows each subchirp rate is the same and overlap in the frequency dimension since
.
Compared with Equation (2), the correlation function of designed OFDM chirp signals can be defined as
. Since the subchirp signals of the designed signals are transmitted according to the pulse one by one and the
M outputs are superimposed at time domain without delay,
can be written as:
the autocorrelation function of the designed signals can be expressed as:
and its ASP can be defined as:
According to Equations (15)–(18), the designed signal’s ASP curve with
is plotted in
Figure 7 and is compared with the MSASP conventional signal.
In
Figure 7, since the ASP of the designed signal is equal to the MSASP of the conventional one, the designed signals’ ASP can be suppressed effectively when taking a specific
value. The suitable range of
when designed signal’s ASP is under −30 dB can be obtained, which is shown in
Table 1.
5. Design Examples and Simulation Results
In this section, we give some designed examples and corresponding simulation results to evaluate the effectiveness of the proposed OFDM chirp waveform methods.
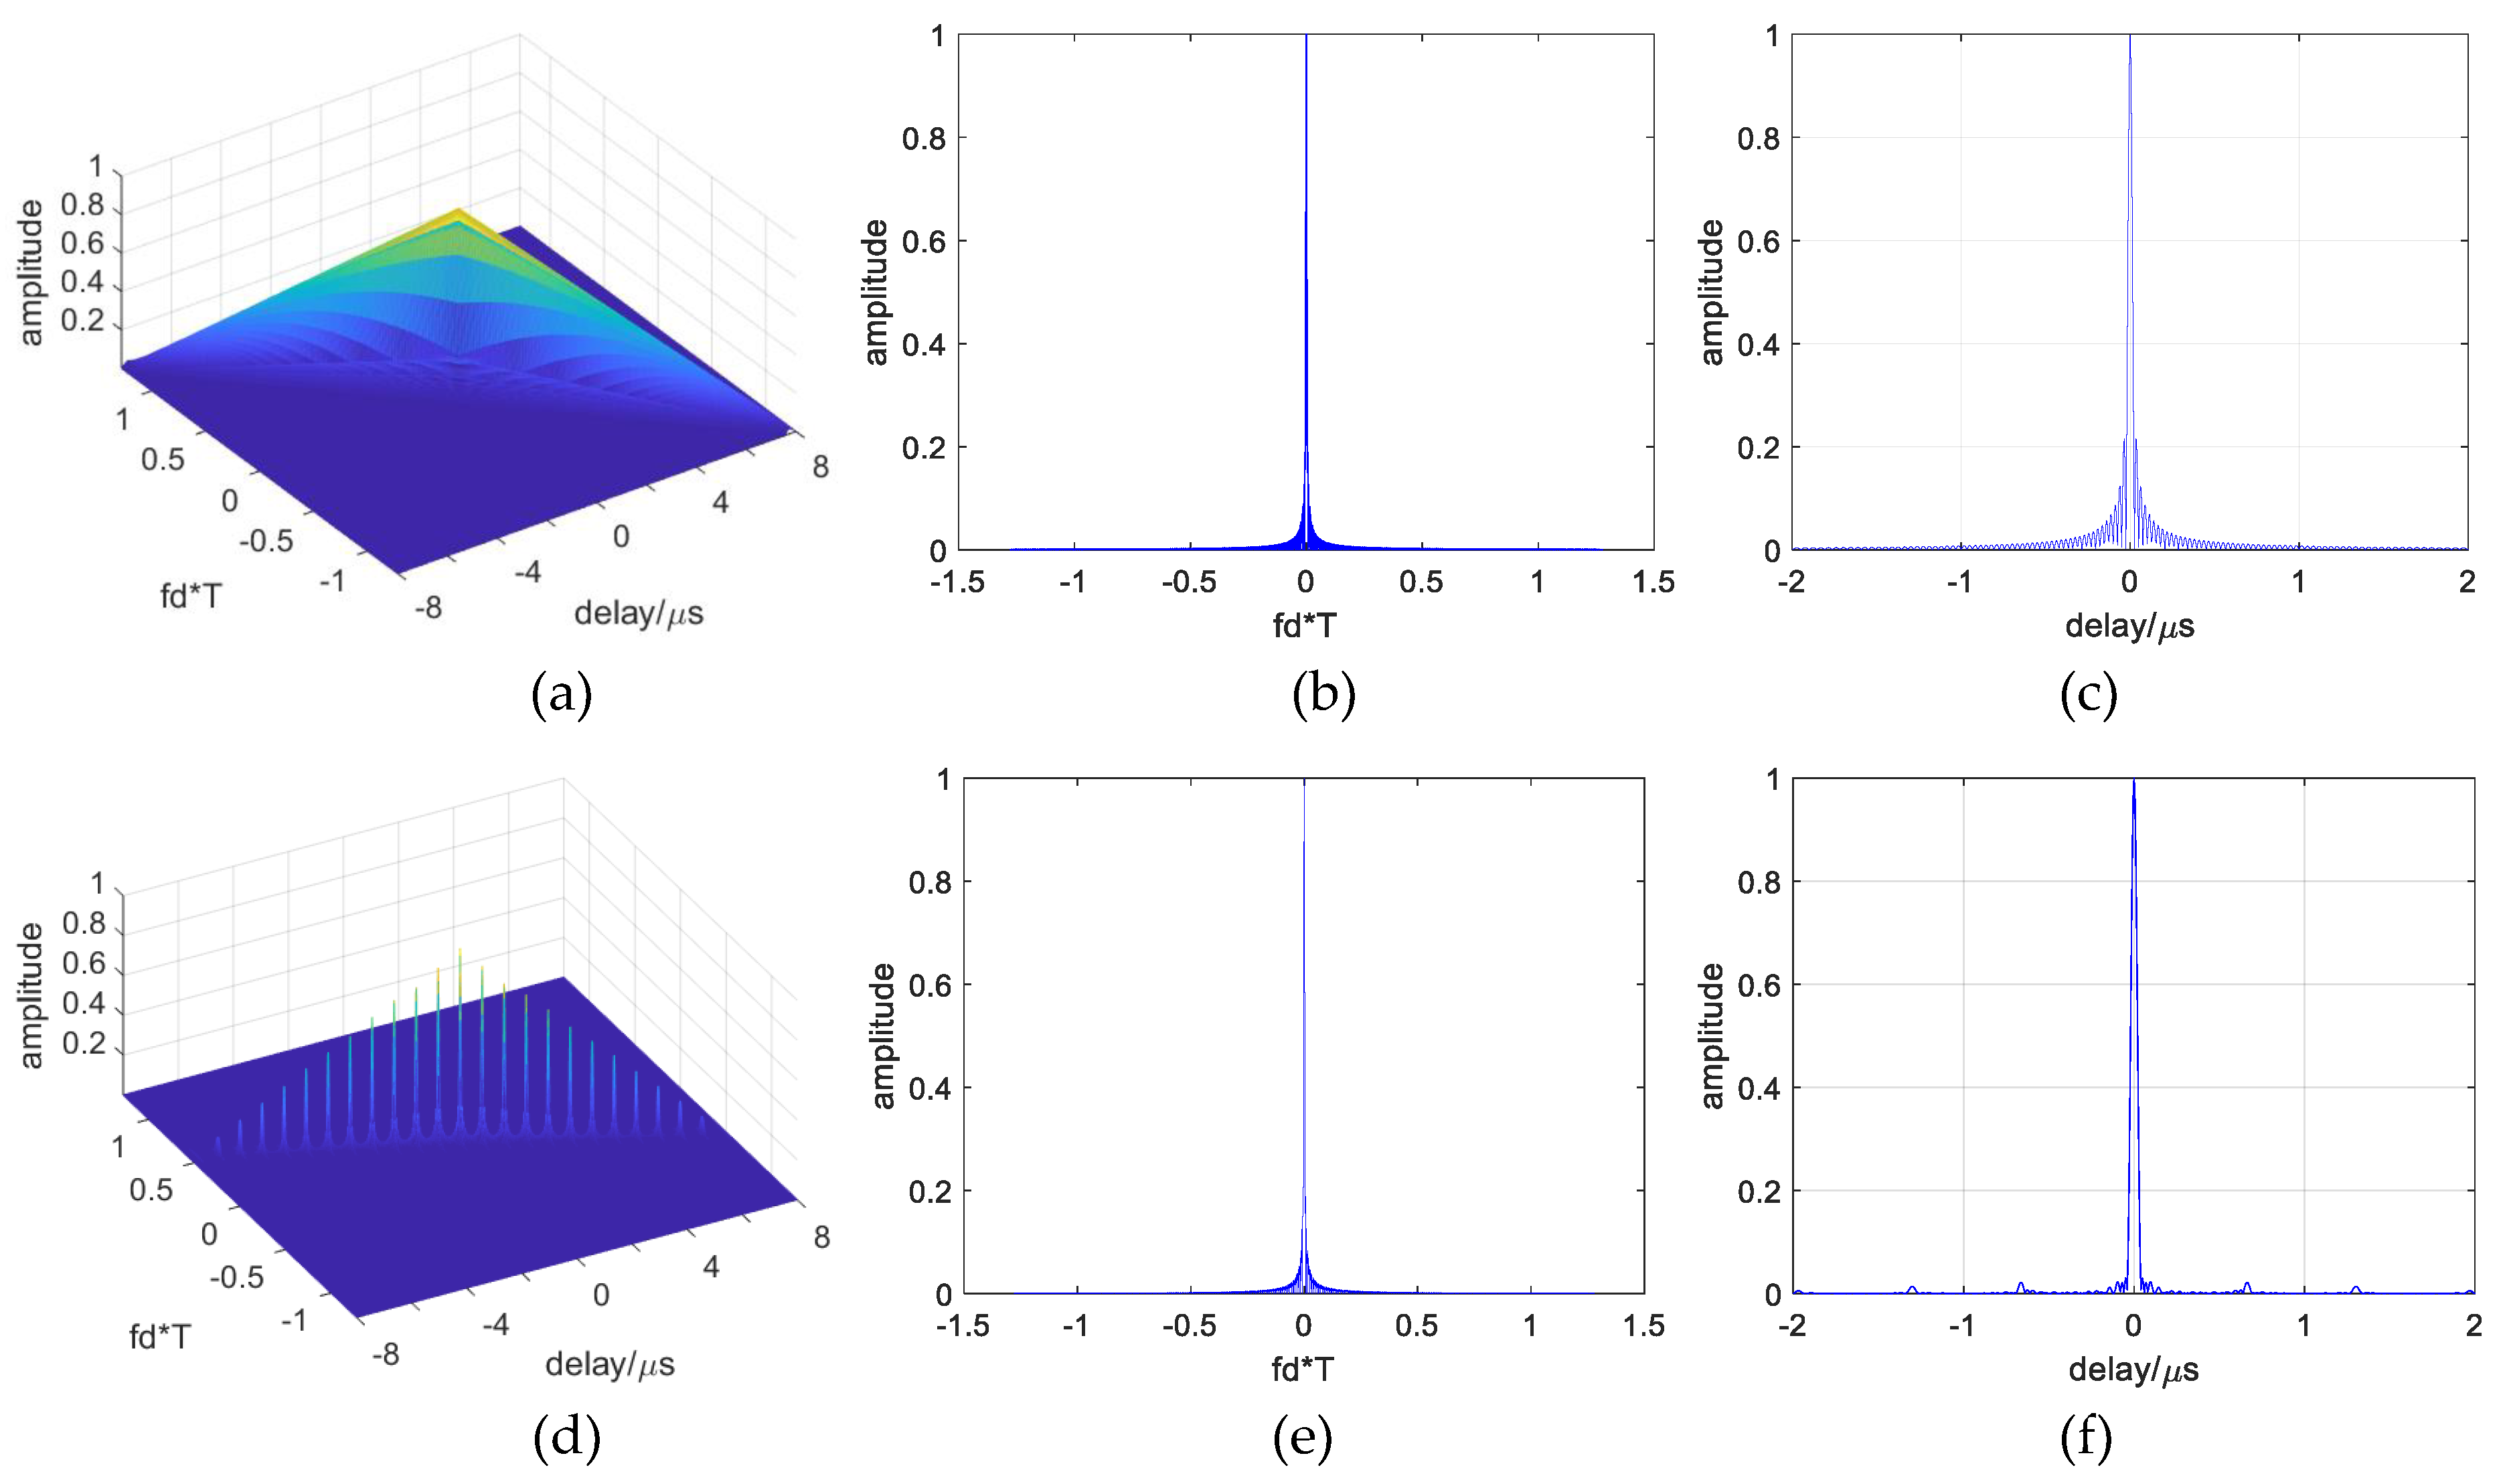
To explore the designed signals’ Doppler performance,
Figure 9a–f gives the self-ambiguity function response of a conventional OFDM signal and designed signal with its
, and parameters at
and
. As shown in
Figure 9b,e, the designed signal has the same doppler resolution performance as a conventional OFDM chirp signal. Furthermore, in
Figure 9c,f, the designed signal has lower range sidelobes than conventional ones.
In order to evaluate the time-frequency structure and correlation performance of the designed signals, four signals
are simulated. According to the conclusion in
Table 1, there are two ranges for the
to obtain low ASP. We designed two groups of four signals with each two taking the
value during each range respectively for the simulation. In addition, as shown in the conclusion in
Table 2, the interval of the chirp rates between the two simulation signals will be more than
. The designed parameters are shown in
Table 3.
After subchirps sequences coding and subchirp rate plus and minus (PM) coding for reducing the designed signals’ CP, the time-frequency structures of the designed four OFDM chirp signals are plotted in
Figure 10a–d, where
and
are coded as the sequences of
and
for comparison. In
Figure 10, each subchirp duration is
T, and in a signal, each subchirp bandwidth is
, where
n is 1, 2, 3, 4. Since the PM coding will not influence the ASP of the designed signals for each subchirp being transmitted separately, we set signals
and
with all plus subchirp rates and signals
and
with all minus subchirp rates to further reduce the CP.
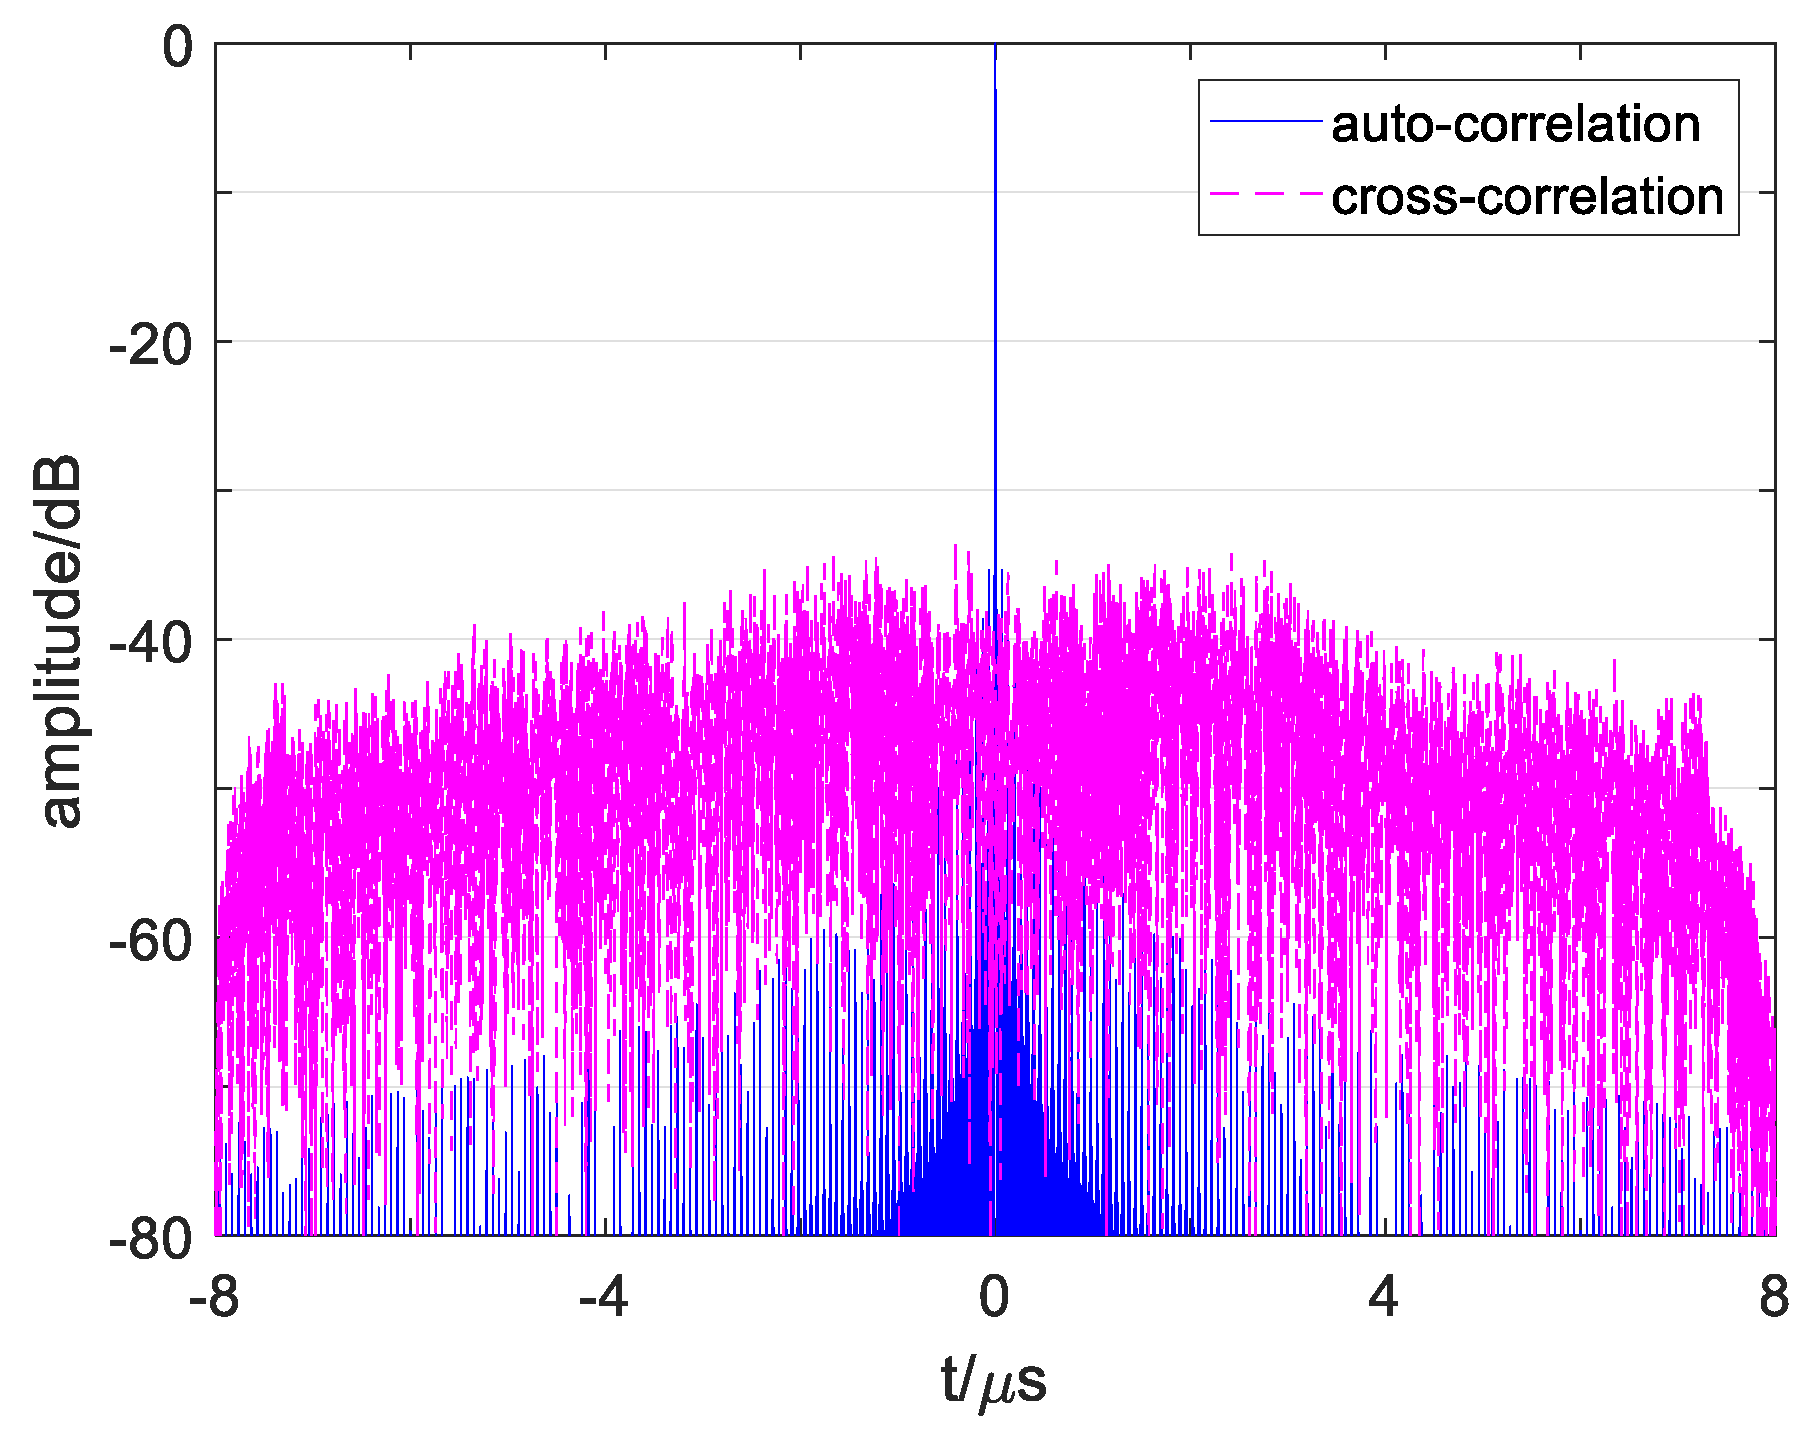
Figure 11 plots the correlation functions of signals
and
. Comparing the results in
Figure 11a with that of
Figure 2a shows that the autocorrelation of conventional OFDM waveforms and designed waveforms are different.
Figure 2a shows high sidelobes near the main lobe, which also influences the resolution among multiple close targets or in continuous targets and easily causes false detection. The reason is that inappropriate subchirp bandwidth causes high peaks in multiple-subchirp autocorrelation function. Since the suitable subchirp bandwidths are taken and designed transmitting mode is adopted which removes the MSCF from AF, the designed waveforms’ ASP obtains an effective suppression near the main lobe, as obtained in
Figure 11.
By comparing the results in
Figure 11b with that of
Figure 2b, it shows that the cross-correlation functions of the conventional waveforms and designed waveforms are diverse. The cross-correlation functions of the conventional waveforms in
Figure 2b have some high grating sidelobes, which are easily judged as weak targets, especially when multiple sidelobes of several close targets overlap and cause false detection. The reason for this is that subchirps with the same carrier frequency and the same chirp rate of two signals simultaneously exist in the same subchirp durations. Since the chirp rates of two signals have kept enough interval as the proposed methods, the sidelobes in the cross-correlation function of the designed waveforms reduce dramatically in
Figure 11b, and the sidelobe levels are more stable than that of the conventional waveforms.
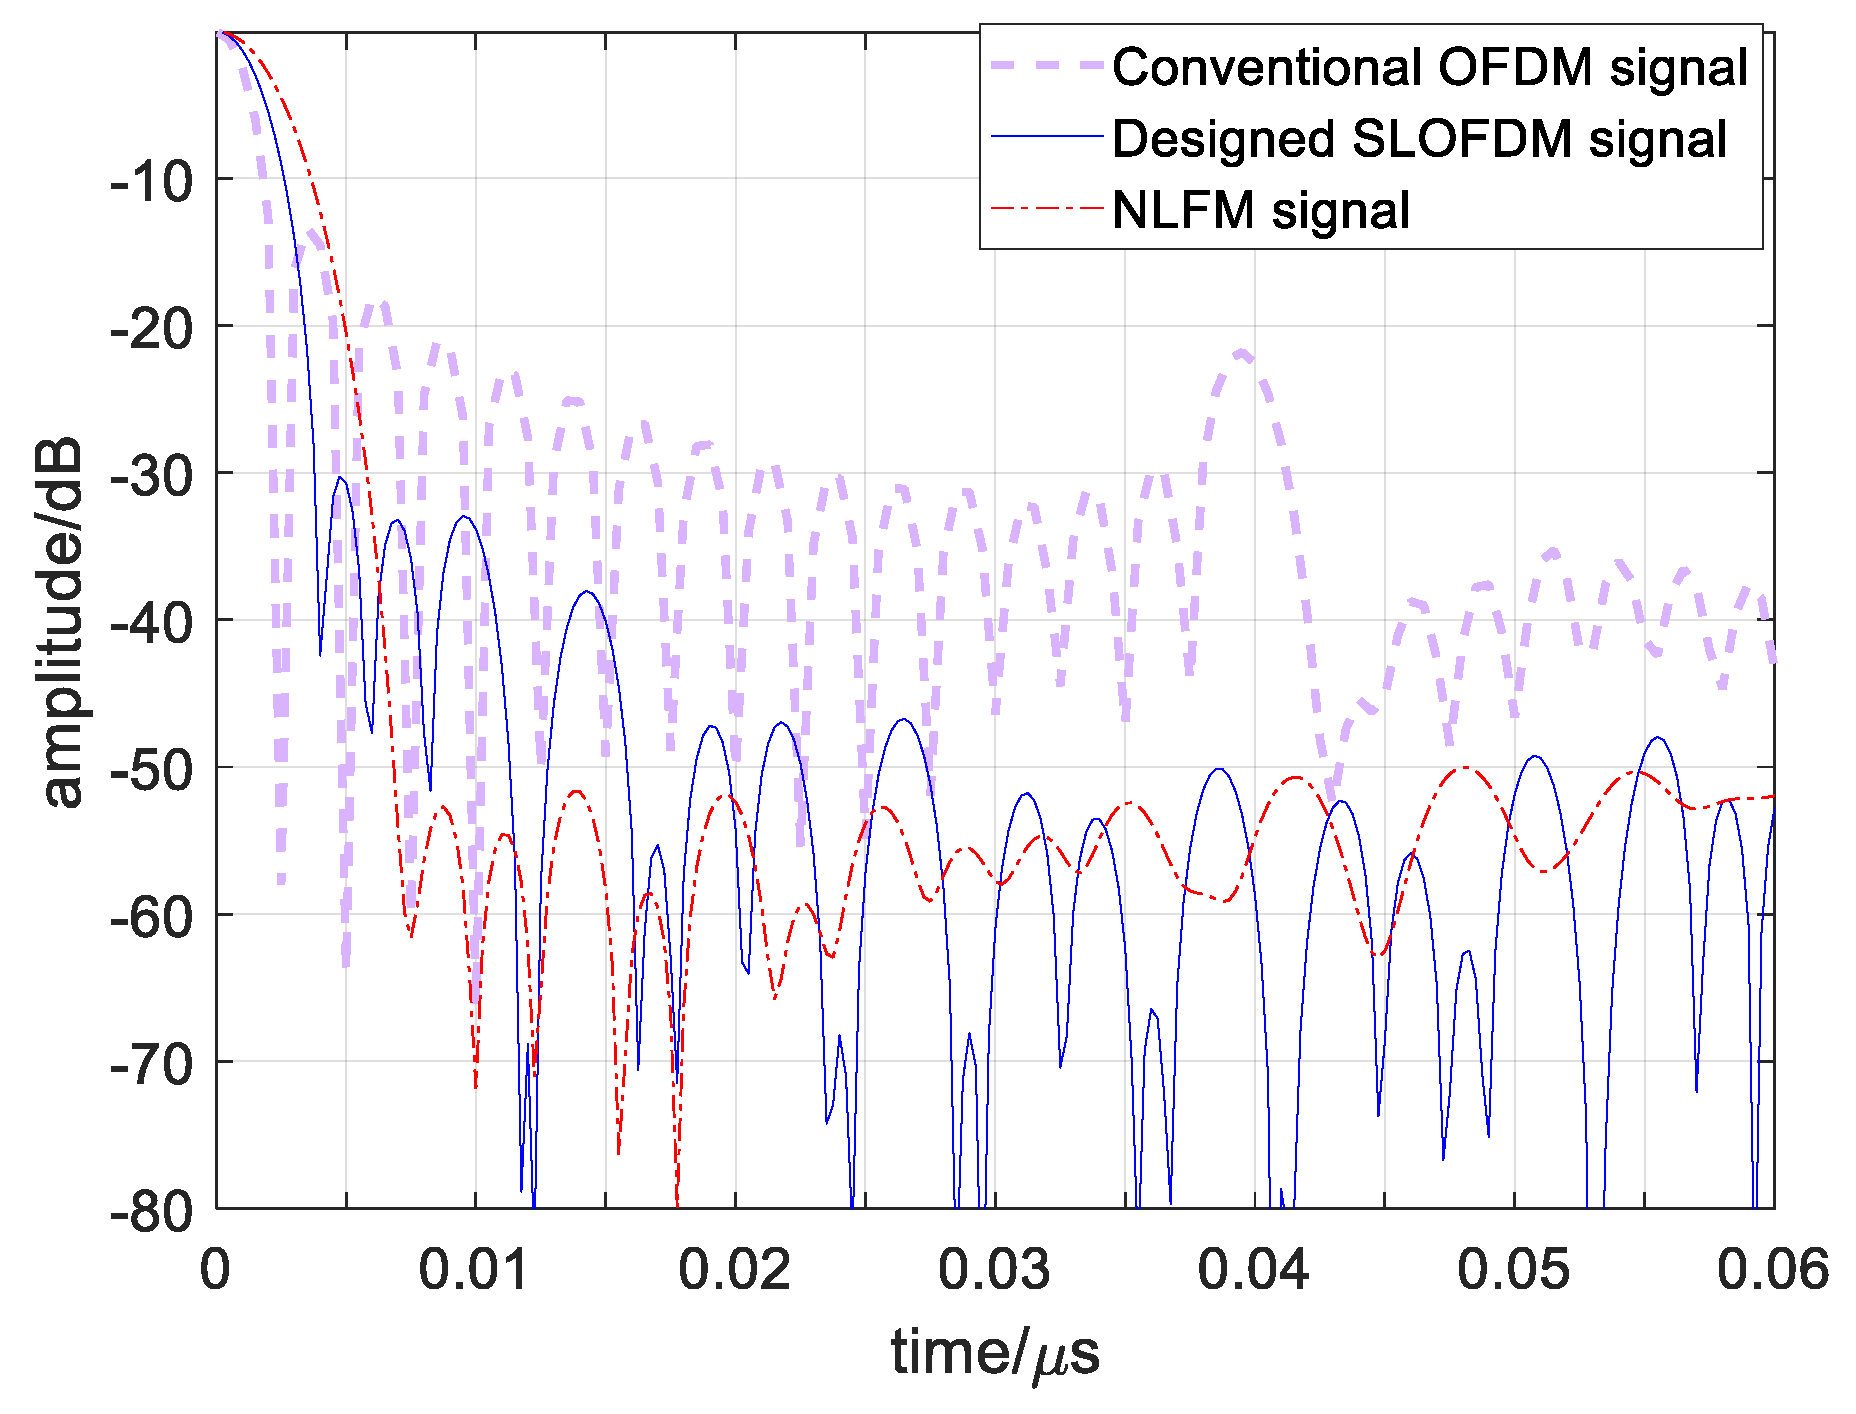
For an evaluation of the resolution property, the autocorrelation curves comparison has been made in
Figure 12. Since there exists a difference among the frequency spectrums of the three signals, they have different autocorrelation function structures. The nonlinear frequency modulation (NLFM) signal has widest main lobe, 4.05 ns, and the lowest sidelobes, −52.7 dB, and the conventional OFDM signal has the narrowest main lobe, 2.16 ns, but the highest sidelobes, −13.4 dB. The designed signal takes the middle properties with the main lobe width, 3 ns, and sidelobe height, −30.2 dB, which obtains a balance between resolution and detection. Therefore, the resolution property of the designed signal reduces for the improvement of detection, which is 0.52 m compared with 0.375 m for the conventional one.
Next, for further comparisons of detection performance, the ASP and CP values of conventional OFDM (COFDM) signal, Li’s OFDM signal [
25], piecewise nonlinear frequency modulation OFDM (PNLFM-OFDM) signal [
26], and the designed segmented transmitting OFDM (STOFDM) signal are listed in
Table 4. Where the STOFDM signal is superior with the lowest sidelobes in both ASP and CP.
To better evaluate the multiple signals detection performance, different combinations of four designed signals are simulated with their ASP and CP values listed in
Table 5. The autocorrelation of signal
and cross-correlation between signal
and
are shown in
Figure 13. In addition, the autocorrelation of signal
and cross-correlation between signal
and
are shown in
Figure 14. The average correlation sidelobes among four designed signals
are stable and all lower than −30 dB since the number of transmitting signals adds to 4, which proves the good sidelobe properties of STOFDM signals as MIMO radar signals.
Finally, we simulate the proposed OFDM chirp waveforms in a MIMO radar one-dimensional range imaging application. Without loss of generality, we consider a four-antenna MIMO radar using the waveforms
illustrated in
Figure 10. Other parameters are assumed as:
,
. In a one-dimensional range image, we decomposed a ship target, which is 172 m long and 16m wide, into 152 point targets.
Figure 15a shows the one-dimensional radar cross section (RCS) range images and
Figure 15b shows the one of four matched filters output of
. For a comparison, the imaging result for a conventional single input single output (SISO) radar using a conventional OFDM chirp signal with equal system parameters is also shown in
Figure 15c. Compared with
Figure 15a, there are some high amplitude false target points in
Figure 15c, for the high range peak sidelobe ratios (RPSLR) of conventional chirp signal. But in
Figure 15b, those false targets are suppressed and real target points are compatible with
Figure 15 even after adding cross-correlation interferences with
. The RPSLRs of each signal are shown in
Table 6.


