A Differential Detection Method Based on a Linear Weak Measurement System

 ,
,
Abstract
1. Introduction
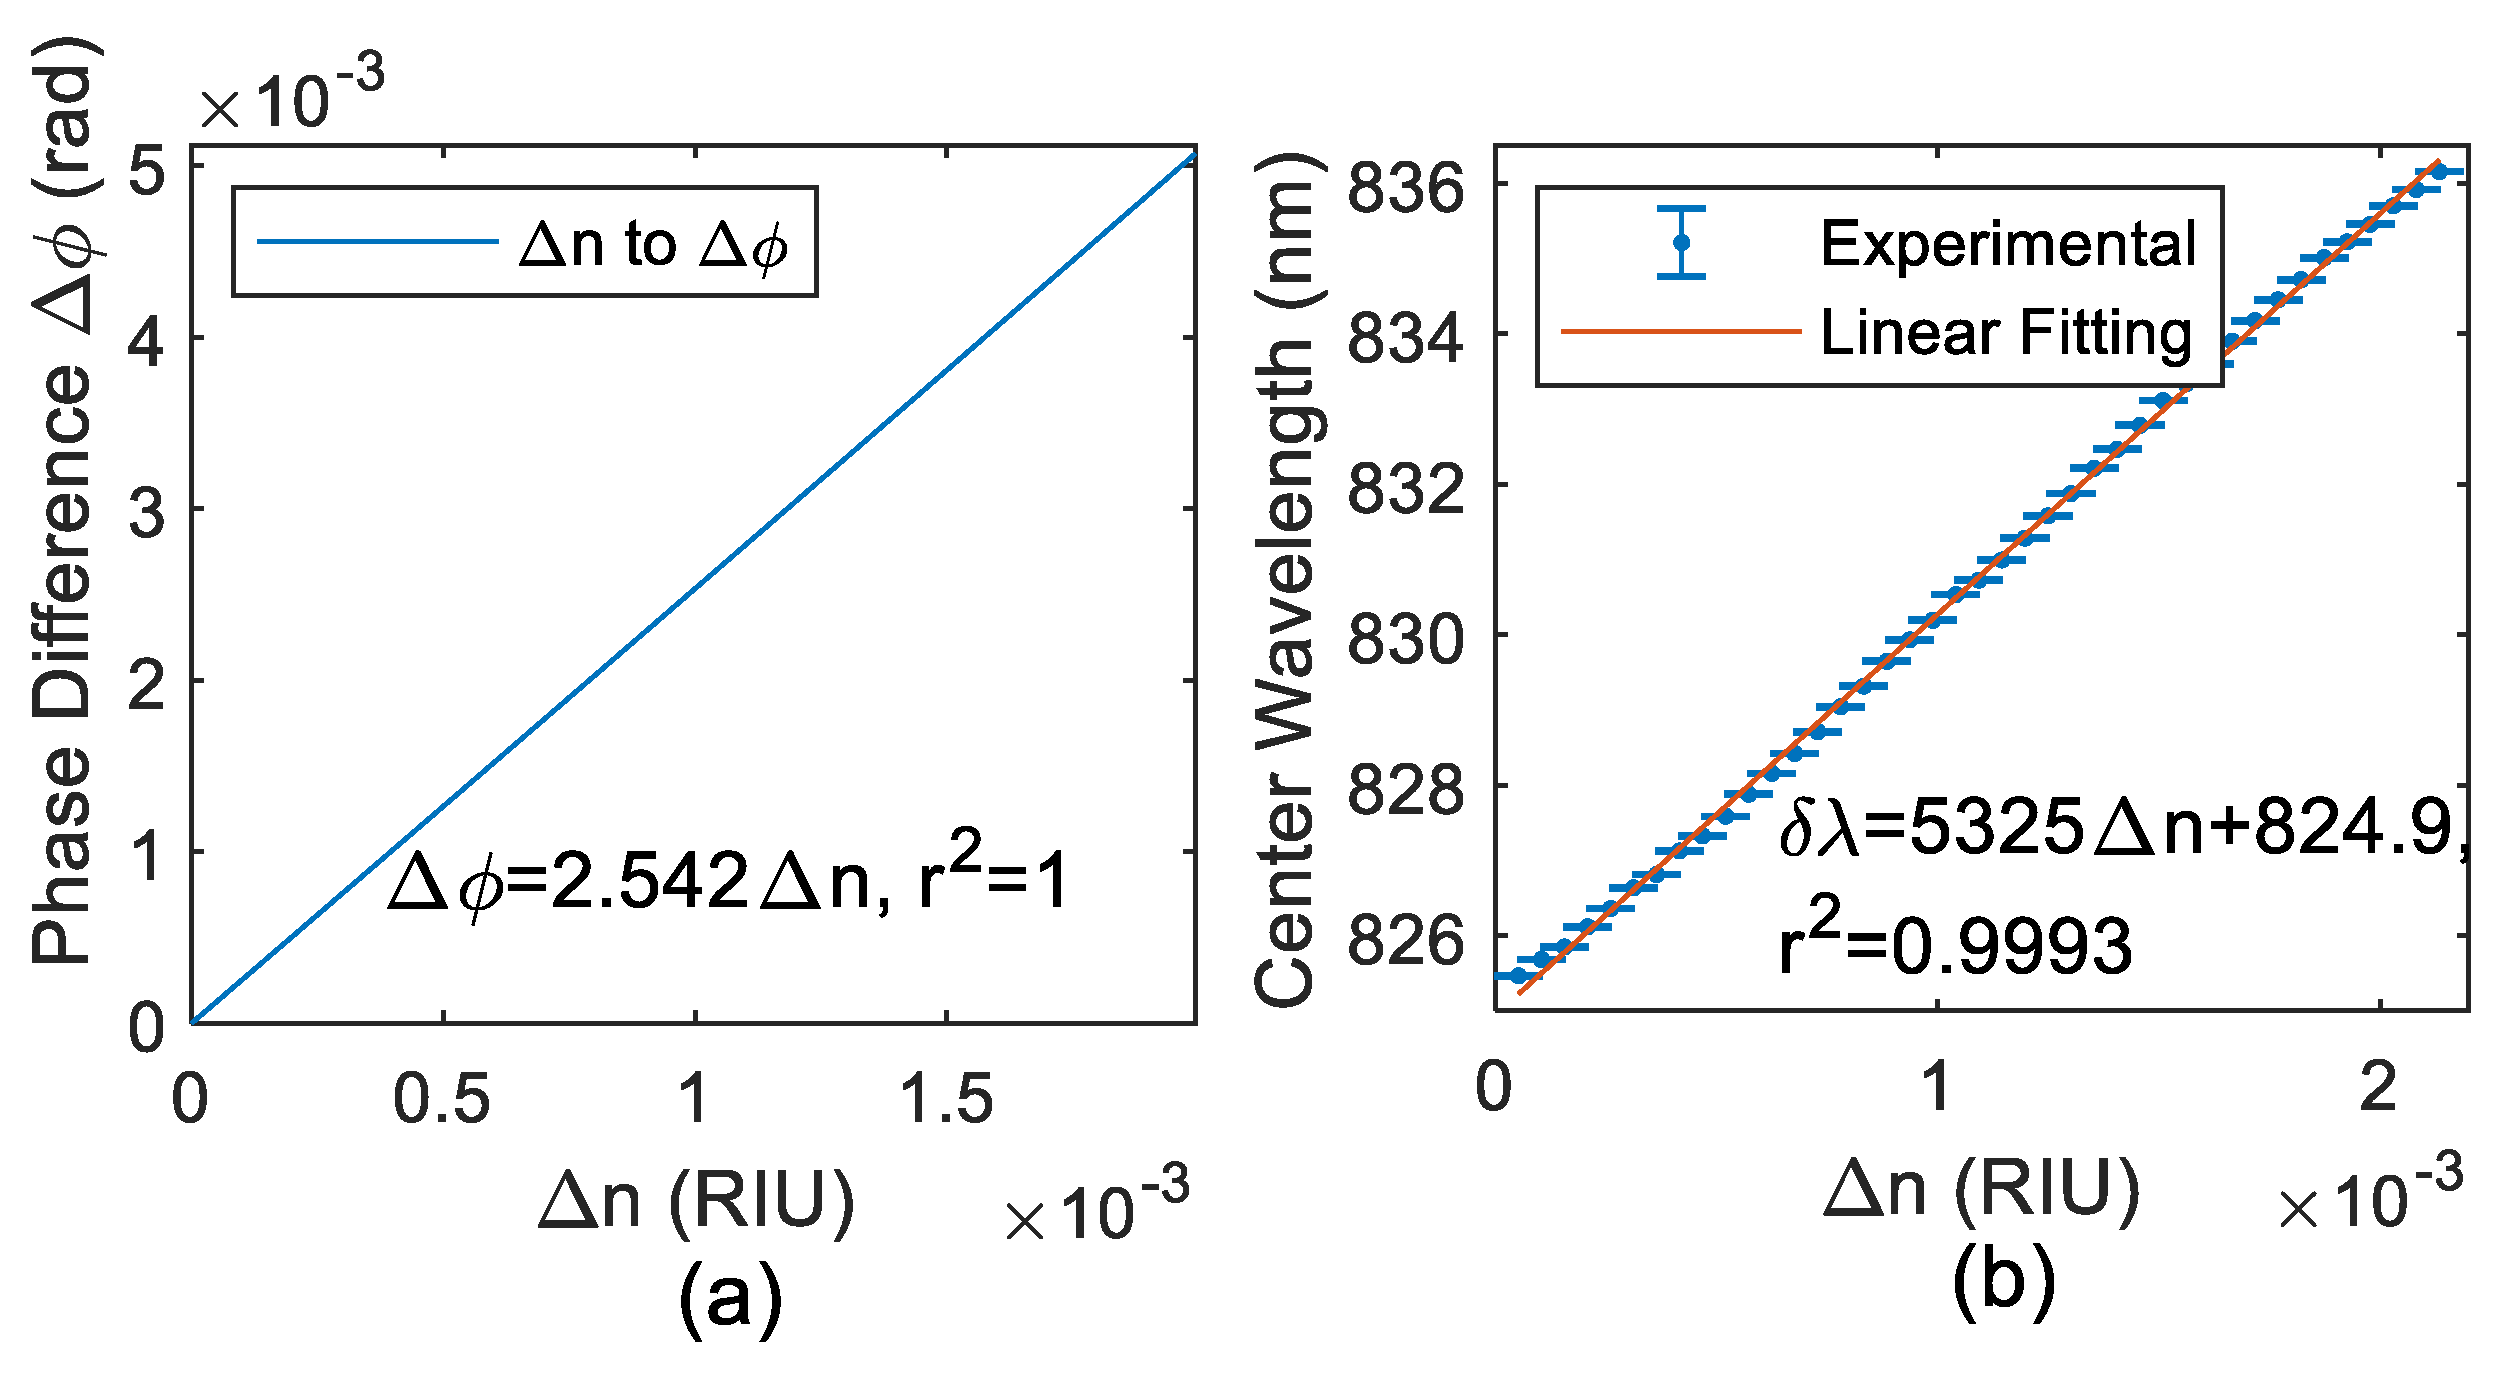
2. Theory
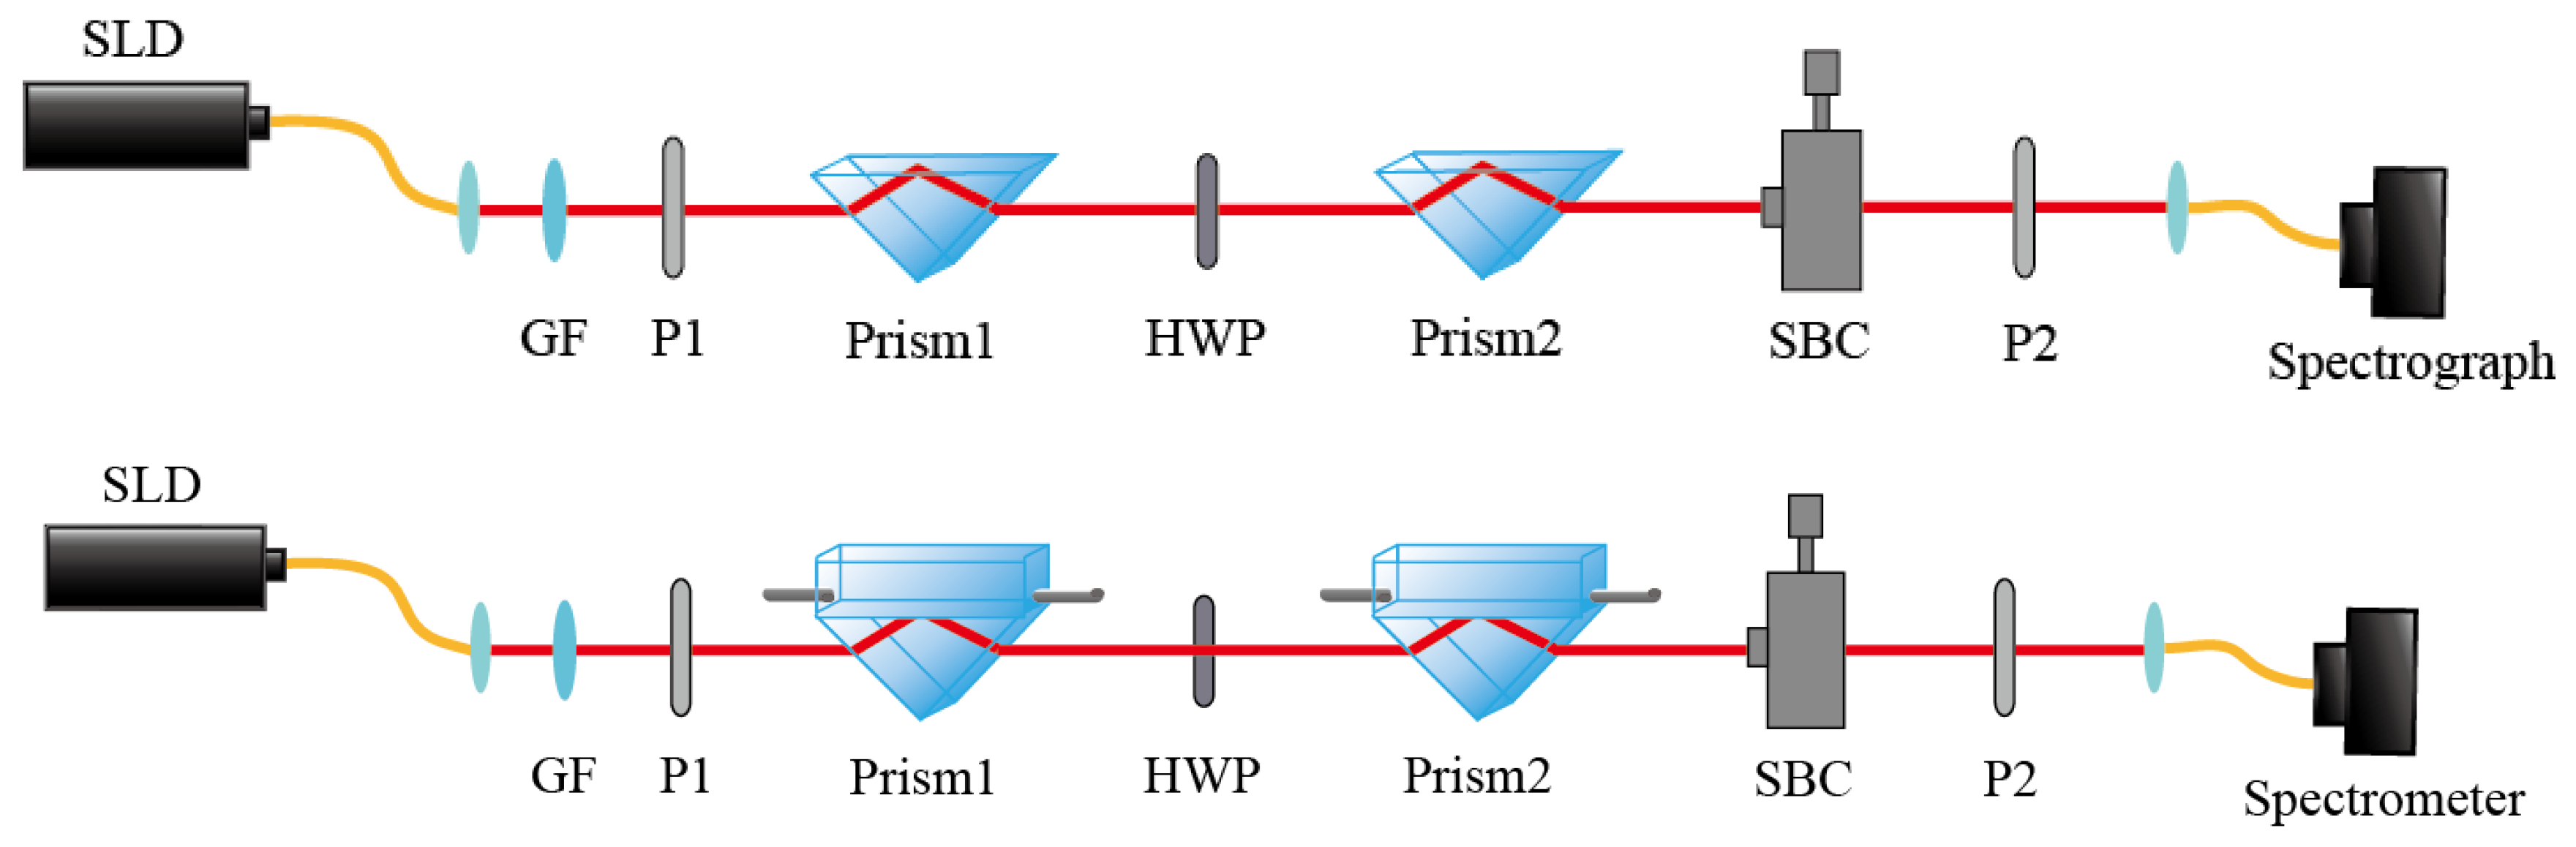
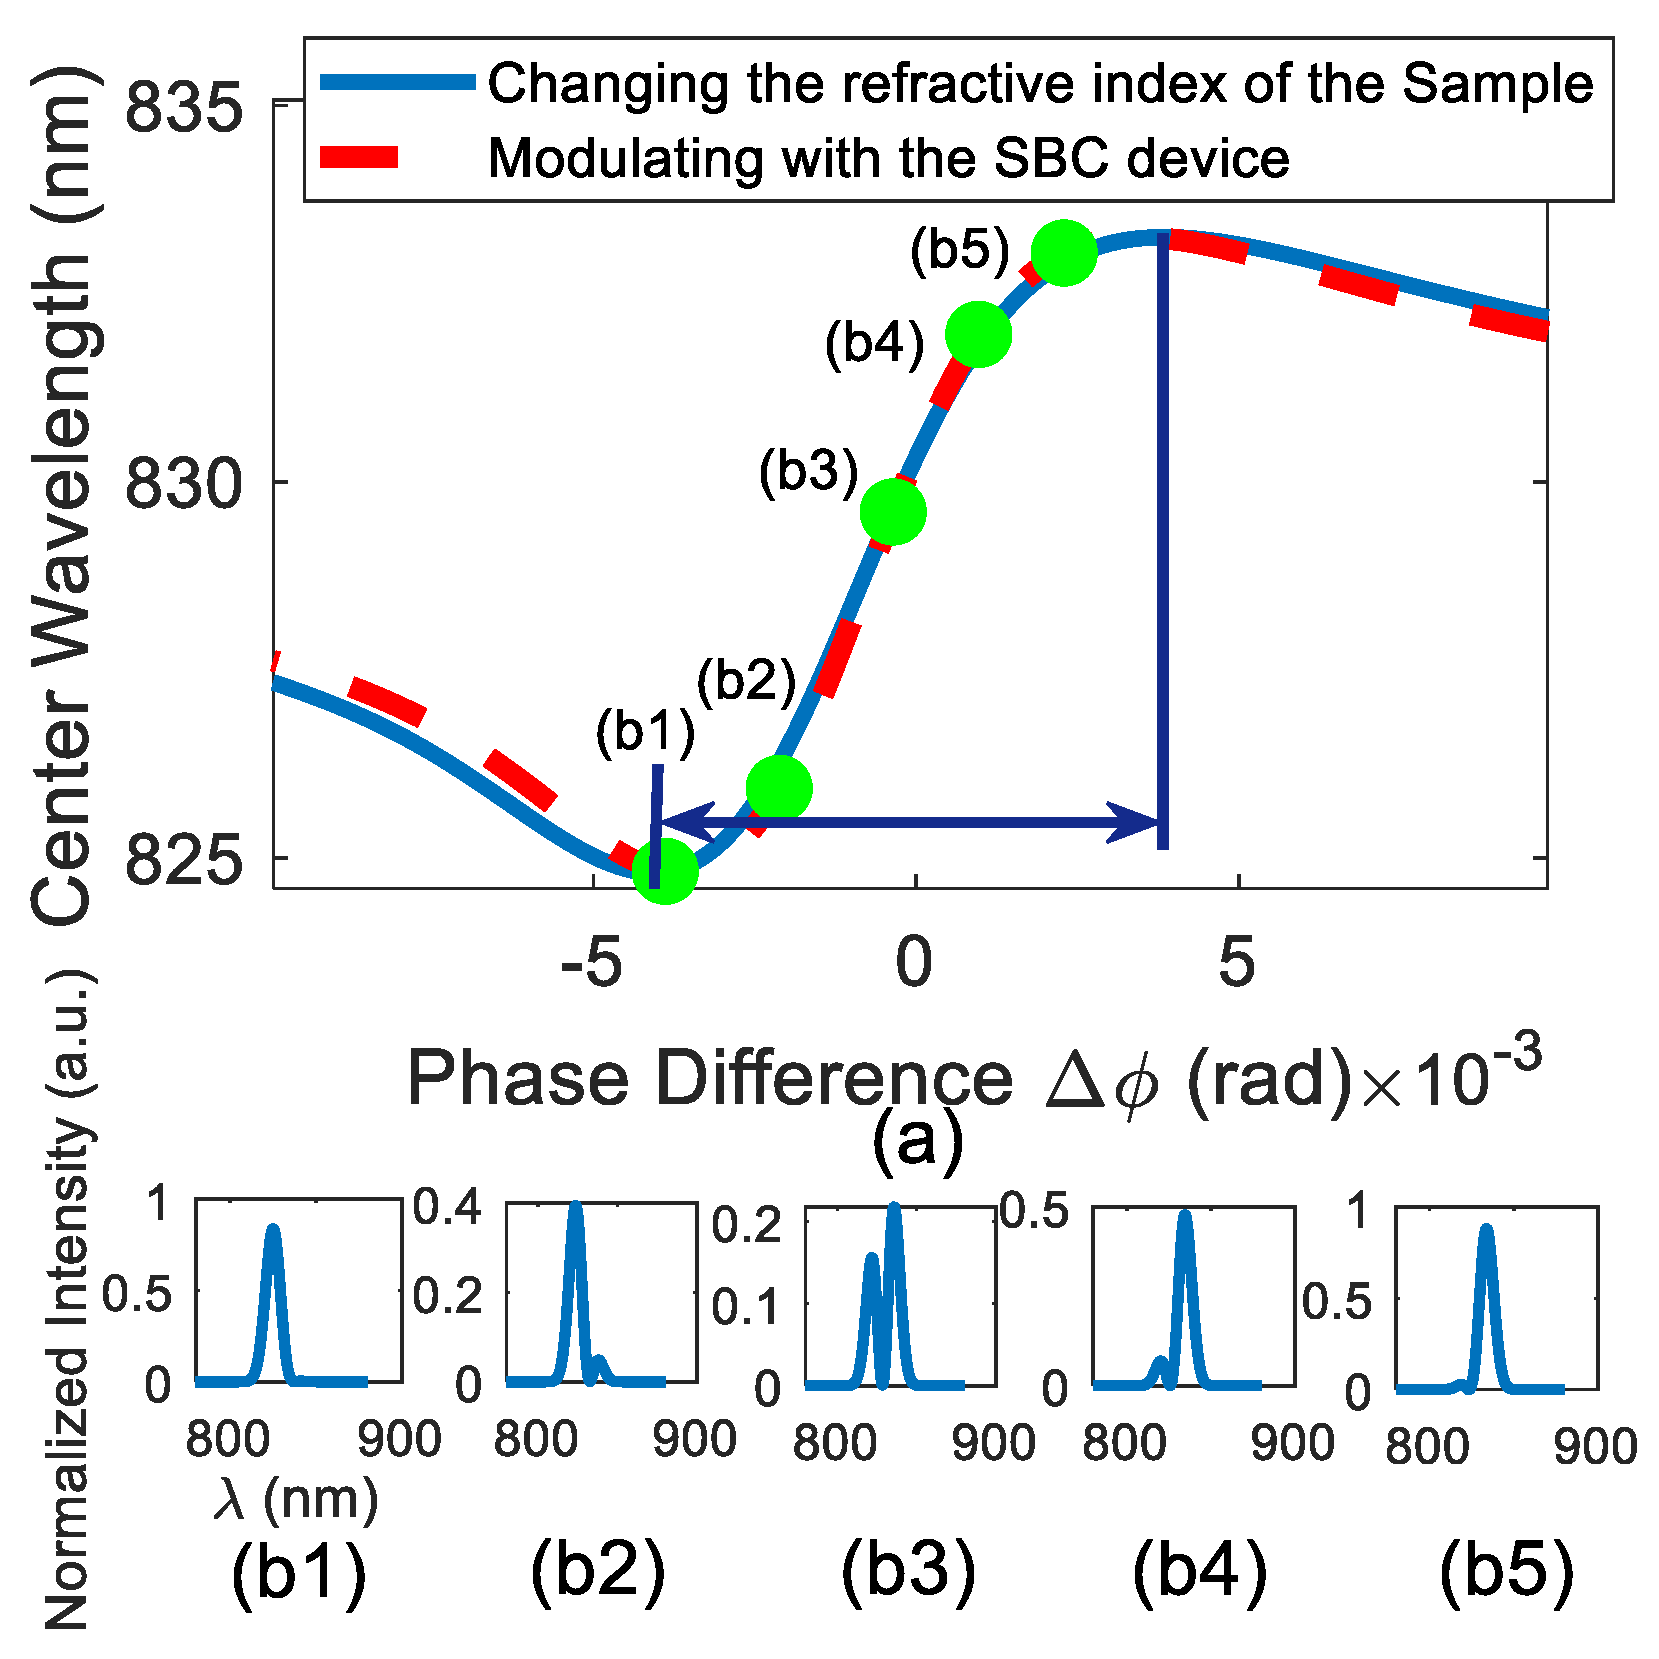
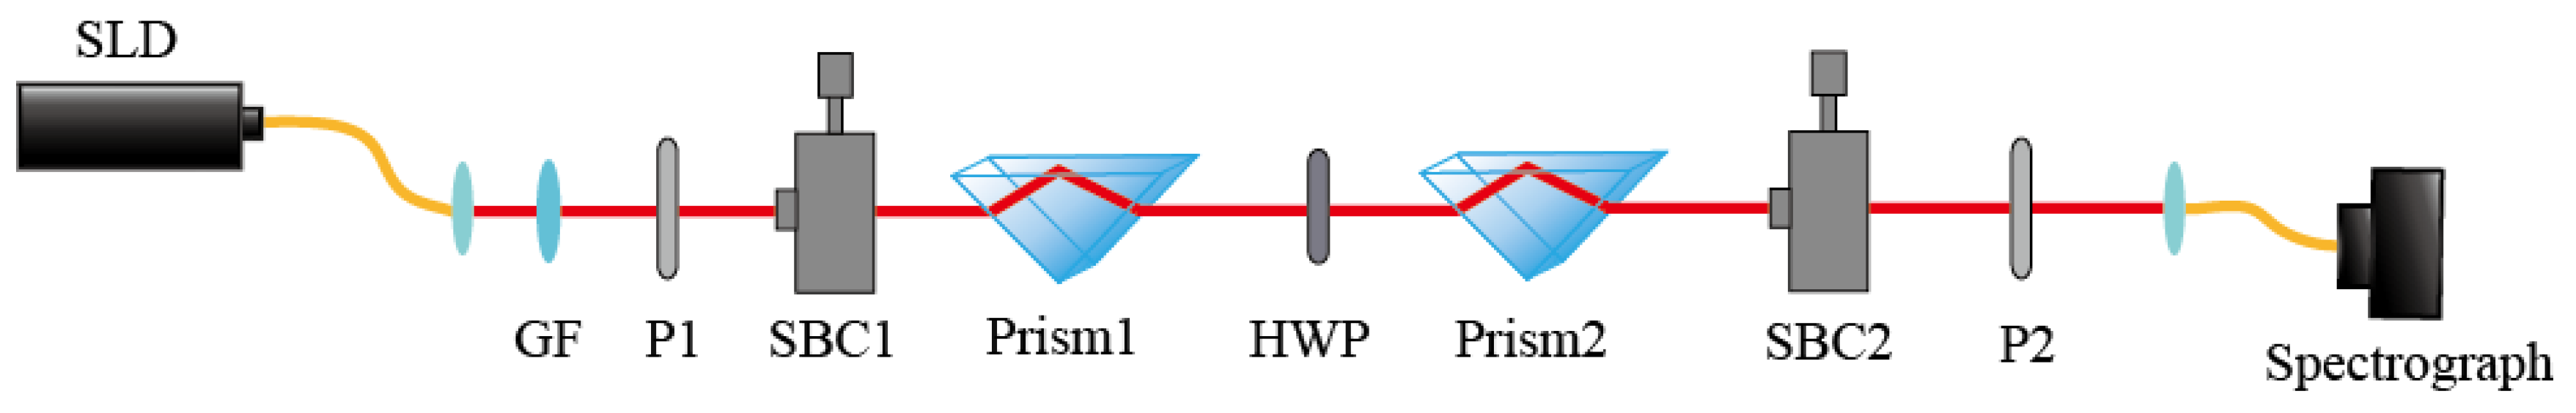
3. Experiments
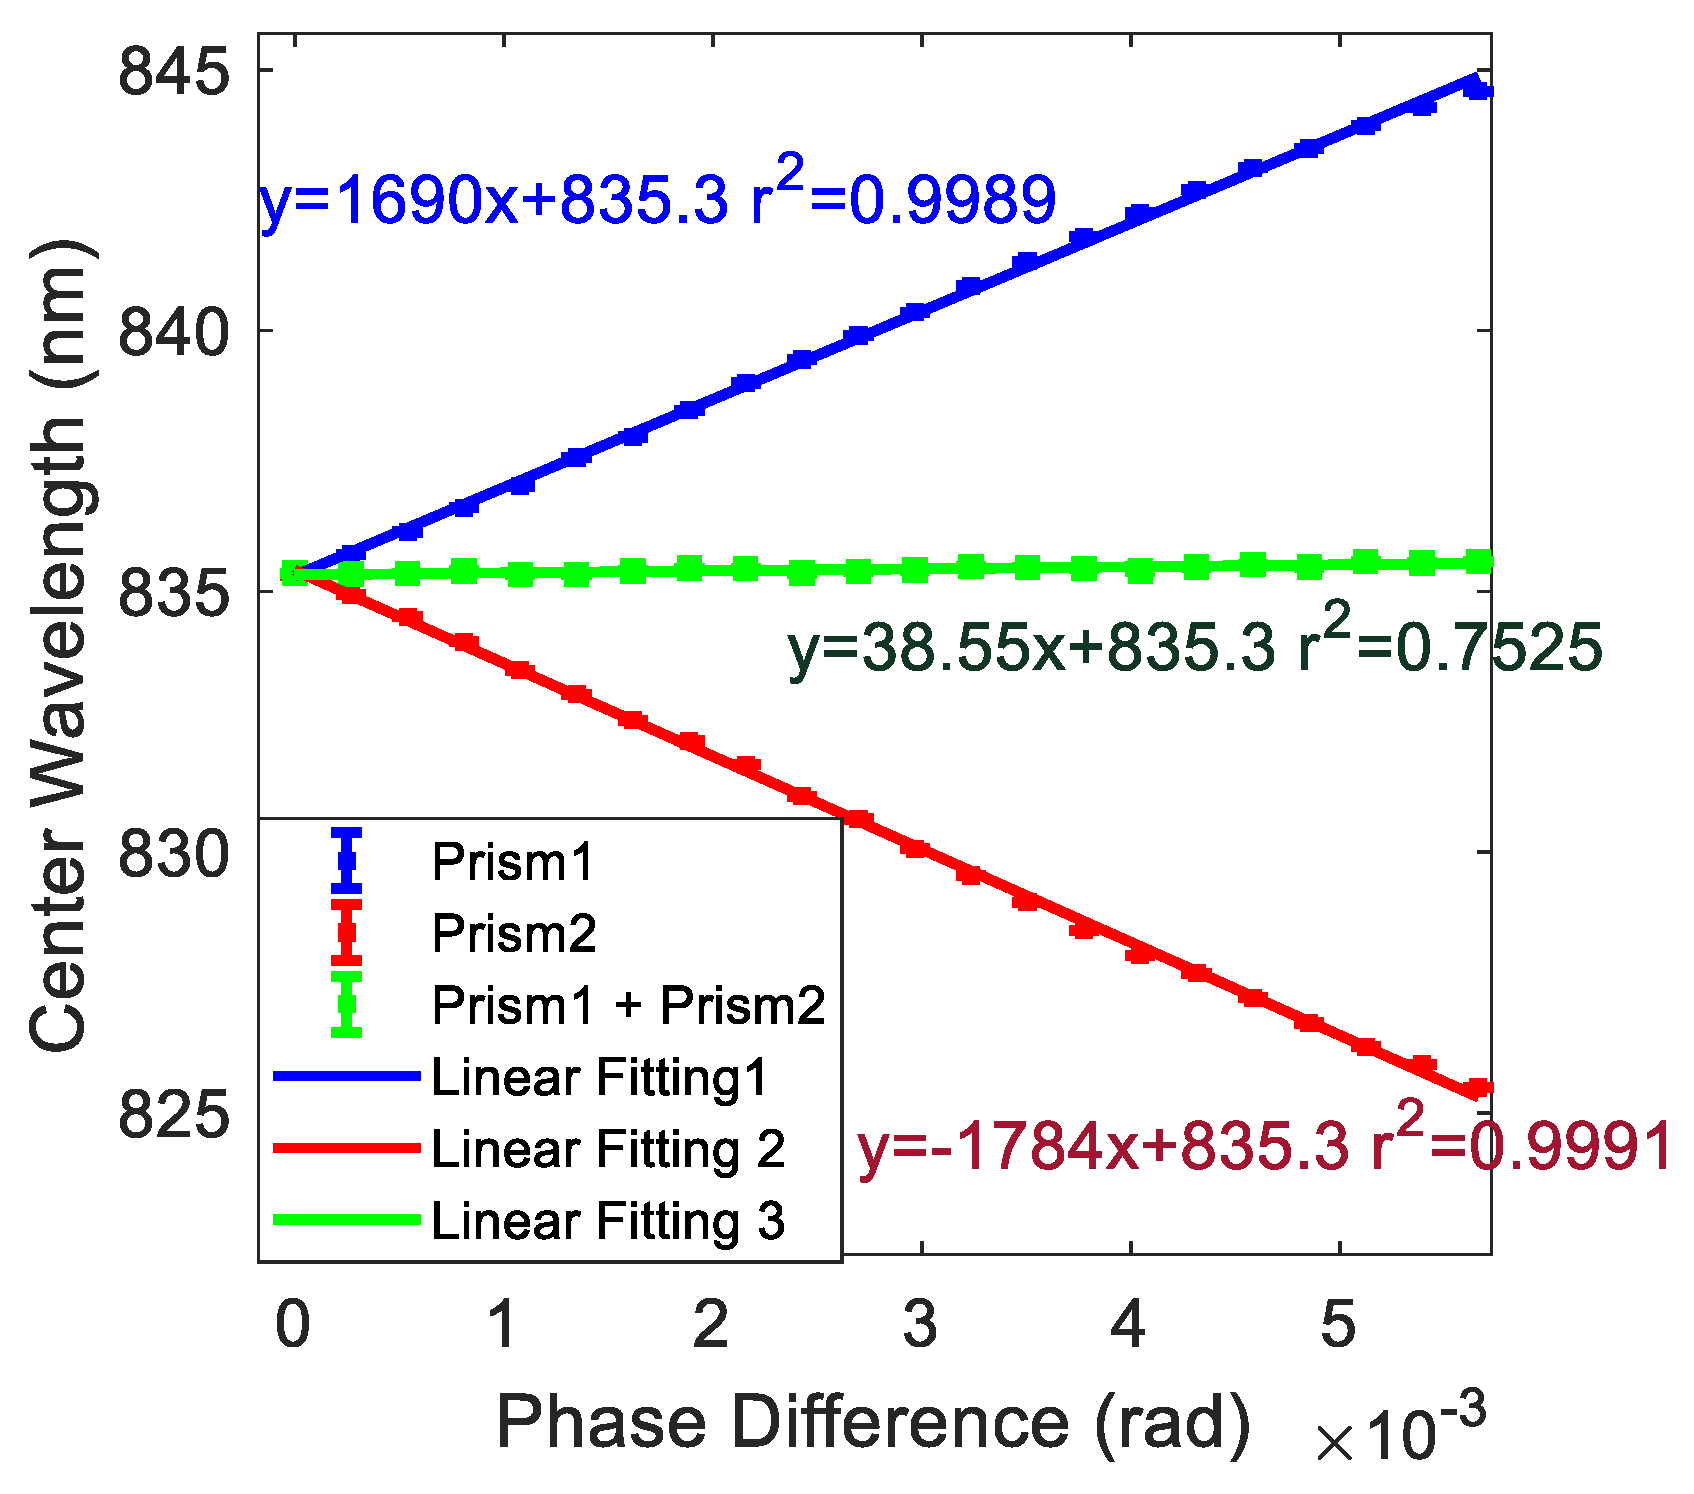
- First, the SBC1 was modulated by a step of 0.005 mm (0.0027 rad of phase difference) each time, with the SBC2 unchanged in our system. For each step, we recorded the real-time the center wavelength shift of the spectrum acquired by the HR4000 spectrometer. As shown in Figure 4 by the blue line, as the phase difference of SBC1 increased, the system center wavelength shift gradually increased in a linearly way to the positive side. The slope was 1013.8 nm/rad.
- Similarly, SBC2 was adjusted in the same way as in 1, with SBC1 unchanged. For each step, the center wavelength shift of the spectrum was recorded by the HR4000 spectrometer. As shown in Figure 4 by the red line, as the phase difference of SBC2 increased, the system center wavelength shift gradually decreased in a linearly way to the negative side, by a slope of −1070.4 nm/rad, as opposed to the system center wavelength in 1 with the SBC scale change.
- Finally, to evaluate the differentiating effect, we adjusted SCB1 and SBC2 in the same direction simultaneously and kept adjusting the same step as in 1 and 2. After each adjustment of the two SBCs, we recorded the central wavelength shift of the spectrum acquired by the spectrometer. As shown in Figure 4 by the green line, the center wavelength of the system remains essentially the same (slope of 23.1 nm/rad) when the two SBCs were modulated in this simultaneous way.
4. Discussion
- In the weak measurement system, since the pre- and post-selected polarization states are almost orthogonal, the optical weak measurement sensor system suffers a certain loss of light intensity, causing the signal to be weak, and reducing the signal to noise ratio (SNR). Thus, the SNR can be increased by using a larger power light source or increasing the spectrometer integration time.
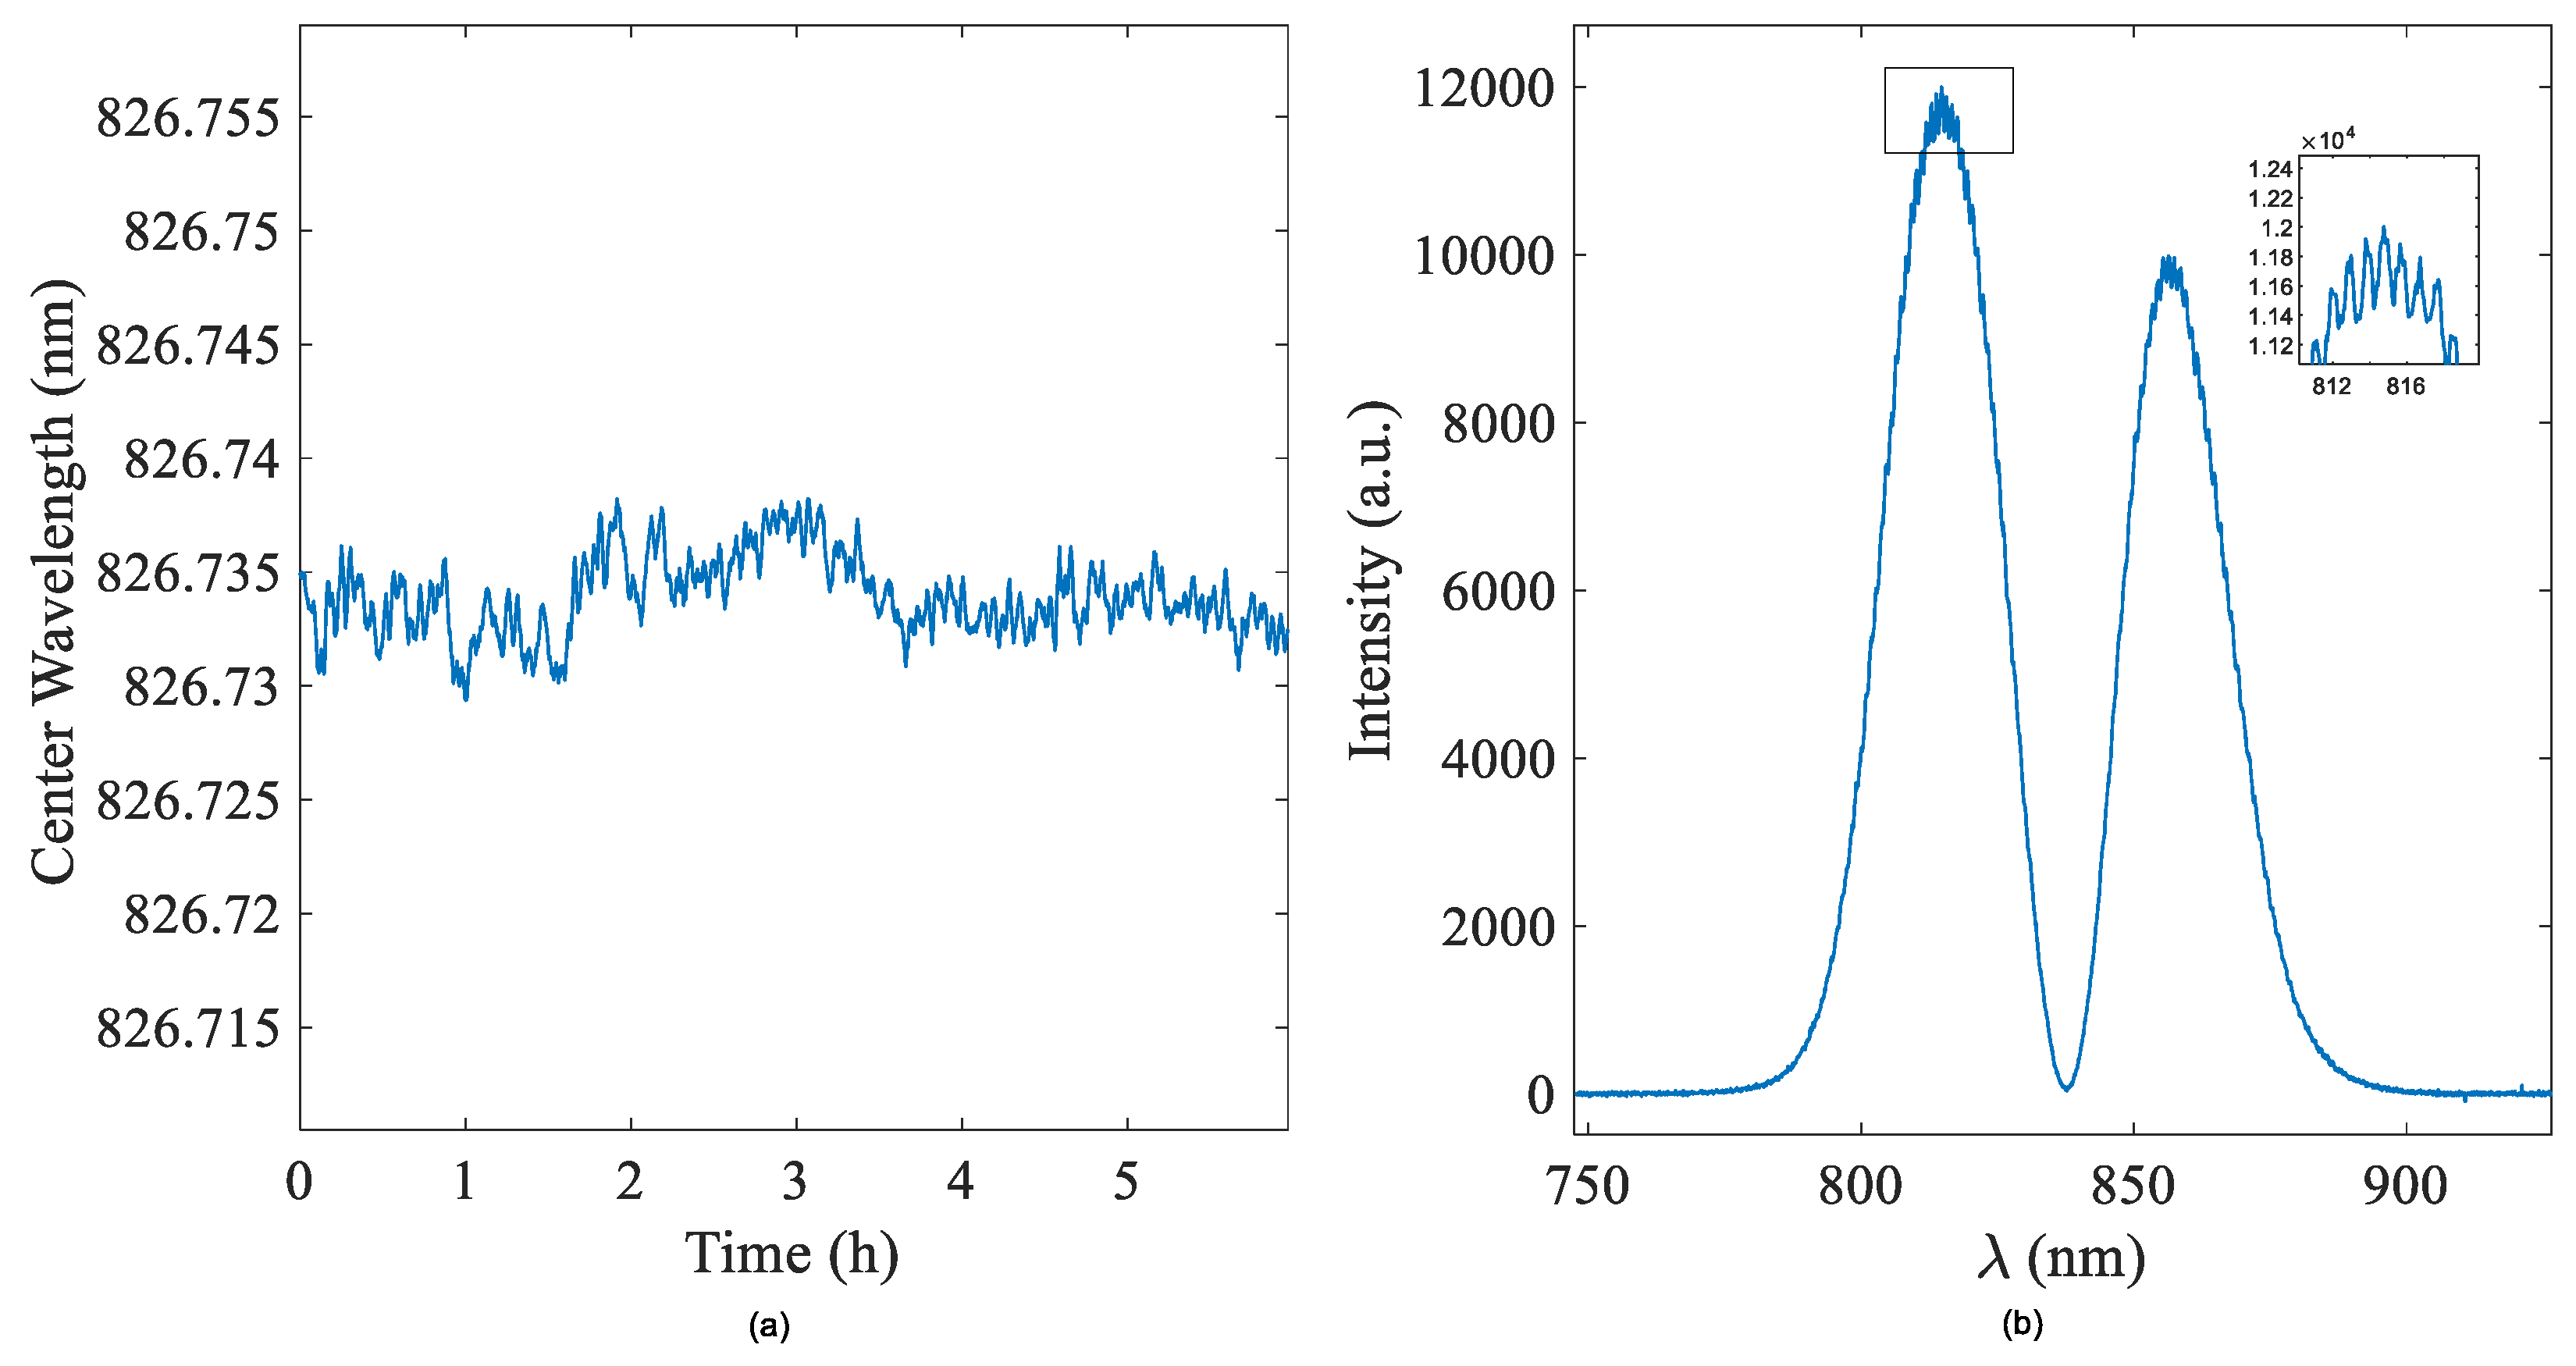
- At the same time, environmental factors also have a great influence on the weak measurement system. Factors such as temperature and vibration may cause errors in the experimental results. The external environment is required to be relatively stable to carry out a precise measurement. In this experiment, we controlled the ambient temperature to 25 degrees Celsius (0.1 degree Celsius) and built the system on an airborne optical platform.
5. Conclusions
Author Contributions
Funding
Conflicts of Interest
References
- Aharonov, Y.; Albert, D.Z.; Vaidman, L. How the result of a measurement of a component of the spin of a spin-1/2 particle can turn out to be 100. Phys. Rev. Lett. 1988, 60, 1351–1354. [Google Scholar] [CrossRef]
- Ritchie, N.W.M.; Story, J.G.; Hulet, R.G. Realization of a measurement of a “weak value”. Phys. Rev. Lett. 1991, 66, 1107–1110. [Google Scholar] [CrossRef]
- Chen, S.; Mi, C.; Cai, L.; Liu, M.; Luo, H.; Wen, S. Observation of the Goos-Hänchen shift in graphene via weak measurements. Appl. Phys. Lett. 2017, 110, 031105. [Google Scholar] [CrossRef]
- Jayaswal, G.; Mistura, G.; Merano, M. Observation of the Imbert–Fedorov effect via weak value amplification. Opt. Lett. 2014, 39, 2266–2269. [Google Scholar] [CrossRef]
- Zhou, X.; Li, X.; Luo, H.; Wen, S. Optimal preselection and postselection in weak measurements for observing photonic spin Hall effect. Appl. Phys. Lett. 2014, 104, 051130. [Google Scholar] [CrossRef]
- Brunner, N.; Simon, C. Measuring small longitudinal phase shifts: Weak measurements or standard interferometry? Phys. Rev. Lett. 2010, 105, 010405. [Google Scholar] [CrossRef]
- Qiu, X.; Xie, L.; Liu, X.; Luo, L.; Li, Z.; Zhang, Z.; Du, J. Precision phase estimation based on weak-value amplification. Appl. Phys. Lett. 2017, 110, 071105. [Google Scholar] [CrossRef]
- Viza, G.I.; Martínez-Rincón, J.; Howland, G.A.; Frostig, H.; Shomroni, I.; Dayan, B.; Howell, J.C. Weak-values technique for velocity measurements. Opt. Lett. 2013, 38, 2949–2952. [Google Scholar] [CrossRef]
- Salazar-Serrano, L.J.; Barrera, D.; Amaya, W.; Sales, S.; Pruneri, V.; Capmany, J.; Torres, J.P. Enhancement of the sensitivity of a temperature sensor based on fiber Bragg gratings via weak value amplification. Opt. Lett. 2015, 40, 3962–3965. [Google Scholar] [CrossRef]
- Hosten, O.; Kwiat, P. Observation of the spin Hall effect of light via weak measurements. Science 2008, 319, 787–790. [Google Scholar] [CrossRef]
- Qiu, X.; Xie, L.; Liu, X.; Luo, L.; Zhang, Z.; Du, J. Estimation of optical rotation of chiral molecules with weak measurements. Opt. Lett. 2016, 41, 4032–4035. [Google Scholar] [CrossRef]
- Matko, V.; Milanovic, M. Temperature-compensated capacitance–frequency converter with high resolution. Sens. Actuators A Phys. 2014, 220, 262. [Google Scholar] [CrossRef]
- Matko, V. Next generation AT-cut quartz crystal sensing devices. Sensors 2011, 11, 4474. [Google Scholar] [CrossRef]
- Zhang, Y.; Li, D.; He, Y.; Shen, Z.; He, Q. Optical weak measurement system with common path implementation for label-free biomolecule sensing. Opt. Lett. 2016, 41, 5409–5412. [Google Scholar] [CrossRef] [PubMed]
- Xu, Y.; Shi, L.X.; Guan, T.; Li, D.M.; Yang, Y.X.; Wang, X.N.; Li, Z.Y.; Xie, L.Y.; Zhou, X.S.; He, Y.; et al. Optimization of a quantum weak measurement system with digital filtering technology. Appl. Opt. 2018, 57, 7956. [Google Scholar]
- Xu, Y.; Shi, L.X.; Guan, T.; Guo, C.X.; Li, D.M.; Yang, Y.X.; Wang, X.N.; Xie, L.Y.; He, Y.H.; Xie, W.Y. Optimization of a quantum weak measurement system with its working areas. Opt. Express 2018, 26, 21119. [Google Scholar] [CrossRef] [PubMed]
- Guan, T.; Yang, Y.X.; Zhang, Q.W.; He, Y.H.; Xu, N.H.; Li, D.M.; Shi, L.X.; Xu, Y.; Wang, X.N. A chiral sensor based on weak measurement for the determination of Proline enantiomers in diverse measuring circumstances. Sci. Rep. 2019, 9. [Google Scholar]
- Zhang, Y.J.; Shi, L.X.; Xu, Y.; Zheng, X.; Li, J.W.; Wu, Q.; Li, S.X.; He, Y.H. Optical quantum weak measurement coupled with UV spectrophotometry for sensitively and non-separatedly detecting enantiopurity. Opt. Express 2019, 27, 9330. [Google Scholar] [CrossRef]
- Guan, T.; Wang, X.; Li, D.; Zhang, Y.; He, Y.; Shi, L.; Liu, Y.; Yang, Y.; Xu, Y.; Cui, R. Determination of tumor marker carcinoembryonic antigen with biosensor based on optical quantum weak measurements. Sensors 2018, 18, 1550. [Google Scholar] [CrossRef] [PubMed]
- Lukosz, W.; Stamm, C.; Moser, H.R.; Ryf, R.; Dübendorfer, J. Difference interferometer with new phase-measurement method as integrated-optical refractometer, humidity sensor and biosensor. Sens. Actuators B Chem. 1997, 39, 316–323. [Google Scholar] [CrossRef]
- Stamm, C.; Dangel, R.; Lukosz, W. Biosensing with the integrated-optical difference interferometer: Dual-wavelength operation. Opt. Commun. 1998, 153, 347–359. [Google Scholar] [CrossRef]
- Hastings, J.T.; Guo, J.; Keathley, P.D.; Kumaresh, P.B.; Wei, Y.; Law, S.; Bachas, L.G. Optimal self-referenced sensing using long-and short-range surface plasmons. Opt. Express 2007, 15, 17661–17672. [Google Scholar] [CrossRef]
- Li, D.; Guan, T.; He, Y.; He, Q.; Zhang, Y.; Wang, X.; Shen, Z.; Yang, Y.; Qiao, Z.; Ji, Y. A differential weak measurement system based on Sagnac interferometer for self-referencing biomolecule detection. J. Phys. D Appl. Phys. 2017, 50, 49. [Google Scholar] [CrossRef]
- Von Neumann, J. Mathematische Grundlagen der Quantenmechanik; Springer: Berlin, Germany, 1932. [Google Scholar]
- Von Neumann, J. Mathematical Foundations of Quantum Mechanics; Princeton University Press: Princeton, NJ, USA, 1955. [Google Scholar]
- Duck, I.M.; Stevenson, P.M.; Sudarshan, E.C. The sense in which a “weak measurement” of a spin-½ particle’s spin component yields a value 100. Phys. Rev. D 1989, 40, 2112. [Google Scholar] [CrossRef]
- Aharonov, Y.; Vaidman, L. Properties of a quantum system during the time interval between two measurements. Phys. Rev. A 1990, 41, 11–20. [Google Scholar] [CrossRef]
- Li, D.M.; Shen, Z.Y.; He, Y.H.; Zhang, Y.L.; Chen, Z.L.; Ma, H. Application of quantum weak measurement for glucose concentration detection. Appl. Opt. 2016, 55, 1697. [Google Scholar] [CrossRef]


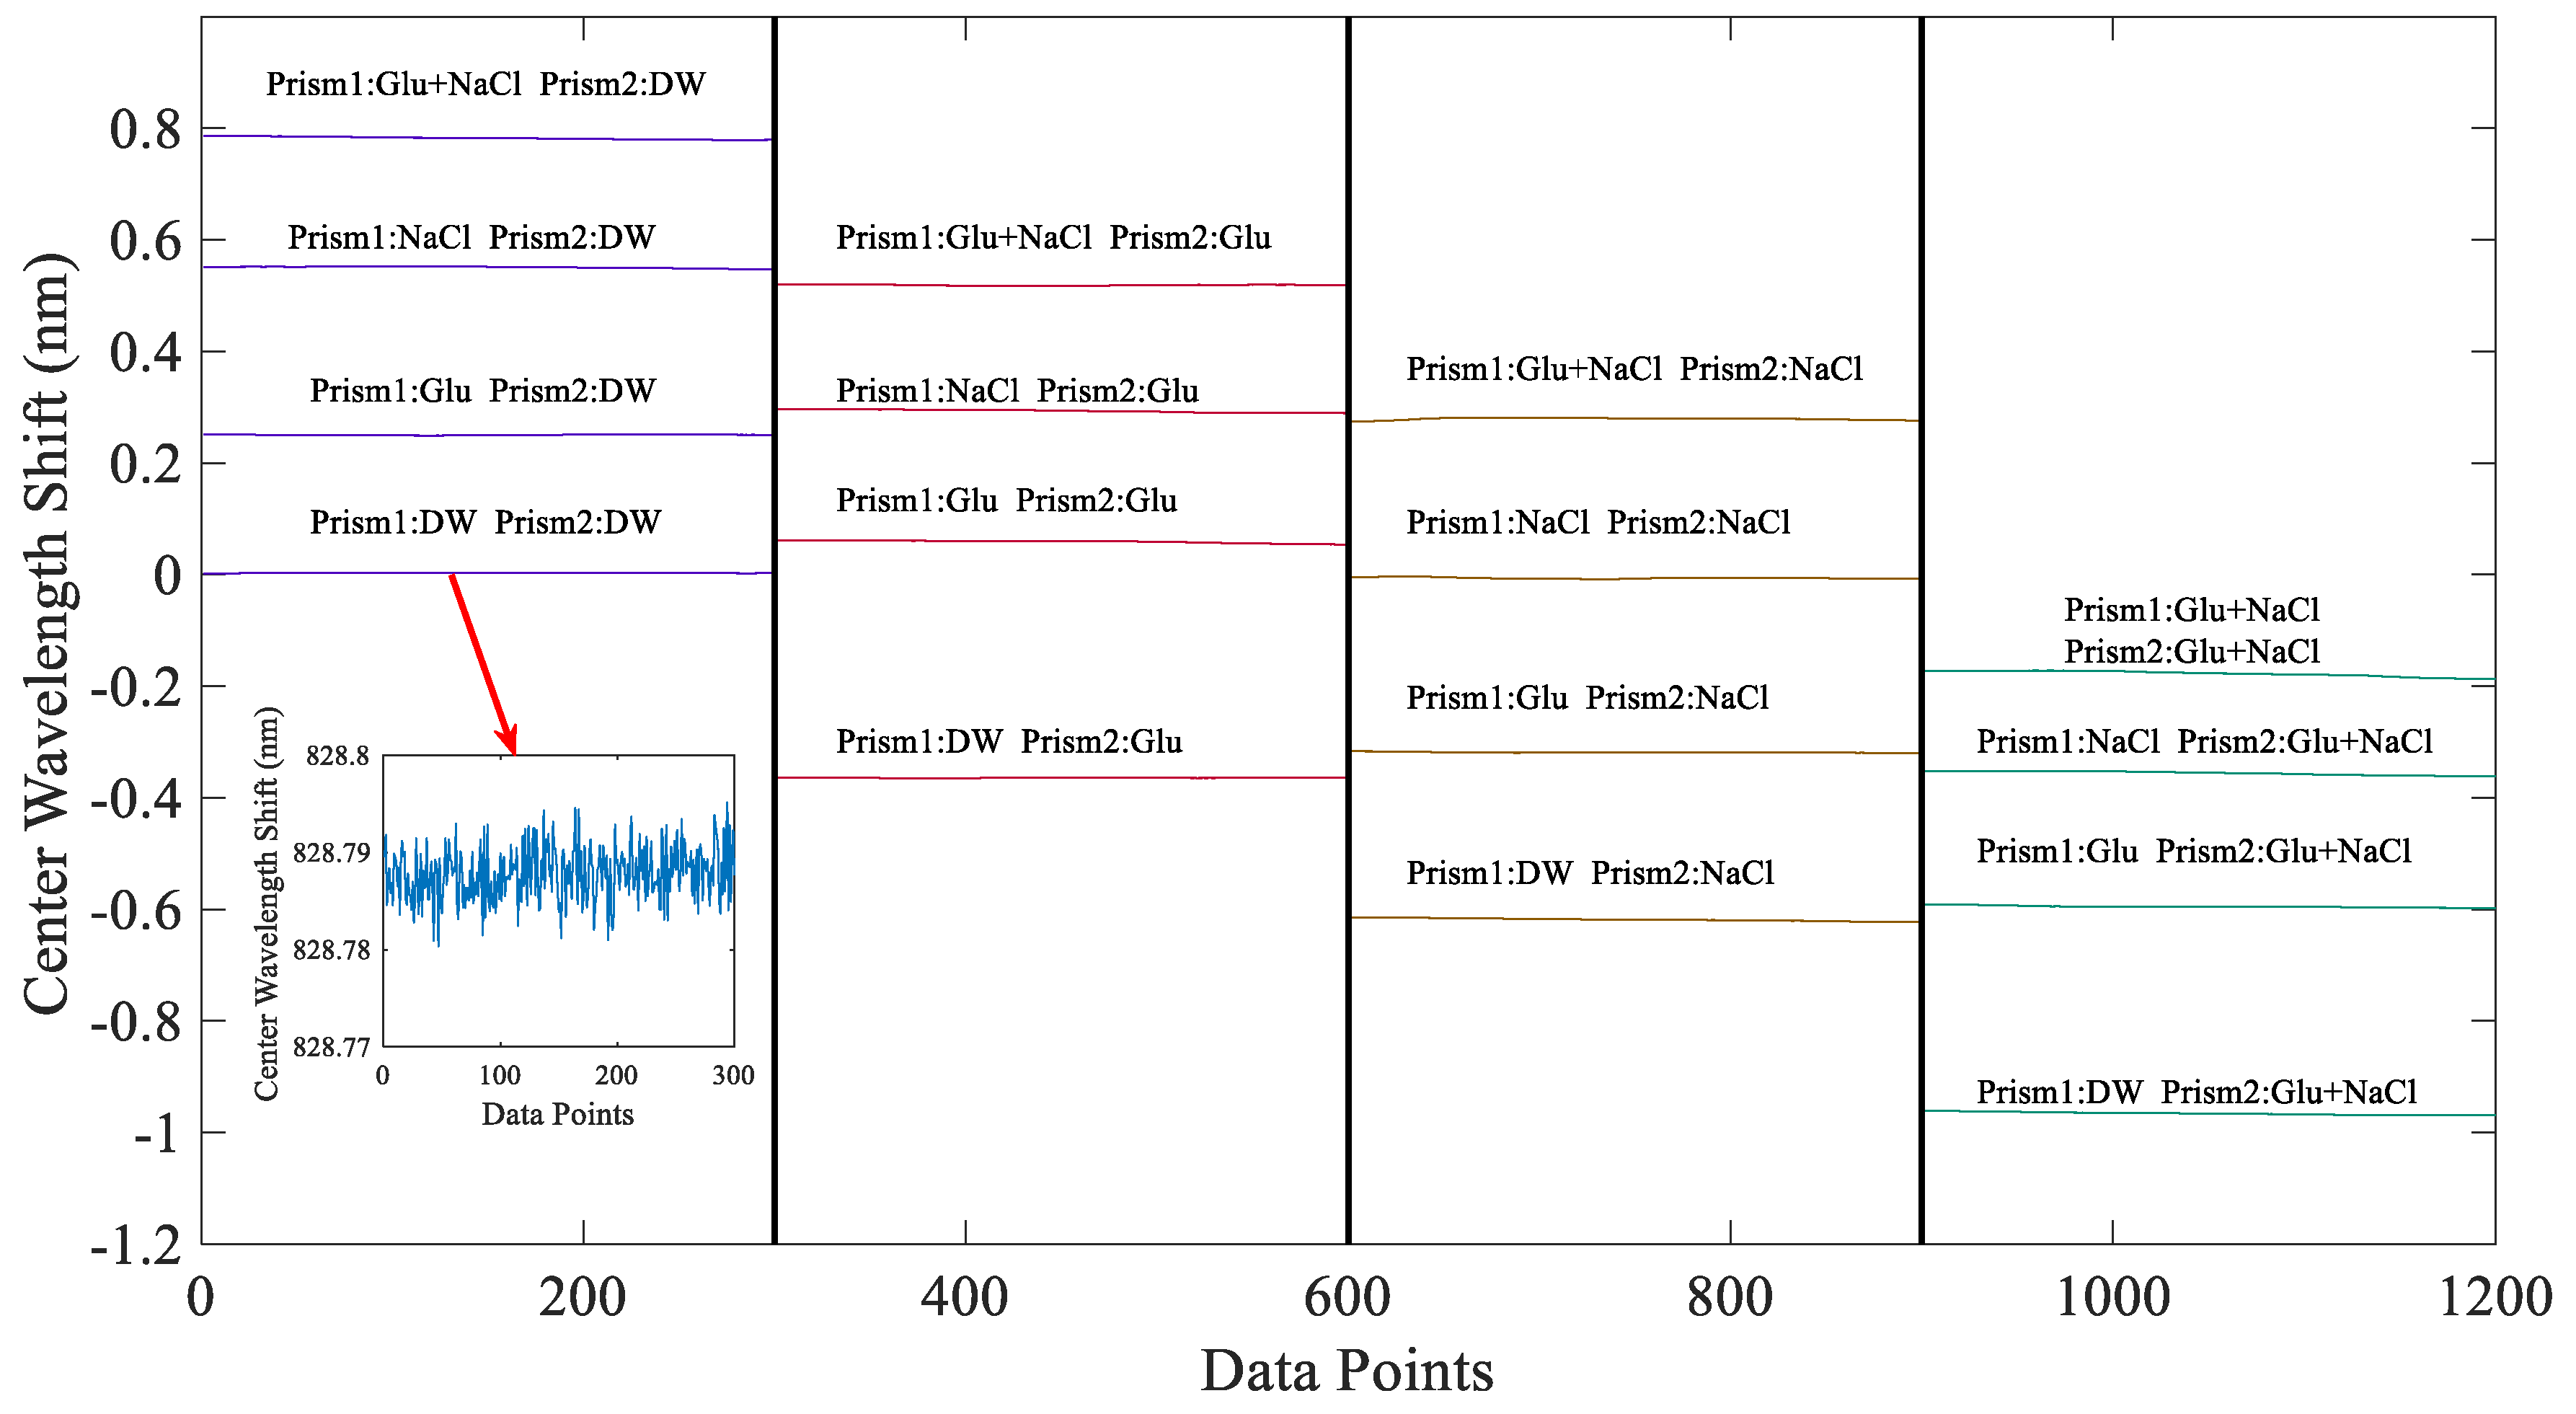
| Prism 2 | DW | Glu | NaCl | Glu + NaCl | |
|---|---|---|---|---|---|
| Prism 1 | |||||
| DW | 0.0029 | 0.2503 | 0.5506 | 0.7823 | |
| Glu | −0.3643 | 0.0590 | 0.2932 | 0.5188 | |
| NaCl | −0.6184 | −0.3187 | −0.0063 | 0.2791 | |
| Glu + NaCl | −0.9659 | −0.5950 | −0.3559 | −0.1774 | |
© 2019 by the authors. Licensee MDPI, Basel, Switzerland. This article is an open access article distributed under the terms and conditions of the Creative Commons Attribution (CC BY) license (http://creativecommons.org/licenses/by/4.0/).
Share and Cite
Xiong, N.; Guan, T.; Xu, Y.; Shi, L.; Zhong, S.; Zhou, X.; He, Y.; Li, D. A Differential Detection Method Based on a Linear Weak Measurement System. Sensors 2019, 19, 2473. https://doi.org/10.3390/s19112473
Xiong N, Guan T, Xu Y, Shi L, Zhong S, Zhou X, He Y, Li D. A Differential Detection Method Based on a Linear Weak Measurement System. Sensors. 2019; 19(11):2473. https://doi.org/10.3390/s19112473
Chicago/Turabian StyleXiong, Nian, Tian Guan, Yang Xu, Lixuan Shi, Suyi Zhong, Xuesi Zhou, Yonghong He, and Dongmei Li. 2019. "A Differential Detection Method Based on a Linear Weak Measurement System" Sensors 19, no. 11: 2473. https://doi.org/10.3390/s19112473
APA StyleXiong, N., Guan, T., Xu, Y., Shi, L., Zhong, S., Zhou, X., He, Y., & Li, D. (2019). A Differential Detection Method Based on a Linear Weak Measurement System. Sensors, 19(11), 2473. https://doi.org/10.3390/s19112473