Evaluating and Validating Emotion Elicitation Using English and Arabic Movie Clips on a Saudi Sample


Abstract
1. Introduction
- To evaluate the suitability of the validated English set of emotion elicitation clips from [10] in eliciting the target emotions in the Arab sample (Saudis in particular).
- To compare the evaluation results from the English set with an initial selection of the Arabic set of clips that is designed to elicit the same set of emotions as the English clips.
- To validate the evaluation results by analysing and classifying emotions based on the bio-signal and behavioural responses acquired during recording sessions in a laboratory environment.
2. Background
2.1. Emotion and Emotion Stimuli
2.2. Cross-Cultural Studies on Emotion Elicitation
2.3. Automatic Recognition of Emotion
3. Method
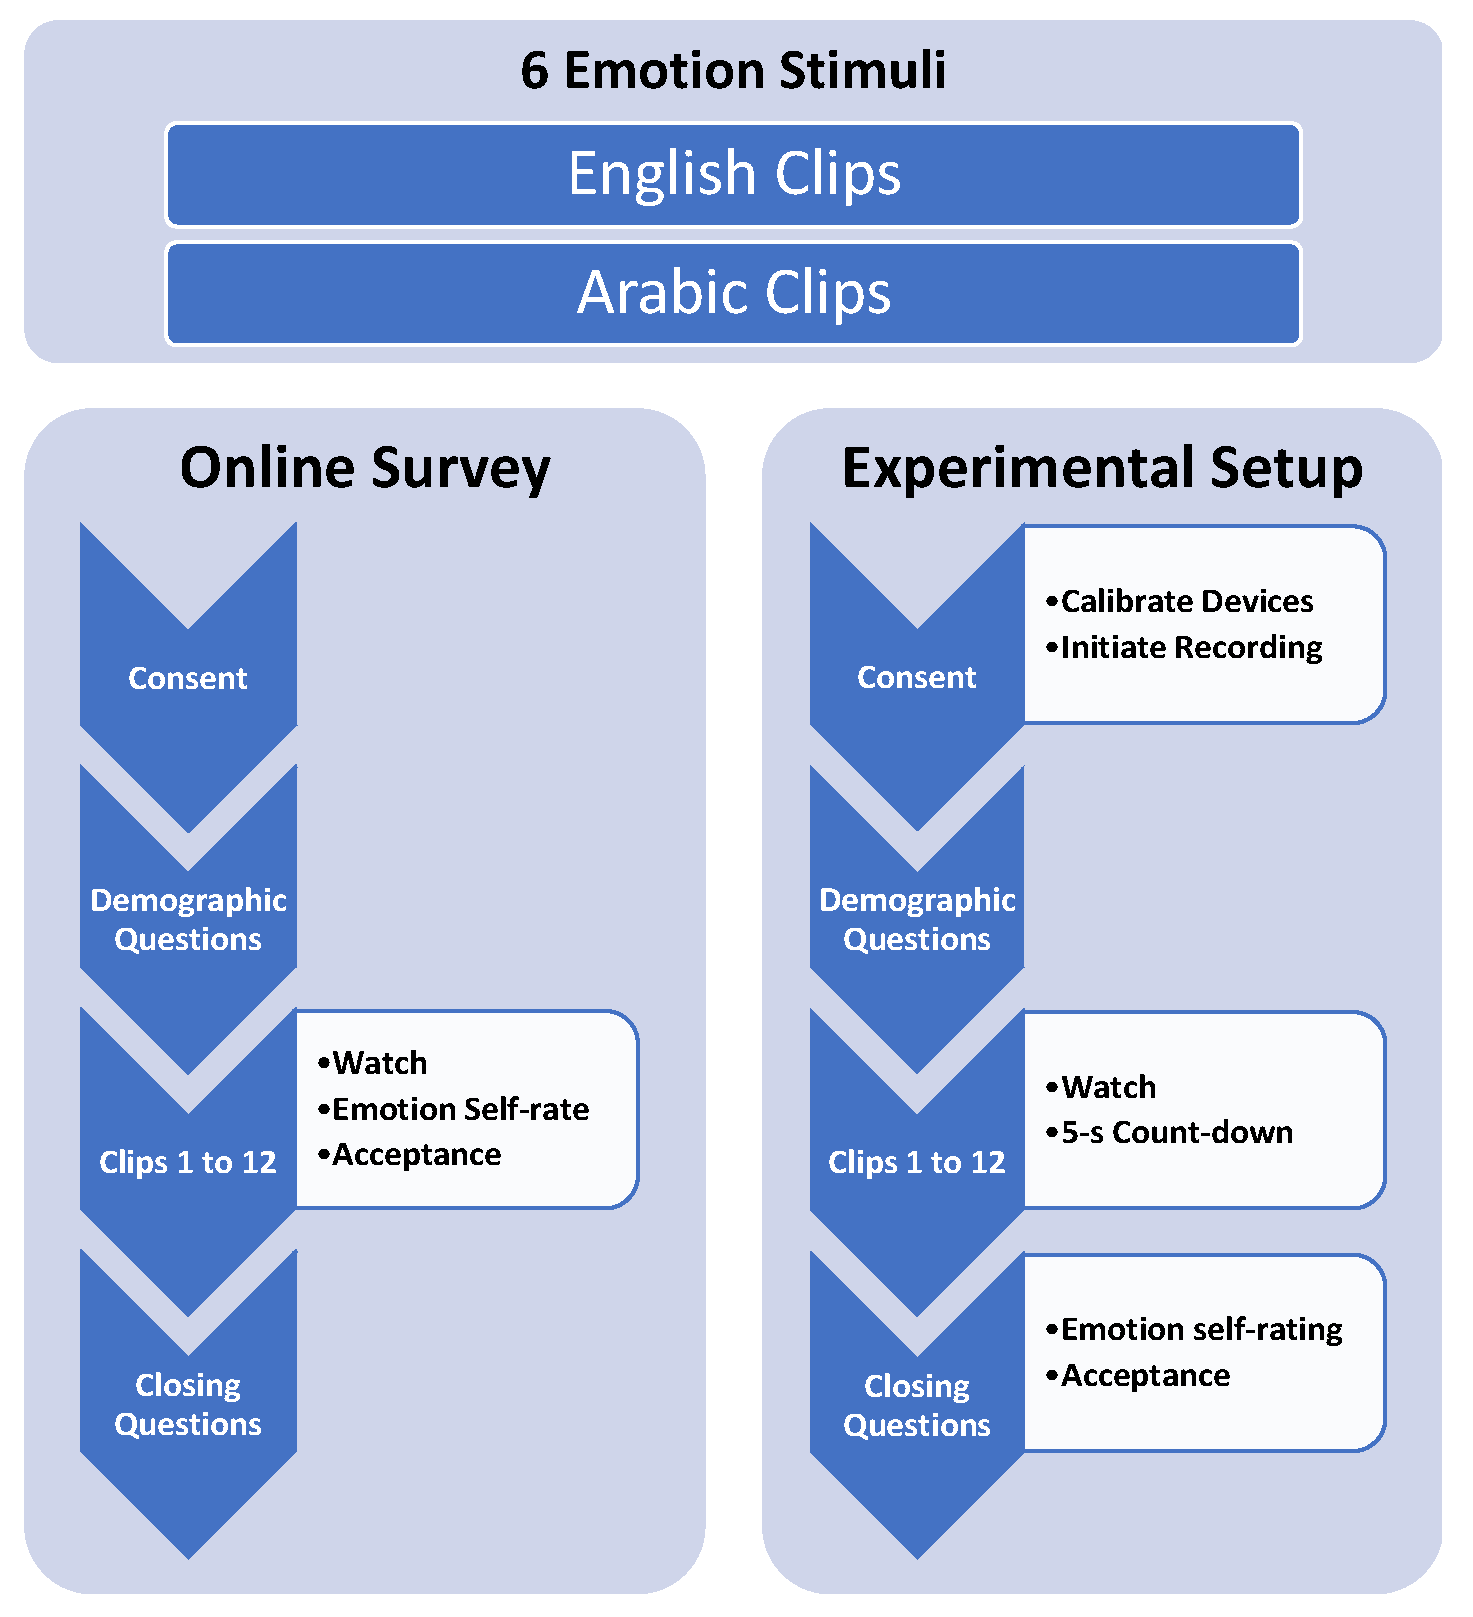
3.1. Stimuli
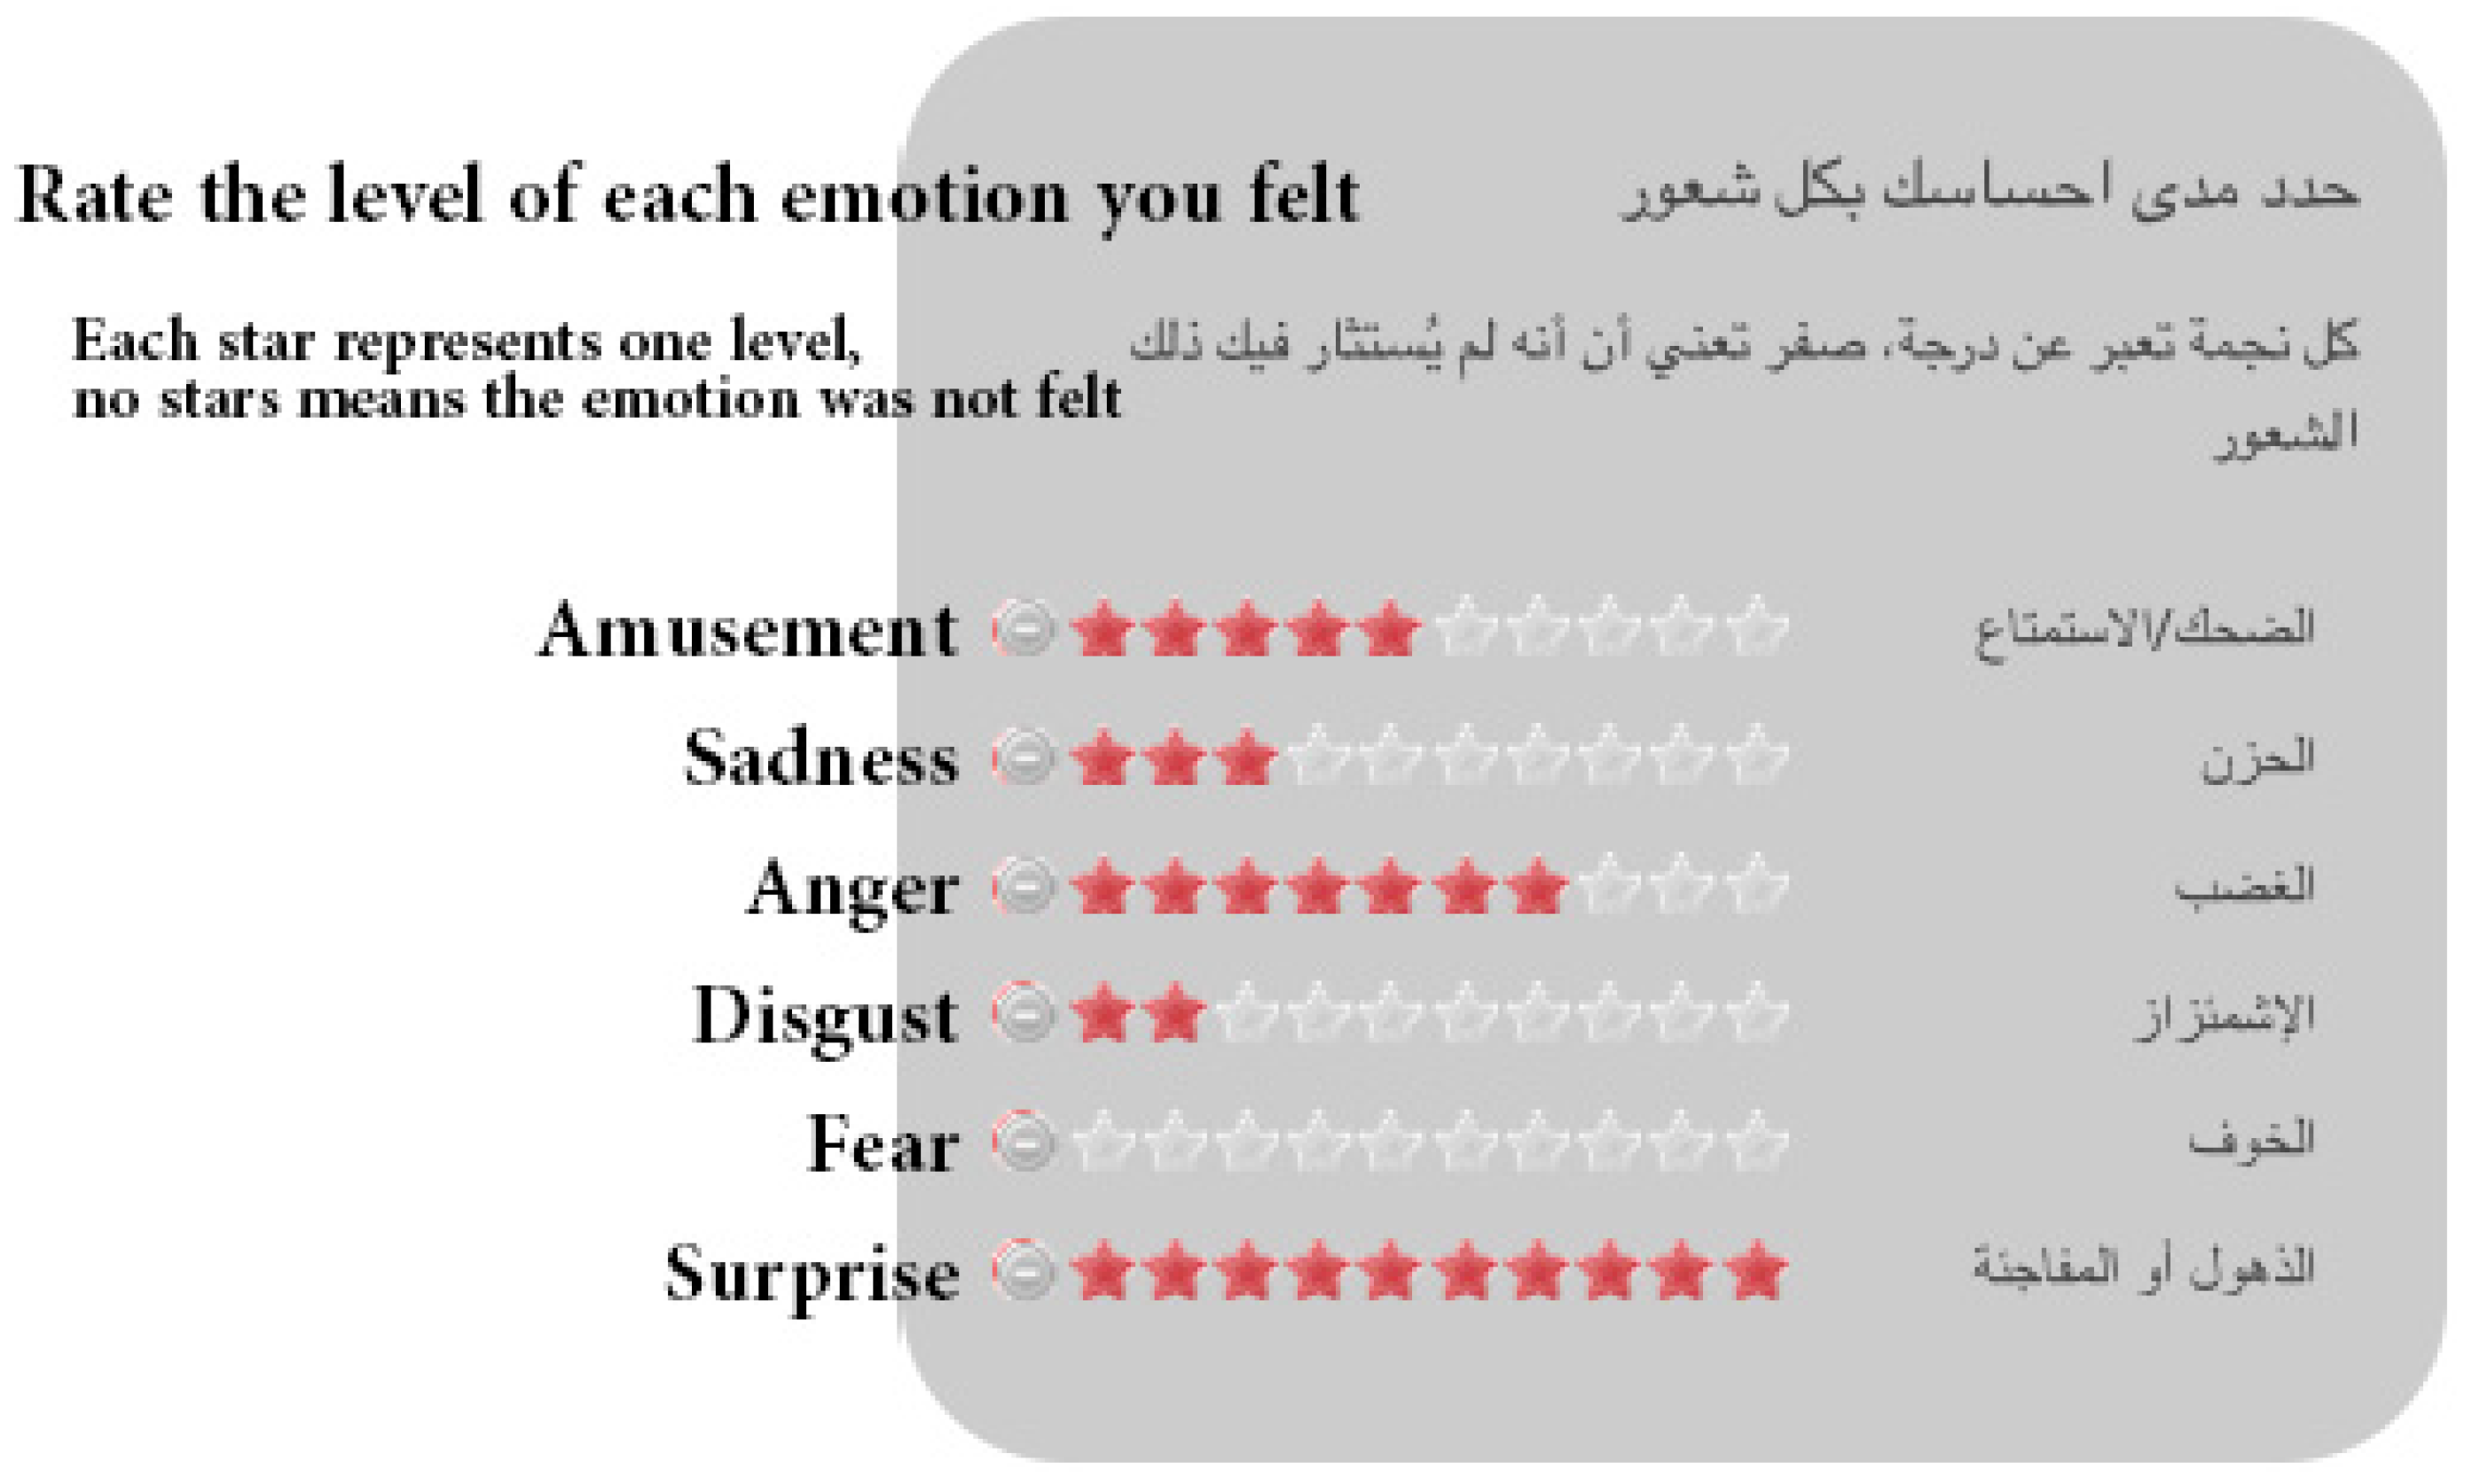
3.2. Online Survey
3.3. Emotional Response Experimental Setup
3.3.1. Hardware, Software and Recording Environment
3.3.2. Data Collection Procedure
3.4. Participants
3.4.1. Online Survey Participants
3.4.2. Physiological and Behavioural Measurement Experiment Participants
3.5. Data Preparation
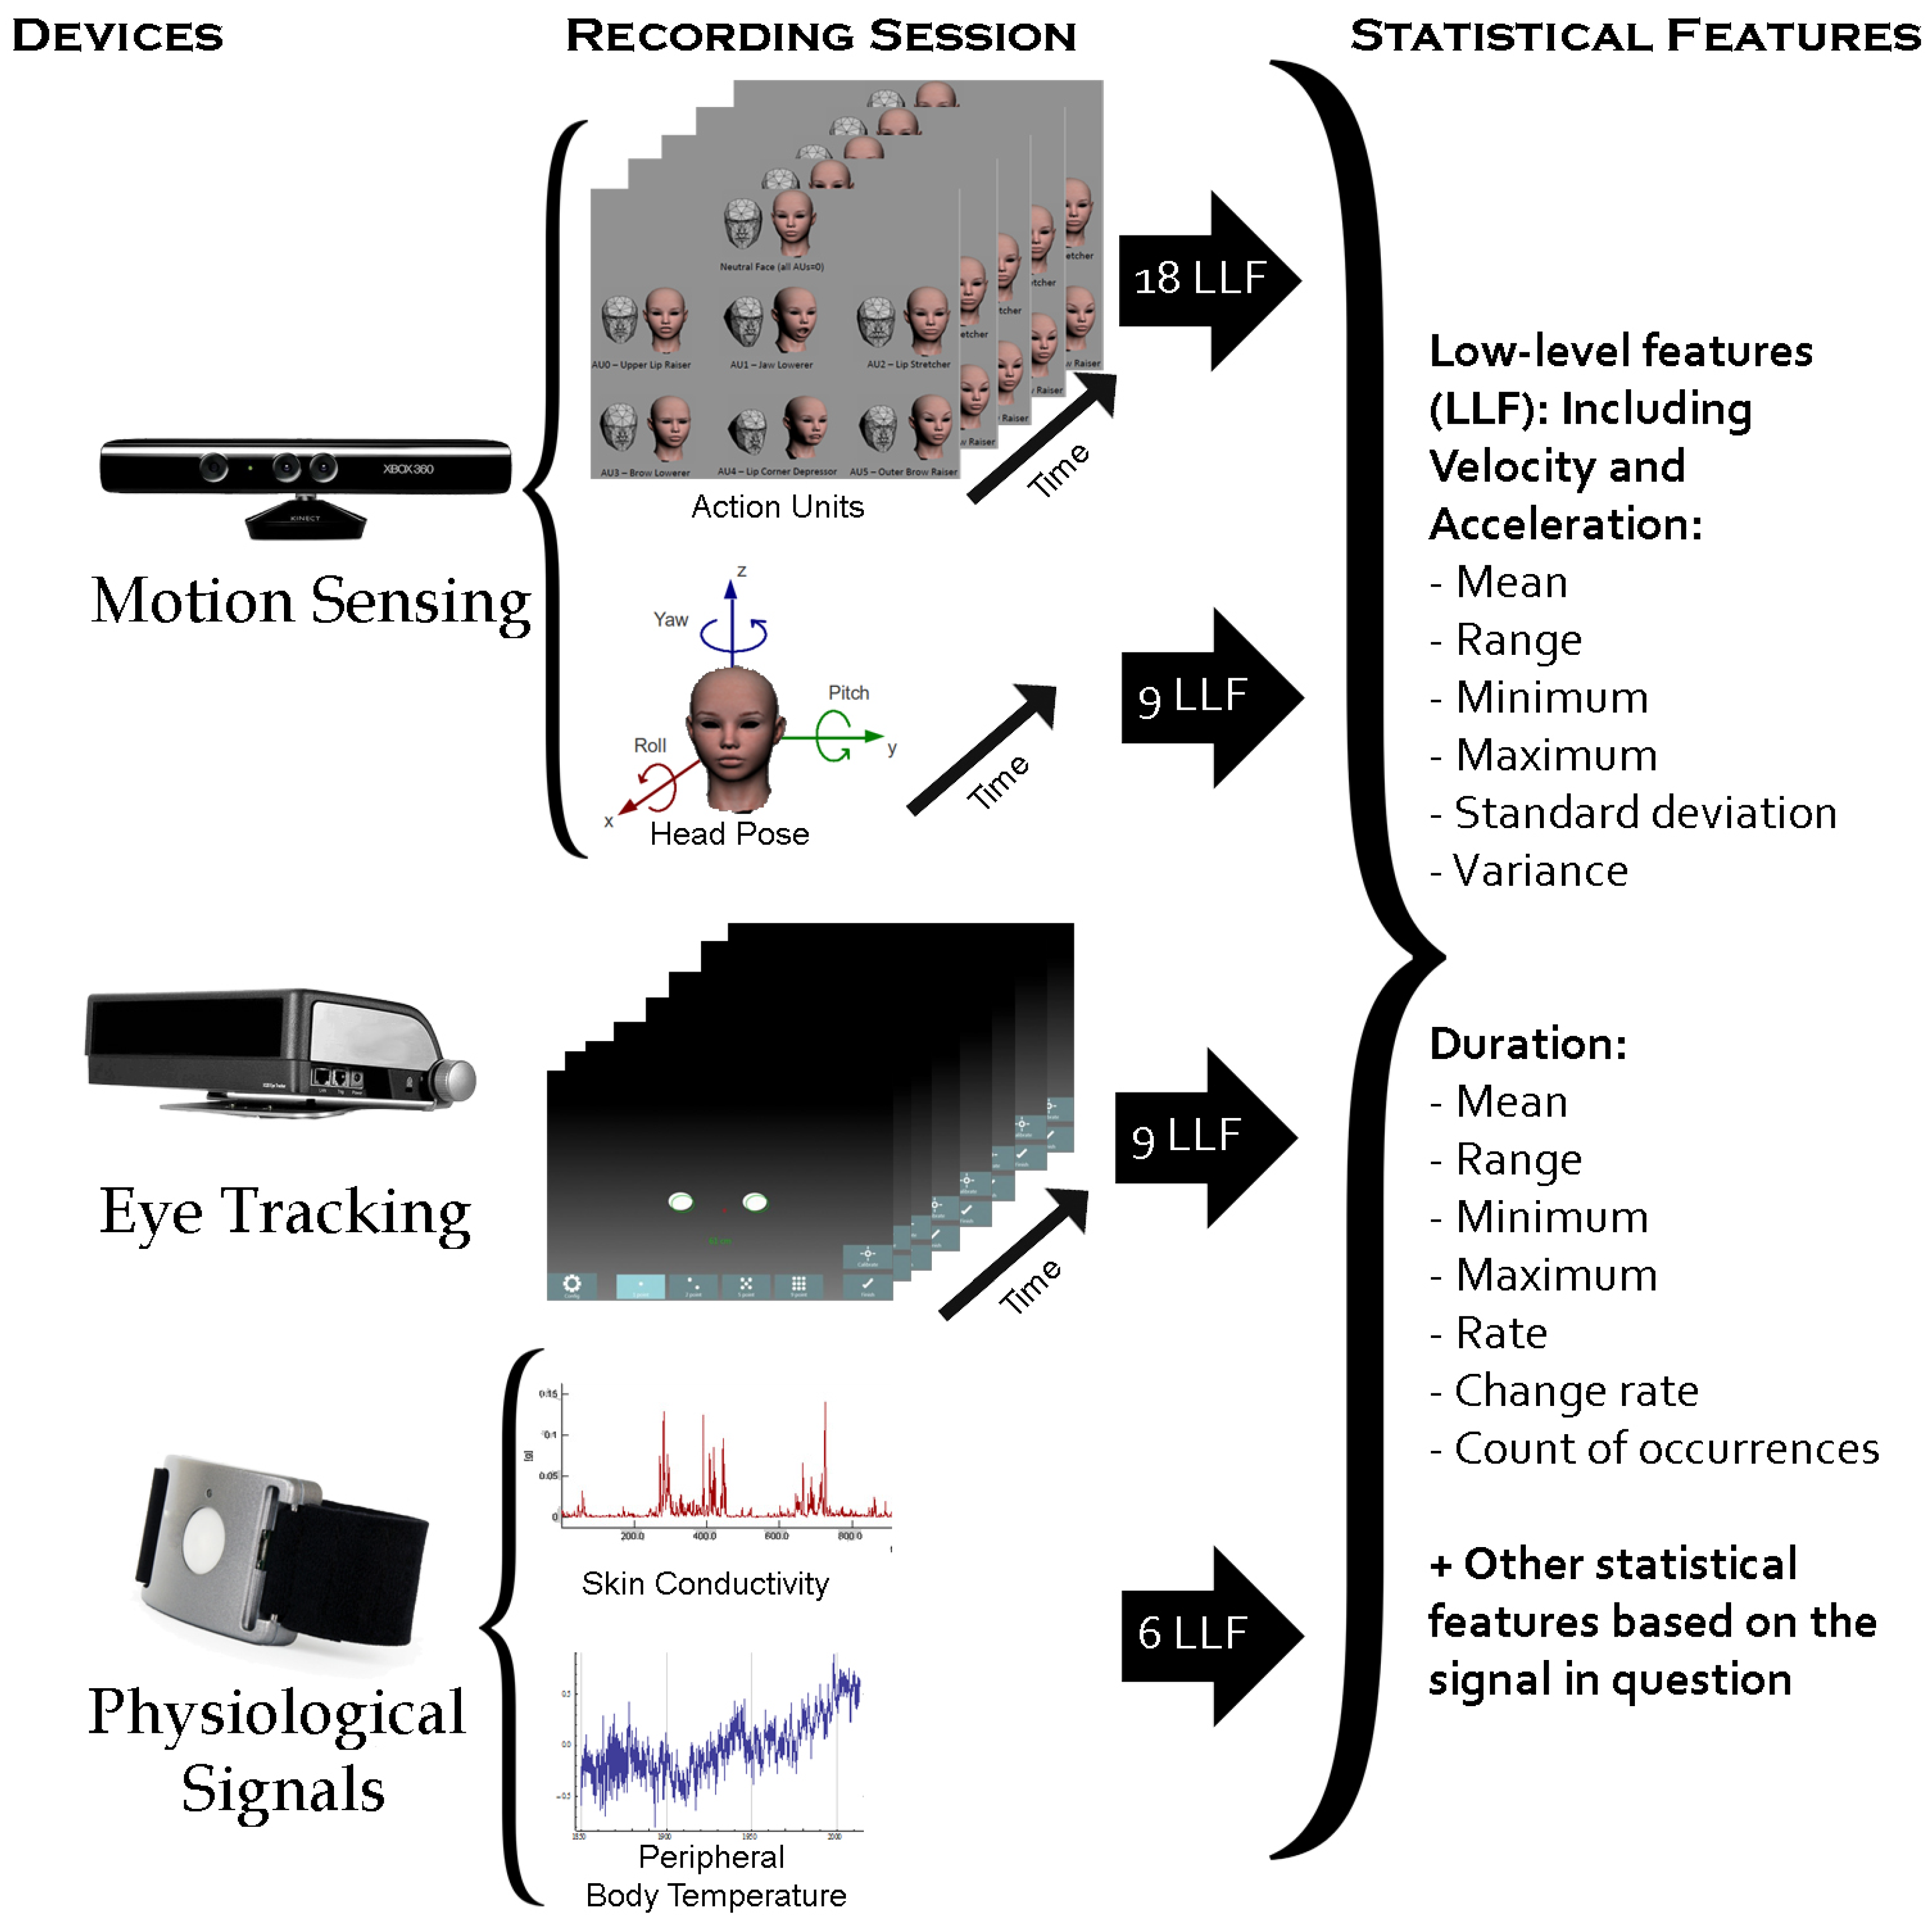
3.6. Feature Extraction
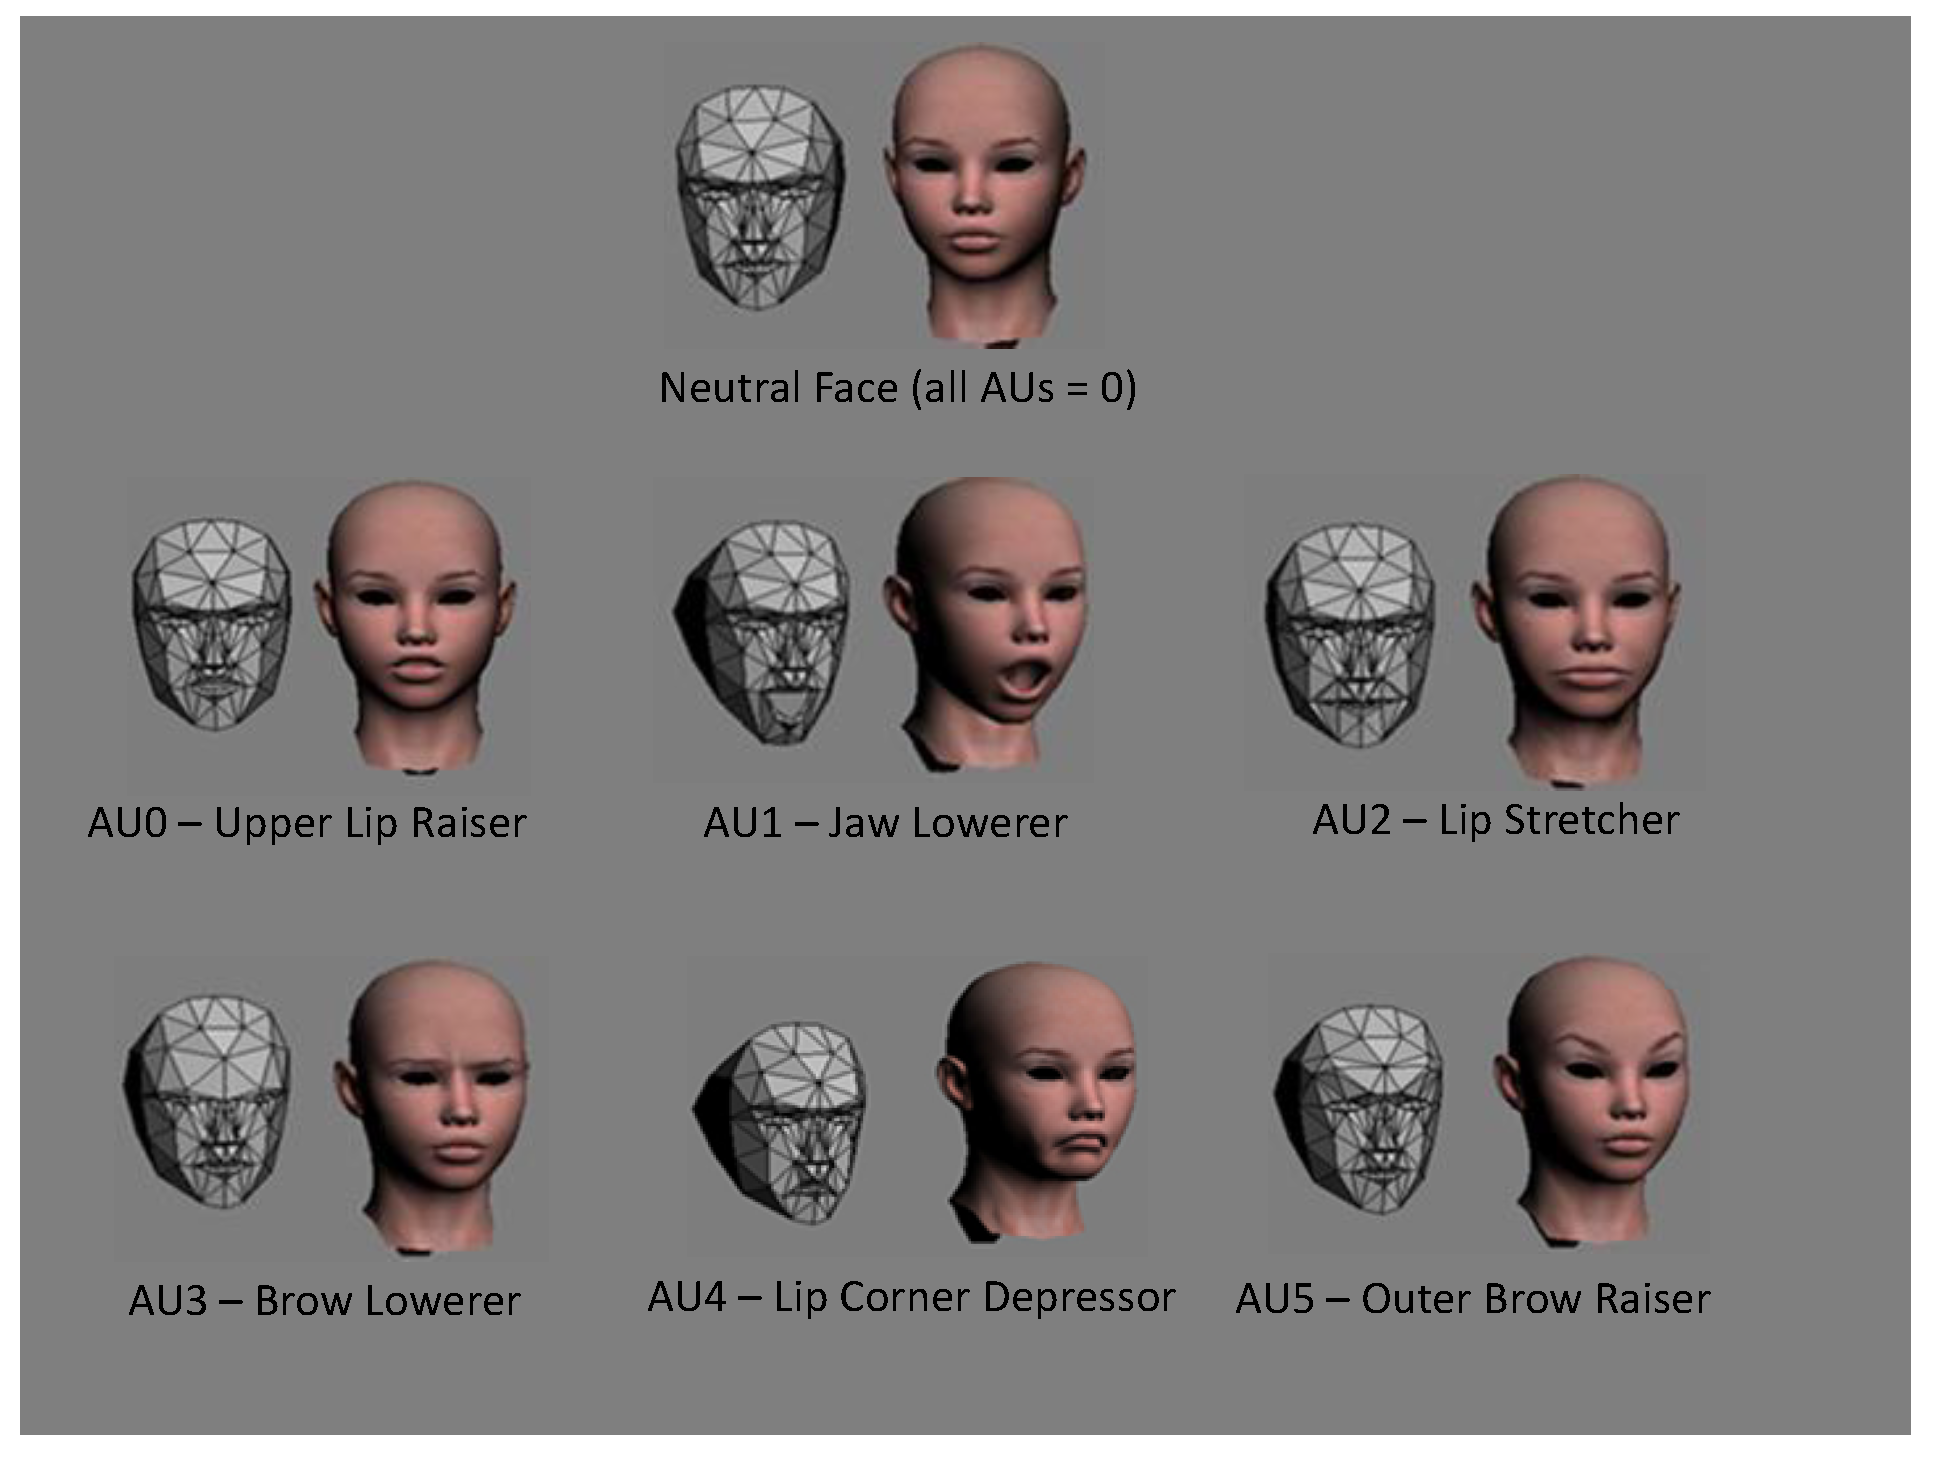
3.6.1. Facial Expression Features
- Mean, range, minimum, maximum, standard deviation and variance for all 18 low-level features ().
- We also calculated several statistical duration features such as maximum, minimum, range and average of the duration, as well as its rate to total duration and count of the occurrence of:
- -
- each AU (6 features × 6 AUs),
- -
- fast changes of each AU (6 features × 6 AUs),
- -
- slow changes of each AU (6 features × 6 AUs),
- -
- continuous changes of each AU (6 features × 6 AUs),
- -
- steady state of each AU (6 features × 6 AUs).
3.6.2. Head Pose Features
- Maximum, minimum, range, mean, variance and standard deviation for all 9 low-level features (6 × 9 features)
- Maximum, minimum, range and average duration of head direction: left, right, up and down, tilting clockwise and anticlockwise (4 × 6 features)
- Head direction duration rate and rate of different head directions for the non-frontal head direction for all directions mentioned above (2 × 6 features)
- Change in the head direction rate for all directions mentioned above (1 × 6 features)
- Total number of changes of head direction for yaw, roll, pitch, as well as the total number of these changes (4 features)
- Maximum, minimum, range, mean, variance, duration and rate for slow, fast, steady and continuous movement of yaw, roll and pitch (7 × 3 DOF × 4 features)
3.6.3. Eye Activity and Gaze Features
- Distance between eye gaze point positions from one frame to the next for each eye and its speed () and acceleration () were calculated to measure the changes in eye gaze points. The longer the distance, the faster the eye gaze change (2 × 3 features).
- The difference between the distance from the left eye to the eye tracker and the distance from the right eye to the eye tracker were calculated, to measure head rotation approximately (1 feature).
- Normalised pupil size for each eye, to measure emotional arousal (2 × 1 features).
- The mean, standard deviation (std), variance (var), maximum, minimum and range for all low-level features mentioned above ().
- Even though blink features were not available from the Tobii X120, we measured the absence of the pupil in the video frames. Absence of the left pupil only indicates left head rotation, and vice versa. Absence of both pupils could represent blinks, occluded eyes or head rotation being out of the eye tracker’s range, such as extreme looking up/down or left/right. We measured the mean, standard deviation (std) and variance (var) of the absence of left, right or both pupils ()
- We also calculated several statistical features such as maximum, minimum, range and average of the duration, as well as its rate to total duration and count of the occurrence of:
- -
- fast and slow changes of eye gaze for each eye ( eyes);
- -
- left and right head rotation ();
- -
- large and small pupil size for each eye ( eyes);
- -
- the absence of left, right or both eyes ().
3.6.4. Skin Conductance and Temperature Features
- Mean, range, minimum, maximum, standard deviation and variance for each of the 6 low-level features ( features).
- We also calculated six statistical duration features such as maximum, minimum, range and average of the duration, as well as its rate to total duration and count of the occurrence of:
- -
- high temperature and skin conductance ().
- -
- low temperature and skin conductance ().
- -
- fast changes in temperature and skin conductance ().
- -
- slow changes in temperature and skin conductance ().
- -
- continuous changes in temperature and skin conductance ().
- -
- steady state in temperature and skin conductance ().
3.7. Analysis
3.7.1. Statistical Analysis
3.7.2. Classification Methods
4. Results
4.1. Survey Results
4.1.1. Cultural Acceptance of the Clips
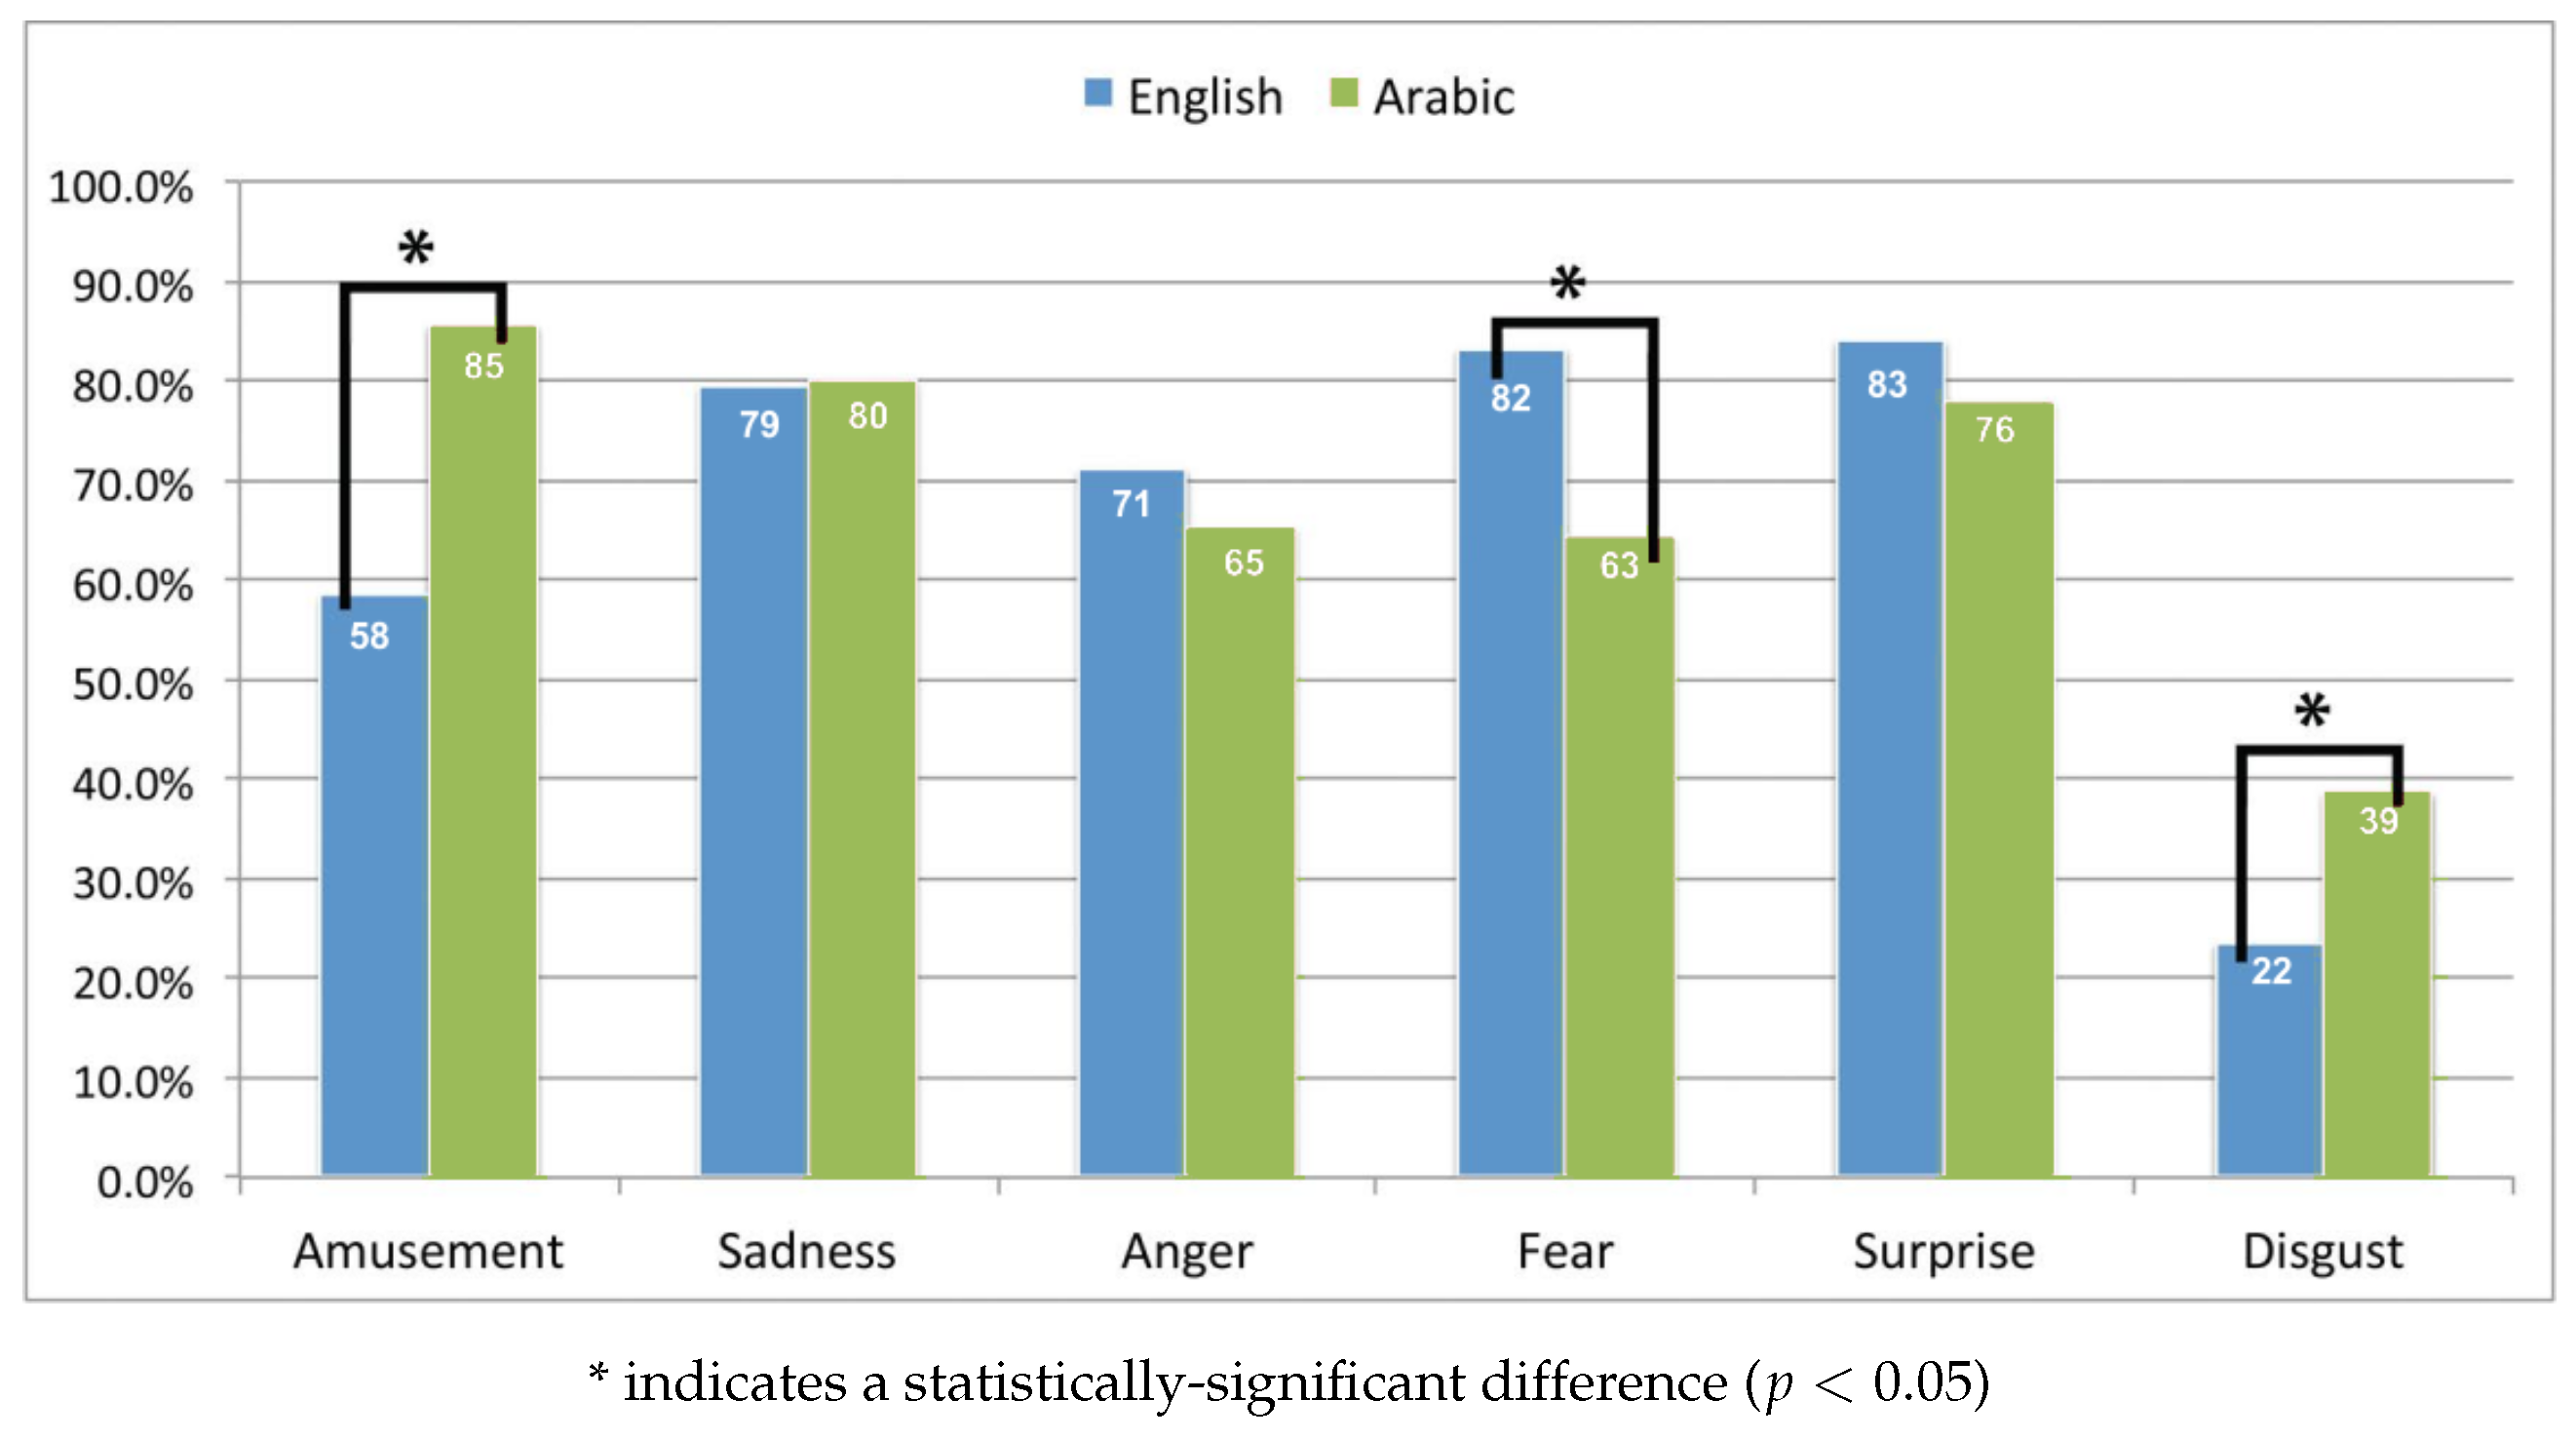
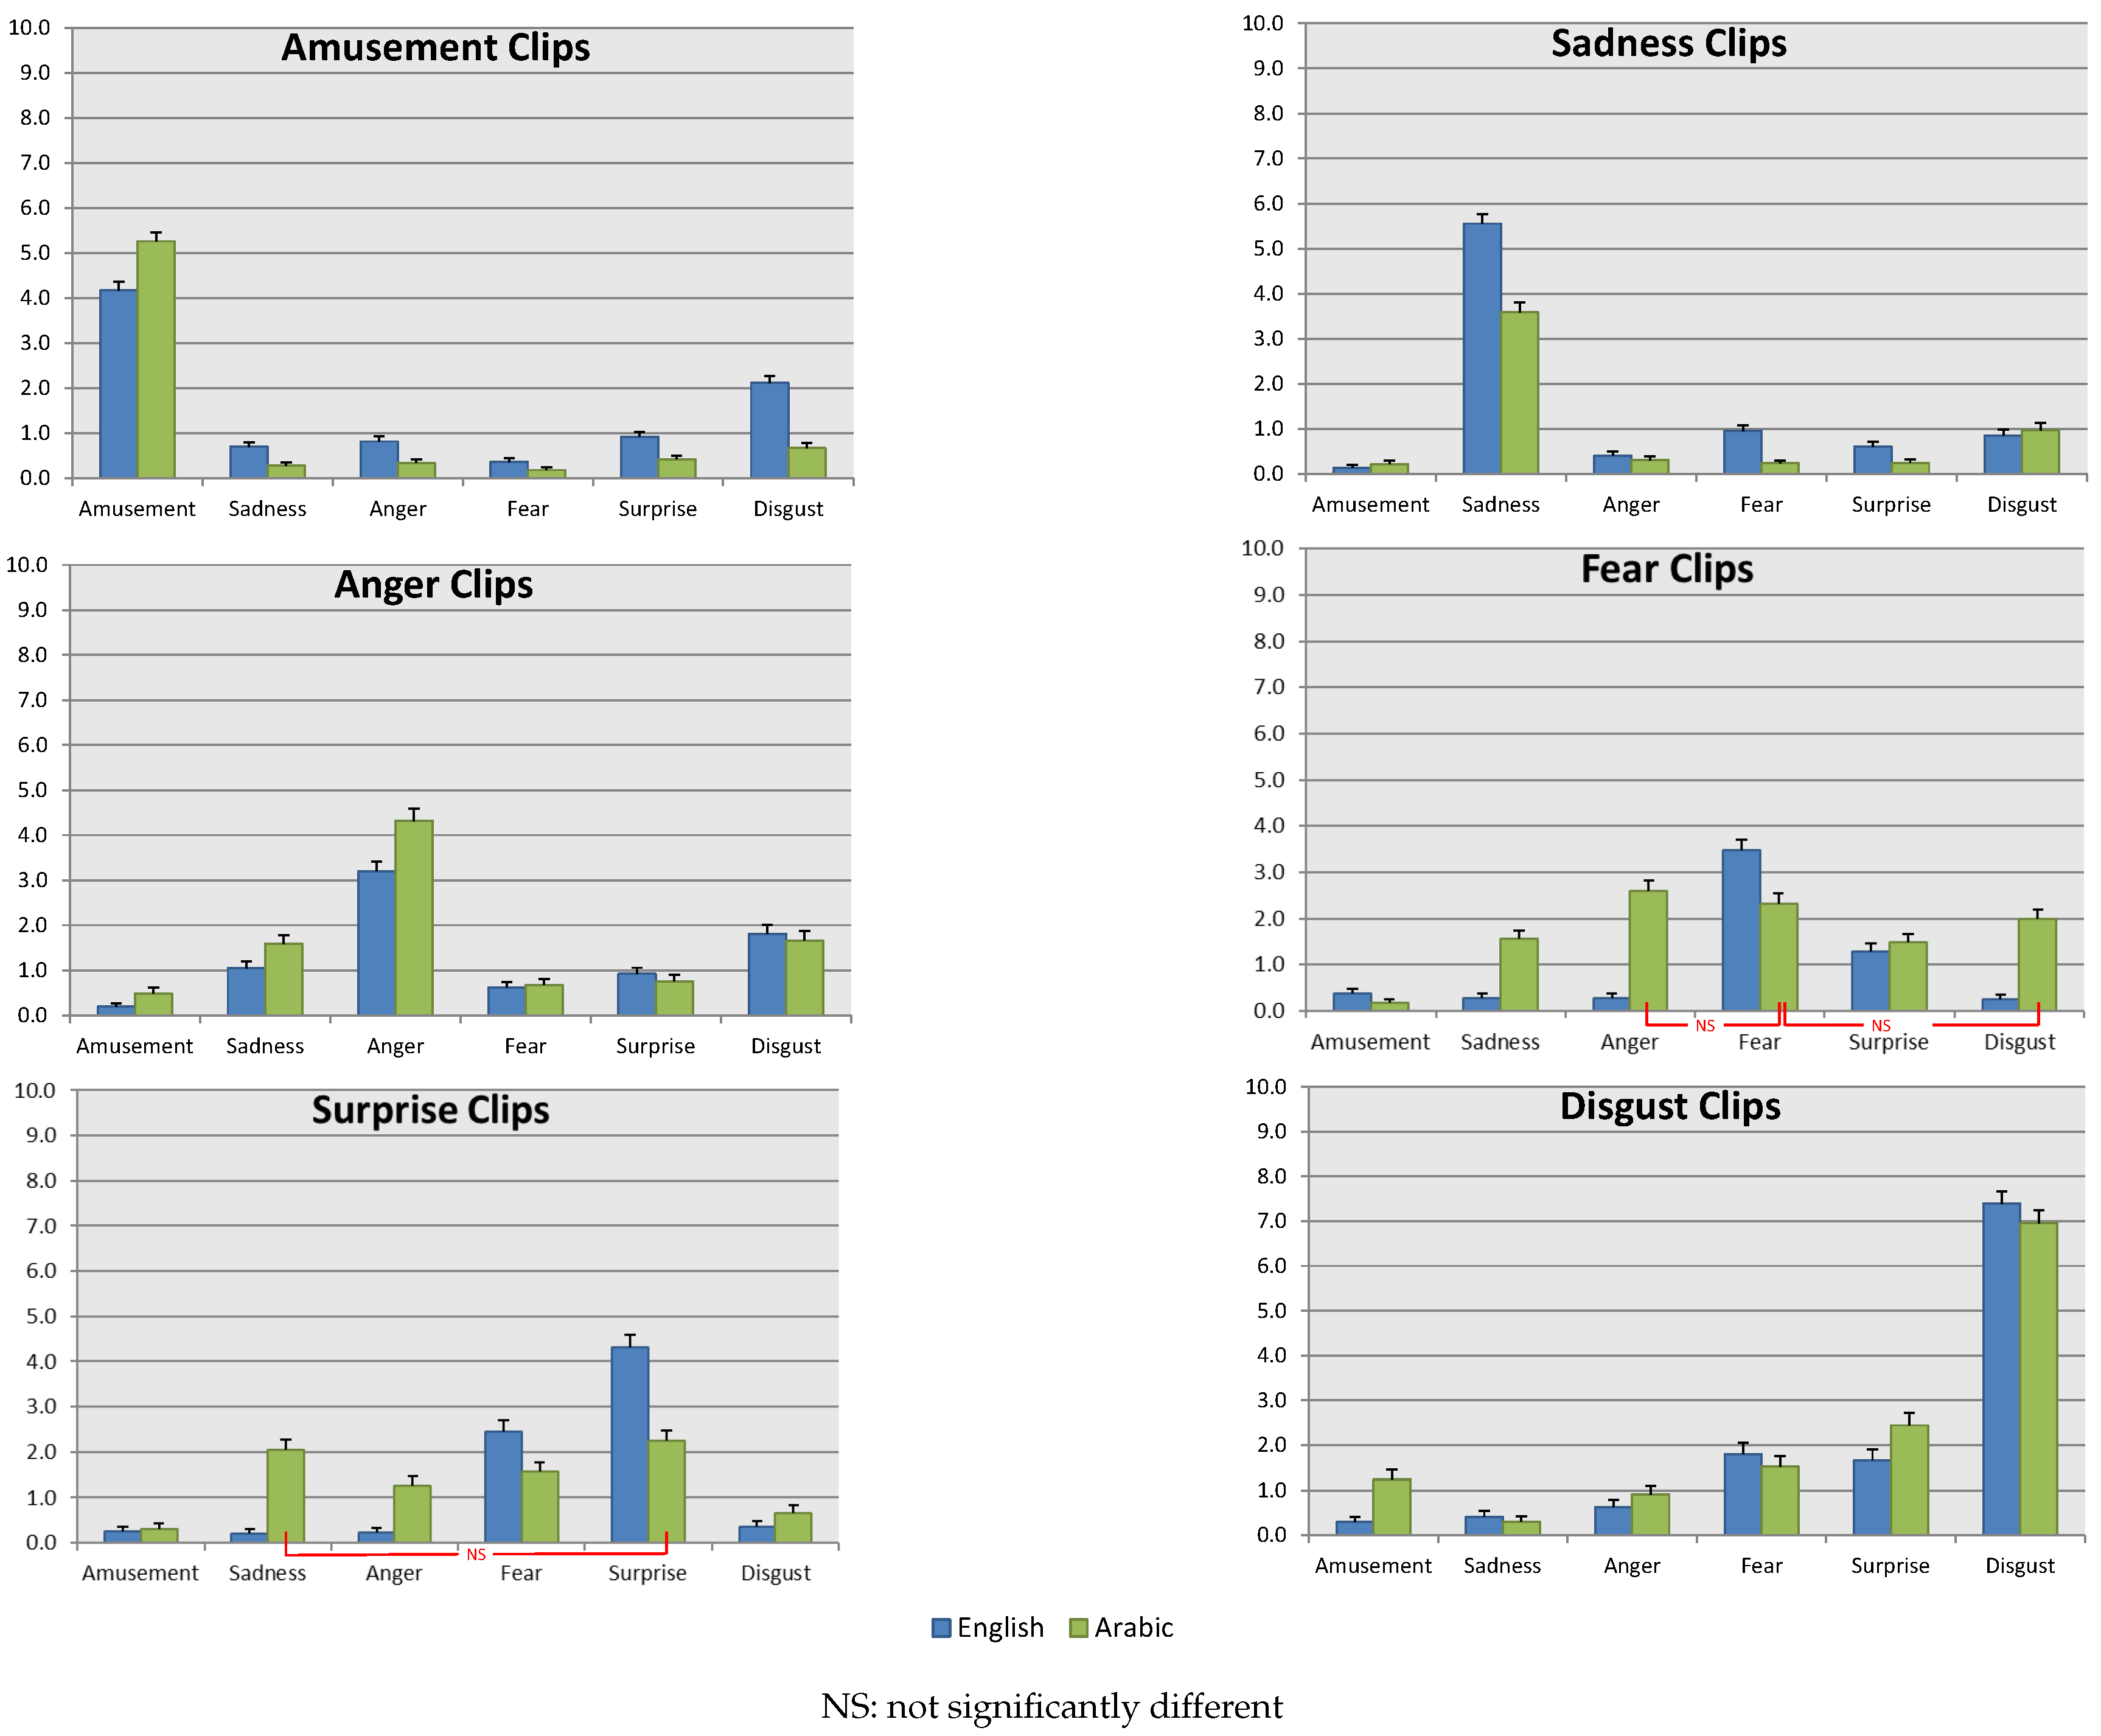
4.1.2. Emotion Elicitation Rates of the Clips
4.2. Analysis and Classification of Physiological and Behavioural Responses
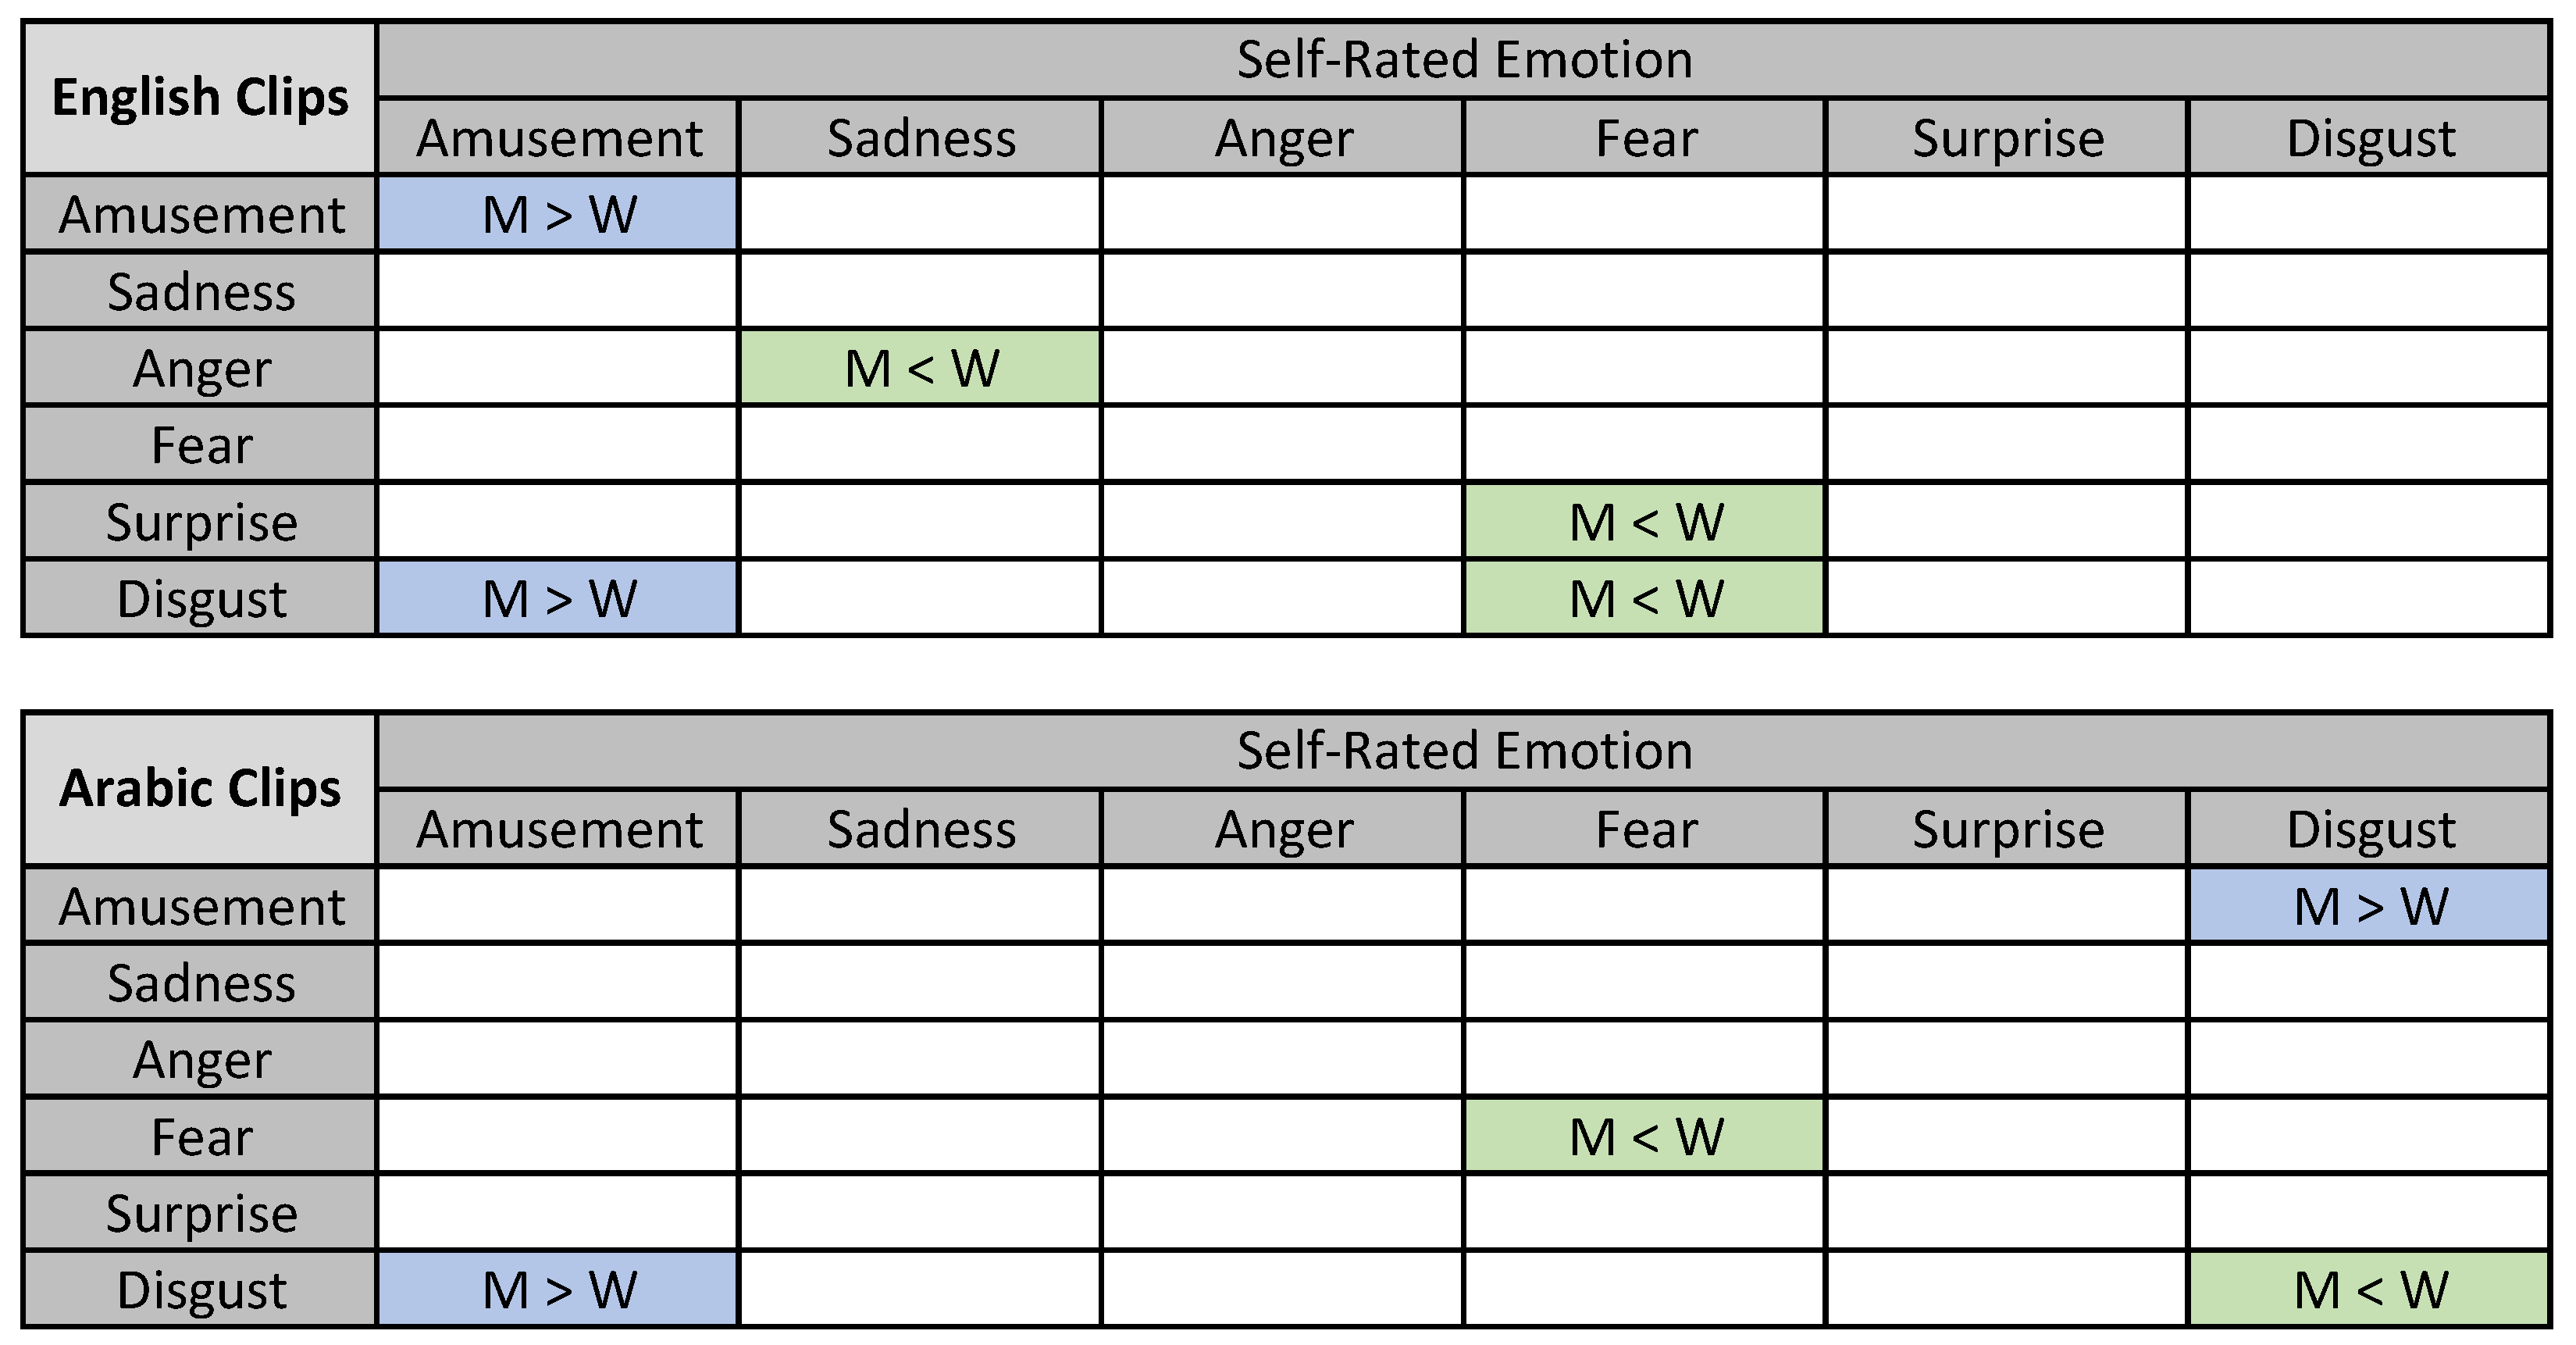
4.2.1. Statistical Analysis over Extracted Physiological and Behavioural Features
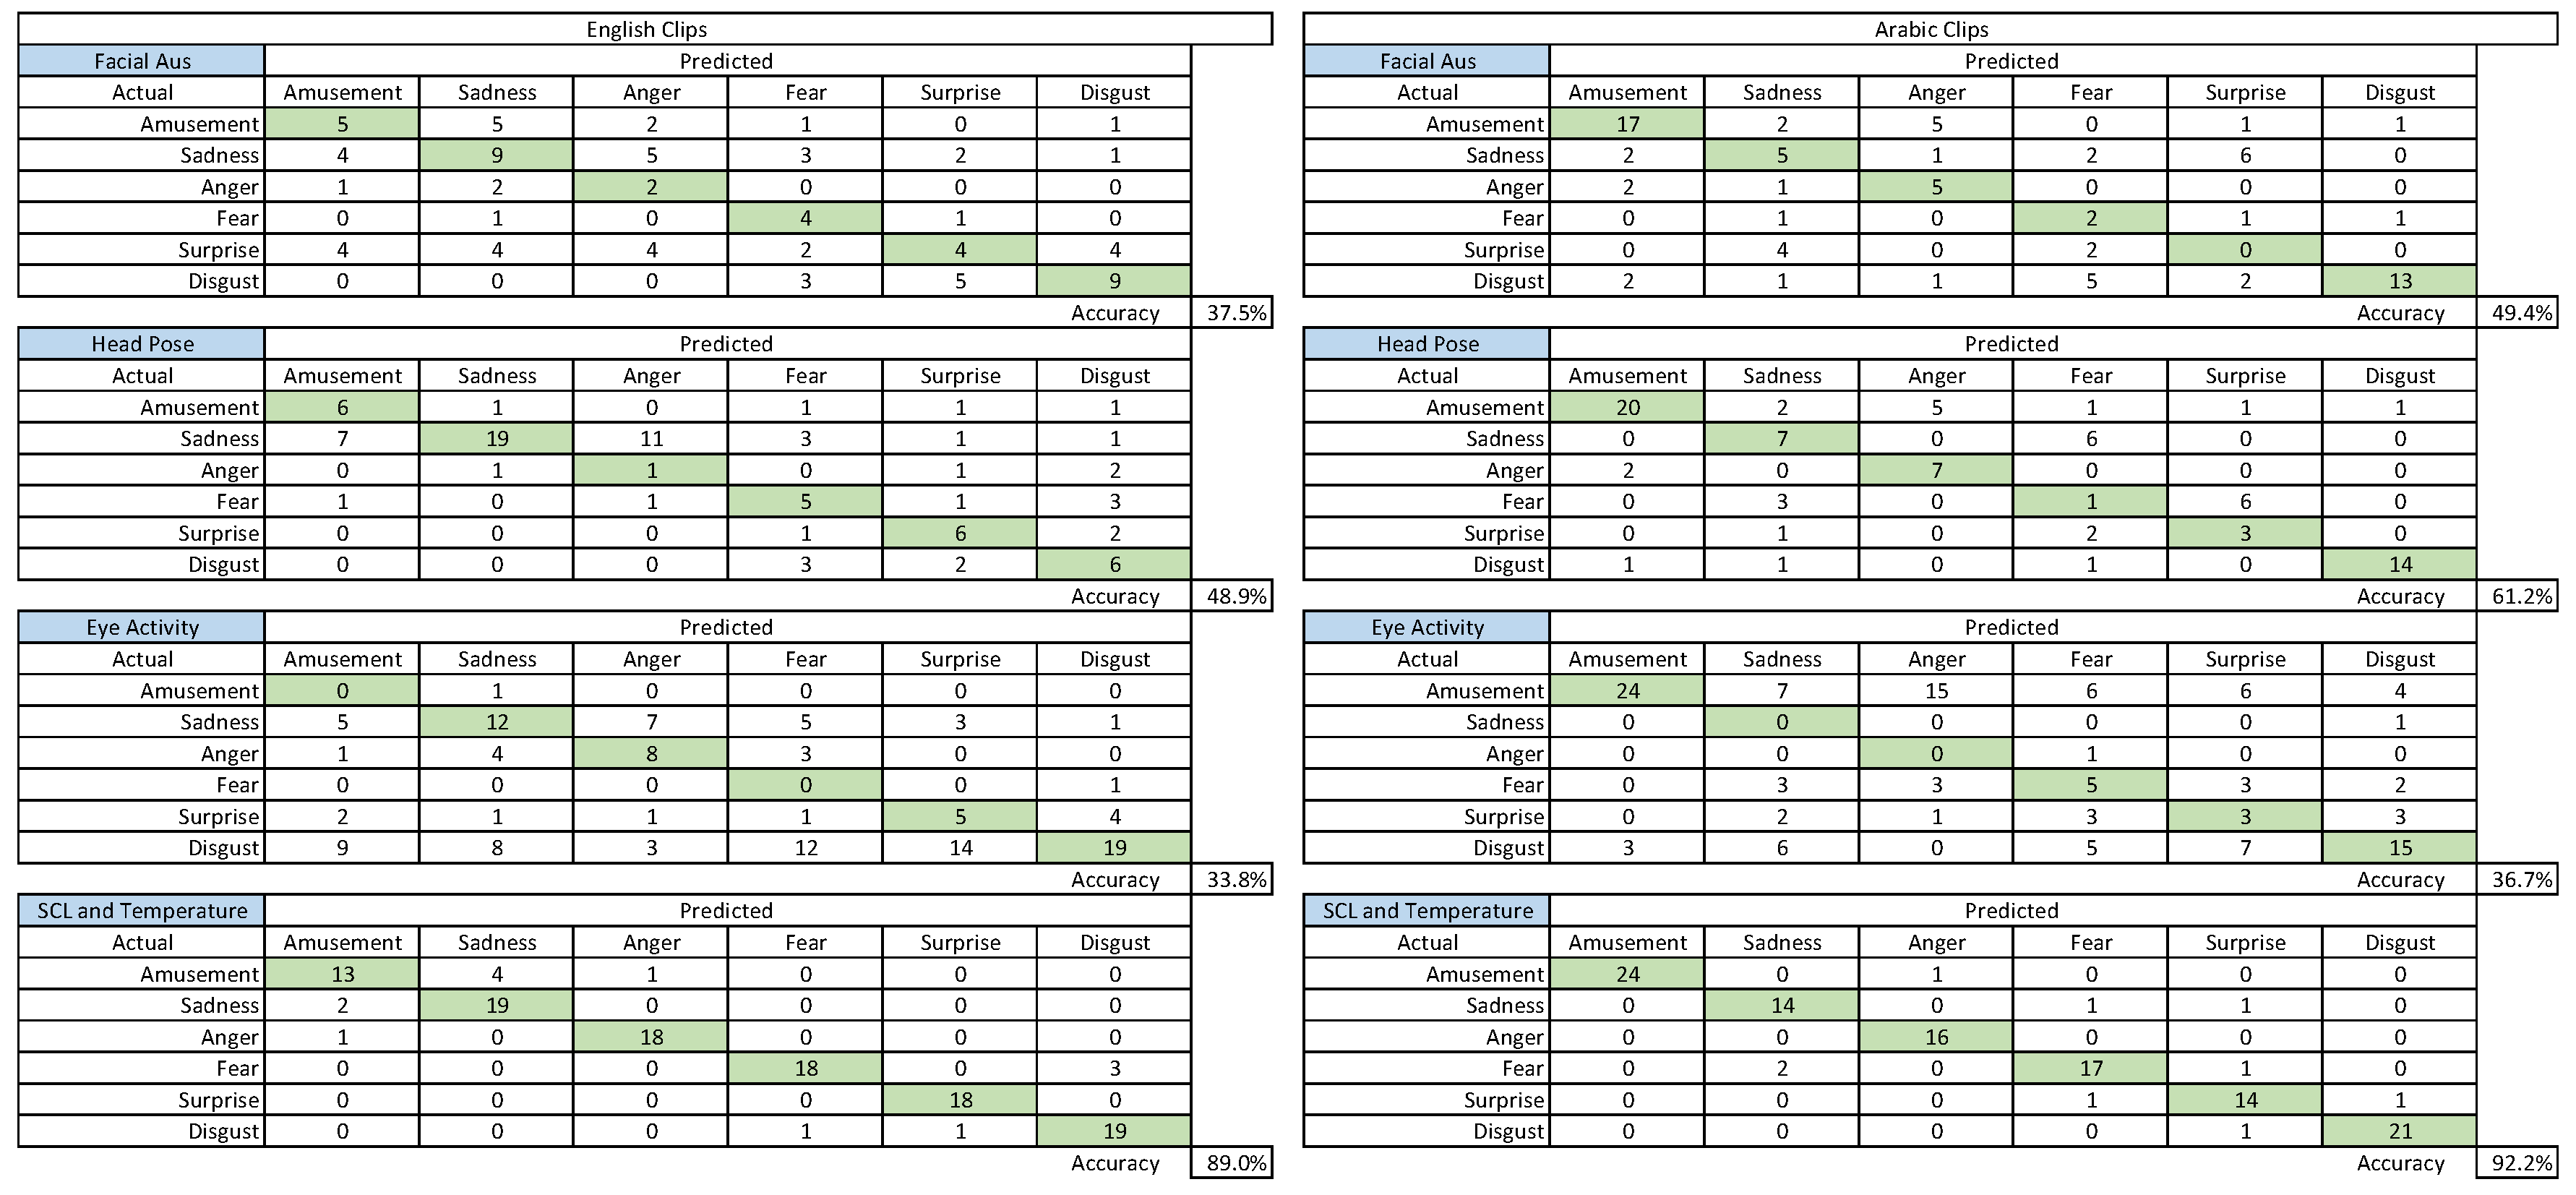
4.2.2. Automatic Classification of Emotions
5. Discussion
6. Conclusions and Future Work
Author Contributions
Funding
Acknowledgments
Conflicts of Interest
References
- Ekman, P. Strong evidence for universals in facial expressions: A reply to Russell’s mistaken critique. Psychol. Bull. 1994, 115, 268–287. [Google Scholar] [CrossRef]
- Izard, C.E. Innate and universal facial expressions: evidence from developmental and cross-cultural research. Psychol. Bull. 1994, 115, 288–299. [Google Scholar] [CrossRef]
- Mesquita, B.; Frijda, N.H.; Scherer, K.R. Culture and emotion. In Handbook of Cross-Cultural Psychology; Allyn & Bacon: Boston, MA, USA, 1997; Volume 2, pp. 255–297. [Google Scholar]
- Russell, J.A. Is there universal recognition of emotion from facial expressions? A review of the cross-cultural studies. Psychol. Bull. 1994, 115, 102. [Google Scholar] [CrossRef] [PubMed]
- Pantic, M.; Pentland, A.; Nijholt, A.; Huang, T. Human computing and machine understanding of human behavior: A survey. In Proceedings of the 8th International Conference on Multimodal Interfaces, Banff, AB, Canada, 2–4 November 2006; pp. 239–248. [Google Scholar]
- Craig, S.; Graesser, A.; Sullins, J.; Gholson, B. Affect and learning: An exploratory look into the role of affect in learning with AutoTutor. J. Educ. Media 2004, 29, 241–250. [Google Scholar] [CrossRef]
- Zhou, F.; Ji, Y.; Jiao, R.J. Affective and cognitive design for mass personalization: Status and prospect. J. Intell. Manuf. 2013, 24, 1047–1069. [Google Scholar] [CrossRef]
- Tao, J.; Tan, T. Affective computing: A review. In Affective Computing and Intelligent Interaction; Springer: Berlin/Heidelberg, Germany, 2005; pp. 981–995. [Google Scholar]
- Alghowinem, S.; Goecke, R.; Wagner, M.; Epps, J.; Breakspear, M.; Parker, G. From Joyous to Clinically Depressed: Mood Detection Using Spontaneous Speech. In Proceedings of the Twenty-Fifth International Florida Artificial Intelligence Research Society Conference, Marco Island, FL, USA, 23–25 May 2012; Youngblood, G.M., McCarthy, P.M., Eds.; AAAI Press: Menlo Park, CA, USA, 2012; pp. 141–146. [Google Scholar]
- Gross, J.J.; Levenson, R.W. Emotion elicitation using films. Cogn. Emot. 1995, 9, 87–108. [Google Scholar] [CrossRef]
- Westermann, R.; Spies, K.; Stahl, G.; Hesse, F.W. Relative effectiveness and validity of mood induction procedures: A meta-analysis. Eur. J. Soc. Psychol. 1996, 26, 557–580. [Google Scholar] [CrossRef]
- Zeng, Z.; Pantic, M.; Roisman, G.I.; Huang, T.S. A survey of affect recognition methods: Audio, visual, and spontaneous expressions. IEEE Trans. Pattern Anal. Mach. Intell. 2009, 31, 39–58. [Google Scholar] [CrossRef]
- Jerritta, S.; Murugappan, M.; Nagarajan, R.; Wan, K. Physiological signals based human emotion Recognition: A review. In Proceedings of the IEEE 7th International Colloquium on Signal Processing and its Applications (CSPA), Penang, Malaysia, 4–6 March 2011; pp. 410–415. [Google Scholar] [CrossRef]
- Alghowinem, S.; Alghuwinem, S.; Alshehri, M.; Al-Wabil, A.; Goecke, R.; Wagner, M. Design of an Emotion Elicitation Framework for Arabic Speakers. In Human-Computer Interaction. Advanced Interaction Modalities and Techniques; Kurosu, M., Ed.; Springer International Publishing: Cham, Switzerland, 2014; Volume 8511, pp. 717–728. [Google Scholar]
- Alghowinem, S.; Albalawi, A. Crowdsourcing Platform for Collecting and Rating Emotion Elicitation Media. Pertanika J. Sci. Technol. 2017, 25, 55–68. [Google Scholar]
- Sloman, A.; Chrisley, R.; Scheutz, M. The Architectural Basis of Affective States and Processes. In Compare: A Journal of Comparative Education; Fellous, J.M., Arbib, M.A., Eds.; Oxford University Press: Oxford, UK, 2005; Volume 4281, pp. 203–244. [Google Scholar]
- Berrios, G.E. The psychopathology of affectivity: Conceptual and historical aspects. Psychol. Med. 1985, 15, 745–758. [Google Scholar] [CrossRef]
- Ekman, P. Basic Emotions. In The Handbook of Cognition and Emotion; Dalgleish, T., Power, T., Eds.; Wiley: Hoboken, NJ, USA, 1999. [Google Scholar]
- Russell, J.A. Affective space is bipolar. J. Personal. Soc. Psychol. 1979, 37, 345–356. [Google Scholar] [CrossRef]
- Jaimes, A.; Sebe, N. Multimodal human-computer interaction: A survey. Comput. Vis. Image Underst. 2007, 108, 116–134. [Google Scholar] [CrossRef]
- Wundt, W. Foundations of psychological thought: A history of psychology. In Foundations of Psychological Thought: A History of Psychology; Chapter Outlines of Psychology (1897); Sage Publications, Inc.: Thousand Oaks, CA, USA, 2009; pp. 36–44. [Google Scholar]
- Sato, W.; Noguchi, M.; Yoshikawa, S. Emotion elicitation effect of films in a Japanese sample. Soc. Behav. Personal. Int. J. 2007, 35, 863–874. [Google Scholar] [CrossRef]
- Gilet, A. [Mood induction procedures: A critical review] (in French). L’Encephale 2008, 34, 233–239. [Google Scholar] [CrossRef]
- Gerrards-Hesse, A.; Spies, K.; Hesse, F.W. Experimental inductions of emotional states and their effectiveness: A review. Br. J. Psychol. 1994, 85, 55–78. [Google Scholar] [CrossRef]
- Philippot, P. Inducing and assessing differentiated emotion-feeling states in the laboratory. Cogn. Emot. 1993, 7, 171–193. [Google Scholar] [CrossRef]
- Hagemann, D.; Naumann, E.; Maier, S.; Becker, G.; Lürken, A.; Bartussek, D. The assessment of affective reactivity using films: Validity, reliability and sex differences. Personal. Individ. Differ. 1999, 26, 627–639. [Google Scholar] [CrossRef]
- Hewig, J.; Hagemann, D.; Seifert, J.; Gollwitzer, M.; Naumann, E.; Bartussek, D. Brief report: A revised film set for the induction of basic emotions. Cogn. Emot. 2005, 19, 1095–1109. [Google Scholar] [CrossRef]
- Schaefer, A.; Nils, F.; Sanchez, X.; Philippot, P. Assessing the effectiveness of a large database of emotion-eliciting films: A new tool for emotion researchers. Cogn. Emot. 2010, 24, 1153–1172. [Google Scholar] [CrossRef]
- Samson, A.C.; Kreibig, S.D.; Soderstrom, B.; Wade, A.A.; Gross, J.J. Eliciting positive, negative and mixed emotional states: A film library for affective scientists. Cogn. Emot. 2016, 30, 827–856. [Google Scholar] [CrossRef] [PubMed]
- Fernández, M.C.; Pascual, M.J.; Soler, R.J.; Fernández-Abascal, E. Spanish validation of an emotion-eliciting set of films. Psicothema 2011, 23, 778. [Google Scholar]
- Richerson, P.J.; Boyd, R. Not by Genes Alone: How Culture Transformed Human Evolution; University of Chicago Press: Chicago, IL, USA, 2008. [Google Scholar]
- Ekman, P.; Friesen, W.V. Constants across cultures in the face and emotion. J. Personal. Soc. Psychol. 1971, 17, 124. [Google Scholar] [CrossRef]
- Nasoz, F.; Alvarez, K.; Lisetti, C.L.; Finkelstein, N. Emotion recognition from physiological signals using wireless sensors for presence technologies. Cogn. Technol. Work 2004, 6, 4–14. [Google Scholar] [CrossRef]
- Michell, P.; Al-Mossawi, M. Religious commitment related to message contentiousness. Int. J. Advert. 1999, 18, 427–443. [Google Scholar] [CrossRef]
- Luqmani, M.; Yavas, U.; Quraeshi, Z. Advertising in Saudi Arabia: content and regulation. Int. Mark. Rev. 1989, 6. [Google Scholar] [CrossRef]
- Hirschman, E.C. Religious affiliation and consumption processes: an initial paradigm. Res. Mark. 1983, 6, 131–170. [Google Scholar]
- Greeley, A.M. The American Catholic: A Social Portrait; Basic Books (AZ): New York, NY, USA, 1977. [Google Scholar]
- Birch, D.; Schirato, T.; Srivastava, S. Asia: Cultural Politics in the Global Age; Allen & Unwin: Crows Nest, Australia, 2001. [Google Scholar]
- Al-Saif, M. Introduction to the Study of Saudi Society: Approach in Sociology and Functional Analysis of the Community, and Scientific Lessons in Social Change and Education; Dar Al-Khurajy Publication: Riyadh, Saudi Arabia, 1997. [Google Scholar]
- Calvo, R.A.; D’Mello, S. Affect detection: An interdisciplinary review of models, methods, and their applications. IEEE Trans. Affect. Comput. 2010, 1, 18–37. [Google Scholar] [CrossRef]
- Schuller, B.W. Speech emotion recognition: Two decades in a nutshell, benchmarks, and ongoing trends. Commun. ACM 2018, 61, 90–99. [Google Scholar] [CrossRef]
- Partila, P.; Tovarek, J.; Frnda, J.; Voznak, M.; Penhaker, M.; Peterek, T. Emotional Impact on Neurological Characteristics and Human Speech. In Intelligent Data analysis and its Applications, Volume II; Pan, J.S., Snasel, V., Corchado, E.S., Abraham, A., Wang, S.L., Eds.; Springer International Publishing: Cham, Switzerland, 2014; pp. 527–533. [Google Scholar]
- Ekman, P.; Matsumoto, D.; Friesen, W.V. Facial expression in affective disorders. In What the Face Reveals: Basic and Applied Studies of Spontaneous Expression Using the Facial Action Coding System (FACS); Oxford University Press: Oxford, UK, 1997; Volume 2. [Google Scholar]
- Bartlett, M.; Movellan, J.; Littlewort, G.; Braathen, B.; Frank, M.; Sejnowski, T. Towards automatic recognition of spontaneous facial actions. Afterword by J.R. Movellan and M.S. Bartlett: The next generation of automatic facial expression measurement. In What the Face Reveals; Ekman, P., Ed.; Oxford University Press: Oxford, UK, 2005; pp. 393–426. [Google Scholar]
- Heylen, D. Head gestures, gaze and the principles of conversational structure. Int. J. Humanoid Robot. 2006, 3, 241–267. [Google Scholar] [CrossRef]
- Noroozi, F.; Corneanu, C.A.; Kamińska, D.; Sapiński, T.; Escalera, S.; Anbarjafari, G. Survey on emotional body gesture recognition. arXiv 2018, arXiv:1801.07481. [Google Scholar] [CrossRef]
- Horng, W.; Chen, C.; Chang, Y.; Fan, C. Driver fatigue detection based on eye tracking and dynamk, template matching. In Proceedings of the IEEE International Conference on Networking, Sensing and Control 2004, Taipei, Taiwan, 21–23 March 2004; Volume 1, pp. 7–12. [Google Scholar]
- Beatty, J. Task-evoked pupillary responses, processing load, and the structure of processing resources. Psychol. Bull. 1982, 91, 276. [Google Scholar] [CrossRef] [PubMed]
- Kahneman, D.; Tursky, B.; Shapiro, D.; Crider, A. Pupillary, heart rate, and skin resistance changes during a mental task. J. Exp. Psychol. J. Exp. Psychol. 1969, 79, 164. [Google Scholar] [CrossRef]
- Bradley, M.M.; Miccoli, L.; Escrig, M.A.; Lang, P.J. The pupil as a measure of emotional arousal and autonomic activation. Psychophysiology 2008, 45, 602–607. [Google Scholar] [CrossRef] [PubMed]
- Partala, T.; Jokiniemi, M.; Surakka, V. Pupillary responses to emotionally provocative stimuli. In Proceedings of the 2000 Symposium on Eye Tracking Research & Applications, Palm Beach Gardens, FL, USA, 6–8 November 2000; pp. 123–129. [Google Scholar]
- Partala, T.; Surakka, V. Pupil size variation as an indication of affective processing. Int. J. Hum. Comput. Stud. 2003, 59, 185–198. [Google Scholar] [CrossRef]
- Hess, E.H. Pupillometrics: A method of studying mental, emotional and sensory processes. In Handbook of Psychophysiology; Cambridge University Press: New York, NY, USA, 1972; pp. 491–531. [Google Scholar]
- Niemic, C.P.; Warren, K. Studies of Emotion. A Theoretical and Empirical Review of Psychophysiological Studies of Emotion. J. Undergrad. Res. 2002, 1, 15–19. [Google Scholar]
- Jackson, D.C.; Mueller, C.J.; Dolski, I.; Dalton, K.M.; Nitschke, J.B.; Urry, H.L.; Rosenkranz, M.A.; Ryff, C.D.; Singer, B.H.; Davidson, R.J. Now You Feel It, Now You Don’t Frontal Brain Electrical Asymmetry and Individual Differences in Emotion Regulation. Psychol. Sci. 2003, 14, 612–617. [Google Scholar] [CrossRef]
- Sutton, S.K.; Davidson, R.J.; Donzella, B.; Irwin, W.; Dottl, D.A. Manipulating affective state using extended picture presentations. Psychophysiology 2007, 34, 217–226. [Google Scholar] [CrossRef]
- Alghowinem, S.; Alshehri, M.; Goecke, R.; Wagner, M. Exploring Eye Activity as an Indication of Emotional States Using an Eye-Tracking Sensor. In Intelligent Systems for Science and Information; Springer: Berlin, Germany, 2014; pp. 261–276. [Google Scholar]
- Alshehri, M.; Alghowinem, S. An exploratory study of detecting emotion states using eye-tracking technology. In Proceedings of the IEEE Science and Information Conference (SAI), London, UK, 7–9 October 2013; pp. 428–433. [Google Scholar]
- Lisetti, C.L.; Nasoz, F. Using noninvasive wearable computers to recognize human emotions from physiological signals. EURASIP J. Appl. Signal Process. 2004, 2004, 1672–1687. [Google Scholar] [CrossRef]
- Nakasone, A.; Prendinger, H.; Ishizuka, M. Emotion recognition from electromyography and skin conductance. In Proceedings of the 5th International Workshop on Biosignal Interpretation, Tokyo, Japan, 6–8 September 2005; pp. 219–222. [Google Scholar]
- Al-Mutairi, N.; Alghowinem, S.; Al-Wabil, A. Comparison of User Responses to English and Arabic Emotion Elicitation Video Clips. In Proceedings of the International Conference on Cross-Cultural Design, Angeles, CA, USA, 2–7 August 2015; pp. 141–152. [Google Scholar]
- Stemmler, G. The autonomic differentiation of emotions revisited: Convergent and discriminant validation. Psychophysiology 1989, 26, 617–632. [Google Scholar] [CrossRef]
- Philippot, P.; Rimé, B. The perception of bodily sensations during emotion: A cross-cultural perspective. Polish Psychol. Bull. 1997, 28, 175–188. [Google Scholar]
- Nie, D.; Wang, X.W.; Shi, L.C.; Lu, B.L. EEG-based emotion recognition during watching movies. In Proceedings of the 5th International IEEE/EMBS Conference on Neural Engineering (NER), Cancun, Mexico, 27 April–1 May 2011; pp. 667–670. [Google Scholar]
- Ramirez, R.; Vamvakousis, Z. Detecting emotion from EEG signals using the emotive EPOC device. In Brain Informatics; Springer: Berlin/Heidelberg, Germany, 2012; pp. 175–184. [Google Scholar]
- Pham, T.D.; Tran, D. Emotion recognition using the emotiv epoc device. In Neural Information Processing; Springer: Berlin/Heidelberg, Germany, 2012; pp. 394–399. [Google Scholar]
- Petrantonakis, P.C.; Hadjileontiadis, L.J. Emotion recognition from EEG using higher order crossings. IEEE Trans. Inf. Technol. Biomed. 2010, 14, 186–197. [Google Scholar] [CrossRef]
- Nasehi, S.; Pourghassem, H. An Optimal EEG-based Emotion Recognition Algorithm Using Gabor Features. WSEAS Trans. Signal Process. 2012, 8, 87–99. [Google Scholar]
- Revilla, M.; Ochoa, C. Ideal and Maximum Length for a Web Survey. Int. J. Market Res. 2017, 59, 557–565. [Google Scholar] [CrossRef]
- Lang, P.J.; Bradley, M.M.; Cuthbert, B.N. International affective picture system (IAPS): Technical Manual and Affective Ratings; NIMH Center for the Study of Emotion and Attention: Gainesville, FL, USA, 1997; pp. 39–58. [Google Scholar]
- Naccache, L.; Dehaene, S. Unconscious semantic priming extends to novel unseen stimuli. Cognition 2001, 80, 215–229. [Google Scholar] [CrossRef]
- Albarran, A. The Media Economy, 2nd ed.; Routledge: New York, NY, USA, 2017. [Google Scholar]
- Wright, K.B. Researching Internet-based populations: Advantages and disadvantages of online survey research, online questionnaire authoring software packages, and web survey services. J. Comput. Mediat. Commun. 2005, 10. [Google Scholar] [CrossRef]
- Shaughnessy, J.J.; Zechmeister, E.B.; Zechmeister, J.S. Research Methods in Psychology, 10th ed.; McGraw-Hill Education: New York, NY, USA, 2014. [Google Scholar]
- Sharma, N.; Dhall, A.; Gedeon, T.; Goecke, R. Modeling Stress Using Thermal Facial Patterns: A Spatio-temporal Approach. In Proceedings of the 2013 Humaine Association Conference on Affective Computing and Intelligent Interaction, Geneva, Switzerland, 2–5 September 2013; pp. 387–392. [Google Scholar] [CrossRef]
- Likert, R. A Technique for the Measurement of Attitudes; American Psychological Association: Washington, DC, USA, 1932. [Google Scholar]
- Norman, G. Likert scales, levels of measurement and the “laws” of statistics. Adv. Health Sci. Educ. 2010, 15, 625–632. [Google Scholar] [CrossRef]
- Tan, G.; Jensen, M.P.; Thornby, J.I.; Shanti, B.F. Validation of the Brief Pain Inventory for chronic nonmalignant pain. J. Pain 2004, 5, 133–137. [Google Scholar] [CrossRef]
- Payne, A.F.H.; Schell, A.M.; Dawson, M.E. Lapses in skin conductance responding across anatomical sites: Comparison of fingers, feet, forehead, and wrist. Psychophysiology 2016, 53, 1084–1092. [Google Scholar] [CrossRef]
- Chang, C.C.; Lin, C.J. LIBSVM: A library for support vector machines. Computer 2001, 2, 1–30. [Google Scholar] [CrossRef]
- Jayalakshmi, T.; Santhakumaran, A. Statistical normalization and back propagation for classification. Int. J. Comput. Theory Eng. 2011, 3, 1793–8201. [Google Scholar]
- Zhu, L.; Christie, T.B. Stereotypes of Americans and Hollywood Movie Viewing in China: A Uses and Gratifications Perspective. China Media Res. 2015, 11, 29–37. [Google Scholar]
- Akyol, M. The Islamic Jesus: How the King of the Jews Became a Prophet of the Muslims; St. Martin’s Press: New York, NY, USA, 2017. [Google Scholar]
- Al-Aidaros, A.H.; Shamsudin, F.M.; Idris, K.M. Ethics and ethical theories from an Islamic perspective. Int. J. Islam. Thought 2013, 4, 1. [Google Scholar] [CrossRef]
- Larsson, G. Muslims and the New Media: Historical and Contemporary Debates; Routledge: Abingdon, UK, 2016. [Google Scholar]
- Druschel, B.; Sherman, M. Disgust sensitivity as a function of the Big Five and gender. Personal. Individ. Differ. 1999, 26, 739–748. [Google Scholar] [CrossRef]
- Raskin, V. Semantic Mechanisms of Humor; Springer: Berlin, Germany, 1985; Volume 24. [Google Scholar]
- Fischer, A.H.; Rodriguez Mosquera, P.M.; Van Vianen, A.E.; Manstead, A.S. Gender and culture differences in emotion. Emotion 2004, 4, 87. [Google Scholar] [CrossRef]
- Darwin, C. The Expression of the Emotions in Man and Animals; University of Chicago Press: Chicago, IL, USA, 1965; Volume 526. [Google Scholar]
- Ekman, P.; Friesen, W. Measuring facial movement. Environ. Psychol. Nonverbal Behav. 1976, 1, 56–75. [Google Scholar] [CrossRef]
- Carroll, J.M.; Russell, J.A. Facial expressions in Hollywood’s protrayal of emotion. J. Personal. Soc. Psychol. 1997, 72, 164. [Google Scholar] [CrossRef]
- Wallbott, H.G. Bodily expression of emotion. Eur. J. Soc. Psychol. 1998, 28, 879–896. [Google Scholar] [CrossRef]
- Prehn, K.; Heekeren, H.R.; Blasek, K.; Lapschies, K.; Mews, I.; van der Meer, E. Neuroticism influences pupillary responses during an emotional interference task. Int. J. Psychophysiol. 2008, 70, 40–49. [Google Scholar] [CrossRef]
- Boucsein, W. Electrodermal Activity; Springer: Berlin, Germany, 2012. [Google Scholar]
- Ekman, P.; Levenson, R.W.; Friesen, W.V. Autonomic nervous system activity distinguishes among emotions. Science 1983, 221, 1208–1210. [Google Scholar] [CrossRef]
- Henriques, R.; Paiva, A.; Antunes, C. On the need of new methods to mine electrodermal activity in emotion-centered studies. In Agents and Data Mining Interaction; Springer: Berlin, Germany, 2013; pp. 203–215. [Google Scholar]
- Kolodyazhniy, V.; Kreibig, S.D.; Gross, J.J.; Roth, W.T.; Wilhelm, F.H. An affective computing approach to physiological emotion specificity: Toward subject-independent and stimulus-independent classification of film-induced emotions. Psychophysiology 2011, 48, 908–922. [Google Scholar] [CrossRef]
- Jang, E.H.; Park, B.J.; Kim, S.H.; Chung, M.A.; Park, M.S.; Sohn, J.H. Emotion classification based on bio-signals emotion recognition using machine learning algorithms. In Proceedings of the 2014 International Conference on Information Science, Electronics and Electrical Engineering (ISEEE), Sapporo, Japan, 26–28 April 2014; Volume 3, pp. 1373–1376. [Google Scholar]
- Kimura, S.; Yachida, M. Facial expression recognition and its degree estimation. In Proceedings of the IEEE Computer Society Conference on Computer Vision and Pattern Recognition, San Juan, PR, USA, 17–19 June 1997; pp. 295–300. [Google Scholar]
- Lien, J.J.; Kanade, T.; Cohn, J.F.; Li, C.C. Subtly different facial expression recognition and expression intensity estimation. In Proceedings of the IEEE Computer Society Conference on Computer Vision and Pattern Recognition, Santa Barbara, CA, USA, 25 June 1998; pp. 853–859. [Google Scholar]
- Sayette, M.A.; Cohn, J.F.; Wertz, J.M.; Perrott, M.A.; Parrott, D.J. A psychometric evaluation of the facial action coding system for assessing spontaneous expression. J. Nonverbal Behav. 2001, 25, 167–185. [Google Scholar] [CrossRef]
- Pantic, M.; Patras, I. Dynamics of facial expression: recognition of facial actions and their temporal segments from face profile image sequences. IEEE Trans. Syst. Man Cybern. Part B (Cybern.) 2006, 36, 433–449. [Google Scholar] [CrossRef]
- Soleymani, M.; Pantic, M.; Pun, T. Multimodal emotion recognition in response to videos. IEEE Trans. Affect. Comput. 2012, 3, 211–223. [Google Scholar] [CrossRef]
- Zheng, W.L.; Dong, B.N.; Lu, B.L. Multimodal emotion recognition using EEG and eye tracking data. In Proceedings of the 2014 36th Annual International Conference of the IEEE Engineering in Medicine and Biology Society (EMBC), Chicago, IL, USA, 26–30 August 2014; pp. 5040–5043. [Google Scholar]
- El Kaliouby, R.; Robinson, P. Generalization of a vision-based computational model of mind-reading. In Affective Computing and Intelligent Interaction; Springer: Berlin/Heidelberg, Germany, 2005; pp. 582–589. [Google Scholar]
- Alghowinem, S.; Goecke, R.; Wagner, M.; Parkerx, G.; Breakspear, M. Head pose and movement analysis as an indicator of depression. In Proceedings of the 2013 Humaine Association Conference on Affective Computing and Intelligent Interaction (ACII), Geneva, Switzerland, 2–5 September 2013; pp. 283–288. [Google Scholar]
- Gilman, T.L.; Shaheen, R.; Nylocks, K.M.; Halachoff, D.; Chapman, J.; Flynn, J.J.; Matt, L.M.; Coifman, K.G. A film set for the elicitation of emotion in research: A comprehensive catalog derived from four decades of investigation. Behav. Res. Methods 2017, 49, 2061–2082. [Google Scholar] [CrossRef] [PubMed]
- Gabert-Quillen, C.A.; Bartolini, E.E.; Abravanel, B.T.; Sanislow, C.A. Ratings for emotion film clips. Behav. Res. Methods 2015, 47, 773–787. [Google Scholar] [CrossRef]
- Ginsburgh, V.; Weyers, S. On the perceived quality of movies. J. Cult. Econ. 1999, 23, 269–283. [Google Scholar] [CrossRef]
- Jiang, D.N.; Cai, L.H. Speech emotion classification with the combination of statistic features and temporal features. In Proceedings of the 2004 IEEE International Conference on Multimedia and Expo, Taipei, Taiwan, 27–30 June 2004; Volume 3, pp. 1967–1970. [Google Scholar]
- Wagner, J.; Kim, J.; André, E. From physiological signals to emotions: Implementing and comparing selected methods for feature extraction and classification. In Proceedings of the IEEE International Conference on Multimedia and Expo, ICME 2005, Amsterdam, The Netherlands, 6 July 2005; pp. 940–943. [Google Scholar]
- Poria, S.; Chaturvedi, I.; Cambria, E.; Hussain, A. Convolutional MKL based multimodal emotion recognition and sentiment analysis. In Proceedings of the 2016 IEEE 16th International Conference on Data Mining (ICDM), Barcelona, Spain, 12–15 December 2016; pp. 439–448. [Google Scholar]
- Busso, C.; Deng, Z.; Yildirim, S.; Bulut, M.; Lee, C.M.; Kazemzadeh, A.; Lee, S.; Neumann, U.; Narayanan, S. Analysis of emotion recognition using facial expressions, speech and multimodal information. In Proceedings of the 6th International Conference on Multimodal Interfaces, State College, PA, USA, 13–15 October 2004; pp. 205–211. [Google Scholar]
- Alghowinem, S.; Goecke, R.; Wagner, M.; Epps, J.; Hyett, M.; Parker, G.; Breakspear, M. Multimodal Depression Detection: Fusion Analysis of Paralinguistic, Head Pose and Eye Gaze Behaviors. IEEE Trans. Affect. Comput. 2017, 9, 478–490. [Google Scholar] [CrossRef]
- Hua, J.; Xiong, Z.; Lowey, J.; Suh, E.; Dougherty, E.R. Optimal number of features as a function of sample size for various classification rules. Bioinformatics 2004, 21, 1509–1515. [Google Scholar] [CrossRef]
- Jain, A.K.; Chandrasekaran, B. 39 Dimensionality and sample size considerations in pattern recognition practice. Handb. Stat. 1982, 2, 835–855. [Google Scholar]
- Feldt, R.; Magazinius, A. Validity Threats in Empirical Software Engineering Research-An Initial Survey. In Proceedings of the 22nd International Conference on Software Engineering & Knowledge Engineering (SEKE’2010), Redwood City, CA, USA, 1–3 July 2010; pp. 374–379. [Google Scholar]


| Emotion | Duration (s) | Description |
|---|---|---|
| English Clips | ||
| Amusement | 120 | Stand-up comedy showing Bill Cosby talking about his father and his childhood. (“Bill Cosby, Himself”, Jemmin Inc., 1983). |
| Sadness | 164 | A boxer dying after a fight and a young boy grieving. The boy cries and asks everyone to wake up the boxer. (“The Champ”, MGM, 1979) |
| Anger | 234 | A group of boys beats and humiliates another boy in front of his friends. (“My Bodyguard”, Twentieth Century Fox Film Corporation, 1980) |
| Fear | 82 | A little boy playing when a ball mysteriously trundles towards him, then he starts looking for his mother. (“The Shining”, Warner Bros, 1980) |
| Surprise | 44 | A man staying in his house. Suddenly, the door opens, and many men swoop into the house (“Capricorn One”, Associated General Films, 1977) |
| Disgust | 65 | Amputation of a hand in medical surgery. (Non-commercial) |
| Arabic Clips | ||
| Amusement | 174 | A girl struggling to speak English on behalf of her mother. (“Bye-Bye London”, Funoon Play, 1981) |
| Sadness | 59 | A girl has a bad dream about her dead father and cries for missing him. (“Bu kreem with seven woman”, MBC, 2011) |
| Anger | 133 | A man beats and humiliates another man and offends his beliefs. (“Omar”, MBC and Qatar TV, 2012) |
| Fear | 50 | Two men attacking an old lady, stealing her money and injuring her hand with a knife. (“Mother is a Basha”, ART, 2013) |
| Surprise | 45 | A doctor leaving his clinic in peace. Suddenly, he gets shot by another man. (“Tagreebah Falestineeah”, Syrian Art Production International, 2004) |
| Disgust | 30 | A man eats insects. (“Arab Got Talent”, MBC, 2013) |
| Page | Questions |
|---|---|
| 1 | Aim, explanations and consent |
| 2 | General: Gender, age, living region of Saudi Arabia |
| Health: Heart, breathing, sight and hearing issues | |
| Watching media habits for both English and Arabic content | |
| Current mood (self-assessment) | |
| 3–14 | Play each clip (for 6 emotions for English and Arabic) |
| Feeling: Rate the level of each emotion felt (0 not felt, 10 felt strongly) | |
| About the clip: - Seen before - Looked away * | |
| Acceptance: - General acceptance - Reasons for non-acceptance (if any) | |
| 15 | Current mood |
| Accompany: - Being in the company of with others while watching? - If yes, did their presence affect your answers? |
| Device | Extracted and Analysed Features |
|---|---|
| Microsoft Kinect | Facial Points |
| Head Pose | |
| Facial Action Units (AUs) | |
| Tobii Eye Tracker | Eye Movement and Activities |
| Gaze | |
| Q-sensor | Skin Conductance |
| Temperature | |
| EPOC Emotiv | Brain wave Analysis |
| Amusement | Sadness | Anger | Fear | Surprise | Disgust | |
|---|---|---|---|---|---|---|
| English | 345 | 258 | 226 | 196 | 182 | 171 |
| Arabic | 289 | 242 | 208 | 190 | 175 | 166 |
| Amus. | Sad. | Anger | Fear | Surprise | Disgust | |
|---|---|---|---|---|---|---|
| English Clips (with Arabic subtitles) | ||||||
| Kinect | 14 | 21 | 13 | 13 | 12 | 15 |
| Tobii | 17 | 26 | 19 | 21 | 22 | 25 |
| Q-Sensor | 16 | 23 | 19 | 19 | 19 | 22 |
| Arabic Clips | ||||||
| Kinect | 23 | 14 | 12 | 11 | 10 | 15 |
| Tobii | 27 | 18 | 19 | 20 | 19 | 25 |
| Q-Sensor | 24 | 16 | 17 | 19 | 17 | 22 |
| Emotion | English Clips | Arabic Clips |
|---|---|---|
| Amusement | 63% wording (curses) | 56% disrespectful of parents |
| 55% disrespectful of religious figure | ||
| 42% disrespectful of parents | ||
| Sadness | - | 64% loud music |
| Anger | 59% violence (bullying) | 64% depicting religious figures |
| Fear | - | 54% assaulting a women |
| Surprise | - | - |
| Disgust | 77% intensity of disgust | 45% intensity of disgust |
| Measurement | # | Significant Features |
|---|---|---|
| Facial AUs | 36 | Range and maximum duration of: |
| - decrease and increase of All 6 AUs | ||
| - increase velocity of AU1 | ||
| Range and minimum duration of: | ||
| - decrease velocity of AU2 | ||
| - decrease velocity of AU3 | ||
| Rate of steady AU0 state | ||
| Range duration of: | ||
| - increase velocity of AU2 and AU5 | ||
| - decrease velocity of AU5 | ||
| Minimum duration of: | ||
| - decrease velocity of AU1 | ||
| - increase velocity of AU4 | ||
| Maximum duration of: | ||
| - increase velocity of AU5 | ||
| - continuous movement of AU3 | ||
| Head Pose | 17 | Rate and average duration of: |
| - fast yaw, roll and pitch movements | ||
| - continuous yaw, roll and pitch movements | ||
| Maximum duration of fast roll movement | ||
| Range and maximum duration of anticlockwise roll | ||
| Average and maximum duration of left yaw | ||
| Eye Activity | 12 | Range and maximum duration of |
| - open left, right and both eyes | ||
| Maximum duration of | ||
| - small and large pupil size for left and right eyes | ||
| SCL | 11 | Duration rate of increased changes of SCL |
| Maximum duration of high SCL | ||
| Range and minimum duration of low SCL | ||
| Average count of the occurrence of: | ||
| - increase changes of SCL | ||
| - steady state and continuous change of SCL | ||
| Temperature | 22 | Range and std of temperature |
| Maximum duration of high temperature | ||
| Average, std and var of temperature velocity changes | ||
| std and var of temperature acceleration changes | ||
| Average, range, minimum and maximum duration of | ||
| low temperature | ||
| Rate of steady state and continuous change of temperature | ||
| Rate of increase change of temperature | ||
| Average duration of decrease change of temperature | ||
| Average count of occurrence of: | ||
| - increase change of temperature | ||
| - steady state and continuous change of temperature | ||
| Total Features | 98 |
| Features | English Clips | Arabic Clips |
|---|---|---|
| Facial AUs | 37.5 | 49.4 |
| Head Pose | 48.9 | 61.2 |
| Eye Activity | 33.8 | 36.7 |
| SCL and Temperature | 89.0 | 92.2 |
| Average | 52.3 | 59.9 |
© 2019 by the authors. Licensee MDPI, Basel, Switzerland. This article is an open access article distributed under the terms and conditions of the Creative Commons Attribution (CC BY) license (http://creativecommons.org/licenses/by/4.0/).
Share and Cite
Alghowinem, S.; Goecke, R.; Wagner, M.; Alwabil, A. Evaluating and Validating Emotion Elicitation Using English and Arabic Movie Clips on a Saudi Sample. Sensors 2019, 19, 2218. https://doi.org/10.3390/s19102218
Alghowinem S, Goecke R, Wagner M, Alwabil A. Evaluating and Validating Emotion Elicitation Using English and Arabic Movie Clips on a Saudi Sample. Sensors. 2019; 19(10):2218. https://doi.org/10.3390/s19102218
Chicago/Turabian StyleAlghowinem, Sharifa, Roland Goecke, Michael Wagner, and Areej Alwabil. 2019. "Evaluating and Validating Emotion Elicitation Using English and Arabic Movie Clips on a Saudi Sample" Sensors 19, no. 10: 2218. https://doi.org/10.3390/s19102218
APA StyleAlghowinem, S., Goecke, R., Wagner, M., & Alwabil, A. (2019). Evaluating and Validating Emotion Elicitation Using English and Arabic Movie Clips on a Saudi Sample. Sensors, 19(10), 2218. https://doi.org/10.3390/s19102218