Fusion of Heart Rate, Respiration and Motion Measurements from a Wearable Sensor System to Enhance Energy Expenditure Estimation

 , ,
, ,  ,
, 
Abstract
1. Introduction
2. Materials and Methods
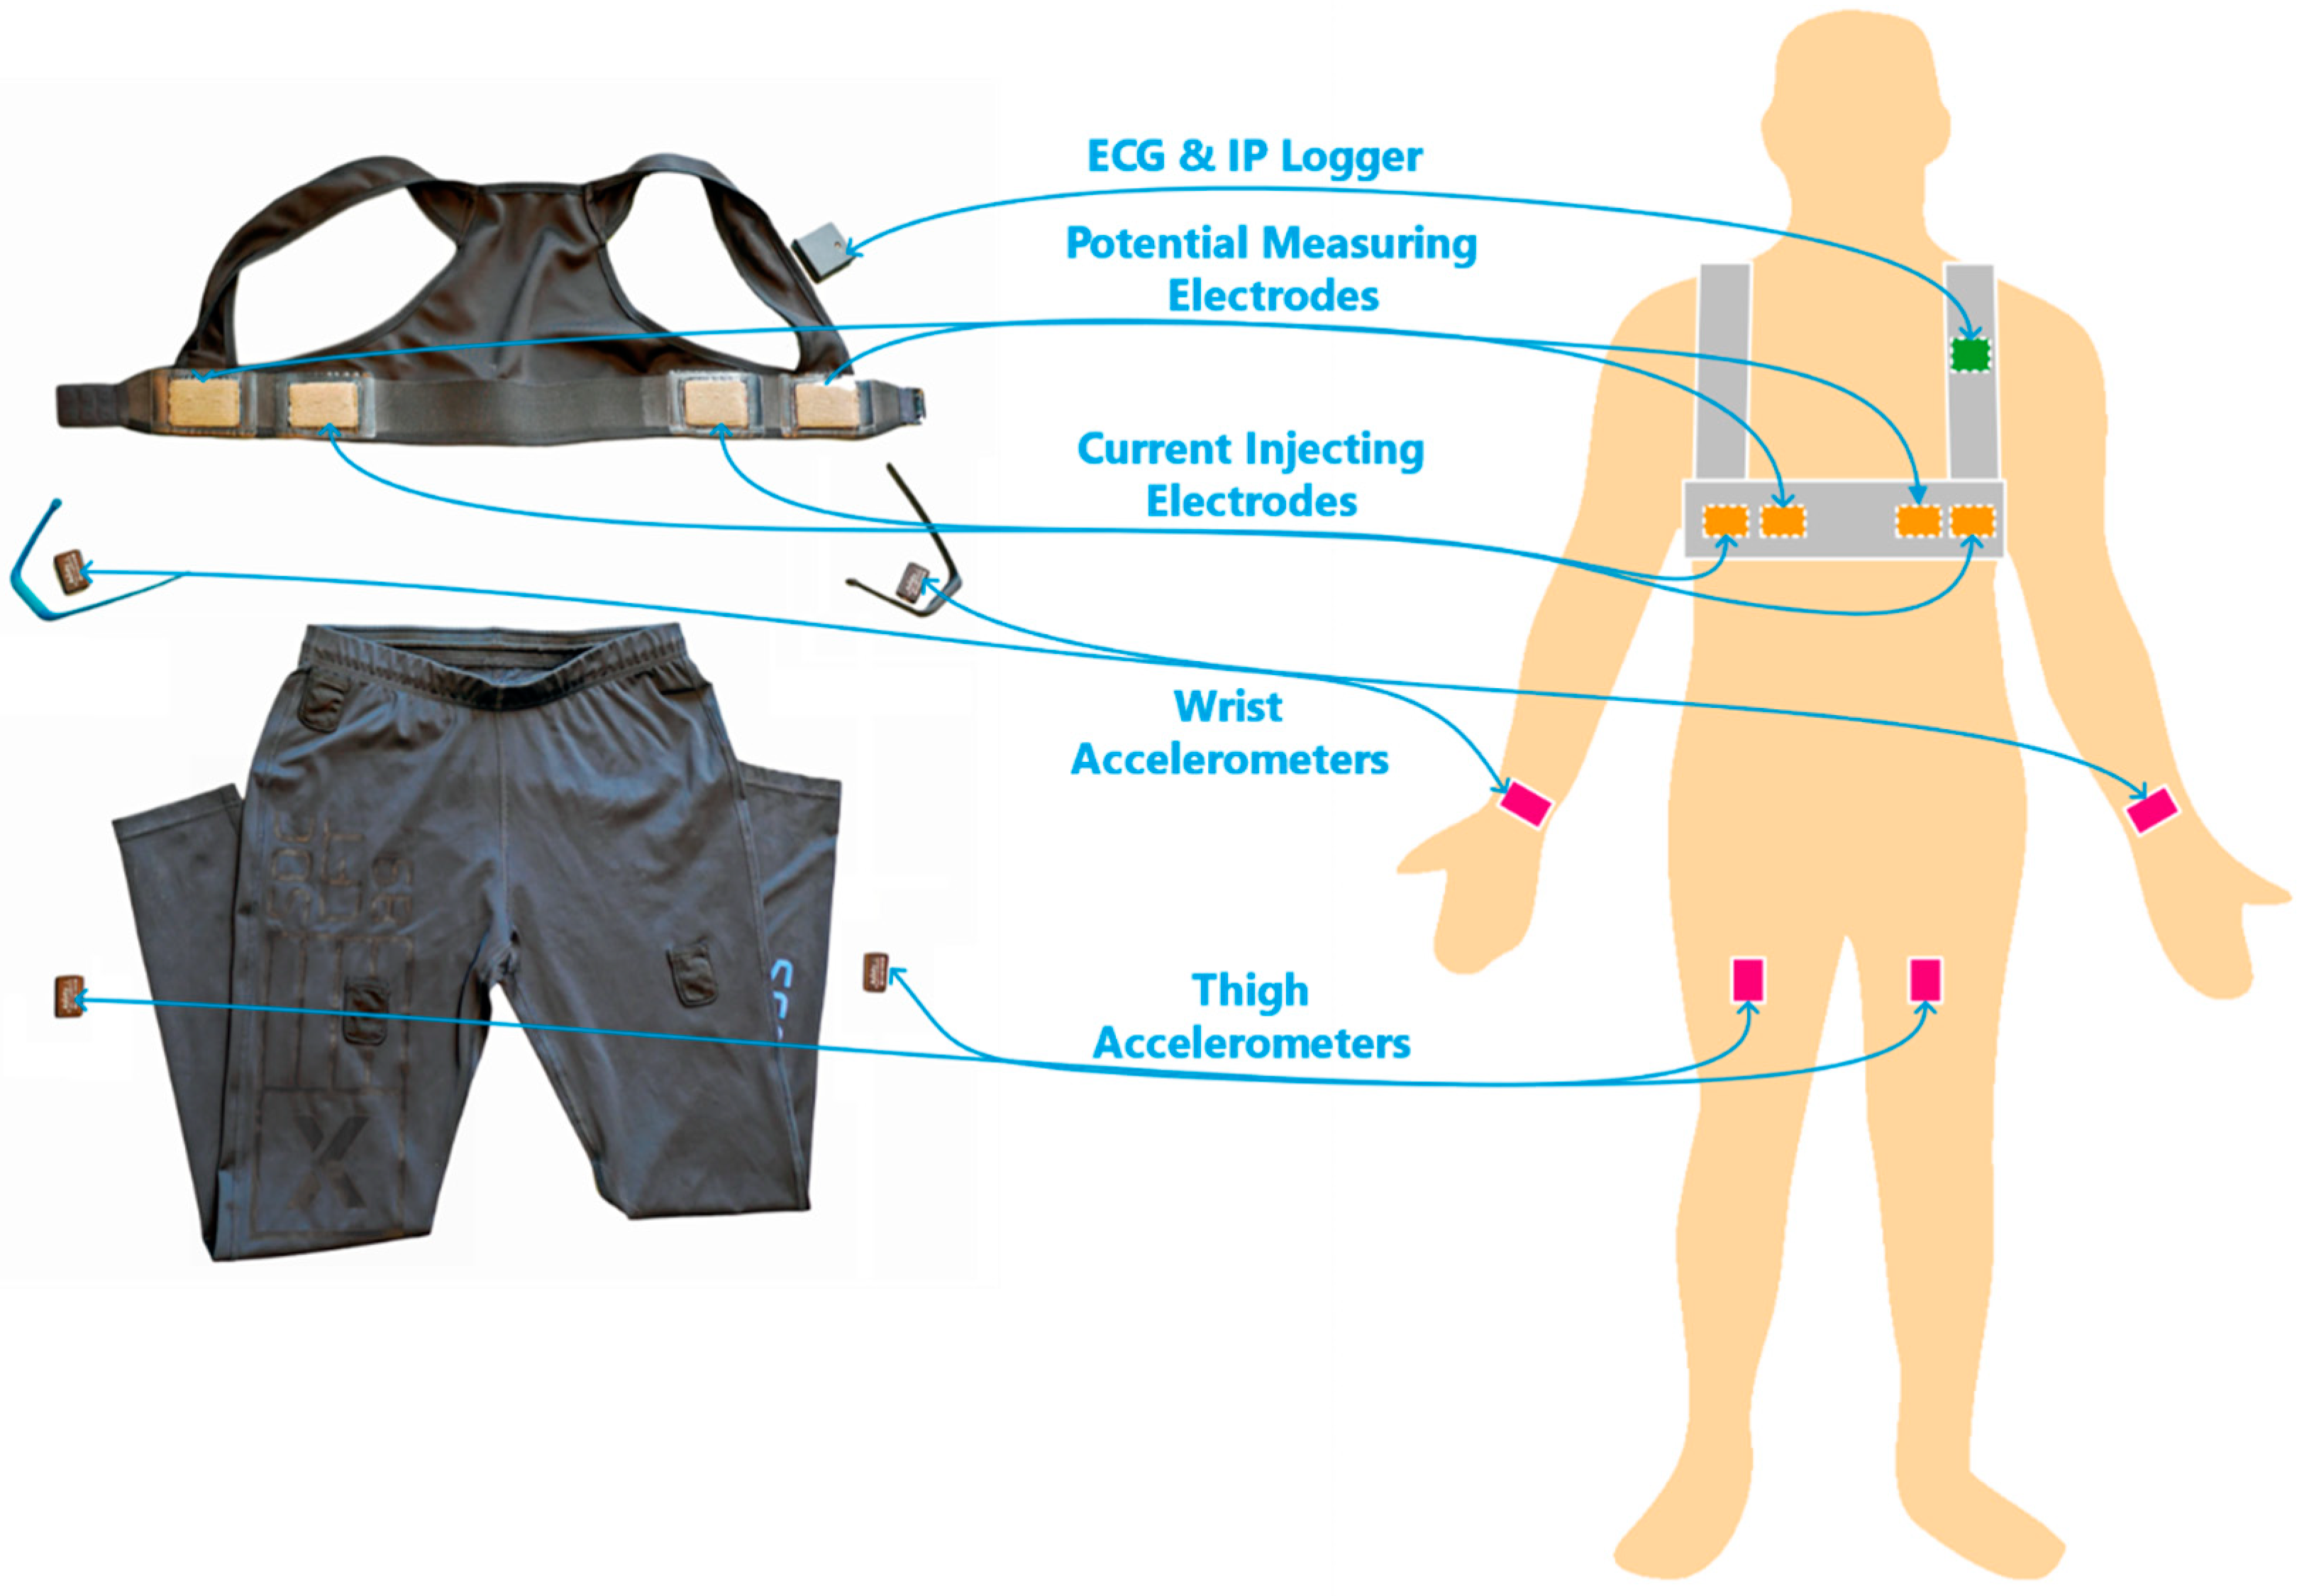
2.1. The Wearable Sensor System
2.2. Data Collection
2.2.1. Participants
2.2.2. Experiment Protocol
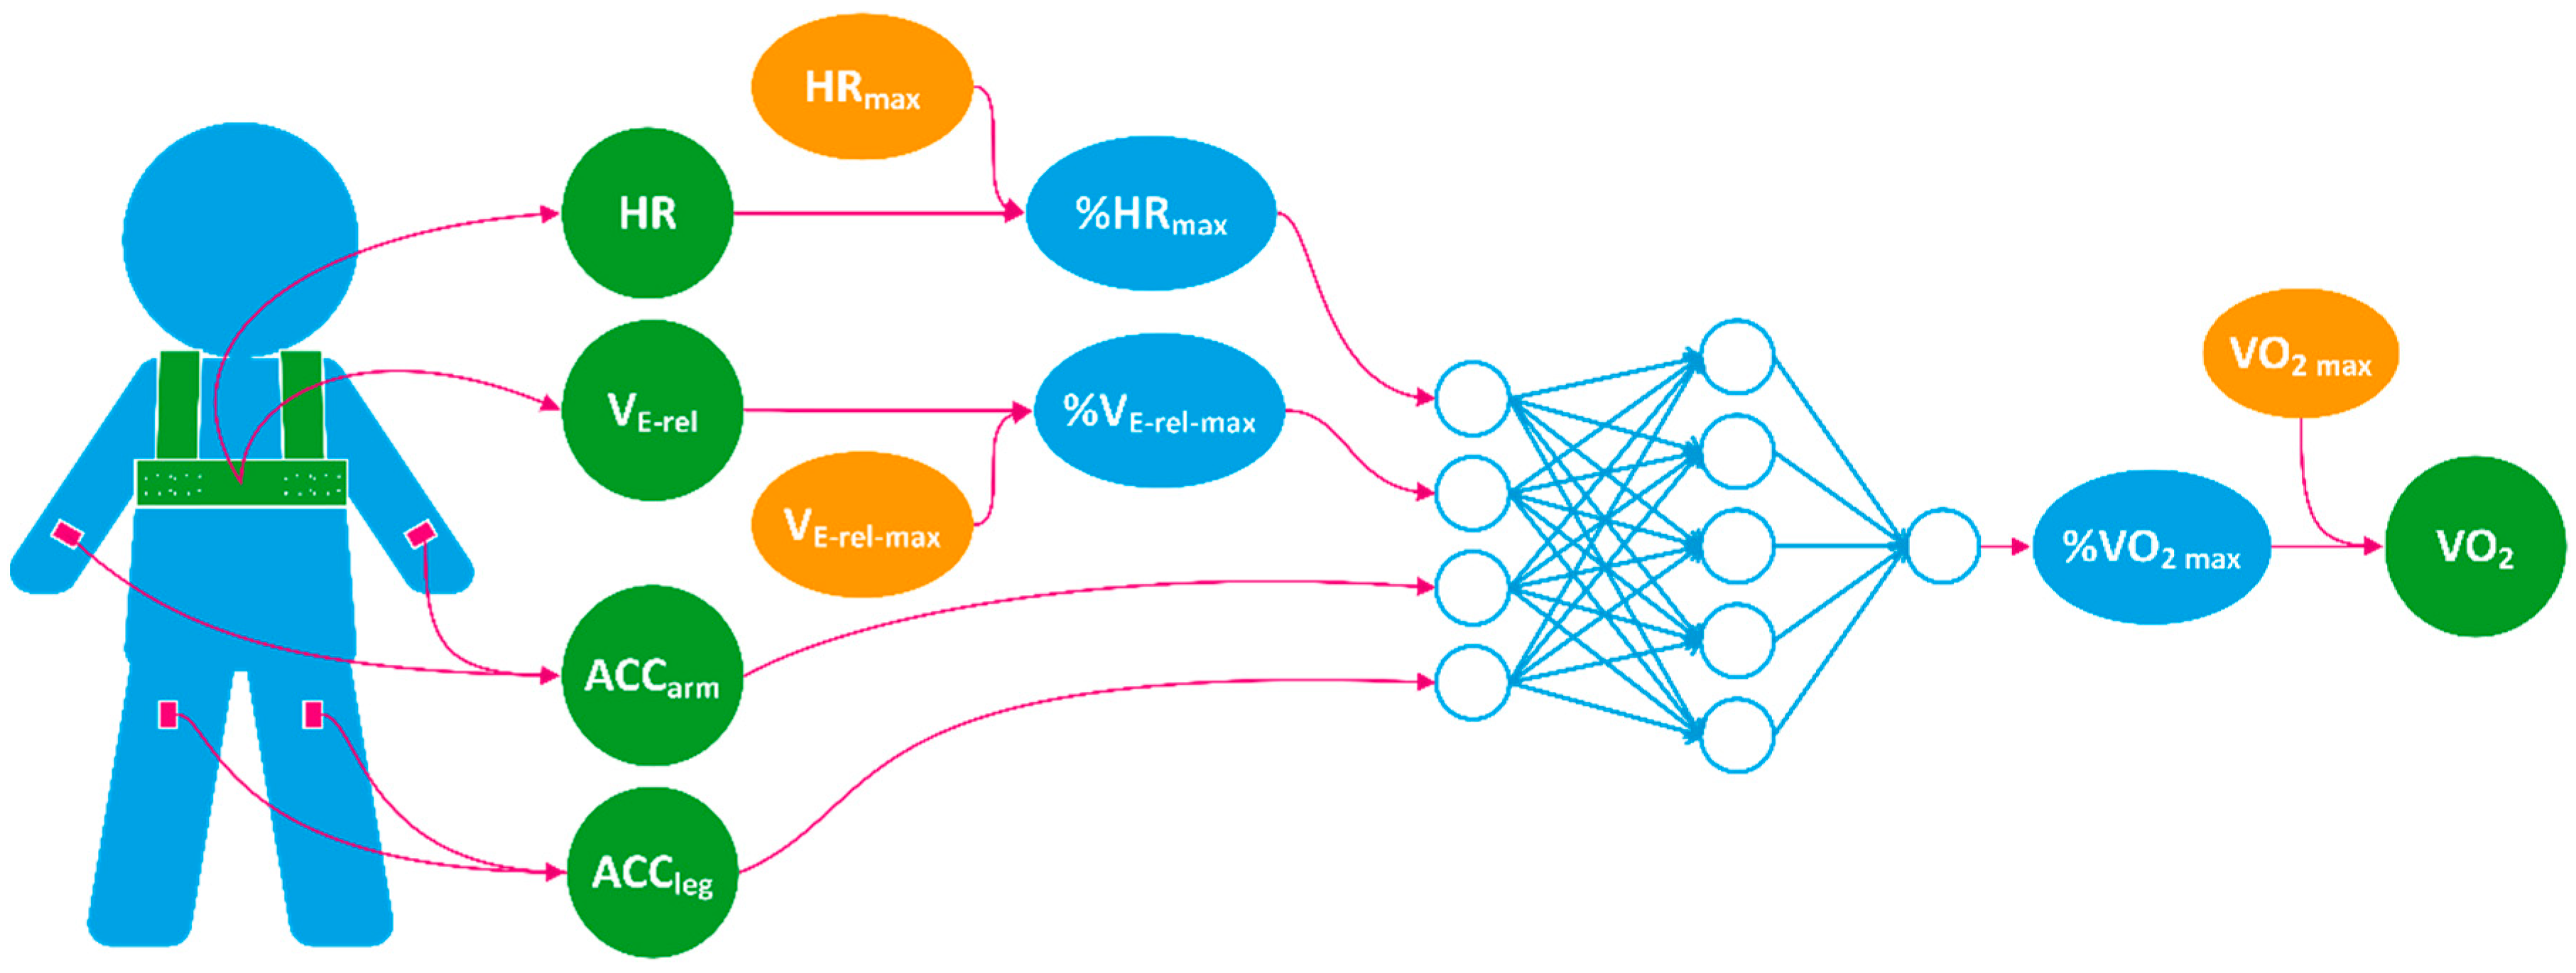
2.3. The Model for VO2 Estimation
2.4. Model Training and Cross Validation
2.5. Comparision to Published Methods
2.6. Statistics
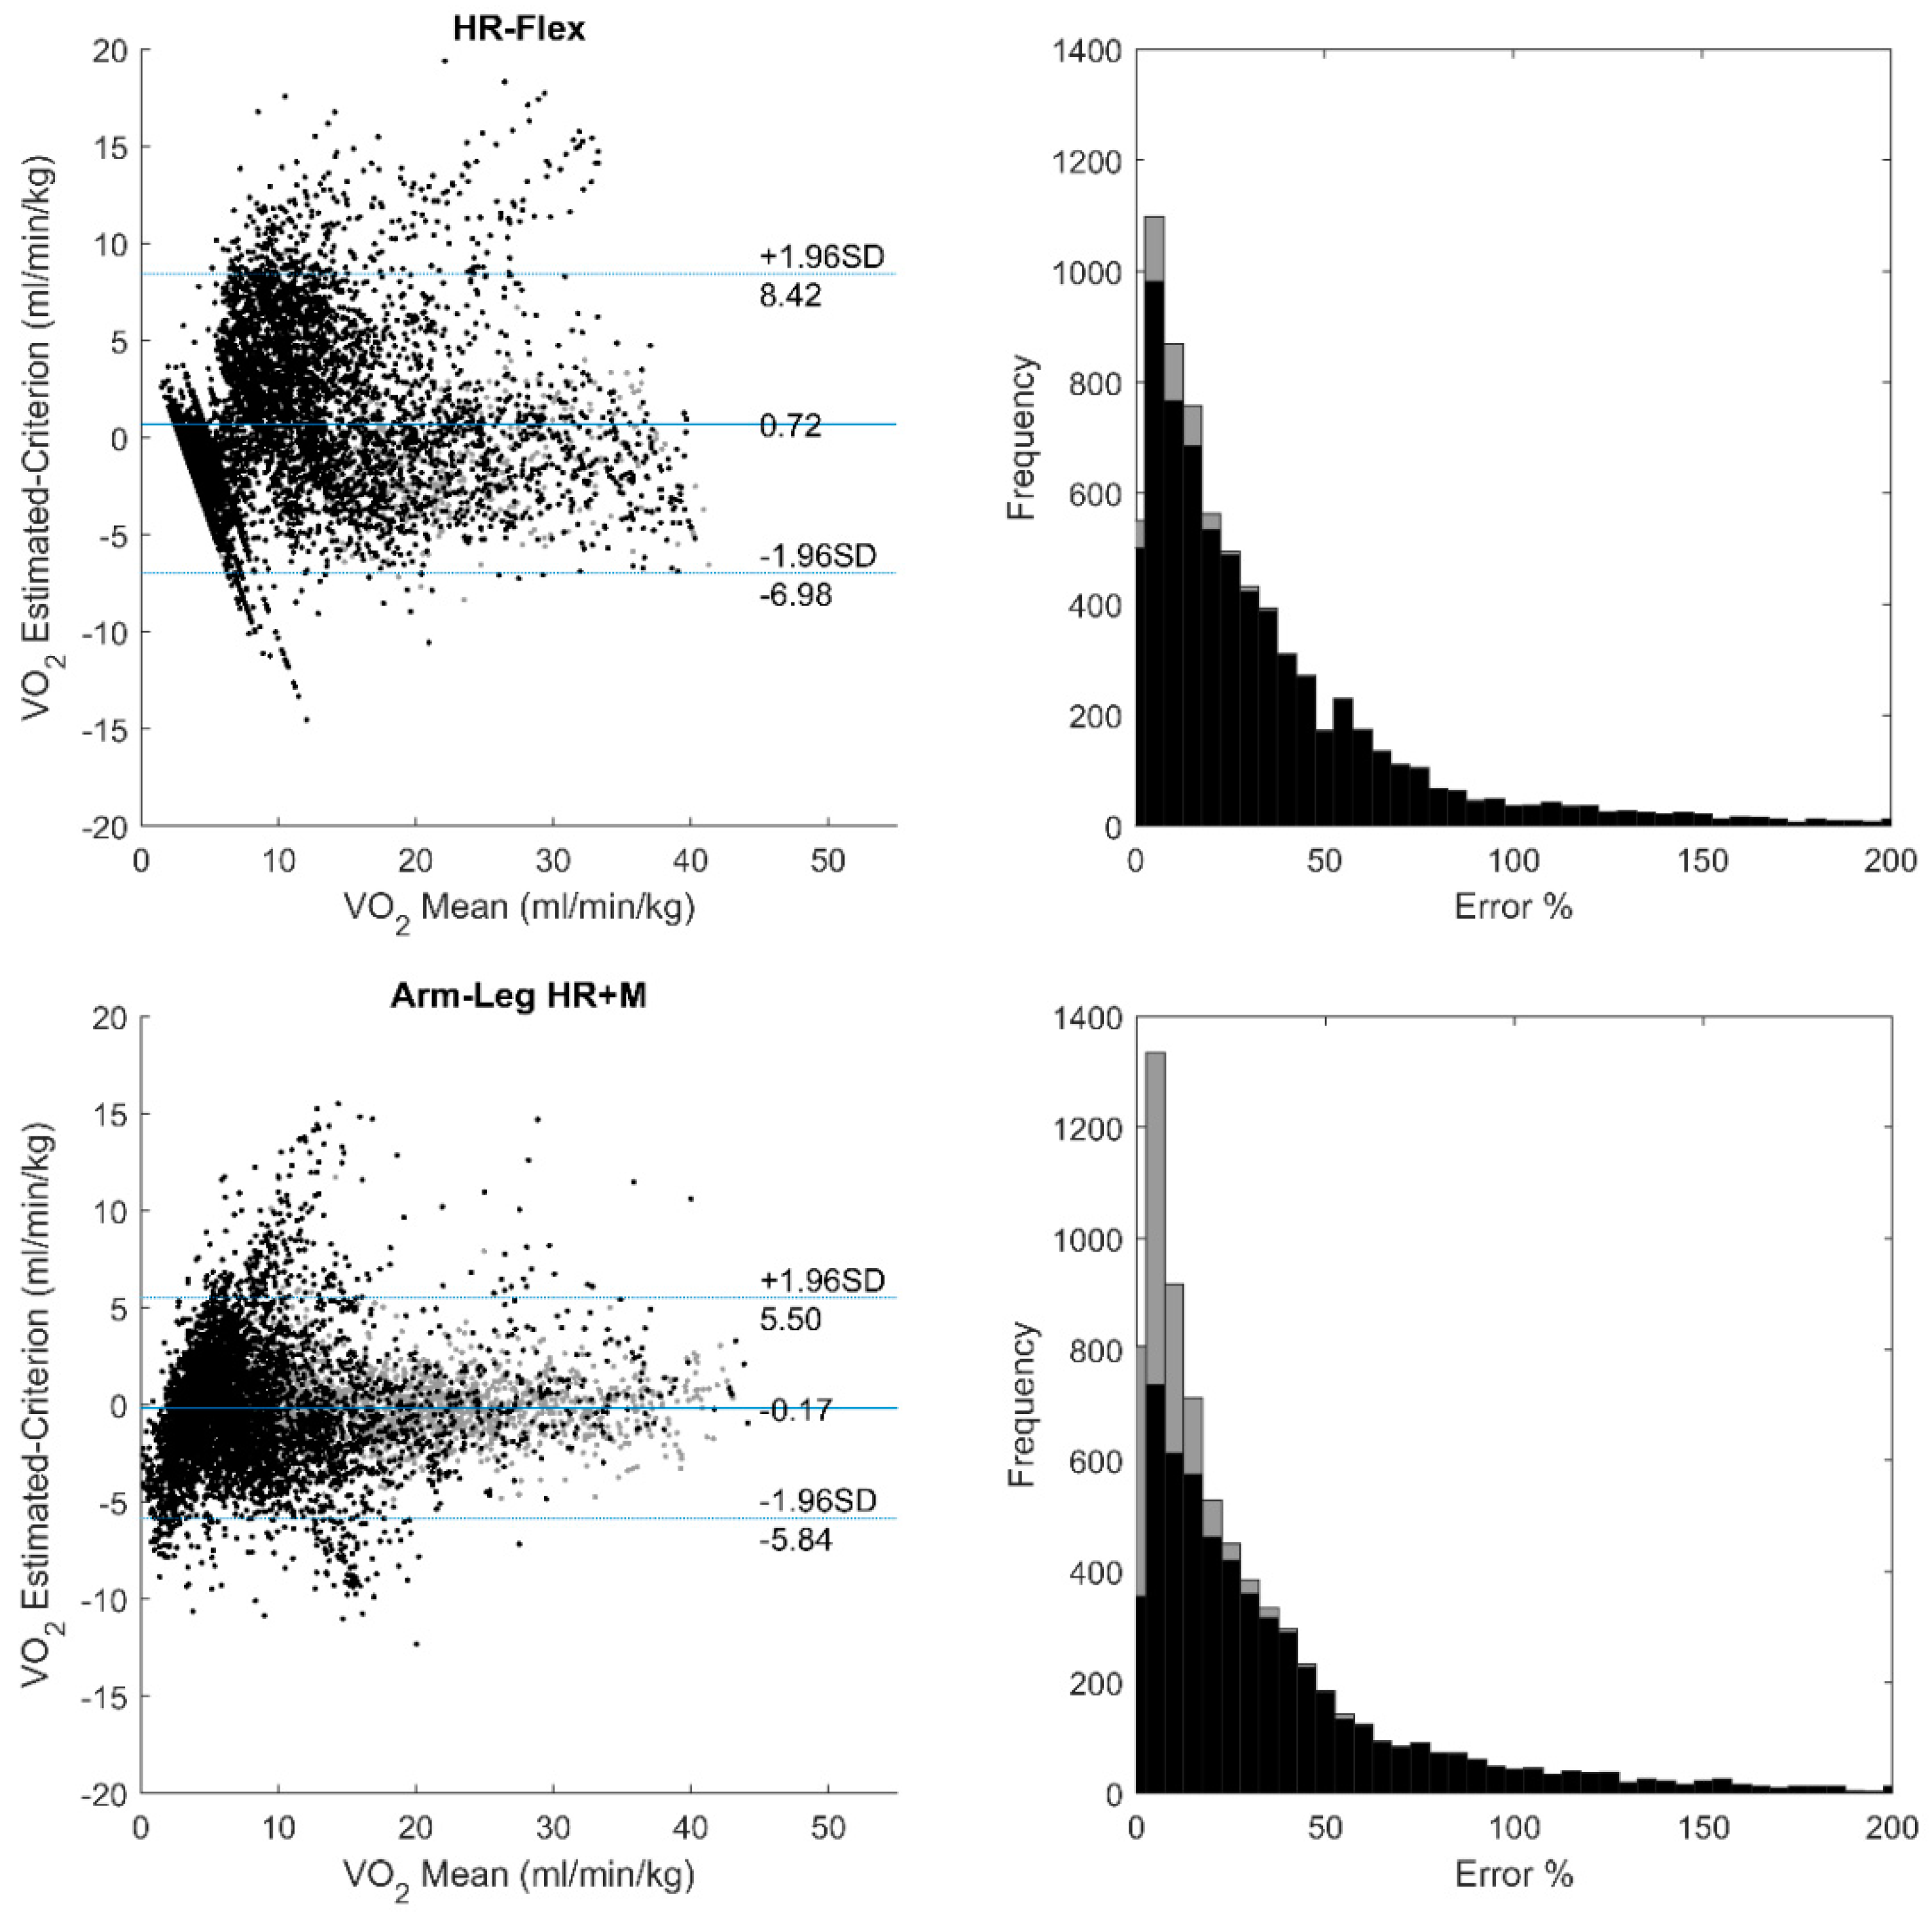
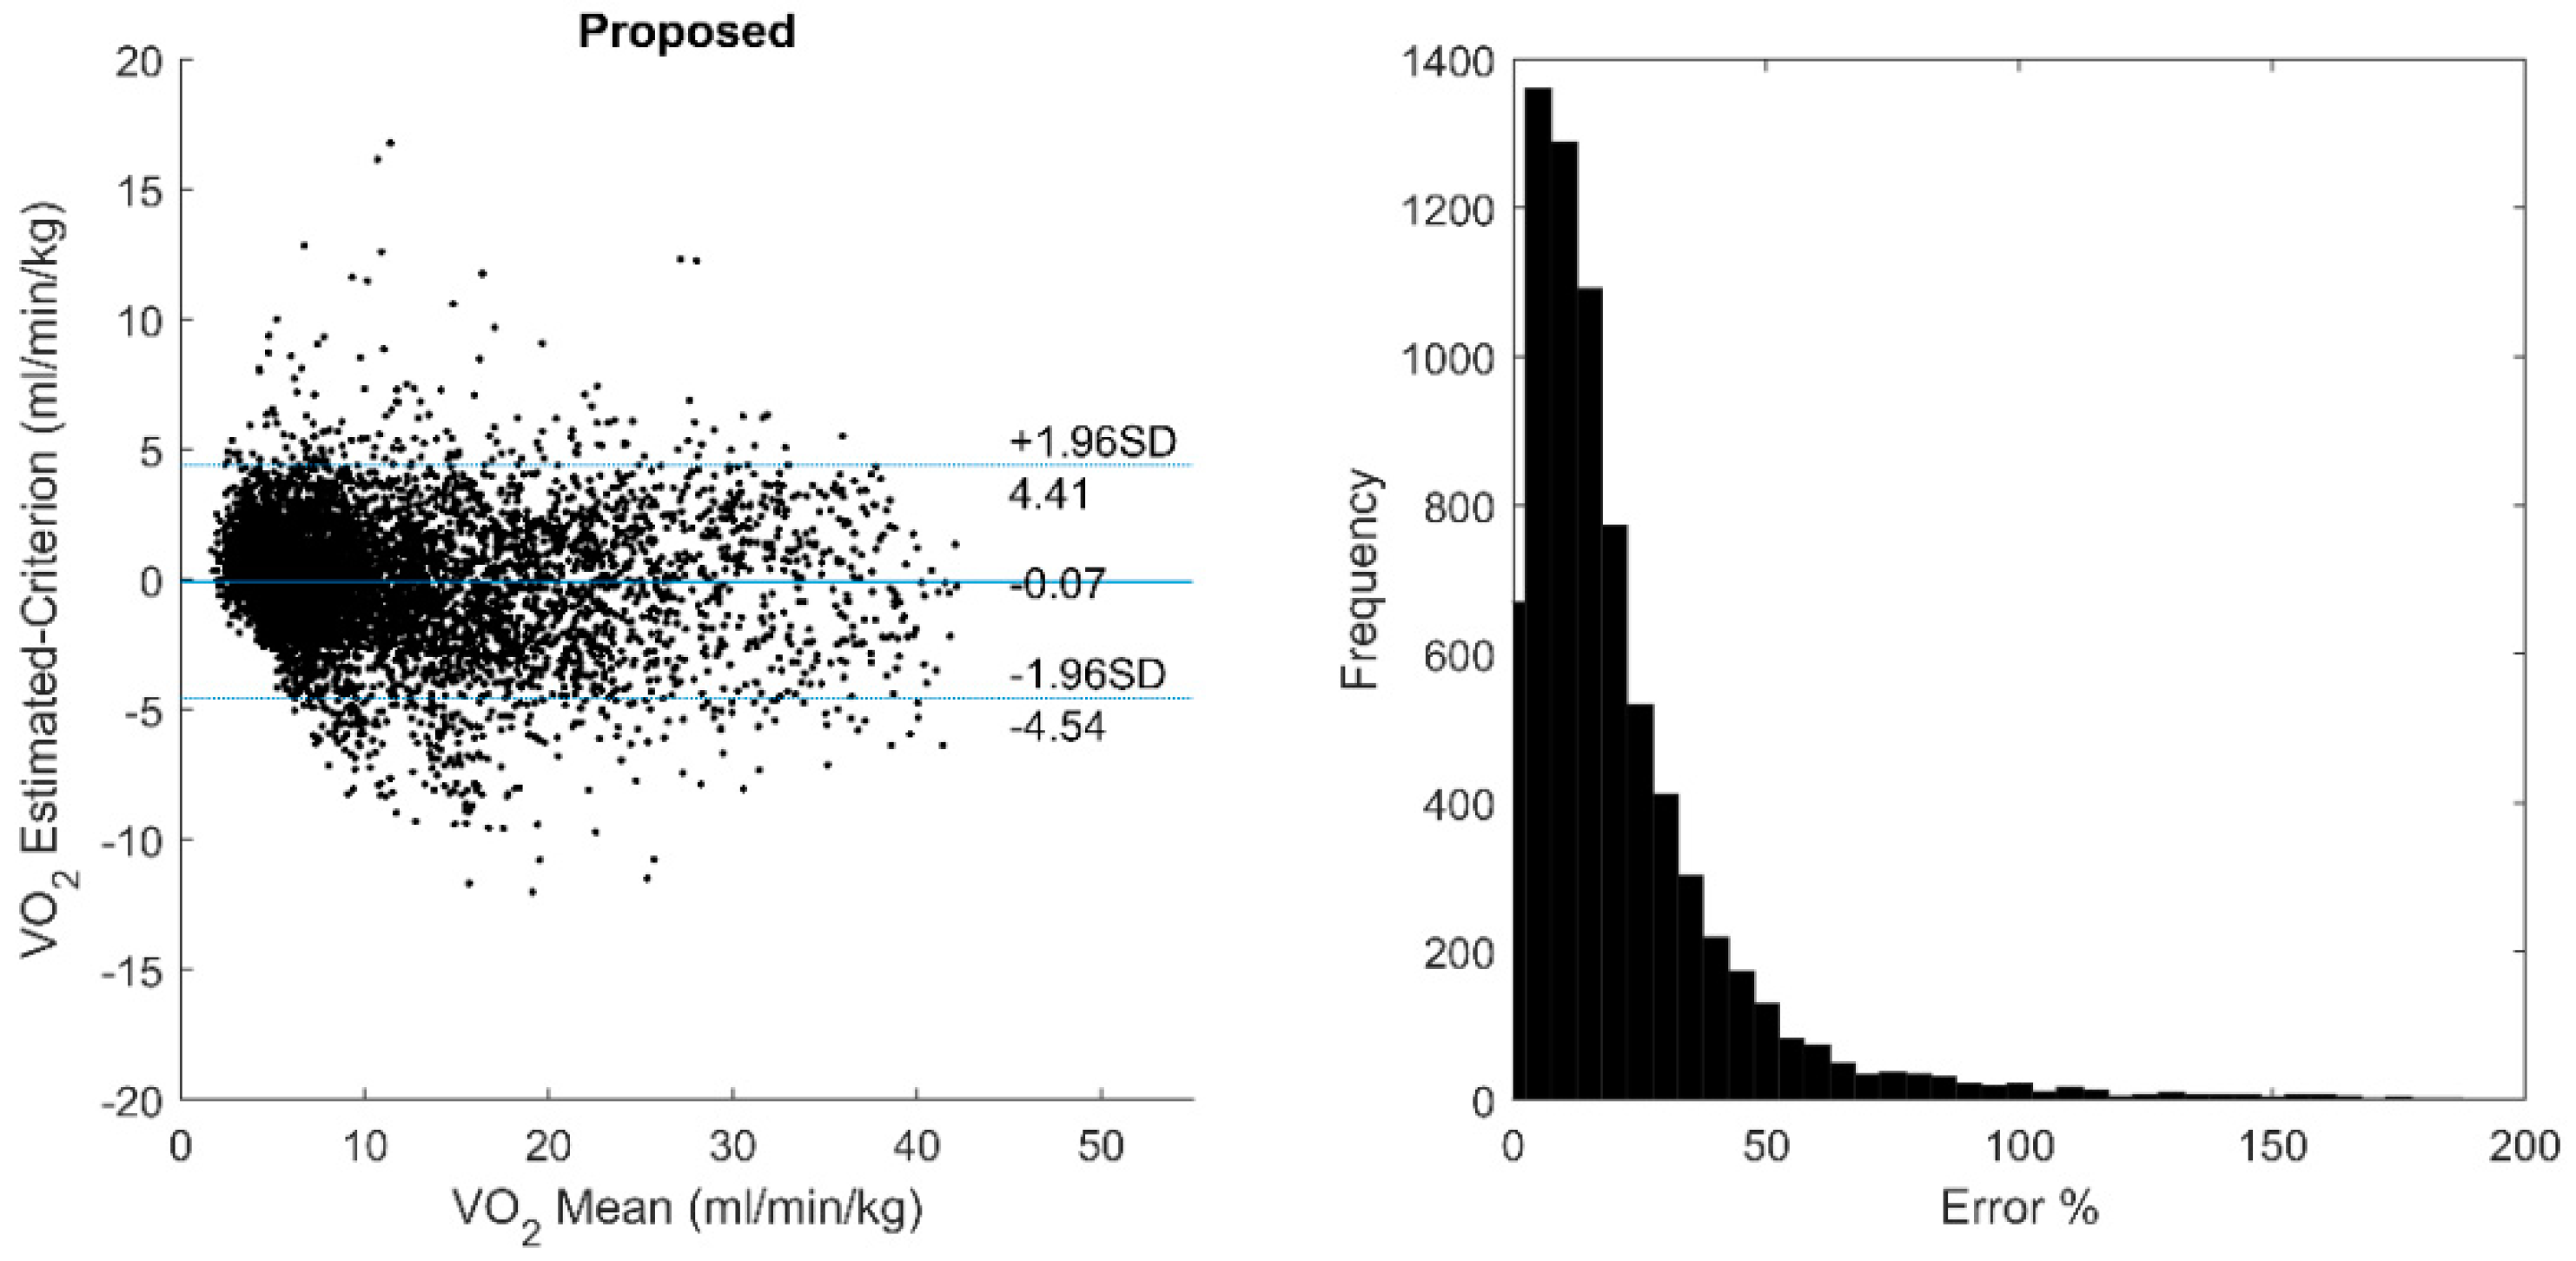
3. Results
4. Discussion and Conclusions
Author Contributions
Funding
Conflicts of Interest
References
- Wu, H.C.; Wang, M.J. Relationship between Maximum Acceptable Work Time and Physical Workload. Ergonomics 2002, 45, 280–289. [Google Scholar] [CrossRef] [PubMed]
- Colberg, S.R.; Sigal, R.J.; Yardley, J.E.; Riddell, M.C.; Dunstan, D.W.; Dempsey, P.C.; Horton, E.S.; Castorino, K.; Tate, D.F. Physical Activity/Exercise and Diabetes: A Position Statement of the American Diabetes Association. Diabetes Care 2016, 39, 2065–2079. [Google Scholar] [CrossRef] [PubMed]
- Shephard, R.J.; Aoyagi, Y. Measurement of Human Energy Expenditure, with Particular Reference to Field Studies: An Historical Perspective. Eur. J. Appl. Physiol. 2012, 112, 2785–2815. [Google Scholar] [CrossRef] [PubMed]
- Albinali, F.; Intille, S.; Haskell, W.; Rosenberger, M. Using Wearable Activity Type Detection to Improve Physical Activity Energy Expenditure Estimation. In Proceedings of the 12th ACM International Conference on Ubiquitous Computing, Copenhagen, Denmark, 26–29 September 2010. [Google Scholar]
- Altini, M.; Penders, J.; Amft, O. Energy Expenditure Estimation Using Wearable Sensors: A New Methodology for Activity-Specific Models. In Proceedings of the Conference on Wireless Health, San Diego, CA, USA, 23–25 October 2012. [Google Scholar]
- Altini, M.; Penders, J.; Vullers, R.; Amft, O. Estimating Energy Expenditure Using Body-Worn Accelerometers: A Comparison of Methods, Sensors Number and Positioning. IEEE J. Biomed. Health Inform. 2015, 19, 219–226. [Google Scholar] [CrossRef] [PubMed]
- Bonomi, A.G.; Plasqui, G.; Goris, A.H.; Westerterp, K.R. Improving Assessment of Daily Energy Expenditure by Identifying Types of Physical Activity with a Single Accelerometer. J. Appl. Physiol. 2009, 107, 655–661. [Google Scholar] [CrossRef] [PubMed]
- Bouten, C.V.; Westerterp, K.R.; Verduin, M.; Janssen, J.D. Assessment of Energy Expenditure for Physical Activity Using a Triaxial Accelerometer. Med. Sci. Sports Exerc. 1994, 23, 21–27. [Google Scholar] [CrossRef]
- Brage, S.; Brage, N.; Franks, P.W.; Ekelund, U.; Wong, M.Y.; Andersen, L.B.; Froberg, K.; Wareham, N.J. Branched Equation Modeling of Simultaneous Accelerometry and Heart Rate Monitoring Improves Estimate of Directly Measured Physical Activity Energy Expenditure. J. Appl. Physiol. 2004, 96, 343–351. [Google Scholar] [CrossRef] [PubMed]
- Brage, S.; Westgate, K.; Franks, P.W.; Stegle, O.; Wright, A.; Ekelund, U.; Wareham, N.J. Estimation of Free-Living Energy Expenditure by Heart Rate and Movement Sensing: A Doubly-Labelled Water Study. PLoS ONE 2015, 10, e0137206. [Google Scholar] [CrossRef] [PubMed]
- Crouter, S.E.; Churilla, J.R.; Bassett, D.R. Estimating Energy Expenditure Using Accelerometers. Eur. J. Appl. Physiol. 2006, 98, 601–612. [Google Scholar] [CrossRef] [PubMed]
- Ellis, K.; Kerr, J.; Godbole, S.; Lanckriet, G.; Wing, D.; Marshall, S. A Random Forest Classifier for the Prediction of Energy Expenditure and Type of Physical Activity from Wrist and Hip Accelerometers. Physiol. Meas. 2014, 35, 2191. [Google Scholar] [CrossRef] [PubMed]
- Eston, R.G.; Rowlands, A.V.; Ingledew, D.K. Validity of Heart Rate, Pedometry, and Accelerometry for Predicting the Energy Cost of Children’s Activities. J. Appl. Physiol. 1998, 84, 362–371. [Google Scholar] [CrossRef] [PubMed]
- Gastinger, S.; Donnelly, A.; Dumond, R.; Prioux, J. A Review of the Evidence for the Use of Ventilation as a Surrogate Measure of Energy Expenditure. J. Parenteral Enteral Nutr. 2014, 38, 926–938. [Google Scholar] [CrossRef] [PubMed]
- Gastinger, S.; Nicolas, G.; Sorel, A.; Sefati, H.; Prioux, J. Energy Expenditure Estimate by Heart-Rate Monitor and a Portable Electromagnetic-Coil System. Int. J. Sport Nutr. Exerc. Metab. 2012, 22, 117–130. [Google Scholar] [CrossRef] [PubMed]
- Hiilloskorpi, H.; Fogelholm, M.; Laukkanen, R.; Pasanen, M.; Oja, P.; Mänttäri, A.; Natri, A. Factors Affecting the Relation between Heart Rate and Energy Expenditure During Exercise. Int. J. Sports Med. 1999, 20, 438–443. [Google Scholar] [CrossRef]
- Jang, Y.; Jung, M.W.; Kang, J.; Kim, H.C. An Wearable Energy Expenditure Analysis System Based on the 15-Channel Whole-Body Segment Acceleration Measurement. In Proceedings of the 2005 27th Annual International Conference of the Engineering in Medicine and Biology Society, Shanghai, China, 1–4 September 2005. [Google Scholar]
- Lu, K.; Yang, L.; Abtahi, F.; Lindecrantz, K.; Rödby, K.; Seoane, F. Wearable Cardiorespiratory Monitoring System for Unobtrusive Free-Living Energy Expenditure Tracking. In Proceedings of the World Congress on Medical Physics and Biomedical Engineering 2018, Prague, Czech Republic, 3–8 June 2018. [Google Scholar]
- Li, R.; Deurenberg, P.; Hautvast, J.G. A Critical Evaluation of Heart Rate Monitoring to Assess Energy Expenditure in Individuals. Am. J. Clin. Nutr. 1993, 58, 602–607. [Google Scholar] [CrossRef] [PubMed]
- Lin, C.W.; Yang, Y.T.; Wang, J.S.; Yang, Y.C. A Wearable Sensor Module with a Neural-Network-Based Activity Classification Algorithm for Daily Energy Expenditure Estimation. IEEE Trans. Inform. Technol. Biomed. 2012, 16, 991–998. [Google Scholar]
- Livingstone, M.B. Heart-Rate Monitoring: The Answer for Assessing Energy Expenditure and Physical Activity in Population Studies? Br. J. Nutr. 1997, 78, 869–871. [Google Scholar] [CrossRef] [PubMed]
- Livingstone, M.B.; Prentice, A.M.; Coward, W.A.; Ceesay, S.M.; Strain, J.J.; McKenna, P.G.; Nevin, G.B.; Barker, M.E.; Hickey, R. Simultaneous Measurement of Free-Living Energy Expenditure by the Doubly Labeled Water Method and Heart-Rate Monitoring. Am. J. Clin. Nutr. 1990, 52, 59–65. [Google Scholar] [CrossRef] [PubMed]
- Lu, K.; Yang, L.; Abtahi, F.; Lindecrantz, K.; Rödby, K.; Seoane, F. Wearable Cardiorespiratory Monitoring System for Unobtrusive Free-Living Energy Expenditure Tracking; Springer: Singapore, 2019. [Google Scholar]
- Luke, A.; Maki, K.C.; Barkey, N.; Cooper, R.; McGEE, D.A. Simultaneous Monitoring of Heart Rate and Motion to Assess Energy Expenditure. Med. Sci. Sports Exerc. 1997, 29, 144–148. [Google Scholar] [CrossRef] [PubMed]
- Meijer, G.A.; Westerterp, K.R.; Koper, H.A. Assessment of Energy Expenditure by Recording Heart Rate and Body Acceleration. Med. Sci. Sports Exerc. 1989, 21, 343–347. [Google Scholar] [CrossRef] [PubMed]
- Montoye, H.J.; Washburn, R.I.; Servais, S.T.; Ertl, A.N.; Webster, J.G.; Nagle, F.J. Estimation of Energy Expenditure by a Portable Accelerometer. Med. Sci. Sports Exerc. 1983, 15, 403–407. [Google Scholar] [CrossRef] [PubMed]
- Murakami, H.; Kawakami, R.; Nakae, S.; Nakata, Y.; Ishikawa-Takata, K.; Tanaka, S.; Miyachi, M. Accuracy of Wearable Devices for Estimating Total Energy Expenditure: Comparison with Metabolic Chamber and Doubly Labeled Water Method. JAMA Internal Med. 2016, 176, 702–703. [Google Scholar] [CrossRef] [PubMed]
- Spurr, G.B.; Prentice, A.M.; Murgatroyd, P.R.; Goldberg, G.R.; Reina, J.C.; Christman, N.T. Energy Expenditure from Minute-by-Minute Heart-Rate Recording: Comparison with Indirect Calorimetry. Am. J. Clin. Nutr. 1988, 48, 552–559. [Google Scholar] [CrossRef] [PubMed]
- Strath, S.J.; Bassett, J.D.; Thompson, D.L.; Swartz, A.M. Validity of the Simultaneous Heart Rate-Motion Sensor Technique for Measuring Energy Expenditure. Med. Sci. Sports Exerc. 2002, 34, 888–894. [Google Scholar] [CrossRef] [PubMed]
- Swartz, A.M.; Strath, S.J.; Bassett, D.R.; O’brien, W.L.; King, G.A.; Ainsworth, B.E. Estimation of Energy Expenditure Using Csa Accelerometers at Hip and Wrist Sites. Med. Sci. Sports Exerc. 2000, 32, S450–S456. [Google Scholar] [CrossRef] [PubMed]
- Pulkkinen, A.; Kettunen, J.; Martinmäki, K.; Saalasti, S.; Rusko, H.K. On-and Off Dynamics and Respiration Rate Enhance the Accuracy of Heart Rate Based Vo2 Estimation. In Proceedings of the 51st Annual Meeting of the American College of Sports Medicine, Indianapolis, IN, USA, 2–5 June 2004. [Google Scholar]
- Pulkkinen, A.; Saalasti, S.; Rusko, H.K. Energy Expenditure Can Be Accurately Estimated from Hr without Individual Laboratory Calibration. In Proceedings of the 52nd Annual Meeting of the American College of Sports Medicine, Nashville, TN, USA, 1–4 June 2005. [Google Scholar]
- Brage, S.; Ekelund, U.; Brage, N.; Hennings, M.A.; Froberg, K.; Franks, P.W.; Wareham, N.J. Hierarchy of Individual Calibration Levels for Heart Rate and Accelerometry to Measure Physical Activity. J. Appl. Physiol. 2007, 103, 682–692. [Google Scholar] [CrossRef] [PubMed]
- Vokac, Z.H.; Bell, H.; Bautz-Holter, E.; Rodahl, K. Oxygen Uptake/Heart Rate Relationship in Leg and Arm Exercise, Sitting and Standing. J. Appl. Physiol. 1975, 39, 54–59. [Google Scholar] [CrossRef] [PubMed]
- Crouter, S.E.; Kuffel, E.; Haas, J.D.; Frongillo, E.A.; Bassett, D.R., Jr. A Refined 2-Regression Model for the Actigraph Accelerometer. Med. Sci. Sports Exerc. 2010, 42, 1029. [Google Scholar] [CrossRef] [PubMed]
- Strath, S.J.; Brage, S.Ø.; Ekelund, U. Integration of Physiological and Accelerometer Data to Improve Physical Activity Assessment. Med. Sci. Sports Exerc. 2005, 37, S563–S571. [Google Scholar] [CrossRef] [PubMed]
- Gilgen-Ammann, R.; Koller, M.; Huber, C.; Ahola, R.; Korhonen, T.; Wyss, T. Energy Expenditure Estimation from Respiration Variables. Sci. Rep. 2017, 7, 15995. [Google Scholar] [CrossRef] [PubMed]
- Gastinger, S.; Sorel, A.; Nicolas, G.; Gratas-Delamarche, A.; Prioux, J. A Comparison between Ventilation and Heart Rate as Indicator of Oxygen Uptake During Different Intensities of Exercise. J. Sports Sci. Med. 2010, 9, 110–118. [Google Scholar] [PubMed]
- Loriga, G.; Taccini, N.; de Rossi, D.; Paradiso, R. Textile Sensing Interfaces for Cardiopulmonary Signs Monitoring. In Proceedings of the 27th Annual International Conference of the Engineering in Medicine and Biology Society, New York, NY, USA, 31 August–3 September 2006. [Google Scholar]
- Seoane, F.; Ferreira, J.; Alvarez, L.; Buendia, R.; Ayllón, D.; Llerena, C.; Gil-Pita, R. Sensorized Garments and Textrode-Enabled Measurement Instrumentation for Ambulatory Assessment of the Autonomic Nervous System Response in the Atrec Project. Sensors 2013, 13, 8997–9015. [Google Scholar] [CrossRef] [PubMed]
- De Rossi, D.; Carpi, F.; Lorussi, F.; Mazzoldi, A.; Paradiso, R.; Scilingo, E.P.; Tognetti, A. Electroactive Fabrics and Wearable Biomonitoring Devices. AUTEX Res. J. 2003, 3, 180–185. [Google Scholar]
- Lanatà, A.; Scilingo, E.P.; Nardini, E.; Loriga, G.; Paradiso, R.; De-Rossi, D. Comparative Evaluation of Susceptibility to Motion Artifact in Different Wearable Systems for Monitoring Respiratory Rate. IEEE Trans. Inform. Technol. Biomed. 2010, 14, 378–386. [Google Scholar] [CrossRef] [PubMed]
- Młyńczak, M.C.; Niewiadomski, W.; Żyliński, M.; Cybulski, G.P. Ambulatory Impedance Pneumography Device for Quantitative Monitoring of Volumetric Parameters in Respiratory and Cardiac Applications. In Proceedings of the Computing in Cardiology Conference (CinC), Cambridge, MA, USA, 7–10 September 2014. [Google Scholar]
- Abtahi, F.; Yang, L.; Lindecrantz, K.; Seoane, F.; Diaz-Olivazrez, J.A.; Ke, L.; Eklund, J.; Teriö, H.; Mediavilla Martinez, C.; Tiemann, C. Big Data & Wearable Sensors Ensuring Safety and Health@ Work. In Proceedings of the GLOBAL HEALTH 2017, The Sixth International Conference on Global Health Challenges, Barcelona, Spain, 12–16 November 2017. [Google Scholar]
- Yang, L.; Lu, K.; Diaz-Olivares, J.A.; Seoane, F.; Lindecrantz, K.; Forsman, M.; Abtahi, F.; Eklund, J.A. Towards Smart Work Clothing for Automatic Risk Assessment of Physical Workload. IEEE Access 2018, 6, 40059–40072. [Google Scholar] [CrossRef]
- Mohino-Herranz, I.; Gil-Pita, R.; Ferreira, J.; Rosa-Zurera, M.; Seoane, F. Assessment of Mental, Emotional and Physical Stress through Analysis of Physiological Signals Using Smartphones. Sensors 2015, 15, 25607–25627. [Google Scholar] [CrossRef] [PubMed]
- Sykes, K.; Roberts, A. The Chester Step Test—A Simple yet Effective Tool for the Prediction of Aerobic Capacity. Physiotherapy 2004, 90, 183–188. [Google Scholar] [CrossRef]
- Yang, L.; Lu, K.; Forsman, M.; Lindecrantz, K.; Seoane, F.; Ekblom, Ö.; Eklund, J. Development of Smart Wearable Systems for Physiological Workload Assessment Using Heart Rate and Accelerometry. Unpublished work. 2018. [Google Scholar]
- Seppa, V.P.; Viik, J.; Hyttinen, J. Assessment of Pulmonary Flow Using Impedance Pneumography. IEEE Trans. Biomed. Eng. 2010, 57, 2277–2285. [Google Scholar] [CrossRef] [PubMed]
- Seppä, V.P.; Hyttinen, J.; Uitto, M.; Chrapek, W.; Viik, J. Novel Electrode Configuration for Highly Linear Impedance Pneumography. Biomed. Eng. 2013, 58, 35–38. [Google Scholar] [CrossRef] [PubMed]


| Men (N = 9) | Women (N = 2) | All (N = 11) | |
|---|---|---|---|
| Age (year) | 27 [21–65] | 43 [25–61] | 27 [21–65] |
| Height (cm) | 181 [171–199] | 169 [165–173] | 177 [165–199] |
| Weight (kg) | 77 [51–89] | 60 [58–62] | 75 [51–89] |
| BMI (kg/m2) | 22.8 [17.4–25.6] | 20.9 [20.7–21.2] | 22.6 [17.4–25.6] |
| VO2 max (mL/min/kg) | 42.9 [32.1–54.6] | 35.6 [30.9–40.3] | 40.3 [30.9–54.6] |
| Input Features | % HRmax | HR normalized by age predicted HRmax |
| % VE-rel max | VE-rel normalized by estimated VE-rel max | |
| ACCarm | Mean absolute value of wrist acceleration | |
| ACCleg | Mean absolute value of thigh acceleration | |
| Output | % VO2 max | VO2 normalized by estimated VO2 max |
| Methods | Input Data | Additional Individualized Measurements |
|---|---|---|
| Flex-HR | HR | Flex HR Point REE HR-VO2 Calibration |
| Arm-Leg HR+M | HR, ACCleg, ACCarm | REE Leg HR-VO2 Calibration Arm HR-VO2 Calibration |
| Proposed | HR, ACCleg, ACCarm, VE-rel | VO2 max |
| Group | Task | VO2 Level (Mean ± SD) |
|---|---|---|
| Resting | Lying | 3.78 ± 0.96 |
| Sitting | 3.82 ± 1.16 | |
| Standing | 4.01 ± 0.41 | |
| Work Tasks | Office Work | 4.01 ± 1.42 |
| Painting Work | 8.51 ± 1.68 | |
| Postal Delivery Work | 14.04 ± 2.37 | |
| Meat Cutting Work | 7.62 ± 1.89 | |
| Construction Work | 12.24 ± 4.56 | |
| Submaximal Tests | Step Test | 22.23 ± 7.71 |
| Treadmill Test | 22.88 ± 8.05 | |
| Arm Ergometer Test | 11.06 ± 4.98 |
| Gender | Age (Year) | Weight (kg) | Height (cm) | BMI (kg/m2) | VO2 max (mL/kg/min) | %VO2 max | |||||
|---|---|---|---|---|---|---|---|---|---|---|---|
| Train | Test 1 | ||||||||||
| Bias | RMSE | R2 | Bias | RMSE | R2 | ||||||
| M | 65 | 80 | 188 | 22.6 | 32.7 | −0.03 | 5.26 | 0.92 | −2.03 | 5.74 | 0.88 |
| M | 21 | 77 | 176.5 | 24.7 | 54.6 | 0.07 | 5.54 | 0.90 | −0.35 | 5.40 | 0.92 |
| F | 61 | 62 | 173 | 20.7 | 30.9 | 0.10 | 5.06 | 0.92 | −1.19 | 8.03 | 0.84 |
| F | 25 | 58 | 165.5 | 21.2 | 40.3 | −0.01 | 5.39 | 0.91 | 0.11 | 4.55 | 0.93 |
| M | 27 | 88.5 | 199 | 22.3 | 47.8 | 0.04 | 5.33 | 0.91 | 0.18 | 4.69 | 0.94 |
| M | 27 | 51 | 171 | 17.4 | 39.6 | 0.14 | 5.21 | 0.92 | −0.36 | 6.61 | 0.87 |
| M | 25 | 79.8 | 176.5 | 25.6 | 43.6 | 0.05 | 5.35 | 0.91 | 1.84 | 4.60 | 0.93 |
| M | 29 | 88.9 | 190 | 24.6 | 42.9 | −0.03 | 5.54 | 0.91 | −0.51 | 4.07 | 0.95 |
| M | 42 | 75 | 177 | 23.9 | 32.1 | 0.03 | 5.26 | 0.92 | 2.71 | 5.93 | 0.88 |
| M | 26 | 75 | 181.5 | 22.8 | 37.2 | 0.06 | 5.28 | 0.91 | −0.68 | 4.86 | 0.92 |
| M | 26 | 68.5 | 184 | 20.2 | 44.8 | 0.08 | 5.30 | 0.91 | −1.47 | 5.76 | 0.90 |
| Average Mean (SD) | −0.16 (1.38) | 5.47 (1.13) | 0.91 (0.03) | ||||||||
| Methods | Individual Bias 1 | Group Bias | MAE | RMSE | R2 |
|---|---|---|---|---|---|
| Flex-HR | 1.11 | 0.69 | 2.83 | 4.00 | 0.75 |
| Arm-Leg HR+M | 0.60 | −0.09 | 2.12 | 2.95 | 0.86 |
| Proposed | 0.42 | −0.07 | 1.65 | 2.28 | 0.92 |
| Resting | Office Work | Painting | Postal Delivery | Meat Cutting | Construction Work | Step | Treadmill | Arm Ergometer | |
|---|---|---|---|---|---|---|---|---|---|
| Flex-HR | |||||||||
| Bias | −0.05 | −0.29 | −0.47 | −2.42 | 1.84 | 1.05 | −1.05 1 | −0.81 | 4.18 |
| RMSE | 0.90 | 0.84 | 3.89 | 4.15 | 4.33 | 3.90 | 2.851 | 2.92 | 5.91 |
| Arm-Leg HR+M | |||||||||
| Bias | −1.42 | −0.93 | −1.90 | −1.59 | −0.16 | −1.09 | −0.38 | −0.01 2 | 0.00 2 |
| RMSE | 2.50 | 2.09 | 2.55 | 2.57 | 1.56 | 4.44 | 2.53 | 1.82 2 | 1.14 2 |
| Proposed | |||||||||
| Bias | 0.02 | 0.17 | −0.47 | −0.46 | 0.55 | −2.01 | −1.08 3 | 0.44 | 0.06 |
| RMSE | 0.93 | 0.86 | 1.69 | 2.36 | 1.62 | 3.88 | 2.83 3 | 2.71 | 1.69 |
© 2018 by the authors. Licensee MDPI, Basel, Switzerland. This article is an open access article distributed under the terms and conditions of the Creative Commons Attribution (CC BY) license (http://creativecommons.org/licenses/by/4.0/).
Share and Cite
Lu, K.; Yang, L.; Seoane, F.; Abtahi, F.; Forsman, M.; Lindecrantz, K. Fusion of Heart Rate, Respiration and Motion Measurements from a Wearable Sensor System to Enhance Energy Expenditure Estimation. Sensors 2018, 18, 3092. https://doi.org/10.3390/s18093092
Lu K, Yang L, Seoane F, Abtahi F, Forsman M, Lindecrantz K. Fusion of Heart Rate, Respiration and Motion Measurements from a Wearable Sensor System to Enhance Energy Expenditure Estimation. Sensors. 2018; 18(9):3092. https://doi.org/10.3390/s18093092
Chicago/Turabian StyleLu, Ke, Liyun Yang, Fernando Seoane, Farhad Abtahi, Mikael Forsman, and Kaj Lindecrantz. 2018. "Fusion of Heart Rate, Respiration and Motion Measurements from a Wearable Sensor System to Enhance Energy Expenditure Estimation" Sensors 18, no. 9: 3092. https://doi.org/10.3390/s18093092
APA StyleLu, K., Yang, L., Seoane, F., Abtahi, F., Forsman, M., & Lindecrantz, K. (2018). Fusion of Heart Rate, Respiration and Motion Measurements from a Wearable Sensor System to Enhance Energy Expenditure Estimation. Sensors, 18(9), 3092. https://doi.org/10.3390/s18093092