Article

Experimental Study on Residual Bending Strength of Corroded Reinforced Concrete Beam Based on Micromagnetic Sensor

1
College of Civil Engineering, Chongqing Jiaotong University, Chongqing 400074, China
2
Yunnan Wuyi Expressway Construction Command, Kunming 650000, China
3
Chongqing Yapai Bridge Engineering Quality Inspection Co., Ltd., Chongqing 401120, China
*
Author to whom correspondence should be addressed.
Sensors 2018, 18(8), 2635; https://doi.org/10.3390/s18082635
Submission received: 3 July 2018 / Revised: 8 August 2018 / Accepted: 9 August 2018 / Published: 11 August 2018
(This article belongs to the Special Issue Magnetic Sensors)

Abstract

:
This paper presents a nondestructive test method to evaluate the residual bending strength of corroded reinforced concrete beam by analyzing the self-magnetic flux leakage (SMFL) signals. The automatic scanning device was equipped with a micromagnetic sensor and sensor-based experimental details were introduced. Next, the theoretical formula of the normal component HS(z) of the SMFL signal that originated from the corroded region was derived based on the magnetic dipole model and the experimental results were discussed. The results indicate that the experimental data of HS(z) are consistent with the theoretical calculations, both location and extent of the steel bars corrosion can be qualitatively determined by using HS(z). The gradient K of HS(z) is approximately linearly related to the loss rate, S, of the bending strength, which can be used to evaluate the residual bending strength of the corroded reinforced concrete beam. This work lays the foundation for evaluating the residual bending strength of corroded reinforced concrete beams using the SMFL signal; the micromagnetic sensor is further applied to the civil engineering.

1. Introduction

Reinforced concrete structures are widely used in civil engineering due to their high bearing capacity, low cost, and easy construction. However, long-term exposure to the external aggressive environment, means that the reinforcement steel bars of the reinforced concrete structure will be corroded inevitably. The steel corrosion will lead to reduction of the steel bar cross-section, failure of the bond between the steel bar and the concrete, and deterioration of the concrete, which will ultimately weaken the bearing capacity and durability of the reinforced concrete structure [1,2,3]. Therefore, the measurement of corroded steel bar is crucial to determine the bearing capacity and durability of the reinforced concrete structures.
In the past, traditional electrochemical methods were used to measure corrosion of steel bars, but there are many limitations with these methods. In recent years, smart sensor-based methods that are useful to measure different defects (corrosion, cracks, etc.) of ferromagnetic materials (steel bars, etc.) and other materials have become increasingly popular, such as fiber optic coil winding [4], fiber Bragg grating [5,6], laser scanning technology [7], line scanning thermography (LST) [8,9], inductive thermography [10,11], optical excitation thermography [12], and other thermographic methods [13] such as acoustic emission and ultrasound testing using traditional and novel transducers [14,15]. Especially, the electromagnetic nondestructive test (NDT) including magnetic flux leakage (MFL) [16], metal magnetic memory (MMM) [17], magnetic acoustic emission (MAE) [18], magnetic Barkhausen noise (MBN) [19], and self-magnetic flux leakage (SMFL) [20] are widely used to measure corrosion and defects of ferromagnetic materials.
Based on the magnetic mechanical effect in the weak magnetic field, factors such as stress and defects within the ferromagnetic material will cause SMFL on its surface by orienting the magnetic domains, dislocating the lattices, and distorting the magnetic field lines [20,21]. Steel bars are a typical kind of ferromagnetic material; the corrosion of steel bars will reduce the bearing capacity and change the SMFL signals of the reinforced concrete structure at the same time. Based on this unified change, the relationship between the bearing capacity and the SMFL signals of corroded reinforced concrete structure can be established. Compared with MFL, SMFL has the advantages of rapid, effective, and simpler operation without any external excitation magnetic field required [22]. Liu [23,24,25] established a full electronic potential magneto-mechanical model of the ferromagnetic material and explored the relationship between magnetic memory signal and the stress concentration defects. Zhang [26,27] studied the relationship between the SMFL signals and the corrosion extent of corroded reinforced concrete. Zhang [28] investigated the fundamental relationship between corrosion rate and magnetic induction surrounding steel reinforcement. N. Polydorides [29] realized the magnetic induction tomography scanning of corroded reinforced concrete columns. Sun [30] had quantitatively studied the magnetic anomalies of reinforcement rods in bored in situ concrete piles for the first time and summarized their magnetic anomaly character. A. Orbe [31] proposed a magnetic scanning methodology to infer, nondestructively, the spatial dispersion of mechanical properties throughout the steel fiber reinforced concrete (SFRC) structure. H.-J Krause [32] developed a four-channel SQUID system based on magnetometers for detection of tendon ruptures in prestressed members of bridges. B.T. Fernandes [33] described a method of extracting positional information from images of steel bars embedded in concrete using a set of image preprocessing algorithms combined with a modified Hough transform. Chen [34] studied the corrosion of steel bars in reinforced concrete columns based on MFL. However, experimental study of the relationship between the bending strength and SMFL signals of corroded reinforced concrete beam is rarely reported.
In this paper, by detecting and analyzing the bending strength and SMFL signals of the corroded reinforced concrete beam, not only the location and extent of corrosion can be determined, but also the relationship between the bending strength and the SMFL signals. It will provide a rapid, effective, and simpler operation NDT method for the bending strength of corroded reinforced concrete beams.

2. Experimental Details and Theoretical Background

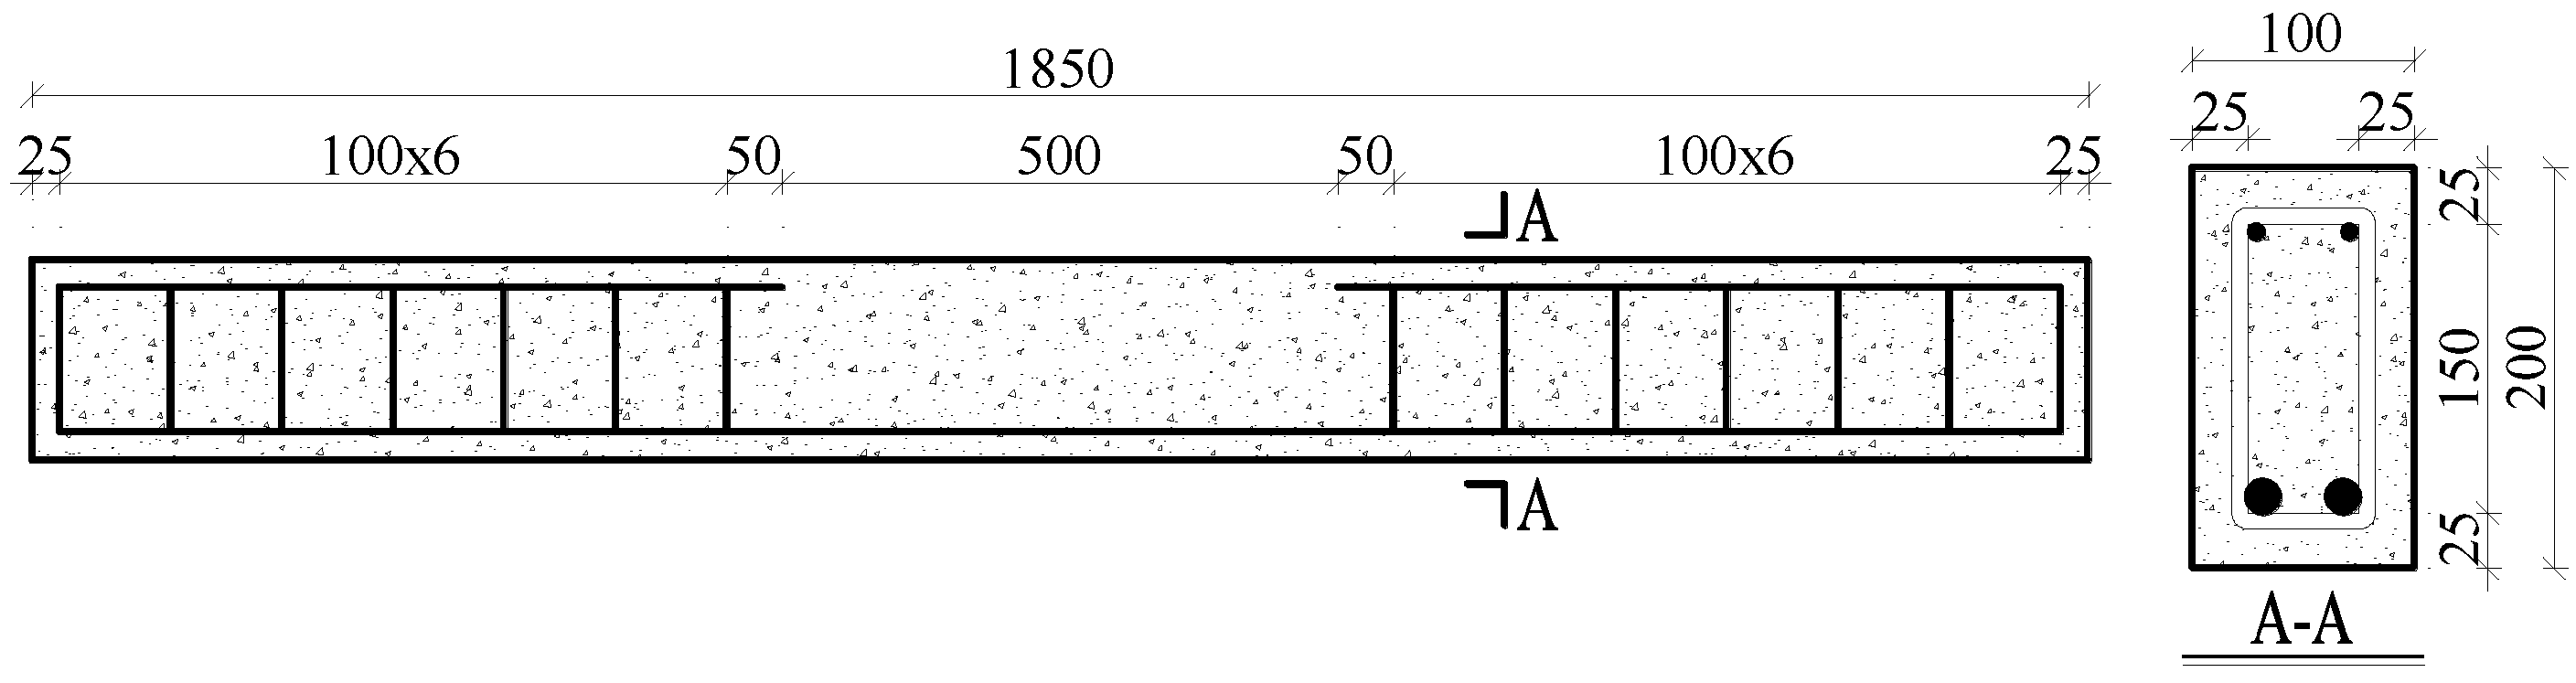
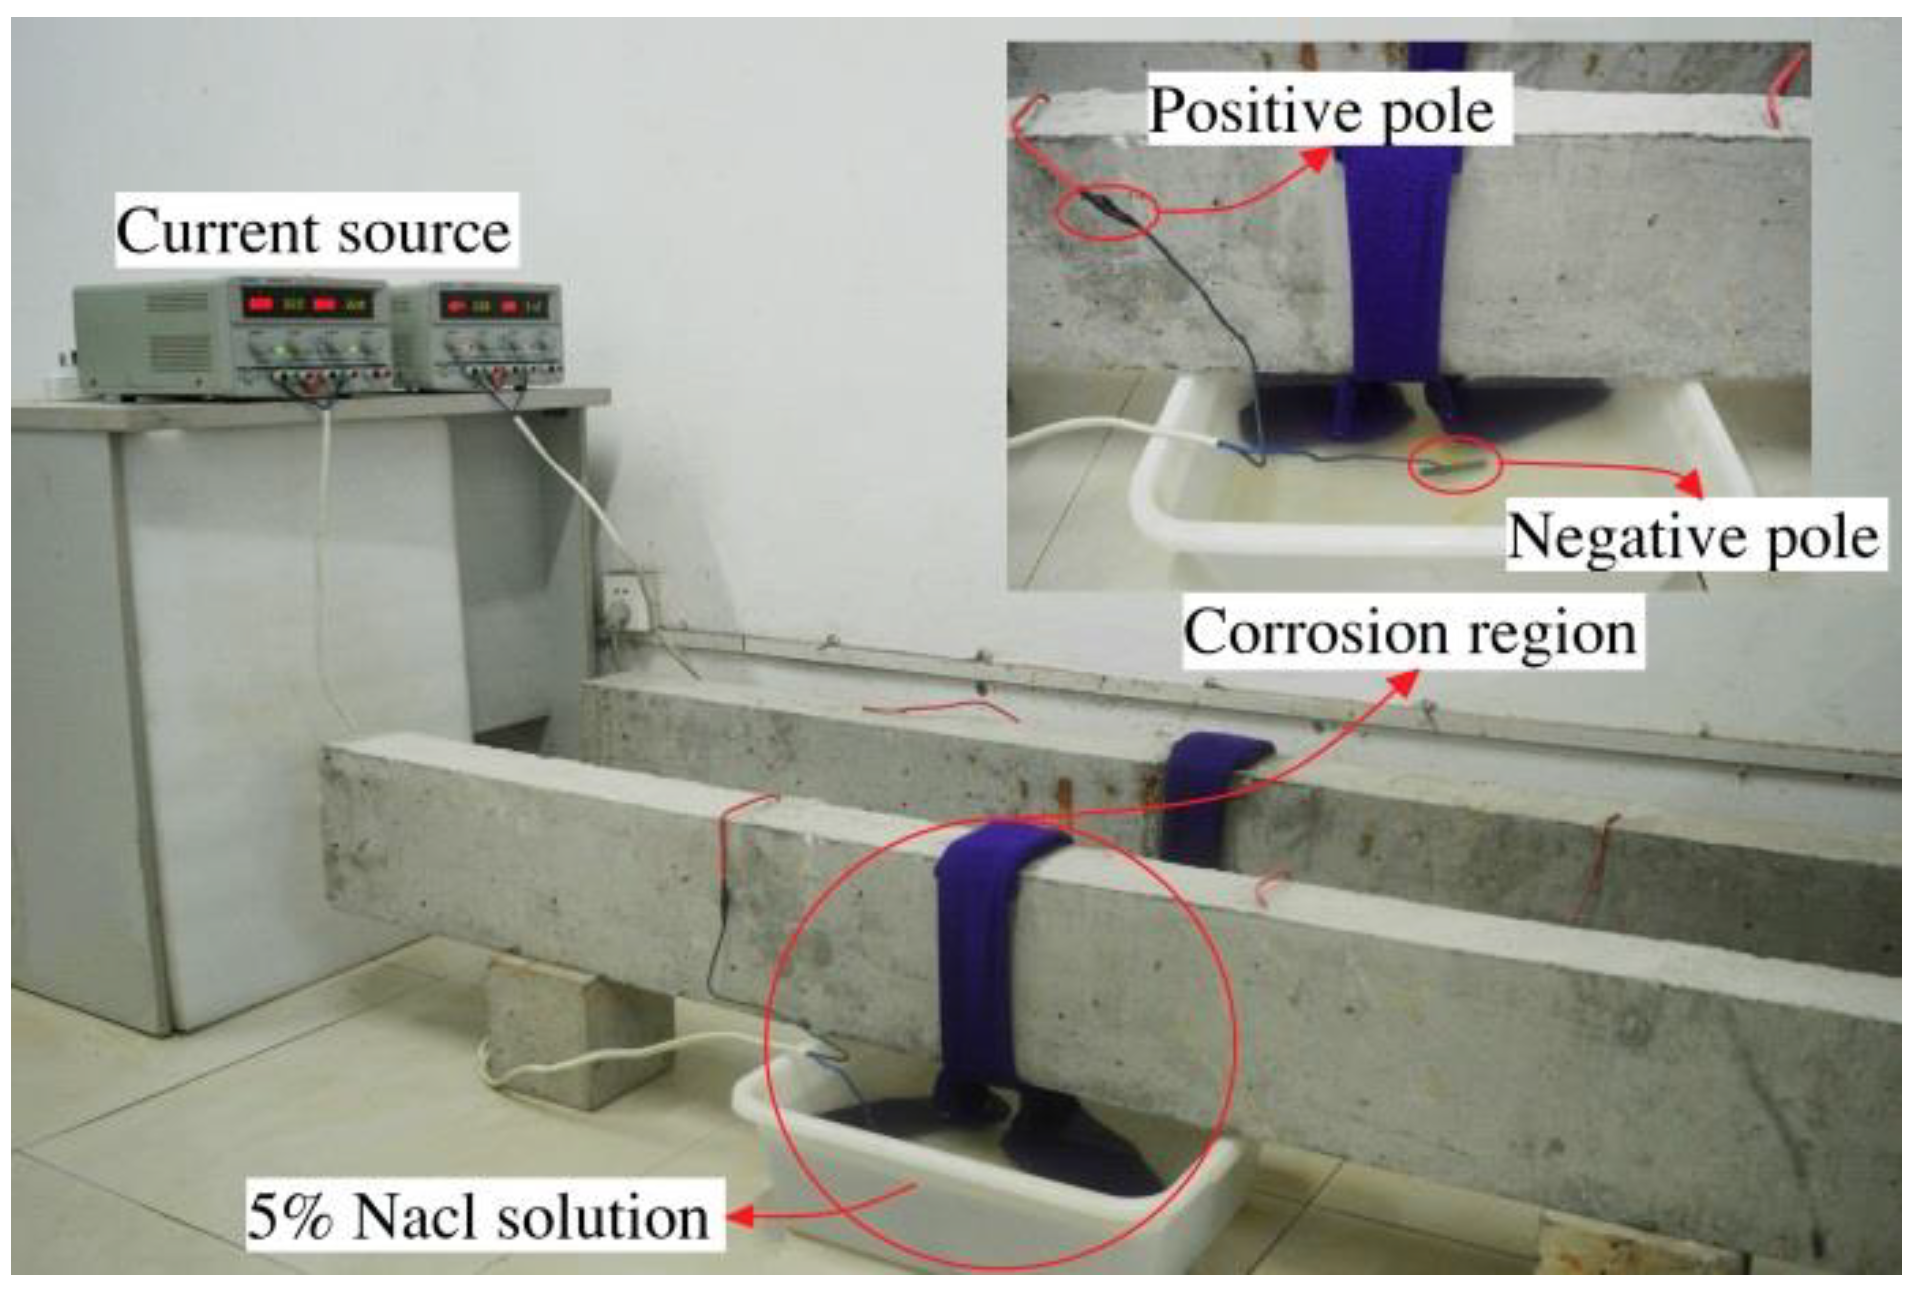
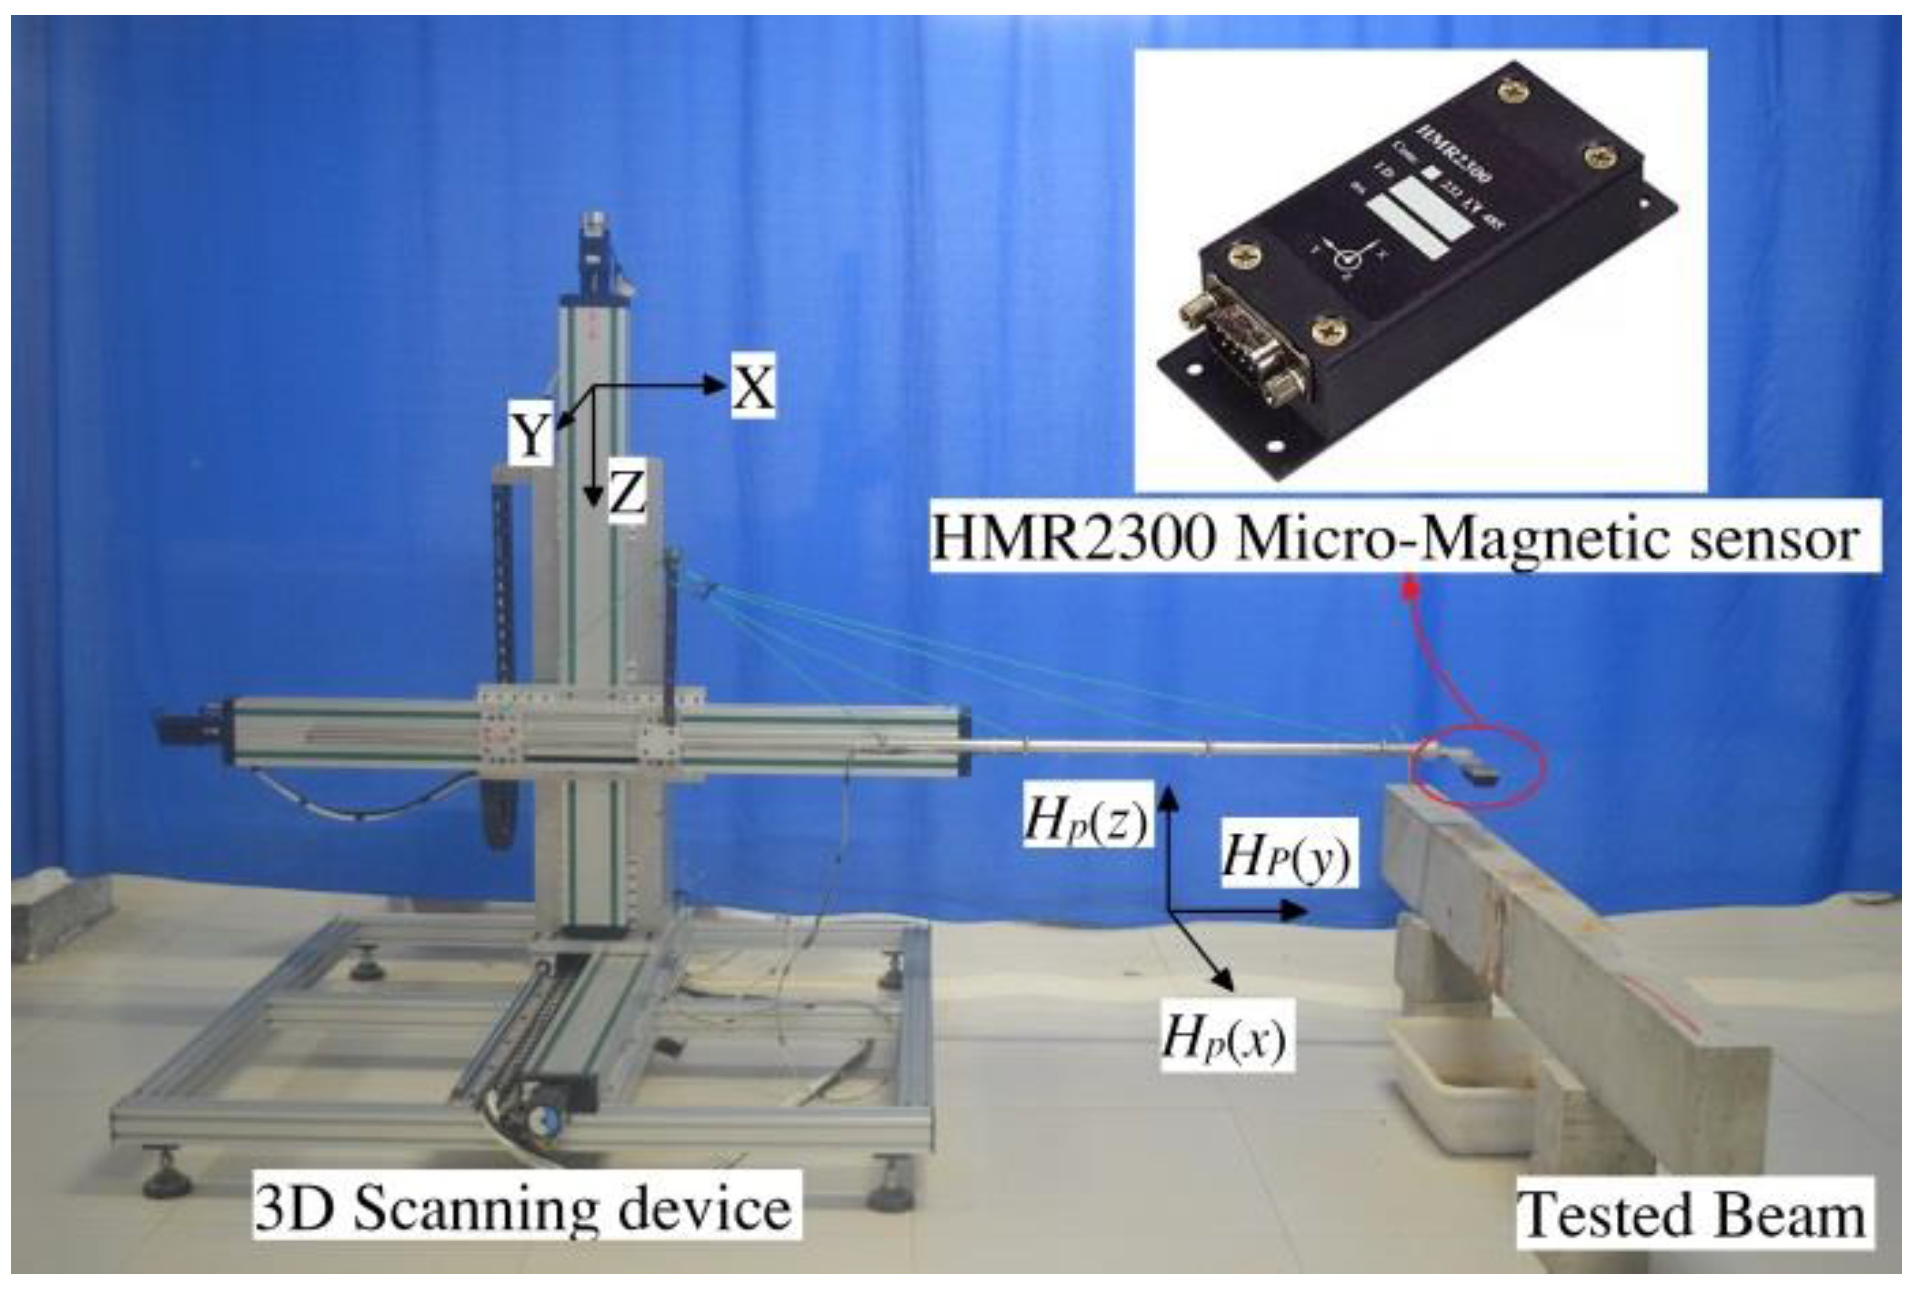
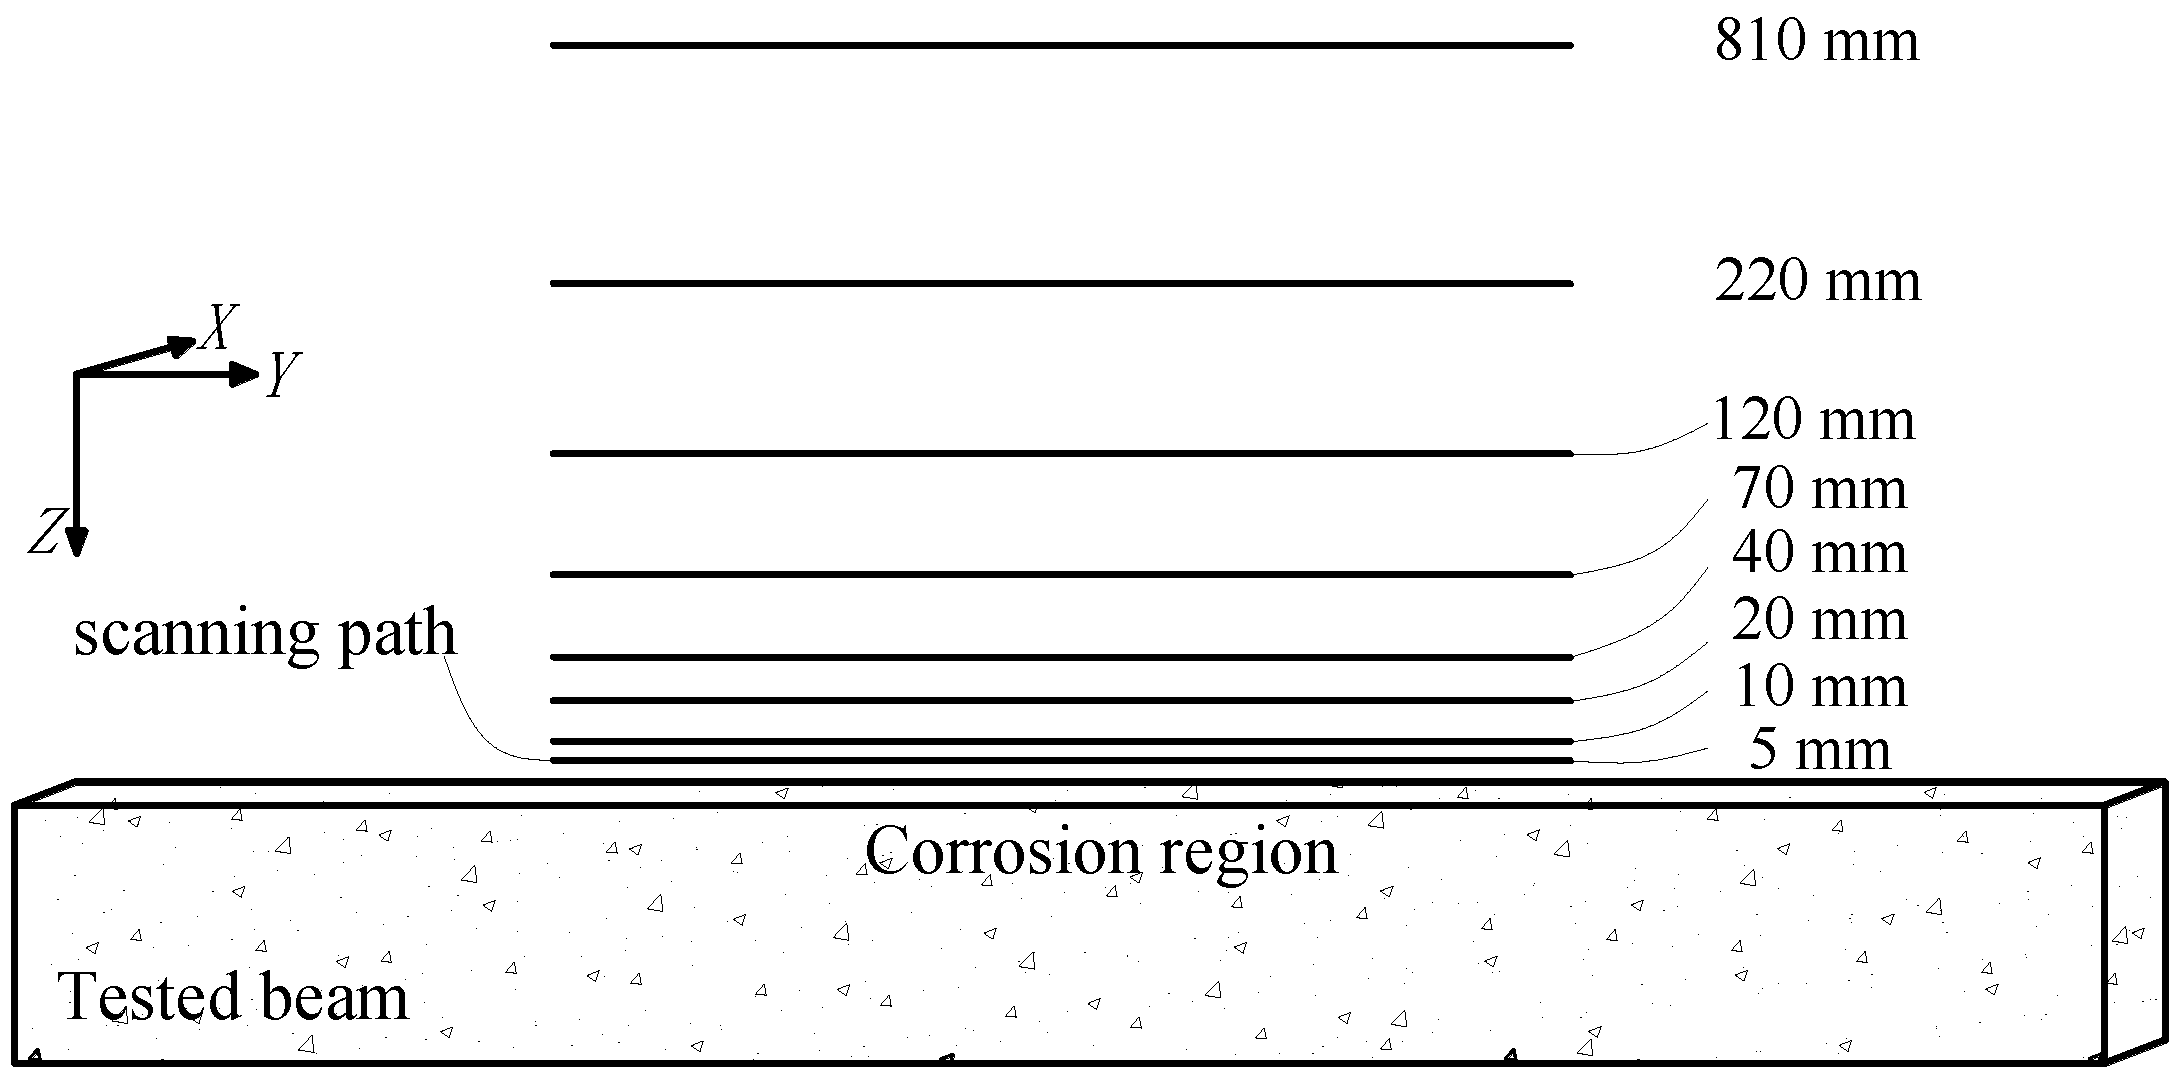
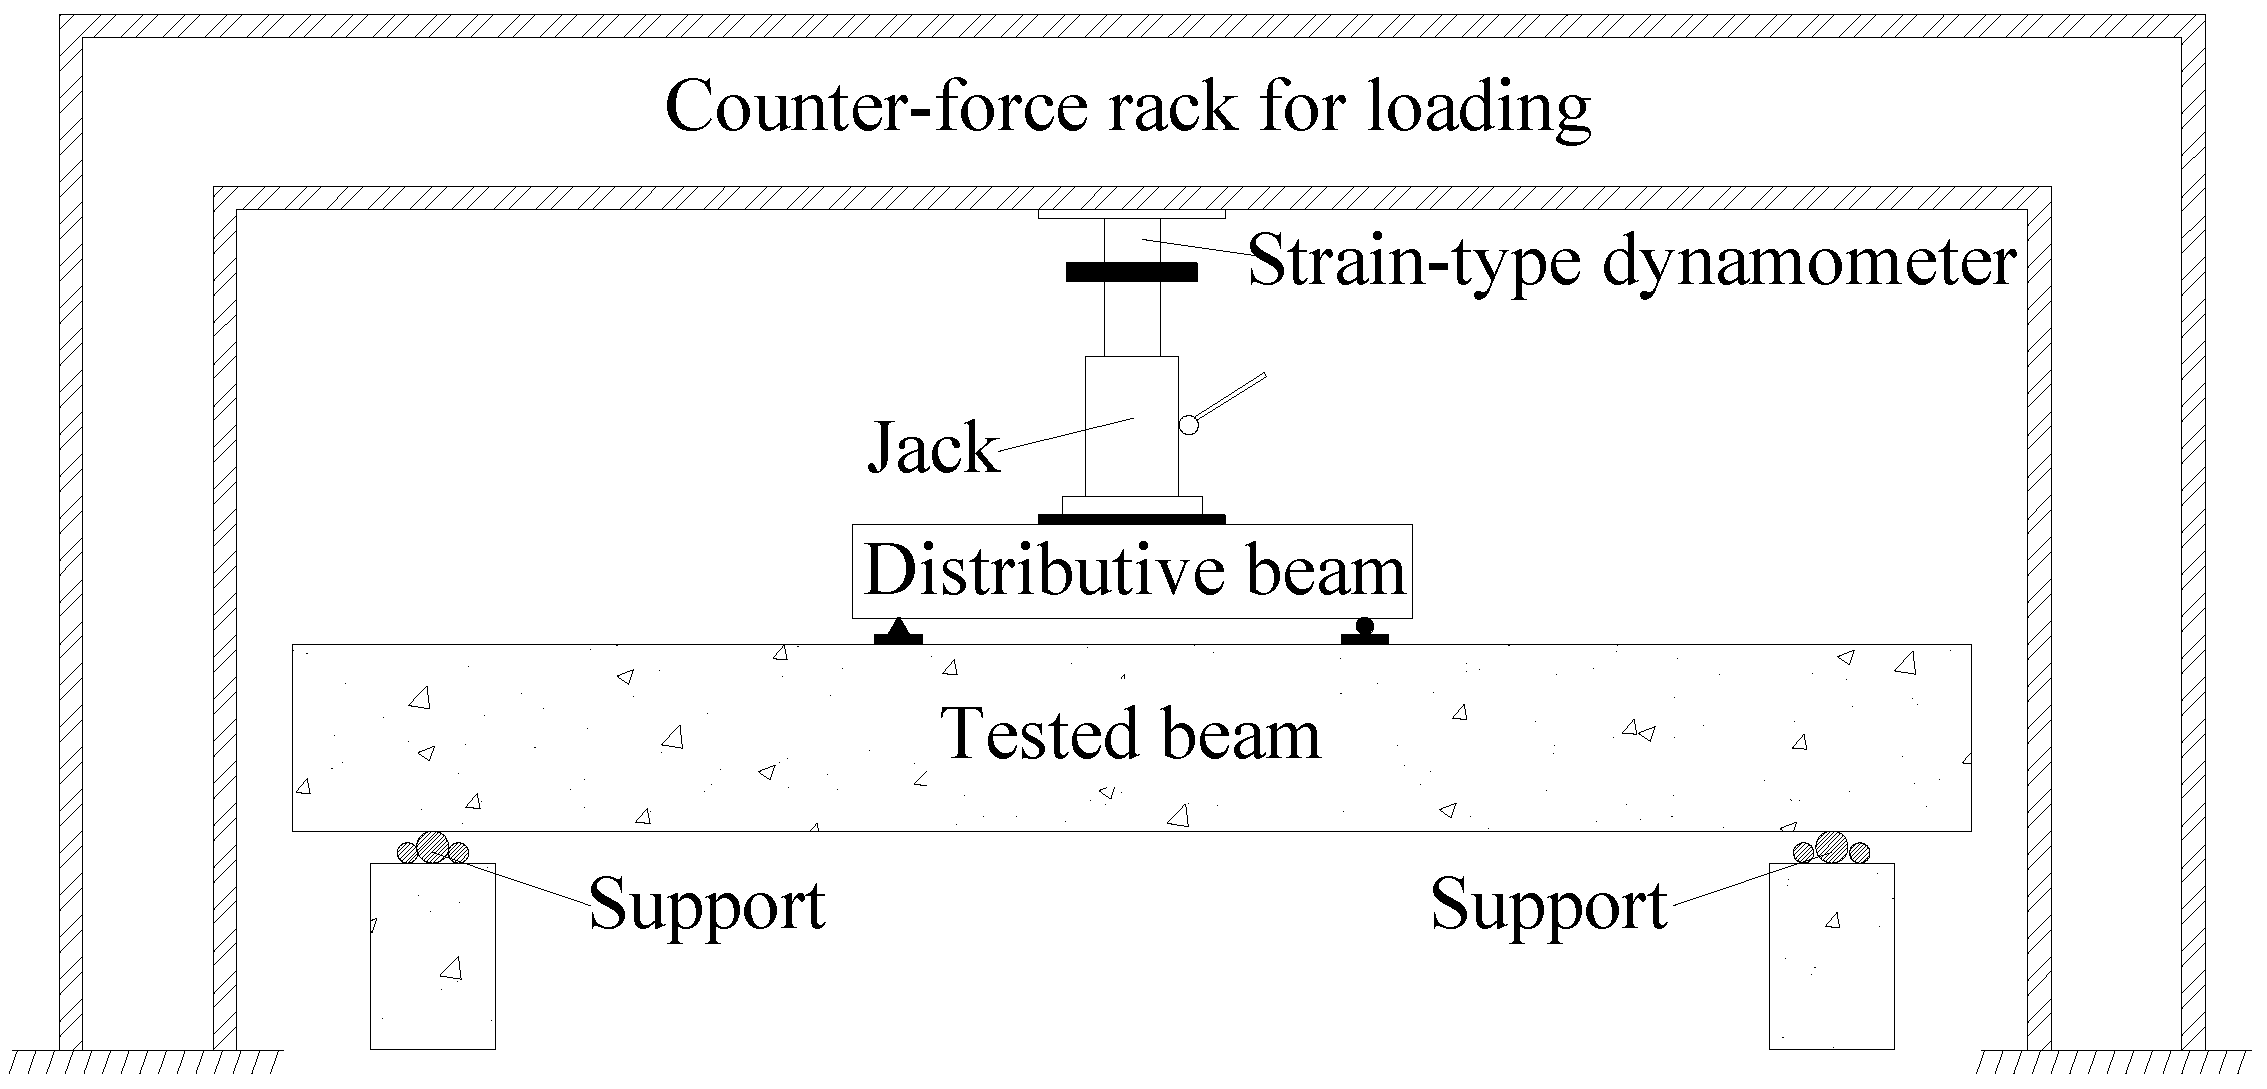
2.1. Experimental Details Based on Micromagnetic Sensor

To carry out the experiment, 10 identical reinforced concrete tested beams, numbered 1–10, were prepared. In order to explore the relationship between the bending strength and the SMFL signals of the corroded reinforced concrete tested beams more intuitively, central sections (corrosion region) of the tested beams were only reinforced with two tensile steel bars. Ordinary Portland cement, coarse aggregate (stone), with a maximum size of 22 mm, water, and sand were used to mix concrete, the detailed material parameters and dimensional drawings of the tested beam are shown in Table 1 and Figure 1. An electrochemical method [35] was used to corrode steel bars of the tested beams, and the amount of corroded iron could be calculated according to the Faraday’s 1st Law, as expressed in Equation (1):
Δ m = M n F Δ Q = M n F I Δ t
where Δm is the amount of corroded iron, M is the molar mass of iron (Fe), n is the valence state of Fe2+, F is the Faraday constant, ΔQ is the quantity of electric charge, I is the direct current flow through steel bars, and Δt is the corrosion time. The corrosion region is located at the midpoint of the tested beam with a width of approximately 15 cm, wrapped with a towel impregnated with a 5% sodium chloride solution and kept moist by the capillary action. The carbon rod placed in the solution is connected to the negative pole of the current source, and the steel bars are connected to the positive pole, forming a closed circuit for corrosion. Corrosion parameters of all tested beams are presented in Table 2, the layout of the corroding device is shown in Figure 2.
Each tested beam was corroded in a periodic manner until the corrosion was completed. After each period of corrosion was completed, the SMFL signals of the tested beam were measured and collected. The self-designed 3-dimensional (3D) device for SMFL signals acquisition based on the 3D mechanical displacement system and the high-precision micromagnetic sensor is shown in Figure 3. HMR2300 magnetometer (Honeywell International, Morristown, NJ, USA) was used as the micromagnetic sensor with a resolution to less than 70 μGs. The device was connected to a computer and can measure the 3D spatial magnetic signal with a controllable scanning speed and path, and then output a data file that contains X, Y, and Z coordinates and its corresponding magnetic signals components HP(y), HP(x), HP(z). The top surface midline of the tested beam is defined as the scanning path for SMFL signals measurement using the 3D scanning device, which is shown in Figure 4. In addition, Figure 4 also shows the different scanning lift-off heights (LFH) from 5 mm to 810 mm.
All the tested beams were subjected to the “4-point” bending test after the corrosion and SMFL signals acquisition were all completed. The layout of the “4-point” bending test is shown in Figure 5.

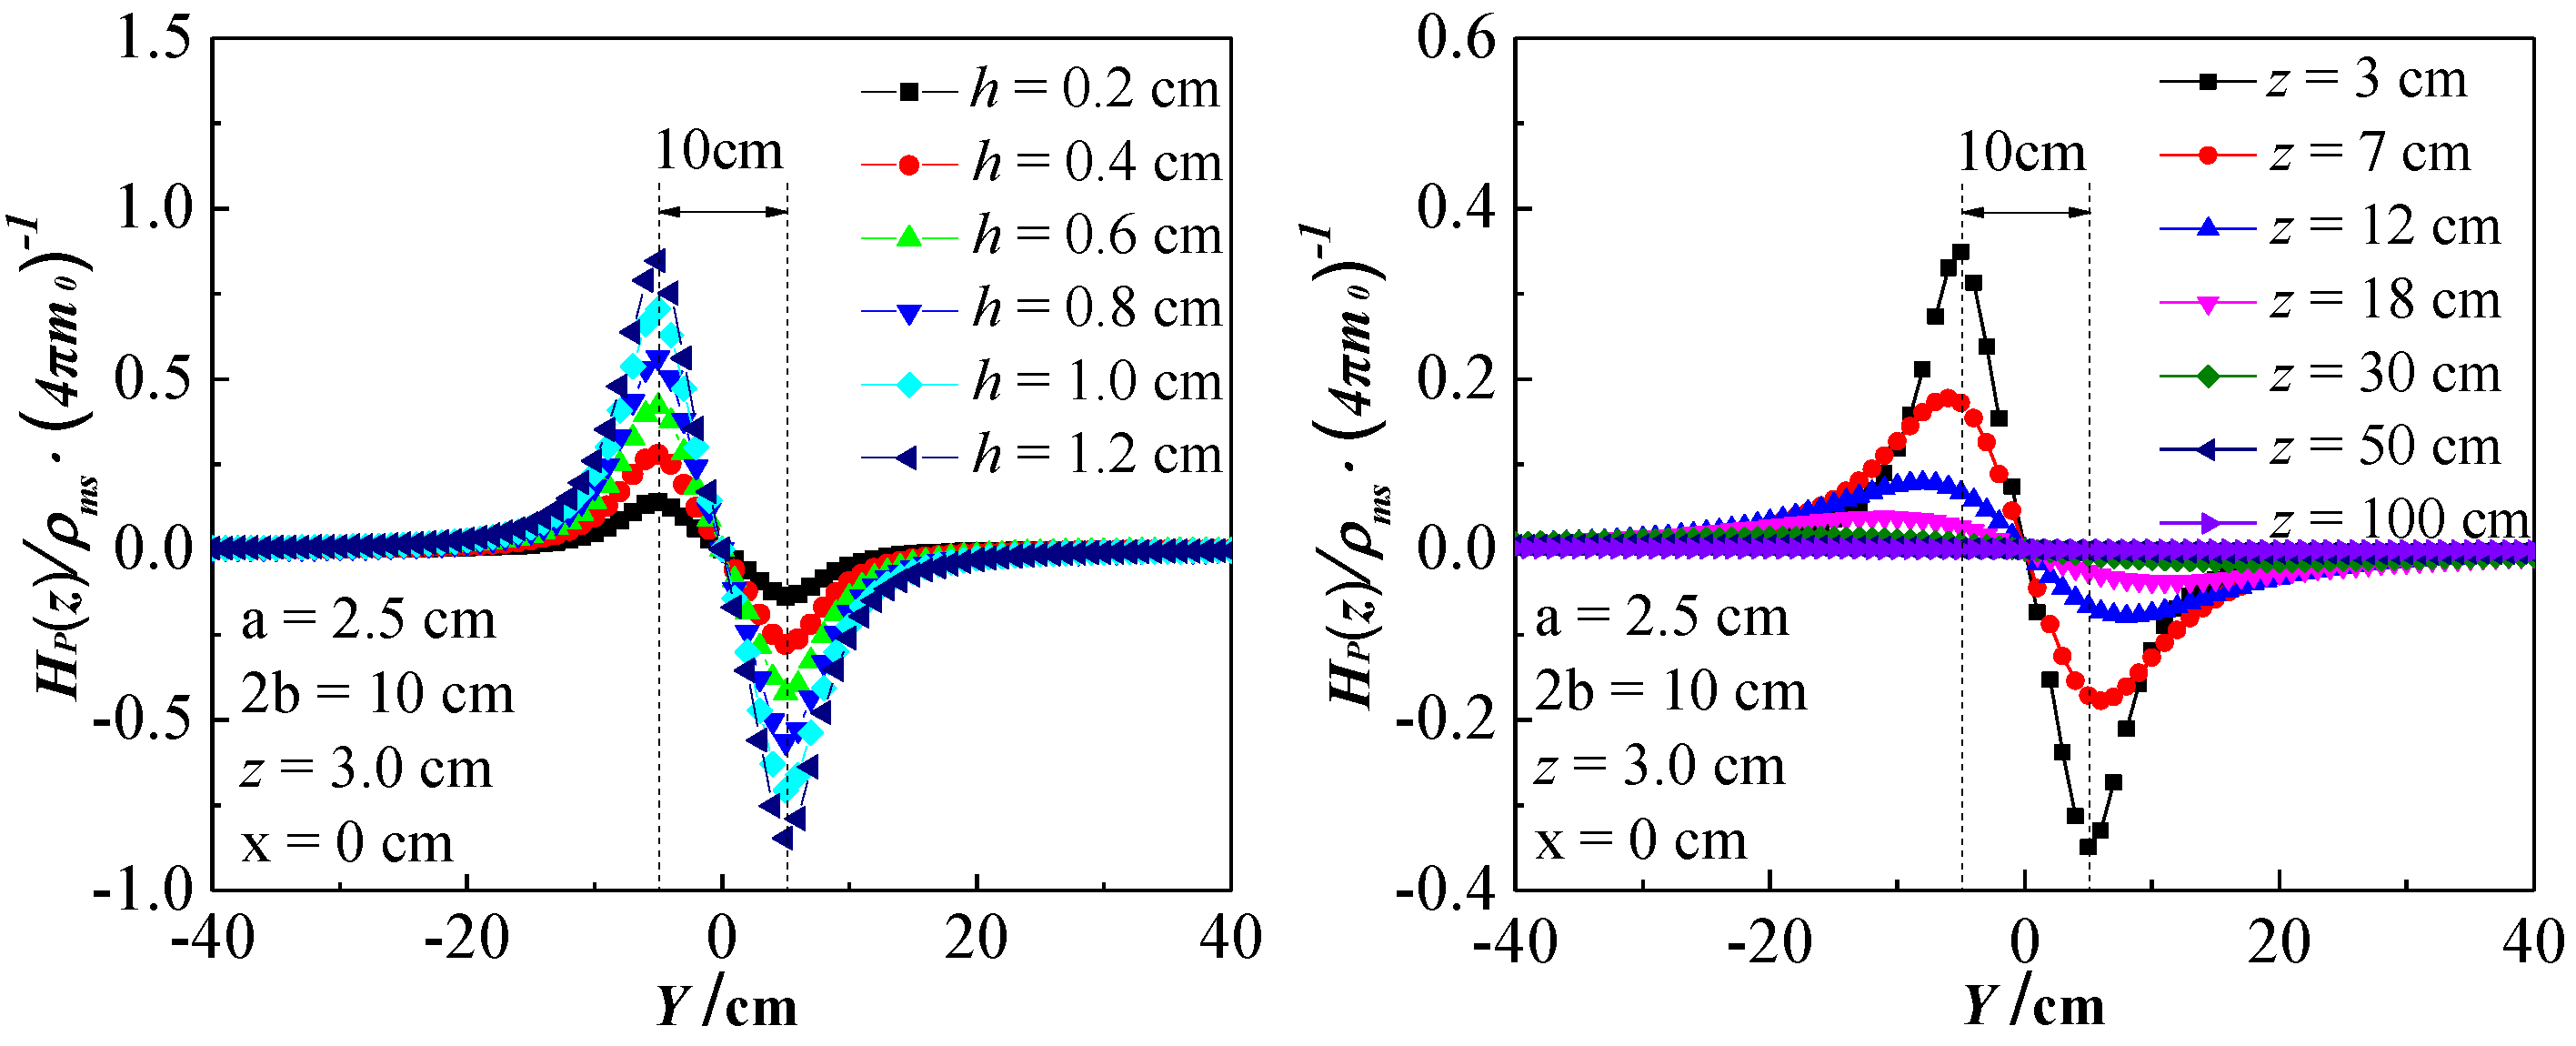
2.2. Theoretical Background Based on Magnetic Dipole Model

The equivalent magnetic dipole is a physical model commonly used in the theoretical study of the mechanism of SMFL signal of the ferromagnet [22,27,36]. According to the equivalent magnetic charge theory, the exterior magnetic field including SMFL would be considered to originated from the magnetic charge: ρ = −∇M. M is the magnetization satisfying M = (μr − 1) HmL, where μr is the relative magnetic permeability and the Weiss field HmL is the effective field producing self-magnetization in the ferromgnet. Figure 6 shows the calculated diagram of the corroded steel bars of the tested beam based on the magnetic dipole model. The corrosion notch of the steel bar is assumed to a rectangular pit with dimensions of 2b × h and the distribution of charge density ±ρms at the edges of the corroded region is considered as uniform for simplicity.
Based on the calculated diagram shown in Figure 6, the surface SMFL signal at point P(x, y, z) due to these concentrated magnetic charges can be expressed as in Equation (2), and its normal component dHp(z) can be expressed as in Equation (3):
d H P = i = 1 4 d H P i = i = 1 4 ± ρ m s d h 2 π μ 0 r i 2 r i
{ d H P 1 ( z ) = ( ρ m s ) ( z + h ) d h 2 π μ 0 [ ( x + a ) 2 + ( y b ) 2 + ( z + h ) 2 ] d H P 2 ( z ) = ( + ρ m s ) ( z + h ) d h 2 π μ 0 [ ( x + a ) 2 + ( y + b ) 2 + ( z + h ) 2 ] d H P 3 ( z ) = ( ρ m s ) ( z + h ) d h 2 π μ 0 [ ( x a ) 2 + ( y b ) 2 + ( z + h ) 2 ] d H P 4 ( z ) = ( + ρ m s ) ( z + h ) d h 2 π μ 0 [ ( x a ) 2 + ( y + b ) 2 + ( z + h ) 2 ]
where ri is the space vector from the magnetic charge element to the space point P(x, y, z); μ0 = 1.0 is the vacuum magnetic permeability; a is half of the spacing of the two parallel steel bars, and z is the lift-off height (LFH). Then, the normal component Hp(z), expressed in Equation (4), can be obtained by the integral of Equation (3). The theoretical calculation results of Equation (4) are shown in Figure 7.
It can be seen from Figure 7 that as the corrosion extent increases (h increases), the amplitude of Hp(z) increases continuously. While the Hp(z) amplitude decreases with increasing z when the corrosion amount Δm is constant. The Hp(z) curves has a zero-crossing intersection at the midpoint of the corroded region, and the peak-valley spacing equals the corrosion width 2b.
H P ( z ) = i = 1 4 h 0 d H P i ( z ) = ρ m s 4 π μ 0 ( ln ( x + a ) 2 + ( y b ) 2 + ( z h ) 2 ( x + a ) 2 + ( y b ) 2 + z 2 + ln ( x + a ) 2 + ( y + b ) 2 + z 2 ( x + a ) 2 + ( y + b ) 2 + ( z h ) 2 + ln ( x a ) 2 + ( y b ) 2 + ( z h ) 2 ( x a ) 2 + ( y b ) 2 + z 2 + ln ( x a ) 2 + ( y + b ) 2 + z 2 ( x a ) 2 + ( y + b ) 2 + ( z h ) 2 ) = A ρ m s 4 π μ 0

3. Results and Discussion

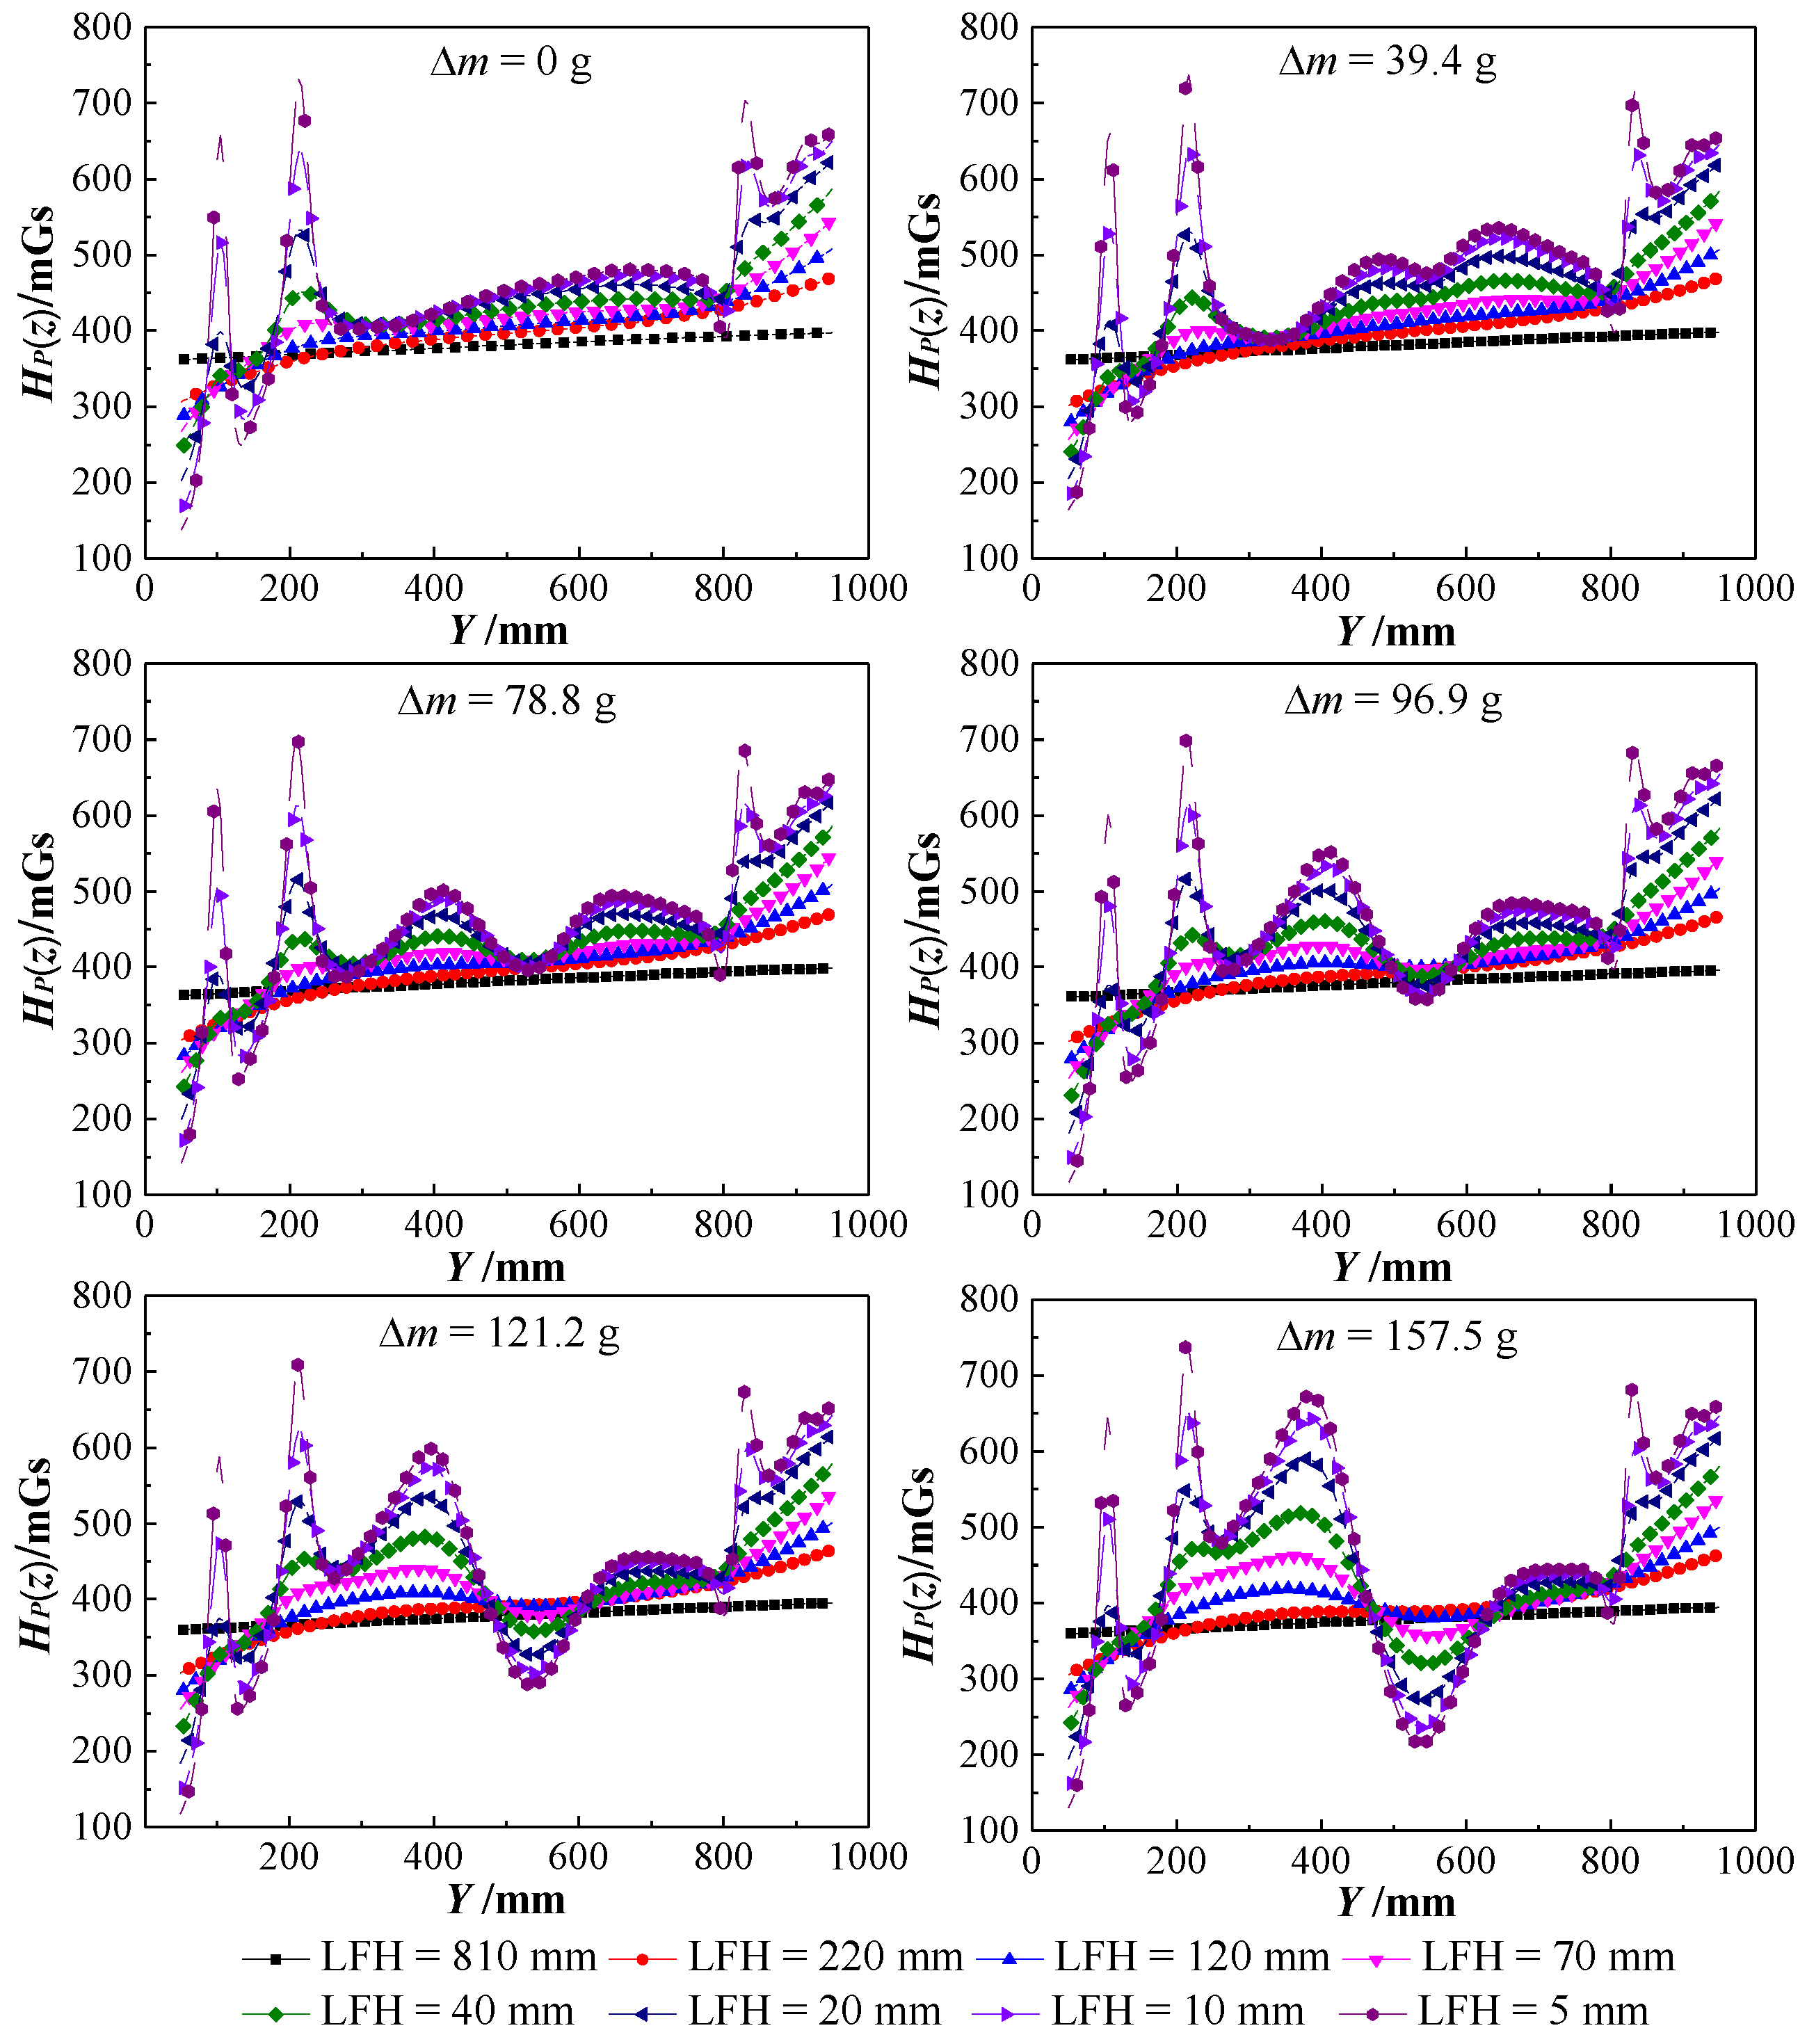
3.1. Experimental Measurement Results of SMFL Signal

Figure 8 shows the normal component HP(z) curves of the nine tested beam SMFL signals with different corrosion amounts Δm, where Y = 400~550 mm corresponds to the corrosion region. The big spikes of amplitude outside of the corrosion region in Figure 8 are due to the effect of stirrups. As the corrosion amount Δm increased, the amplitude of the HP(z) curves in the corroded region increased, and then developed obvious peak-to-valley values and intersection; the smaller the LFH is, the larger the amplitude of HP(z) in the corroded region of the same Δm. The location and extent of the steel bars corrosion can be qualitatively determined by HP(z), apparently. All the experimental phenomena are consistent with the results of theoretical analysis, apparently.
In fact, the HP(z) shown in Figure 8 is a superposition of HB, HS, and HE. HB is the demagnetizing field of the steel bars, HS is the SMFL field originated from the corrosion region, and HE is the environmental magnetic field. HB and HE can be considered constant because the steel bars’ magnetization condition and the environment had not changed during the whole experimental process, which can be confirmed by the fact the HP(z) curves shown in Figure 8 did not significantly change within the uncorroded region. Therefore, the changes of HP(z) within the corroded region are mainly caused by the normal component HS(z) of the SMFL field that originated from the corrosion.
For further analysis, HP(z) curves of each tested beam with the smallest LFH = 5 mm but different Δm were extracted from original HP(z) curves shown in Figure 8. The HP(z) curve with Δm = 0 g is defined as the background magnetic field (HB + HE), which is subtracted from each of the HP(z) curves to obtain the HS(z) curves originated from the corrosion region. Figure 9 shows the HS(z) curves of 2–10 tested beams (a small number of meaningless curves that do not affect the analysis results were deleted) and the ΔL (peak-valley spacing, unit: cm) corresponding to each HS(z) curve. As can be seen from Figure 9, the HS(z) curves are consistent with the theoretical analysis results, especially tested beam number four.

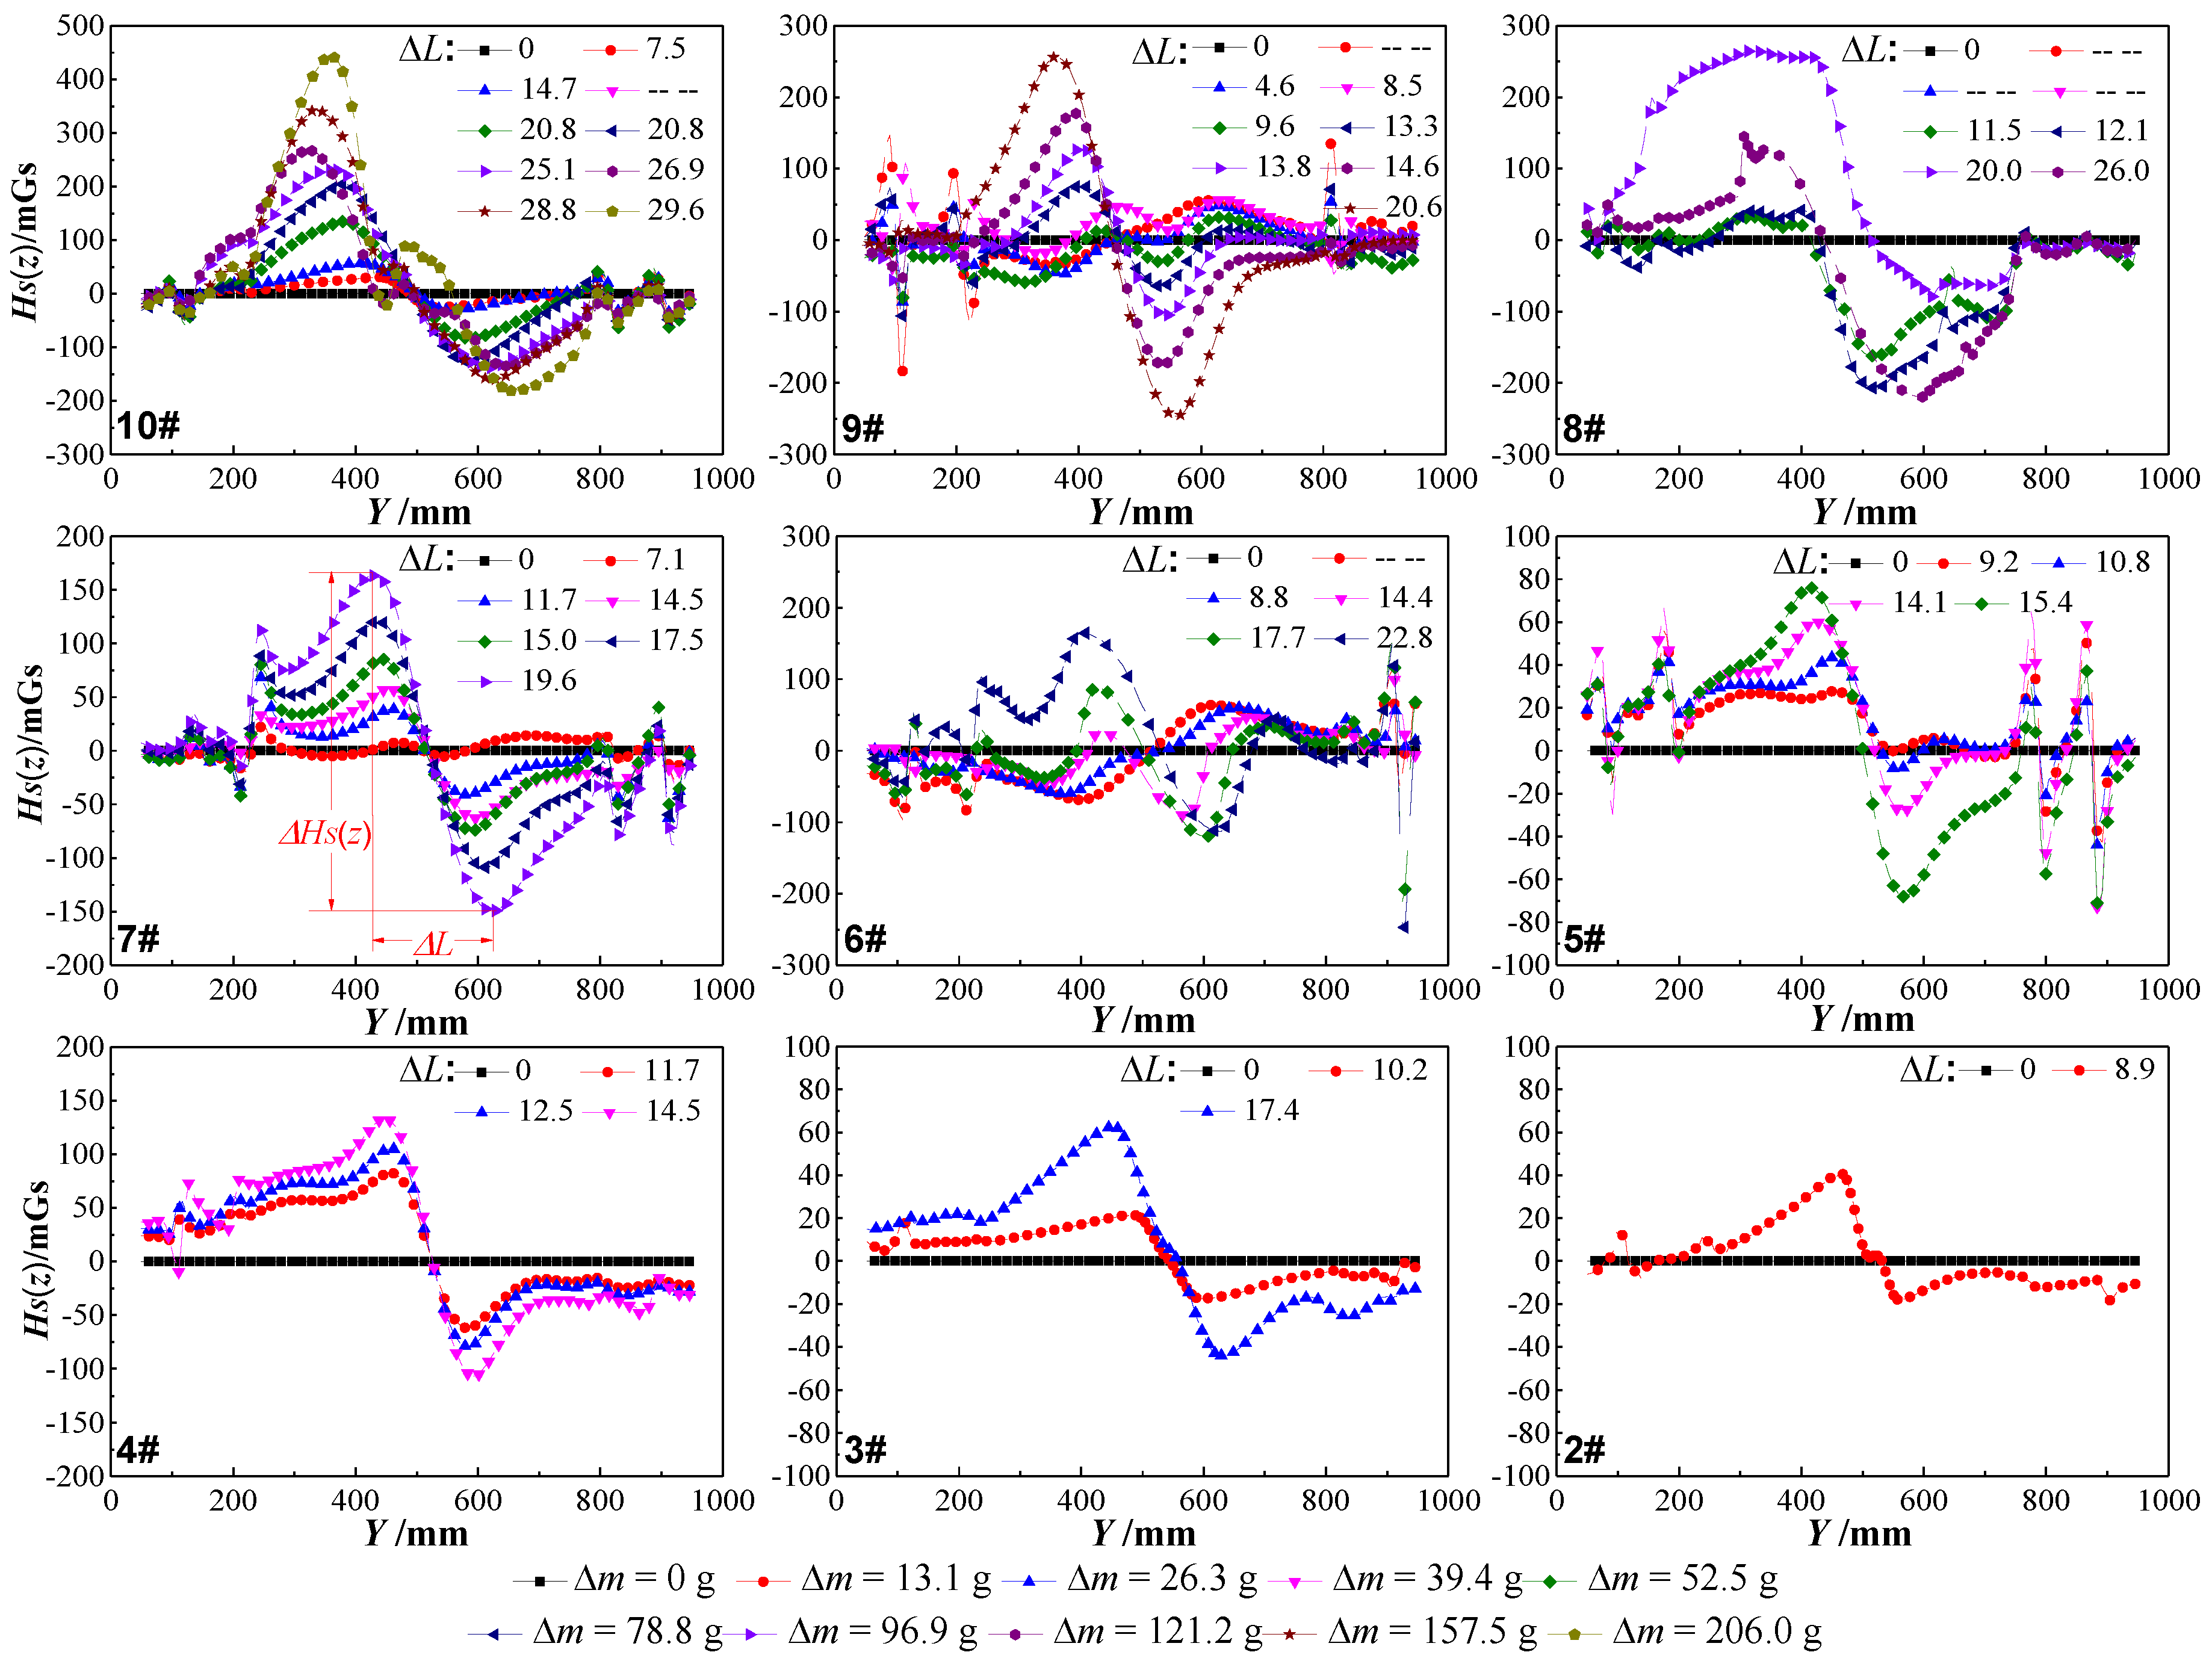
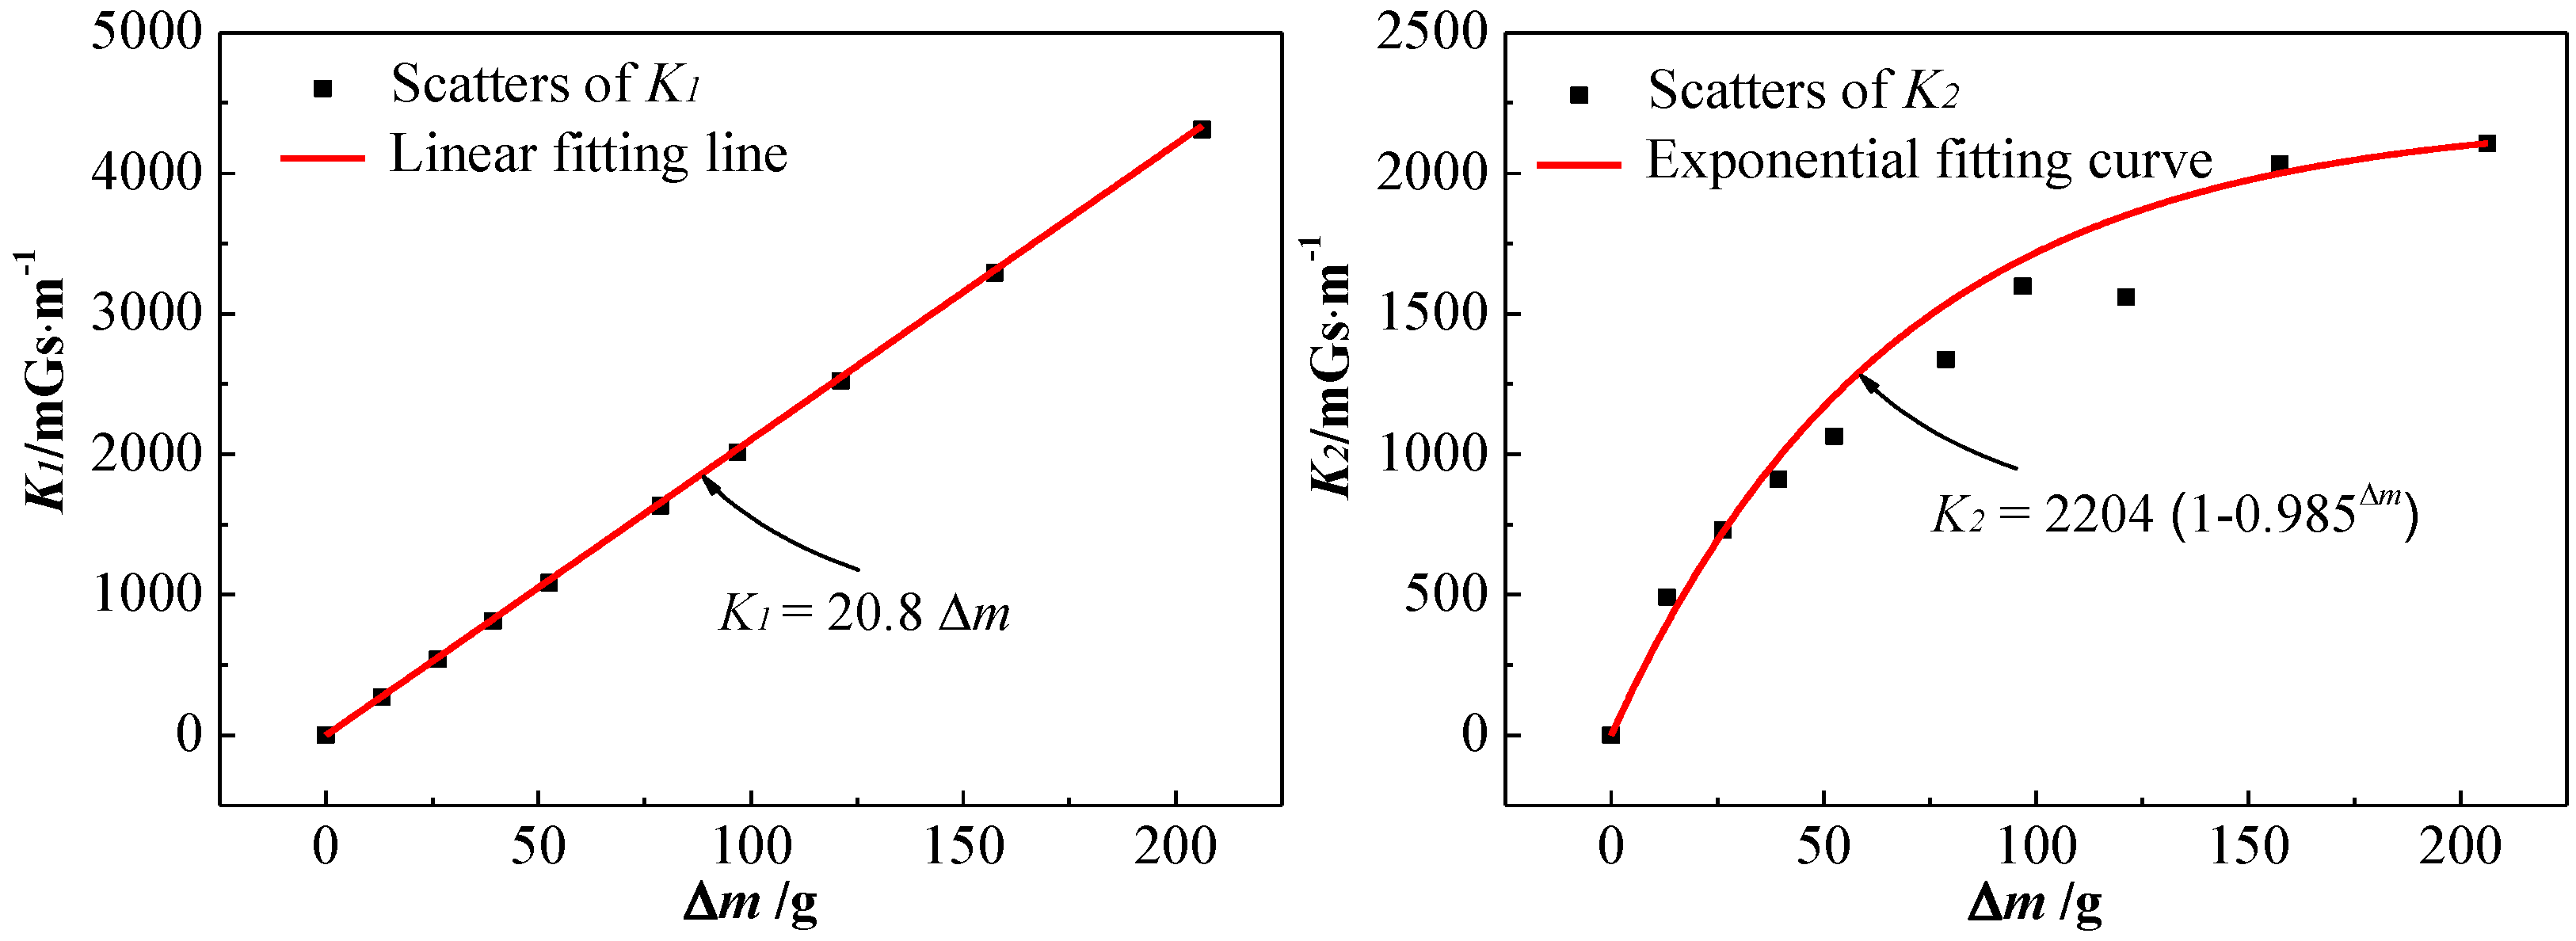
3.2. Analysis of SMFL Signal

In order to analyze the relationship between bending strength and SMFL signals of the corroded tested beams, the gradient K is defined. K is a direct and effective criterion for further description of the variation of SMFL signals, which is given by Equation (5):
K = | Δ H S ( z ) Δ L |
where ΔHS(z) is the difference in the values of peak and valley HS(z) of the corroded area and ΔL is the peak-valley spacing of HS(z) curves, which are shown in Figure 9.
Table 3 shows the calculation parameters of gradient K of all tested beams. ΔHS(z)Ea refers to the average value of the experimental ΔHS(z) with the same corrosion amount Δm; ΔLEa is that of the experimental ΔL with the same corrosion amount Δm. R is the calculation cross-section remaining percentage of the corroded steel bars based on the uniform corrosion assumption, and the corrosion width 2b is assumed to be 15 cm when R is calculated. The conversion model corrosion depth h, integral value A, and magnetic charge density ρms are the theoretical calculation parameters of Equation (4). Depth h is calculated according to R, and the calculation parameters of A are x = 0 cm, y = 7.5 cm, z = 3 cm, a = 2.5 cm, and b = 7.5 cm. Each ρms is calculated according to its corresponding experimental ΔHS(z)Ea. ΔHS(z)T is the theoretical value of ΔHS(z). K1 and K2 refer to the theoretical gradient and the experimental gradient, respectively. The calculation formulas for all parameters are summarized in Equation (6):
{ R = 100 15 × π × 0.7 2 × 7.9 × 2 Δ m 15 × π × 0.7 2 × 7.9 × 2 = 100 Δ m 3.648 h = 1.4 ( 1 0.01 R ) ρ m s = 1 2 Δ H S ( z ) E a 4 π μ 0 A = 2 π μ 0 Δ H S ( z ) E a A Δ H S ( z ) T = 2 ρ m s ¯ A 4 π μ 0 = ρ m s ¯ A 2 π μ 0 K 1 = Δ H S ( z ) T 2 b = ρ m s ¯ A 0.3 π μ 0 K 2 = Δ H S ( z ) E a Δ L E a
Figure 10 shows the relationship diagram between K and Δm according to Table 3. K1 is linearly related to Δm, the linear fitting equation is K1 = 20.8Δm with an R-squared value of 0.999. K2 is exponentially related to Δm, the exponential fitting equation is K2 = 2204 (1 − 0.985Δm) with an R-squared value of 0.946. The difference between K1 and K2 is mainly caused by the fact that the calculation of K1 is based on the constant assumed corrosion width, but the calculation of K2 is based on the continuous increasing actual corrosion width measured in the experiment.

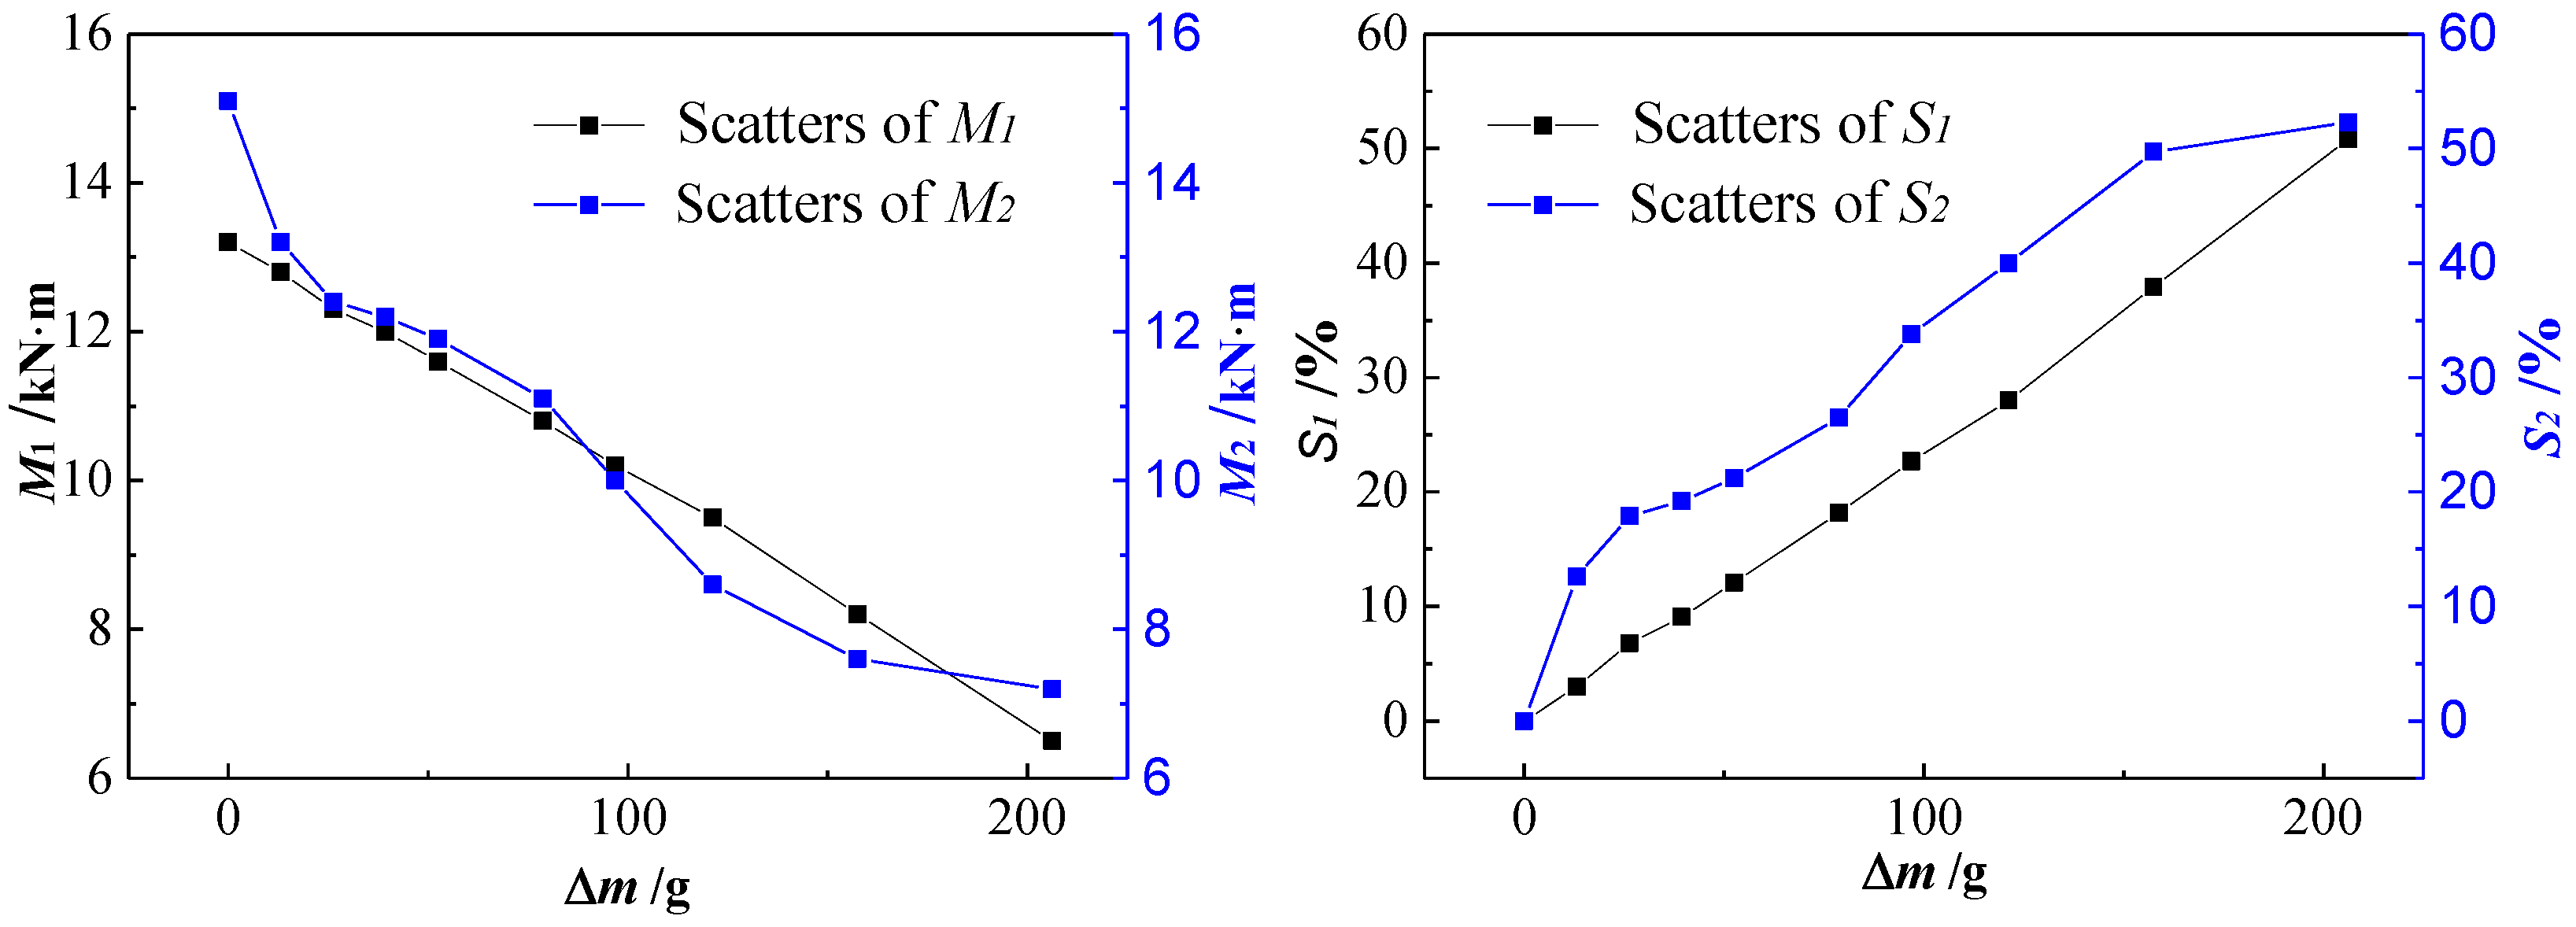
3.3. Analysis of Bending Strength

Table 4 shows the bending strength M and its corresponding loss rate S of all tested beams, where the theoretical bending strength M1 and the experimental bending strength M2 are calculated according to the reinforced concrete structure design principle expressed in Equation (7):
{ α 1 f c b x = f y A s M 1 = α 1 f c b x ( h 0 x 2 ) A s = 0.01 A R M 2 = 1 2 F d
where α1 = 1.0 is the simplified calculation factor, fc = 14.3 MPa is the axial compressive design strength of the concrete, b = 100 mm is the section width of tested beams, x is the height of the concrete pressured zone, fy = 300 MPa is the tensile strength of the steel bar, for structure design, As is the total cross-sectional area of corroded steel bars, h0 = 175 mm is the effective section height, A = 308 mm2 is the total cross-sectional area of uncorroded steel bars, F is the loading force measured in the experiment, and d = 0.62 m is the arm length of the force couple.
Figure 11 shows the relationship diagram between M and Δm according to Table 4. It can be seen that both M1 and M2 decrease approximately linearly with the increase of Δm, especially M1. The values of M2 are not much different from that of M1, which indicates that the results of the experiment are consistent with that of the theoretical calculation. As for the loss rate S, S1 is positive linearly related to Δm, but S2 is more inclined to increase exponentially with the increase of Δm. The difference, mainly caused by the continuous increasing actual corrosion width in the experiment, leads to the cross-section of the steel bar being reduced more and more slowly with the same increment of Δm. Then, M2 decreased more and more slowly and S2 increased more and more slowly with the increase of Δm, which led to S2 increasing more and more slowly.

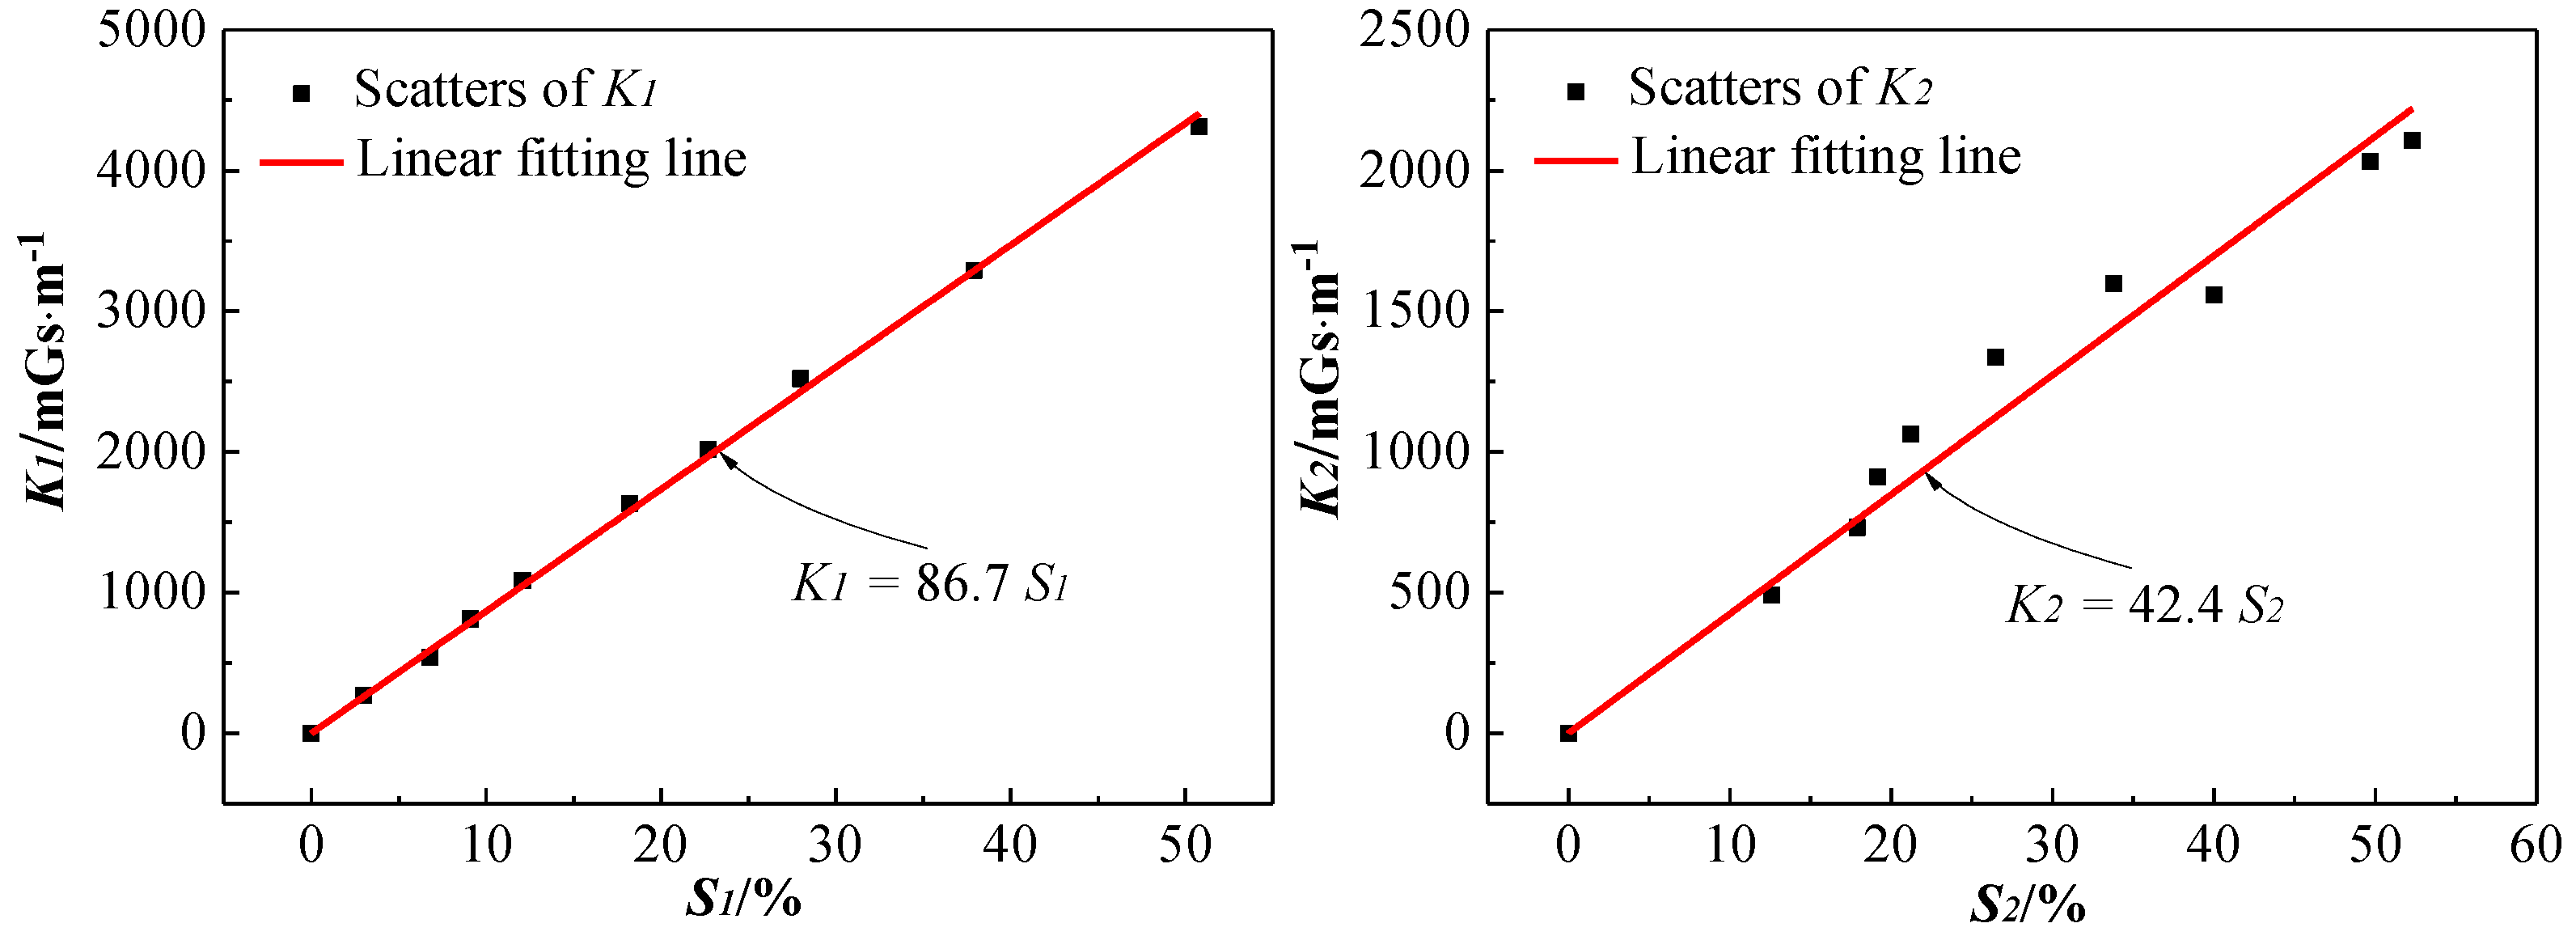
3.4. Analysis of Relationship Between SMFL Signal and Bending Strength

According to the above analysis, both K and S increase monotonically with the increase of Δm. For evaluating the relationship between SMFL signals and the bending strength of the corroded reinforced concrete beams, scatters and the linear fitting line of S-K are shown in Figure 12. It can be seen that with the increase of S1 and S2, both K1 and K2 increase approximately linearly. The fitting function of the theoretical data is K1 = 86.7S1, with an R-squared value of 0.998, and that of the experimental data is K2 = 42.4S2, with an R-square value of 0.964.
Compared with the theoretical data, the experimental data is more discrete and its gradient grows more slowly. In addition to being affected by the corrosion width, this difference may originate from the fact that some factors are ignored in the idealized theoretical analysis. Such as the magnitude and the distribution of magnetic charge, meaning that the shape of the corrosion notch will be affected by nonuniform corrosion or corrosion expansion stress.
However, in general, the variation and distribution laws of S-K obtained from the experiment are consistent with that of the theoretical analysis, which shows that the gradient K is a reliable and effective indicator for evaluating the residual bending strength of corroded reinforced concrete beams.

4. Conclusions

In this work, the experiment details of 10 corroded reinforced concrete tested beams based on micromagnetic sensors are introduced, followed by the derivation of the formulas of HP(z) (HS(z)) based on the magnetic dipole model. Finally, both the experimental data and theoretical data were analyzed. The following conclusions can be drawn:
(1) The experimental HS(z) curves of all tested beams are consistent with the theoretical calculation results of the magnetic dipole model, both the location and extent of the steel bars’ corrosion can be qualitatively determined using HS(z);
(2) The bending strength loss rate S of all the tested beams are approximately linearly related to the gradient K of HS(z), thus the residual bending strength of the corroded reinforced concrete beams can be evaluated based on the gradient K of HS(z).
This paper lays the foundation for the experimental study of the relationship between the bending strength and the SMFL signals of corroded reinforced concrete beams. A simpler, low-cost, and more efficient new method for evaluating the residual bending strength of corroded reinforced concrete beams based on the micromagnetic sensor is also proposed.

Author Contributions

J.Z. arranged all the work in the project and gave a keen insight in this manuscript; Y.Z. (Yingxin Zhou) and Y.Z. (Yi Zhou) investigated the current status of the research; J.Q. and R.X. derived the theoretical equations and performed the experiments; Y.Z. (Yingxin Zhou) and Y.Z. (Yi Zhou) analyzed the measured data and discussed the results; J.Q. and R.X. wrote the manuscript.

Funding

This research was funded by the National Key Research and Development Program of China (Grant No. 2017YFC0806007), the National Science Fund for Distinguished Young Scholars (Grant No. 51425801), the Major Topic Special Key Research and Development Project of the Artificial Intelligence Technology Innovation in Chongqing (Grant No. cstc2017rgzn-zdyfX0018) and (cstc2017rgzn-zdyfX0029), the Science and Technology Planning Project of Yunnan Province of China (Grant Number 2017IB025), and the Science and Technology Planning Project of Nanjing of China (Grant Number 201727002).

Conflicts of Interest

The authors declare no conflicts of interest.

References

  1. Davis, M.; Hoult, N.A.; Scott, A. Distributed strain sensing to assess corroded RC beams. Eng. Struct. 2017, 6, 473–482. [Google Scholar] [CrossRef]
  2. Zhao, Y.; Karimi, A.R.; Wong, H.S.; Hu, B.; Nick, R.B. Comparison of uniform and nonuniform corrosion induced damage in reinforced concrete based on a Gaussian description of the corrosion layer. Corros. Sci. 2011, 53, 2803–2814. [Google Scholar] [CrossRef]
  3. Yoon, I.-S. Comprehensive Approach to Calculate Oxygen Diffusivity of Cementitious Materials Considering Carbonation. Int. J. Concr. Struct. Mater. 2018, 12, 1–10. [Google Scholar] [CrossRef]
  4. Zhao, X.; Gong, P.; Qiao, G.; Lu, J.; Lv, X.; Ou., J. Brillouin corrosion expansion sensors for steel reinforced concrete structures using a fiber optic coil winding method. Sensors 2011, 11, 10798–10819. [Google Scholar] [CrossRef] [PubMed]
  5. Li, W.; Ho, S.C.M.; Song., G. Corrosion detection of steel reinforced concrete using combined carbon fiber and fiber Bragg grating active thermal probe. Smart Mater. Struct. 2016, 25, 045017. [Google Scholar] [CrossRef] [Green Version]
  6. Li, W.; Xu, C.; Ho, S.C.M.; Wang, B.; Song, G. Monitoring concrete deterioration due to reinforcement corrosion by integrating acoustic emission and FBG strain measurements. Sensors 2017, 17, 657. [Google Scholar] [CrossRef] [PubMed]
  7. Li, T.; Almond, D.P.; Rees, D.A.S. Crack imaging by scanning laser-line thermography and laser-spot thermography. Meas. Sci. Technol. 2011, 22, 035701. [Google Scholar] [CrossRef] [Green Version]
  8. Khodayar, F.; Lopez, F.; Ibarra-Castanedo, C.; Maldague, X. Parameter Optimization of Robotize Line Scan Thermography for CFRP Composite Inspection. J. Nondestr. Eval. 2018, 37, 5. [Google Scholar] [CrossRef]
  9. Khodayar, F.; Lopez, F.; Ibarra-Castanedo, C.; Maldague, X. Optimization of the inspection of large composite materials using robotized line scan thermography. J. Nondestr. Eval. 2017, 36, 32. [Google Scholar] [CrossRef]
  10. Gao, B.; He, Y.; Woo, W.L.; Tian, G.Y.; Liu, J.; Hu, Y. Multidimensional tensor-based inductive thermography with multiple physical fields for offshore wind turbine gear inspection. IEEE Trans. Ind. Electron. 2016, 63, 6305–6315. [Google Scholar] [CrossRef]
  11. Gao, B.; Lu, P.; Woo, W.L.; Tian, G.Y. Variational Bayesian Sub-group Adaptive Sparse Component Extraction for Diagnostic Imaging System. IEEE Trans. Ind. Electron. 2018, 65, 8142–8152. [Google Scholar] [CrossRef]
  12. Zhang, H.; Robitaille, F.; Grosse, C.U.; Ibarra-Castanedo, C.; Martins, J.O.; Sfarra, S.; Maldague, X.P.V. Optical excitation thermography for twill/plain weaves and stitched fabric dry carbon fibre preform inspection. Composites Part: A Appl. Sci.Manuf. 2018, 107, 282–293. [Google Scholar] [CrossRef]
  13. Sfarra, S.; Marcucci, E.; Ambrosini, D.; Paoletti, D. Infrared exploration of the architectural heritage: from passive infrared thermography to hybrid infrared thermography (HIRT) approach. Materiales. De Construcción. 2016, 60. [Google Scholar] [CrossRef]
  14. Grager, J.C.; Kotschate, D.; Gamper, J.; Gaal, M.; Pinkert, K.; Mooshofer, H.; Goldammer, M.; Grosse, C.U. Advances in air-coupled ultrasonic testing combining an optical microphone with novel transmitter concepts. In Proceedings of the 12th European conference on Non-Destructive Testing, Gothenburg, Sweden, 11–15 June 2018. [Google Scholar]
  15. Amini, M.H.; Sinclair, A.N.; Coyle, T.W. A new high-temperature ultrasonic transducer for continuous inspection. IEEE Trans. Ultrason. Ferroelectr. Freq. Control. 2016, 63, 448–455. [Google Scholar] [CrossRef] [PubMed]
  16. Wu, D.; Liu, Z.; Wang, X.; Su, L. Composite magnetic flux leakage detection method for pipelines using alternating magnetic field excitation. NDT E Int. 2017, 91, 148–155. [Google Scholar] [CrossRef]
  17. Dubov, A.A. A study of metal properties using the method of magnetic memory. Met. Sci. Heat Treat. 1997, 39, 401–405. [Google Scholar] [CrossRef]
  18. Piotrowski, L.; Chmielewski, M.; Augustyniak, B. On the correlation between magnetoacoustic emission and magnetostriction dependence on the applied magnetic field. J. Magn. Magn. Mater. 2016, 410, 34–40. [Google Scholar] [CrossRef]
  19. Rocío, N.A.M.; Nicolás, N.; Isabel, L.P.M.; José, R.; Linilson, P. Magnetic barkhausen noise and magneto-acoustic emission in stainless steel plates. Procedia Mater. Sci. 2015, 8, 674–682. [Google Scholar] [CrossRef]
  20. Wang, Z.D.; Yao, K.; Deng, B.; Ding, K.Q. Quantitative study of metal magnetic memory signal versus local stress concentration. NDT E Int. 2010, 43, 513–518. [Google Scholar] [CrossRef]
  21. Coronelli, D.; Gambarova, P. Structrural assessment of corroded reinforced concrete beams: modeling guidelines. J. Struct. Eng. 2004, 130, 1214–1224. [Google Scholar] [CrossRef]
  22. Xia, R.; Zhou, J.; Zhang, H.; Liao, L.; Zhao, R.Q.; Zhang, Z. Quantitative Study on Corrosion of Steel Strands Based on Self-Magnetic Flux Leakage. Sensors 2018, 18, 1396. [Google Scholar] [CrossRef] [PubMed]
  23. Liu, B.; He, Y.Y.; Zhang, H.; Fernandes, H.; Fu, Y.; Maldague, X. Study on characteristics of magnetic memory testing signal based on the stress concentration field. IET Sci. Meas. Technol. 2017, 11, 2–8. [Google Scholar] [CrossRef]
  24. Liu, B.; Cao, Y.; Zhang, H.; Lin, Y.R.; Sun, W.R.; Xu, B. Weak magnetic flux leakage: A possible method for studying pipeline defects located either inside or outside the structures. NDT E Int. 2015, 74, 81–86. [Google Scholar] [CrossRef] [Green Version]
  25. Liu, B.; He, L.; Zhang, H.; Cao, Y.; Fernandes, H. The axial crack testing model for long distance oil-gas pipeline based on magnetic flux leakage internal inspection method. Measurement 2017, 103, 275–282. [Google Scholar] [CrossRef]
  26. Zhang, H.; Liao, L.; Zhao, R.Q.; Zhou, J.; Yang, M.; Xia, R. The nondestructive test of steel corrosion in reinforced concrete bridges using a micromagnetic sensor. Sensors 2016, 16, 1439. [Google Scholar] [CrossRef] [PubMed]
  27. Zhang, H.; Liao, L.; Zhao, R.Q.; Zhou, J.; Yang, M.; Zhao, Y. A new judging criterion for corrosion testing of reinforced concrete based on self-magnetic flux leakage. Int. J. Appl. Electromagnet Mech. 2017, 54, 123–130. [Google Scholar] [CrossRef]
  28. Zhang, J.; Liu, C.; Sun, M.; Li, Z. An innovative corrosion evaluation technique for reinforced concrete structures using magnetic sensors. Constr. Build. Mater. 2017, 135, 68–75. [Google Scholar] [CrossRef]
  29. Polydorides, N.; Georghiou, G.E.; Kim, D.H.; Won, C. Subspace constrained regularization for corrosion detection with magnetic induction tomography. NDT & E Int. 2008, 41, 510–516. [Google Scholar]
  30. Sun, B.; Dong, P.; Wang, C.; Pu, X.; Wu, Y. Quantitative analysis of magnetic anomaly of reinforcements in bored in situ concrete piles. Appl. Geophys. 2009, 6, 275–286. [Google Scholar] [CrossRef]
  31. Orbe, A.; Rojí, E.; Losada, R.; Cuadrado., J. Calibration patterns for predicting residual strengths of steel fibre reinforced concrete (SFRC). Composites Part. B Eng. 2014, 58, 408–417. [Google Scholar] [CrossRef]
  32. Krause, H.-J.; Wolf, W.; Glaas, W.; Zimmermann, E.; Faley, M.I.; Sawade, G.; Mattheus, R.; Neudert, G.; Gampe, U.; Krieger, J. SQUID array for magnetic inspection of prestressed concrete bridges. Physica. C Supercond. 2002, 368, 91–95. [Google Scholar] [CrossRef]
  33. Fernandes, B.T.; Silva, I.; Gaydecki, P.A. Vector extraction from digital images of steel bars produced by an inductive scanning system using a differential gradient method combined with a modified Hough transform. NDT E Int. 2000, 33, 69–75. [Google Scholar] [CrossRef]
  34. Szielasko, K.; Youssef, S.; Sourkov, A.; Kurz, J.; Pushkarev, S.; Birringer, R. Magnetic flux leakage detection of corrosion damage in prestressed concrete poles. Electroamgentic Nondestr. Eval. (XVIII) 2015, 40, 203–210. [Google Scholar]
  35. Ahmad, S. Reinforcement corrosion in concrete structures, its monitoring and service life prediction—A review. Cem. Concr.Compos. 2003, 25, 459–471. [Google Scholar] [CrossRef]
  36. Huang, H.; Yao, J.; Li, Z.; Liu, Z. Residual magnetic field variation induced by applied magnetic field and cyclic tensile stress. NDT E Int. 2014, 63, 38–42. [Google Scholar] [CrossRef]
Figure 1. Dimensions of the tested beam (unit: mm).
Sensors 18 02635 g001
Figure 2. Layout of the corrosion device.
Sensors 18 02635 g002
Figure 3. The 3D scanning device for magnetic field measurement.
Sensors 18 02635 g003
Figure 4. The scanning path of the tested beams to acquire self-magnetic flux leakage (SMFL) signals.
Sensors 18 02635 g004
Figure 5. Layout of the “4-point” bending test.
Sensors 18 02635 g005
Figure 6. Calculated diagram based on the magnetic dipole model.
Sensors 18 02635 g006
Figure 7. The theoretical calculation results of Equation (4).
Sensors 18 02635 g007
Figure 8. HP(z) curves of the nine tested beams with different Δm.
Sensors 18 02635 g008
Figure 9. HS(z) curves of 2–10 tested beam with LFH = 5 mm.
Sensors 18 02635 g009
Figure 10. Diagram of relationship between K and Δm.
Sensors 18 02635 g010
Figure 11. Diagram of the relationship between M and Δm.
Sensors 18 02635 g011
Figure 12. Scatters and linear fitting line of S-K.
Sensors 18 02635 g012
Table 1. Material parameters of tested beam.
ItemLabelMaterialCementWaterSandStoneStandard Strength (Mpa)Design Strength (Mpa)
ConcreteC30Unit dosage
(kg/m3)
4611755121252fck = 20.1fcd = 14.3
weight ratio10.381.112.72ftk = 2.01ftd = 1.43
ItemReinforcementYield Strength (Mpa)Design Strength (Mpa)
Steel barsTensile bars: 2Φ14; Stirrup: Φ8@100fyk = 335fyd = 300
Table 2. Corrosion parameters of all tested beams.
ParameterNo.
1#2#3#4#5#6#7#8#9#10#
Corrosion current/A1.051.051.051.051.051.051.051.051.051.05
Corrosion time/h0122436487296120156504
Δm/g013.126.339.452.578.896.9121.2157.5206.0
Table 3. The calculation parameters of gradient K.
ParameterΔm/g
013.126.339.452.578.896.9121.2157.5206.2
ΔHS(z)Ea/mGs
ΔLEa/cm
R/%
h/cm
A
ρms/mGs
ΔHS(z)T/mGs
K1/mGs·m−1
K2/mGs·m−1
0
-
100
0
0
-
0
0
0
44.6
9.1
96.4
0.050
0.037
7574
40.4
269.5
490.1
84.1
11.5
92.80
0.101
0.075
7046
81.0
540.0
731.3
120.4
13.2
89.2
0.151
0.112
6754
121.7
811.6
912.1
159.5
15.0
85.6
0.202
0.150
6681
162.6
1084
1063
230.0
17.2
78.4
0.302
0.225
6423
244.8
1632
1337
313.0
19.6
73.4
0.372
0.278
7074
302.1
2014
1597
350.6
22.5
66.8
0.465
0.348
6330
377.9
2520
1558
501.8
24.7
56.8
0.605
0.454
6945
493.2
3288
2032
623.4
29.6
43.5
0.791
0.595
6583
646.5
4310
2106
Table 4. The bending strength M of all tested beams.
ParameterNo.
1#2#3#4#5#6#7#8#9#10#
Δm/g
M1/(KN·m)
S1/%
F/kN
M2/(KN·m)
S2/%
0
13.2
0
48.7
15.1
0
13.1
12.8
3.0
42.6
13.2
12.6
26.3
12.3
6.8
40.0
12.4
17.9
39.4
12.0
9.1
39.4
12.2
19.2
52.5
11.6
12.1
38.4
11.9
21.2
78.8
10.8
18.2
35.8
11.1
26.5
96.9
10.2
22.7
32.3
10.0
33.8
121.2
9.5
28.0
27.7
8.6
40.0
157.5
8.2
37.9
24.5
7.6
49.7
206.0
6.5
50.8
23.2
7.2
52.3

