Field Applications of Ultra High Frequency Techniques for Defect Detection in GIS

Abstract
1. Introduction
2. Experimental Arrangement
2.1. Experiment Setup
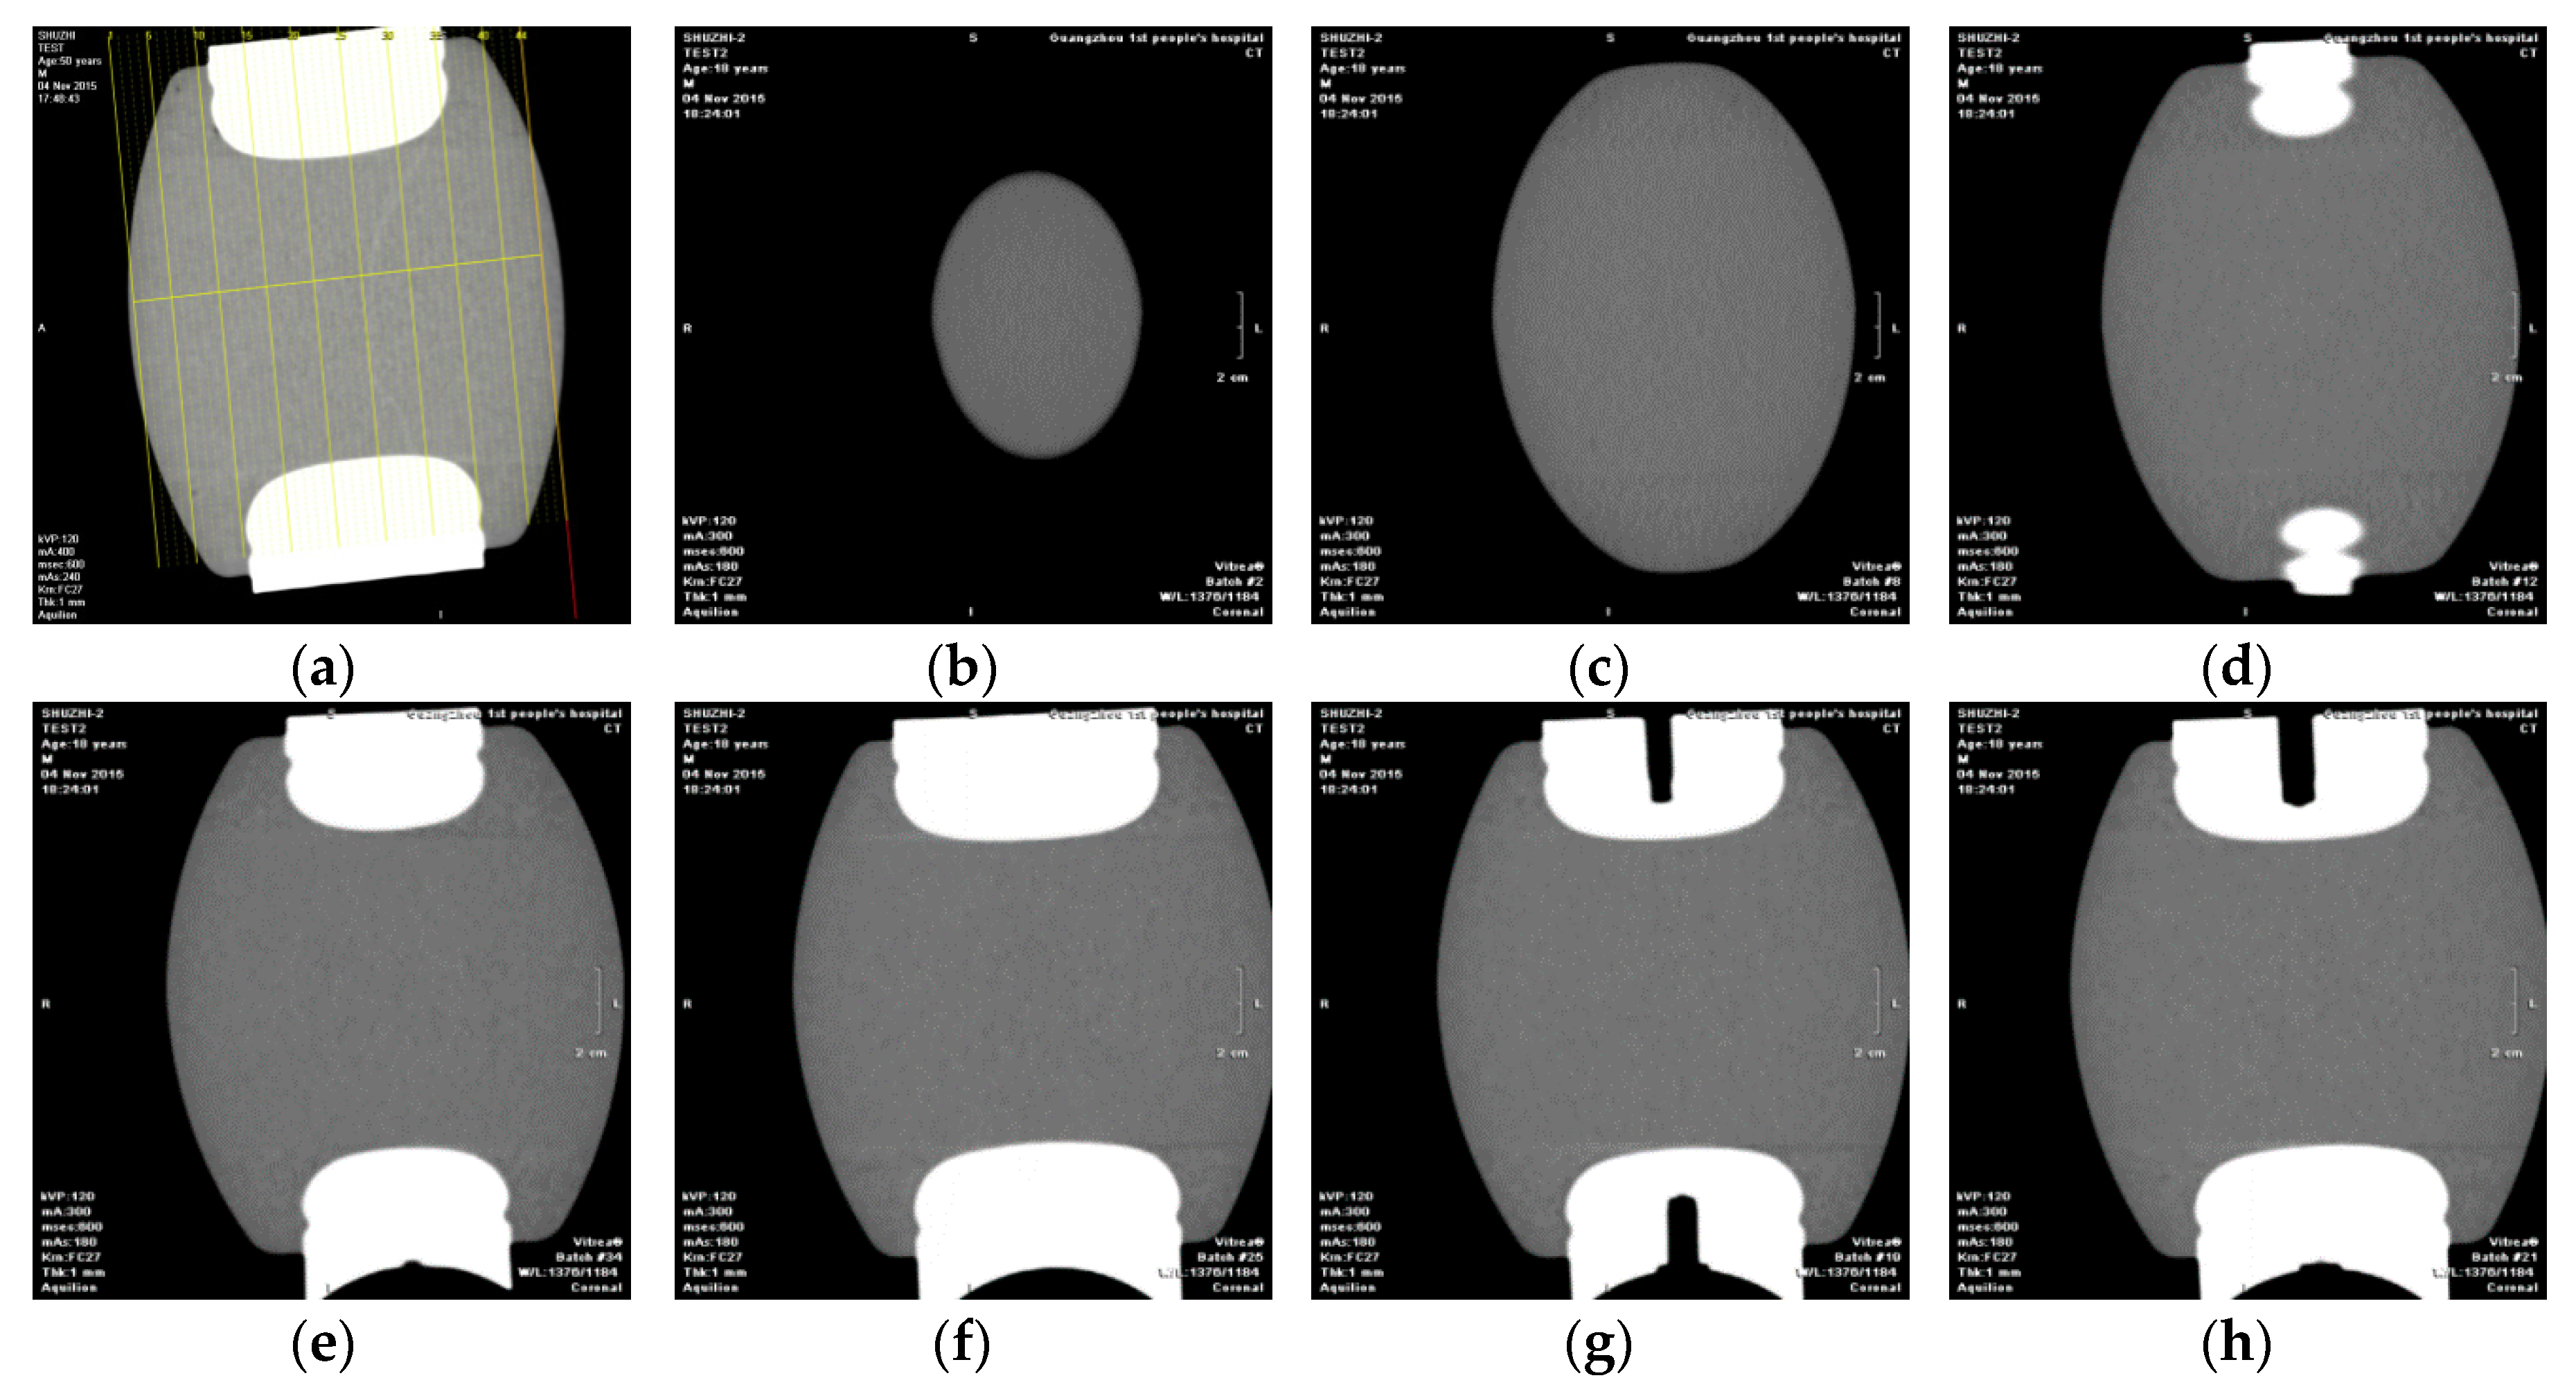
2.2. Experiment Method
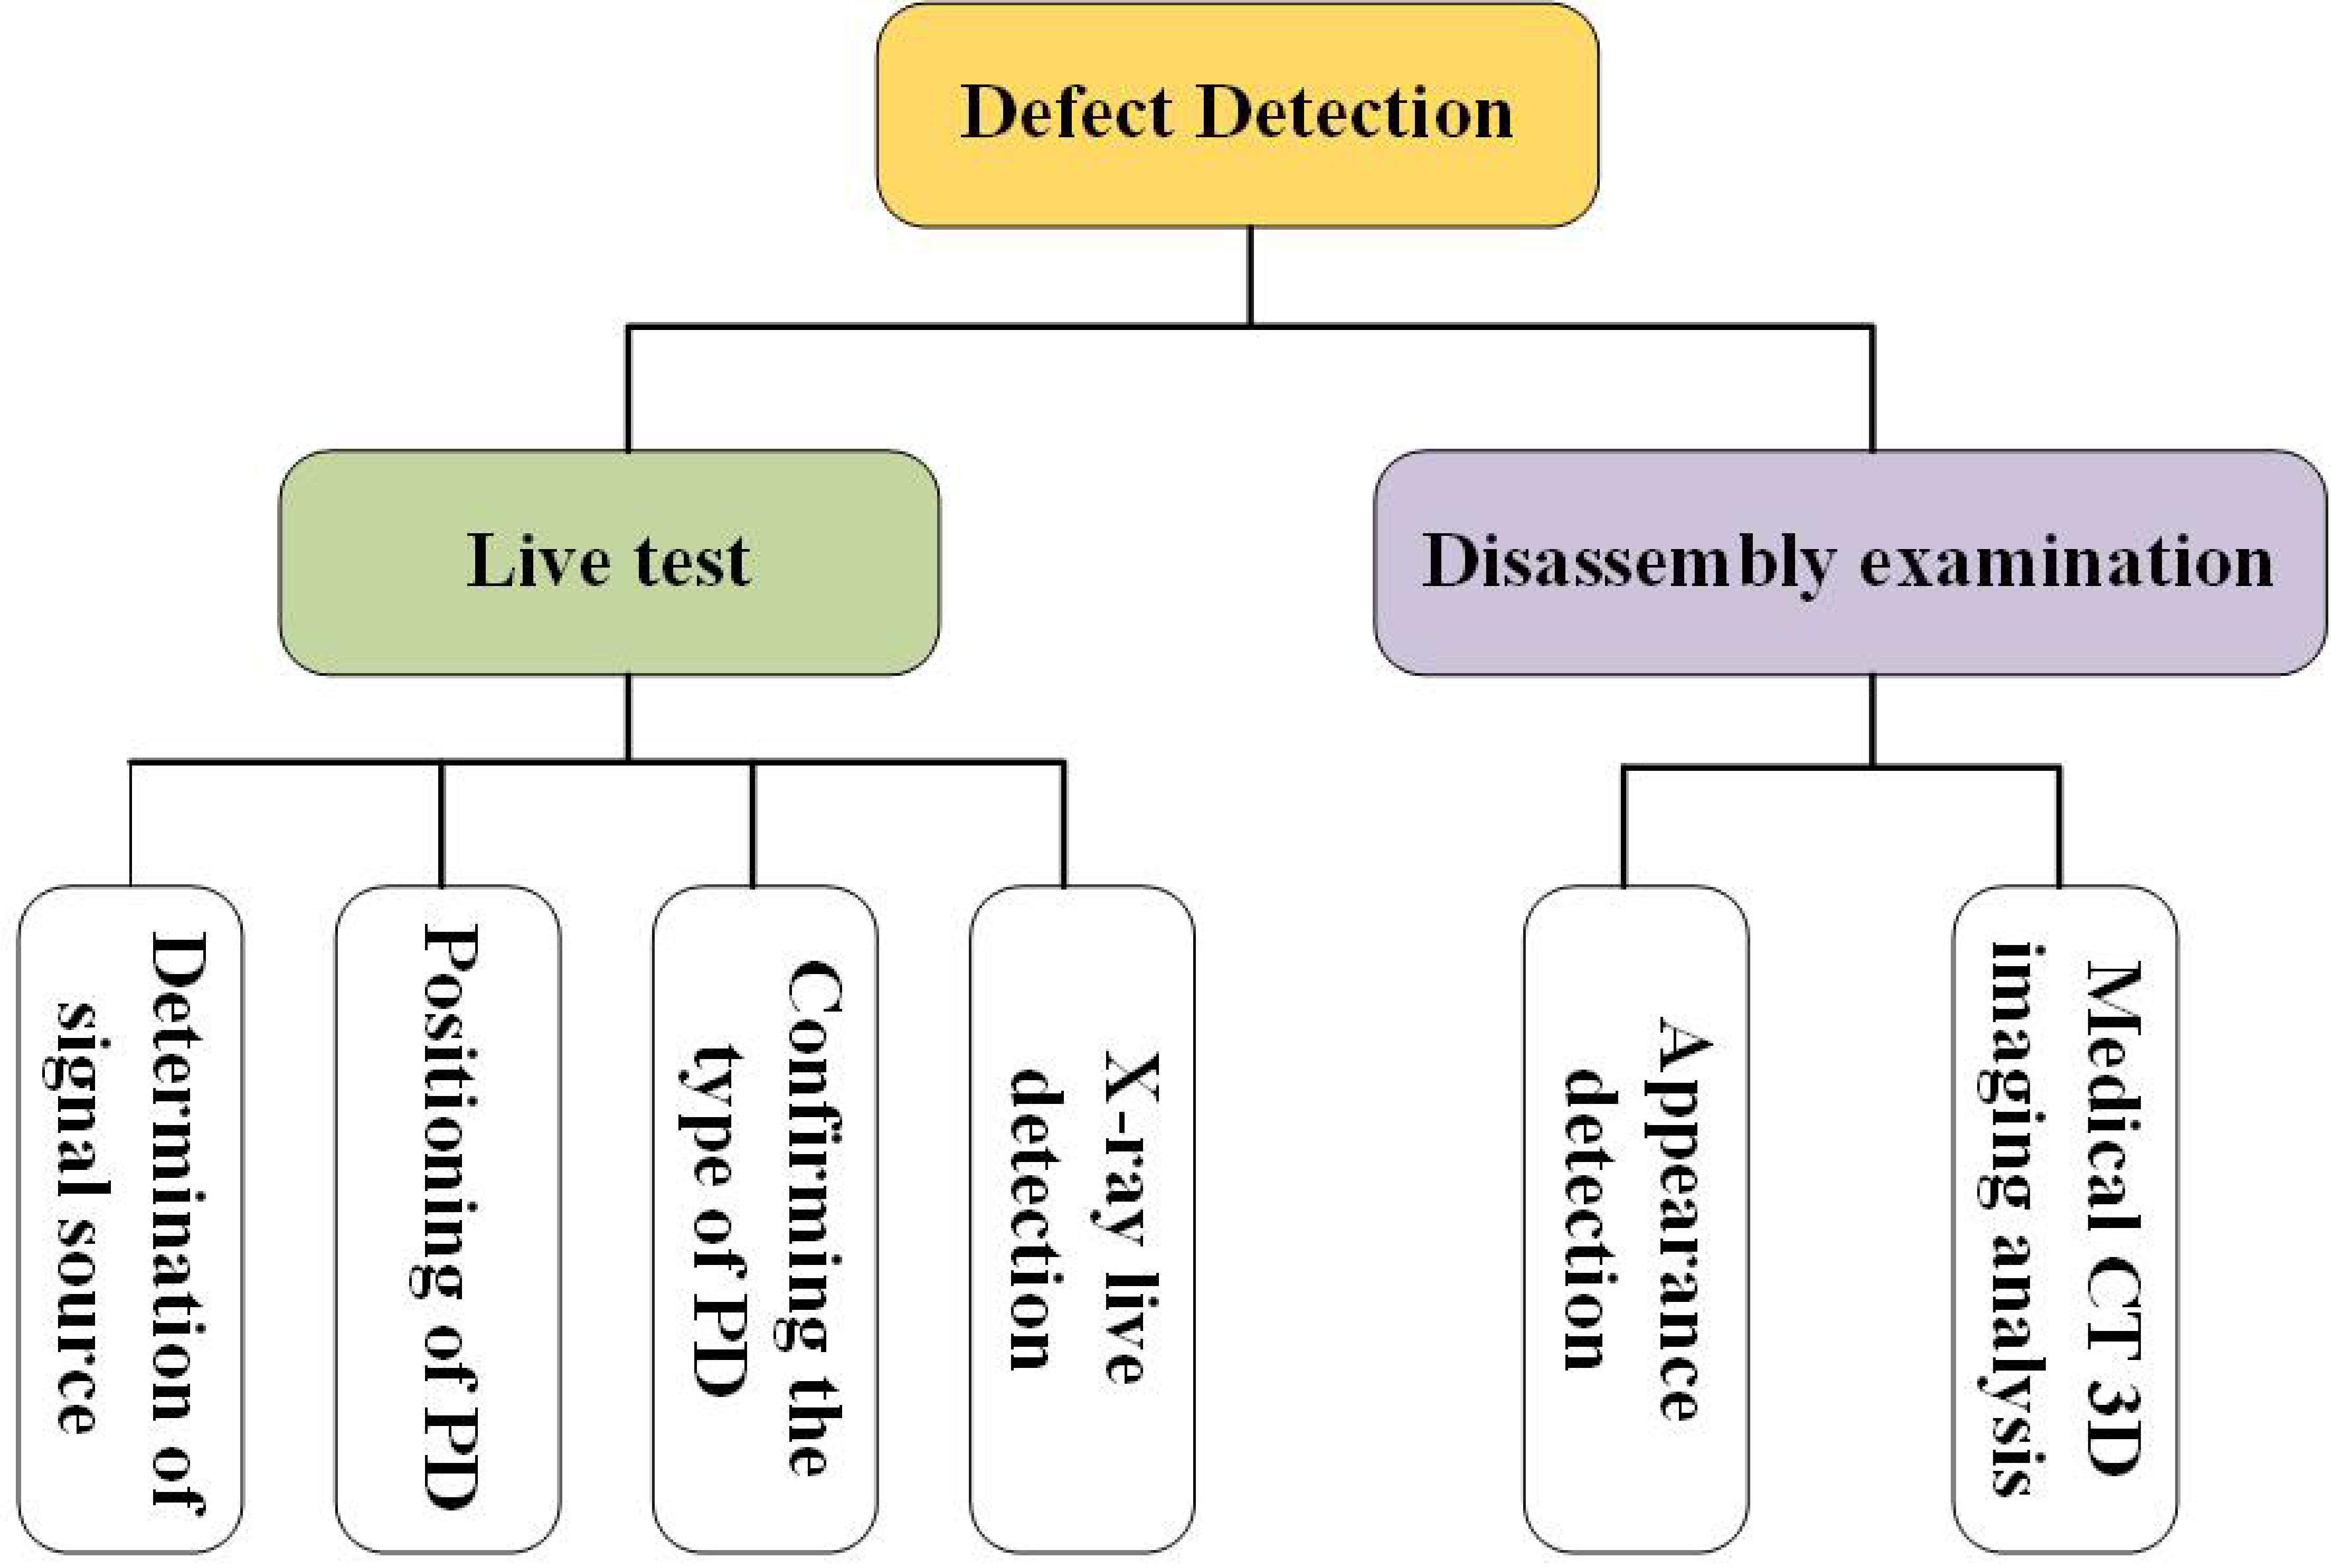
3. Results and Discussion
3.1. Live Test
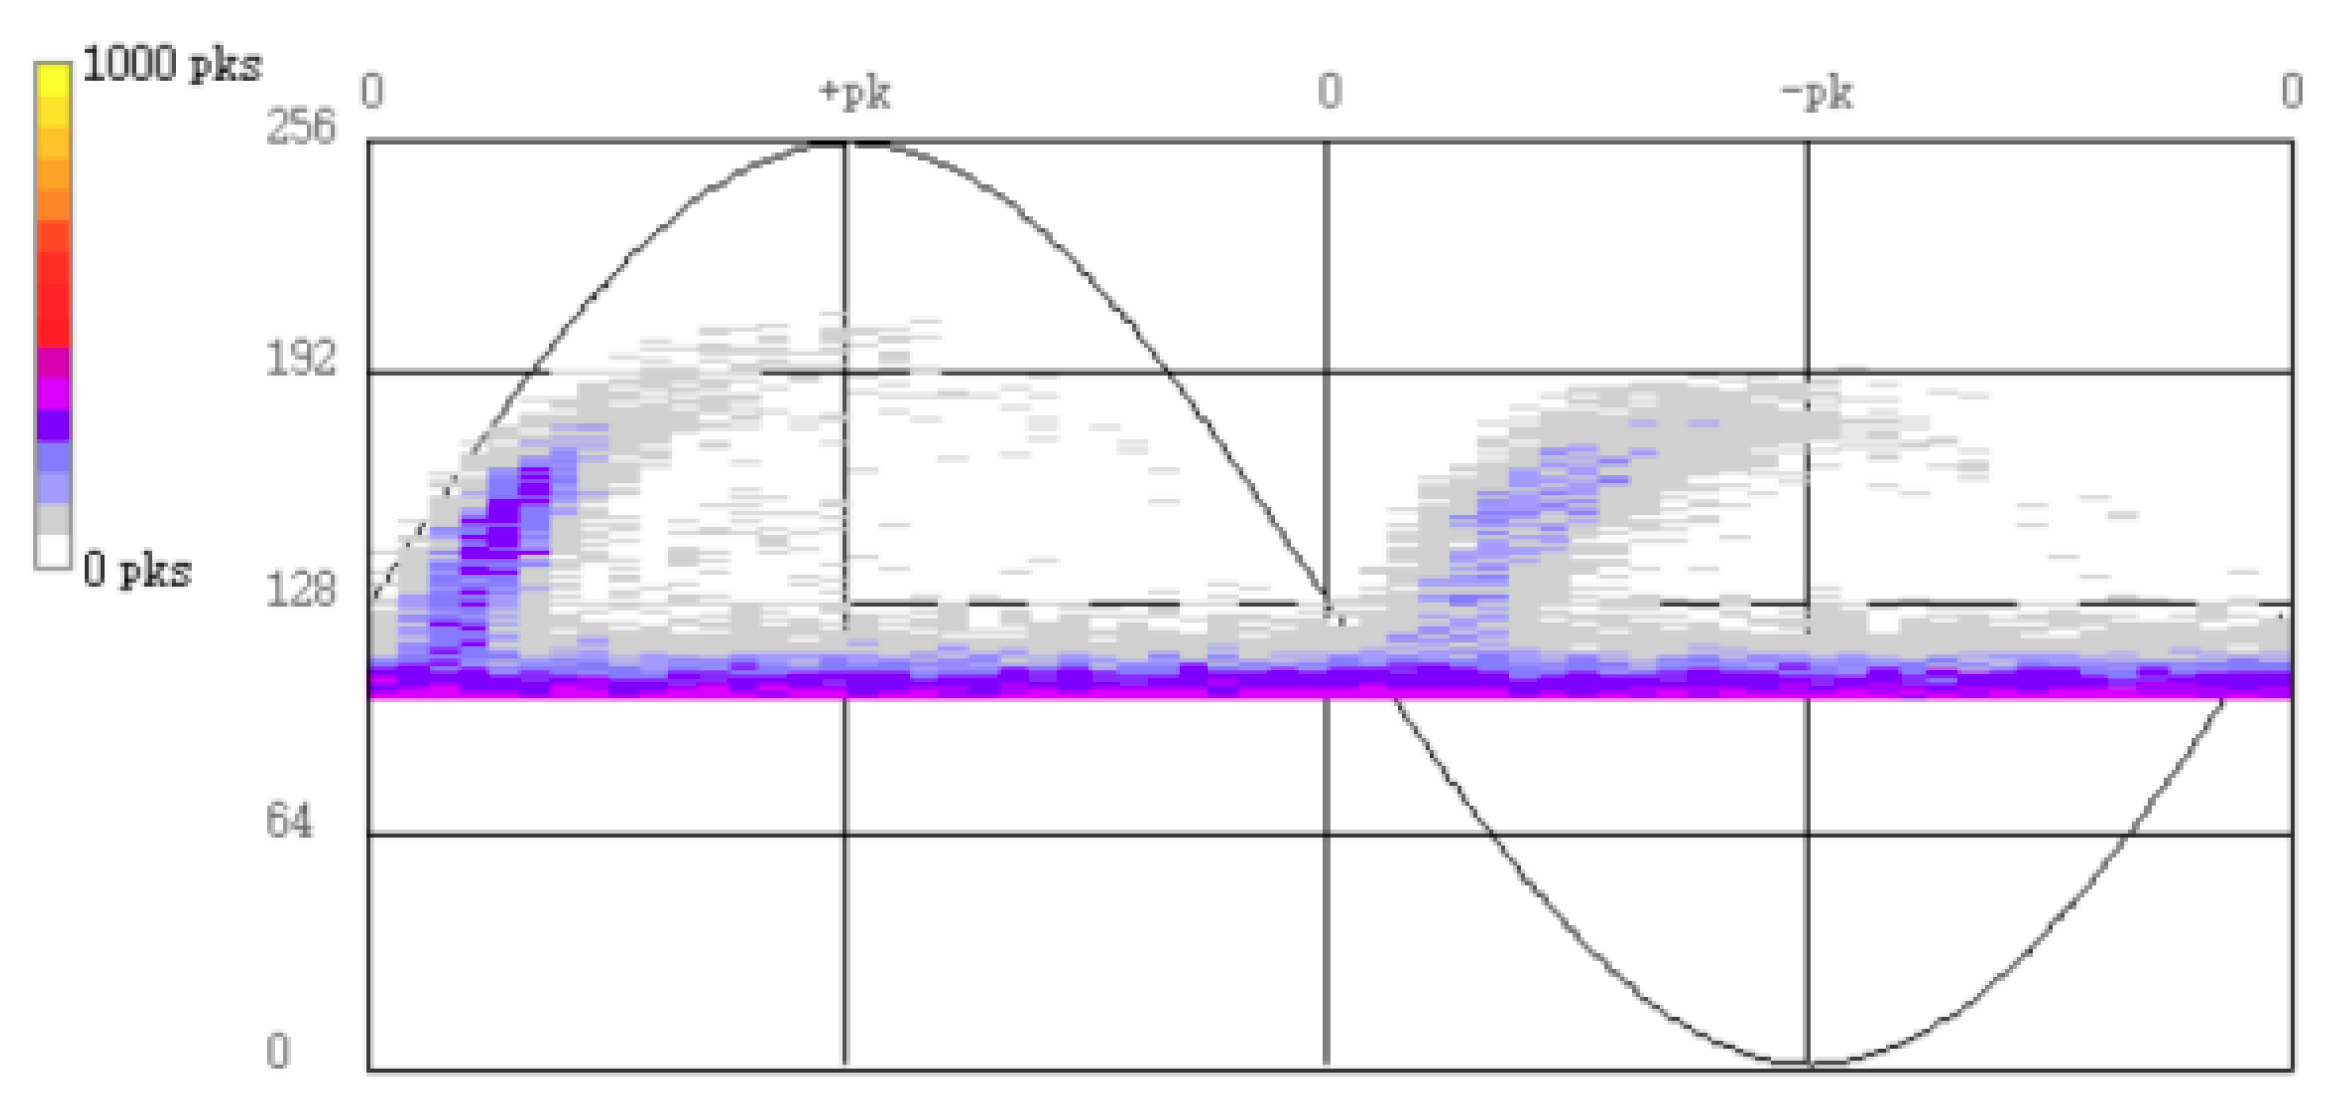
3.1.1. Determination of Signal Source
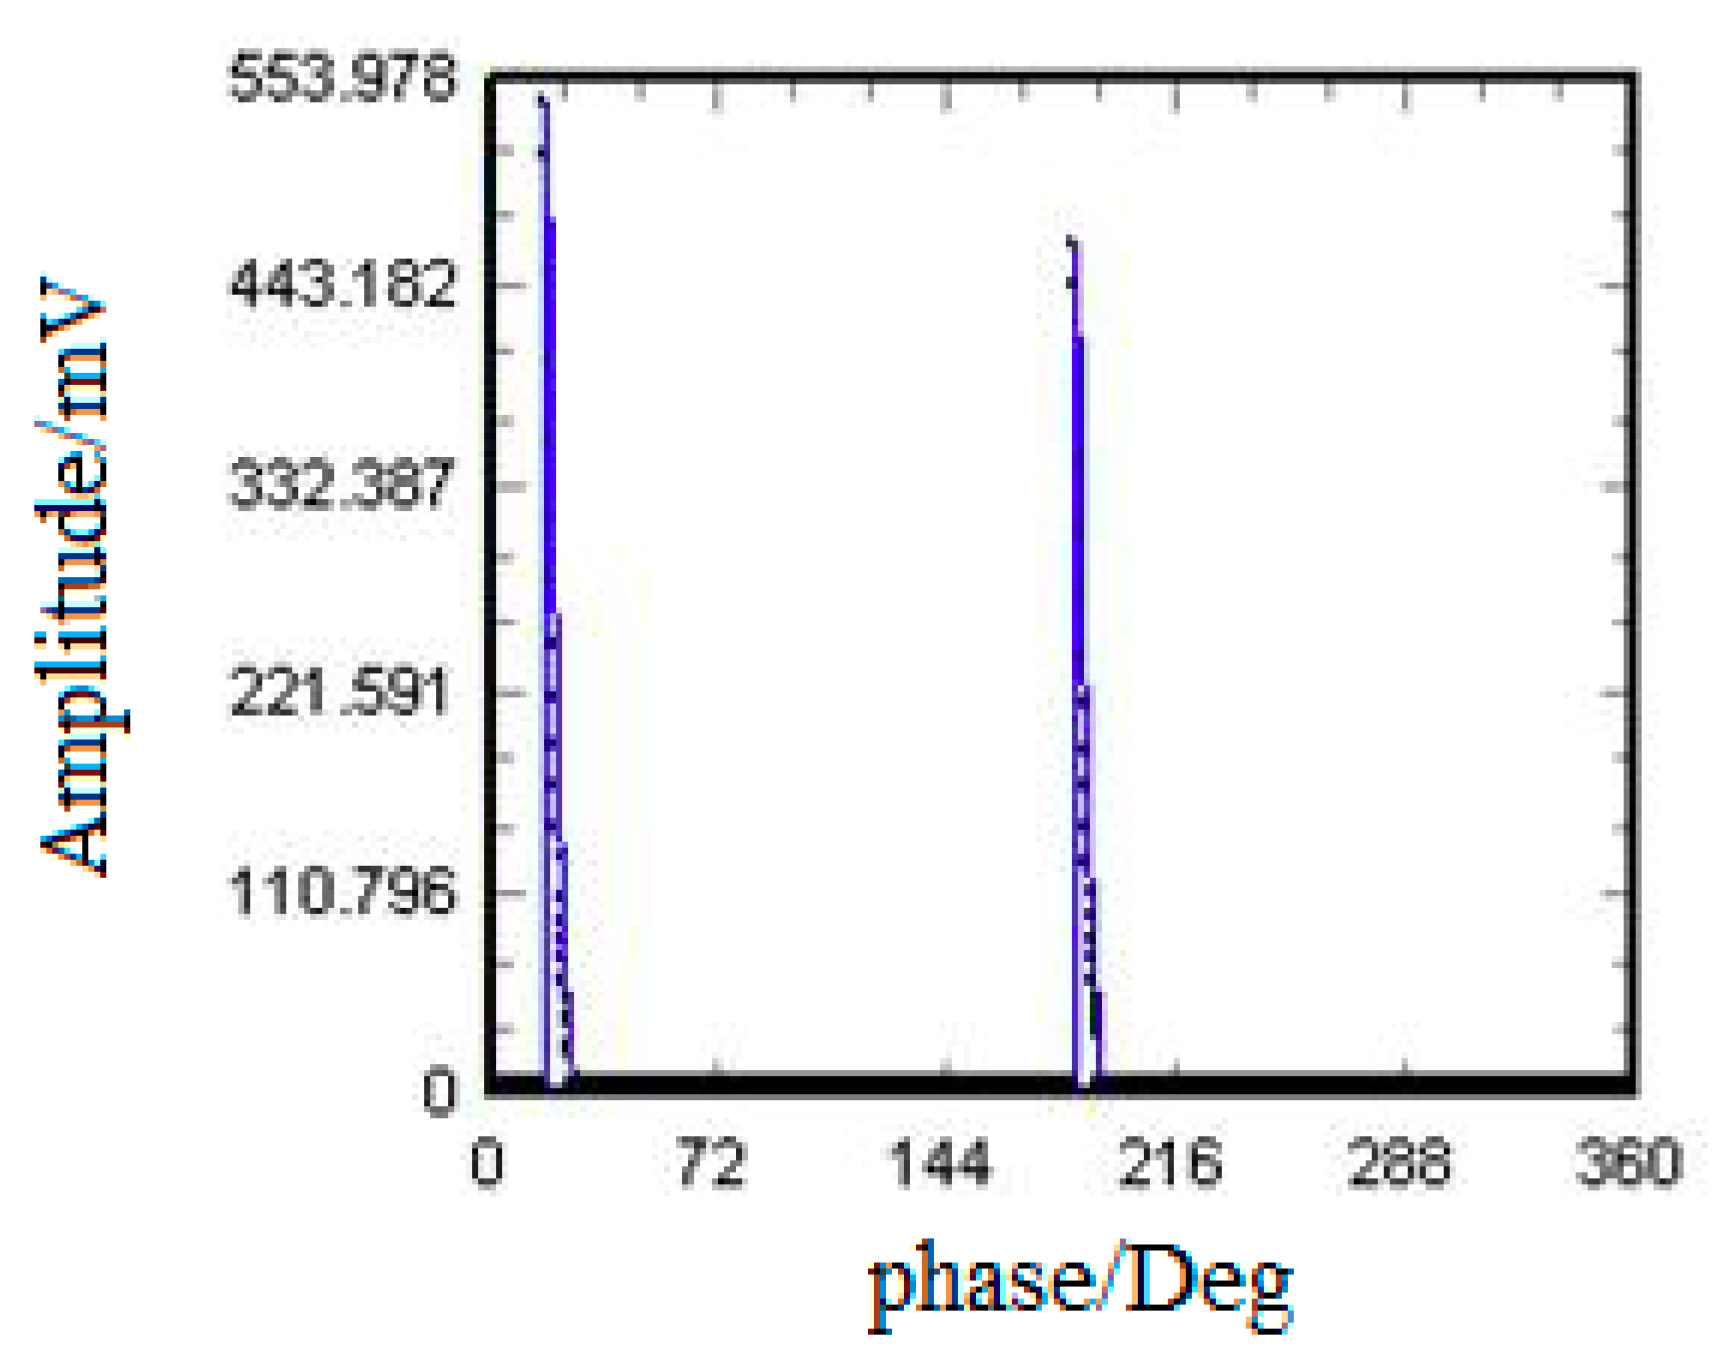
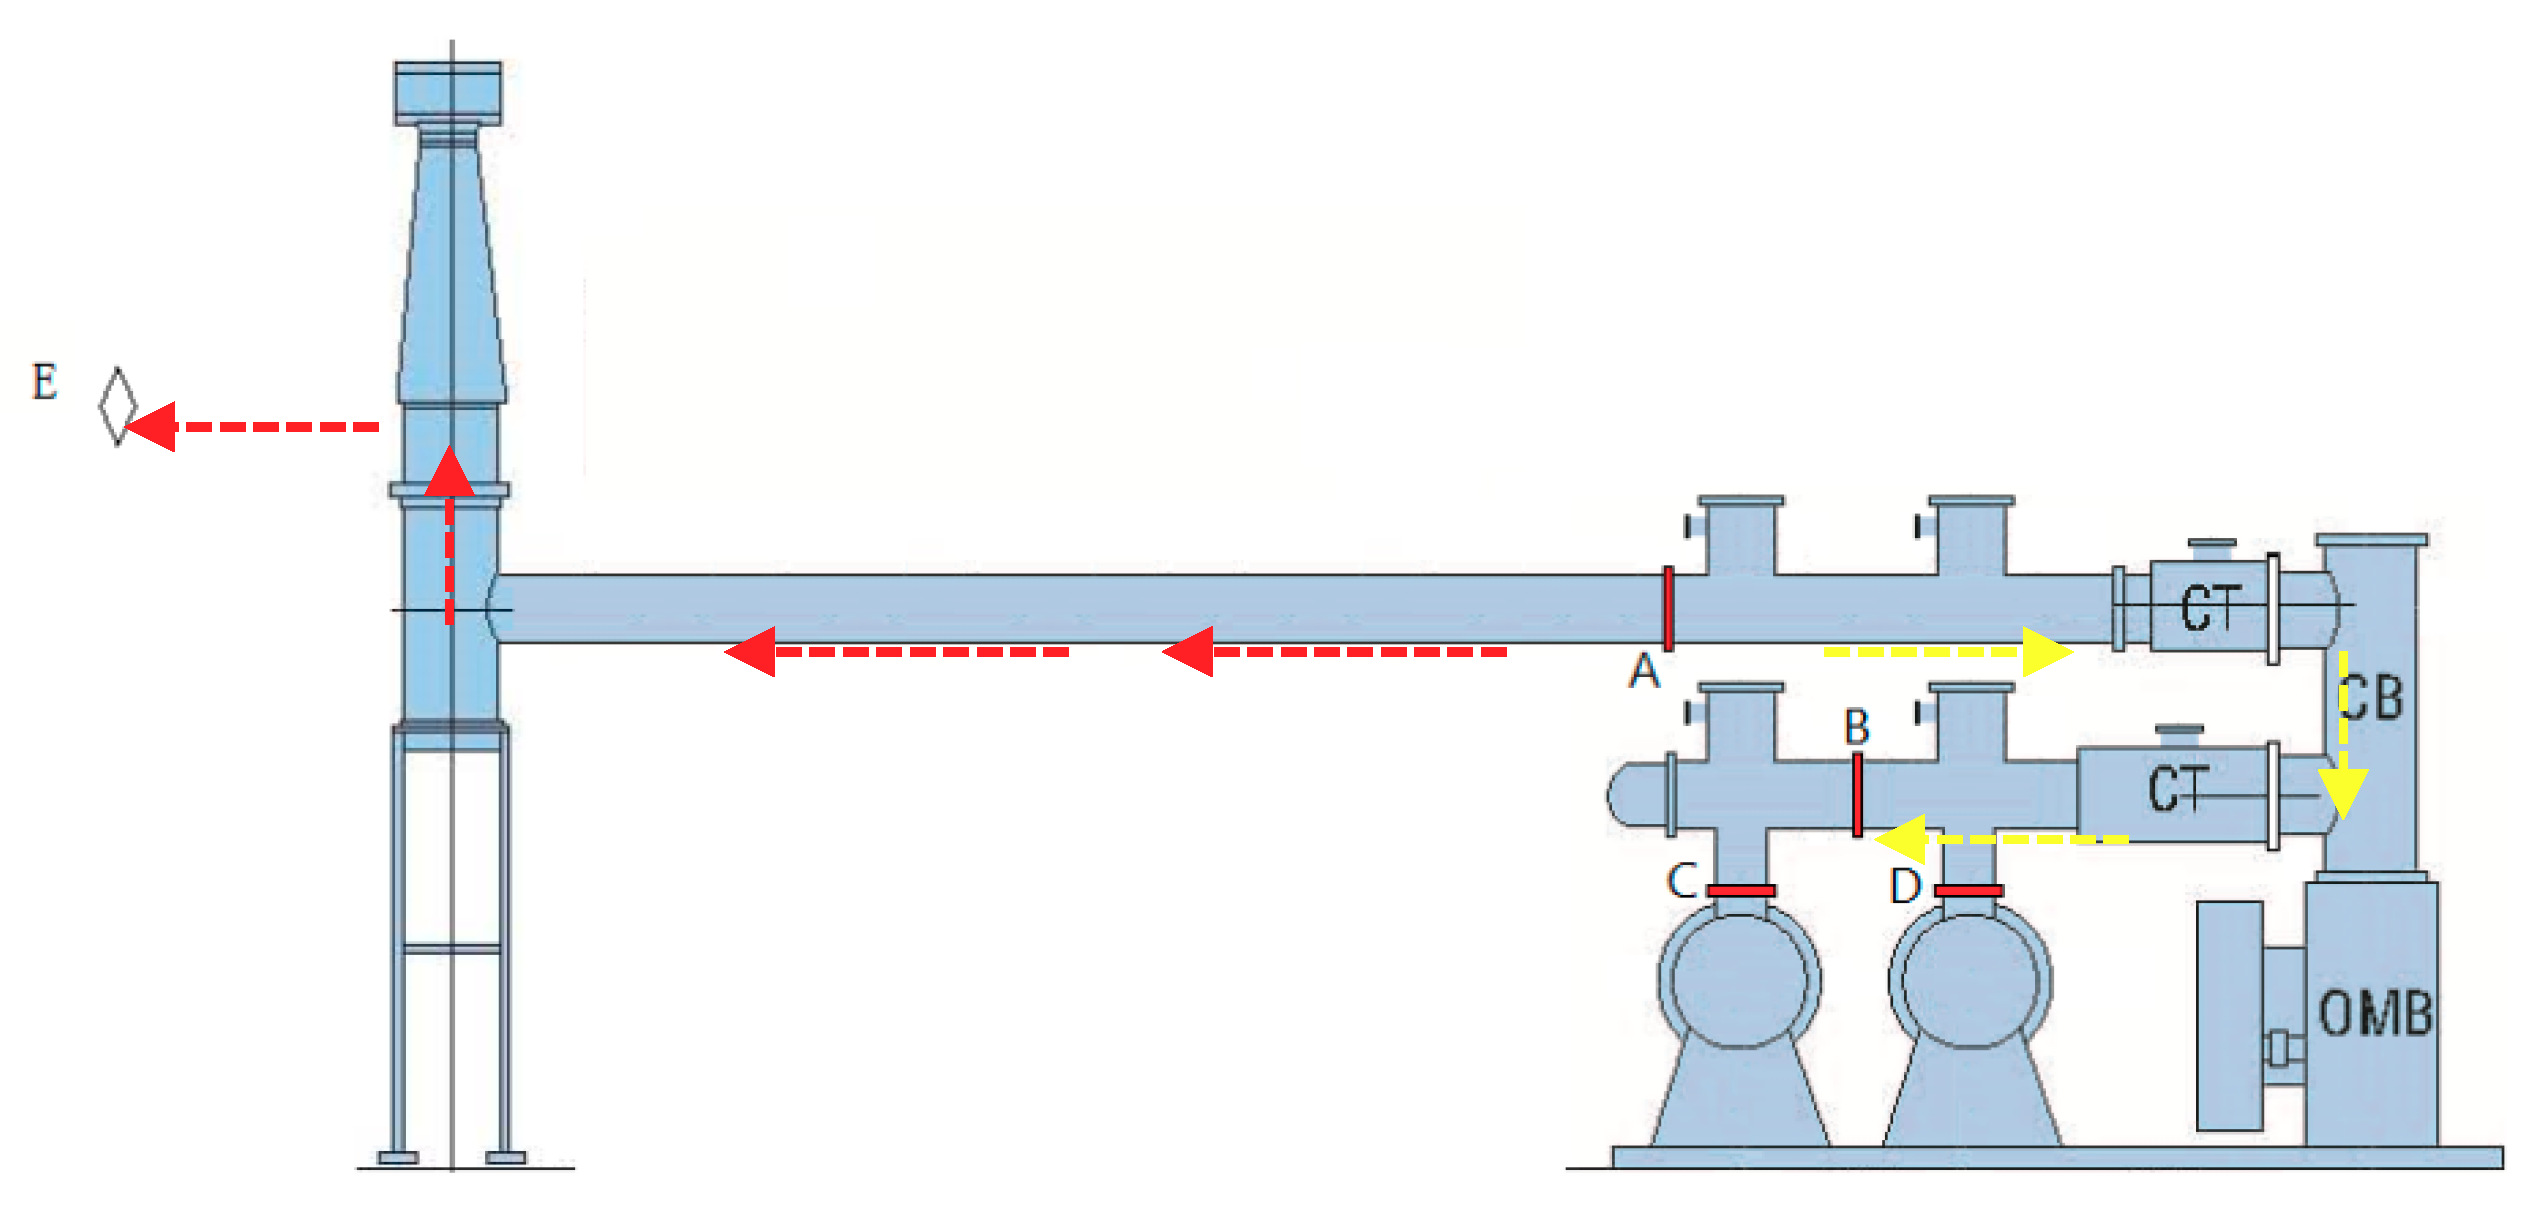
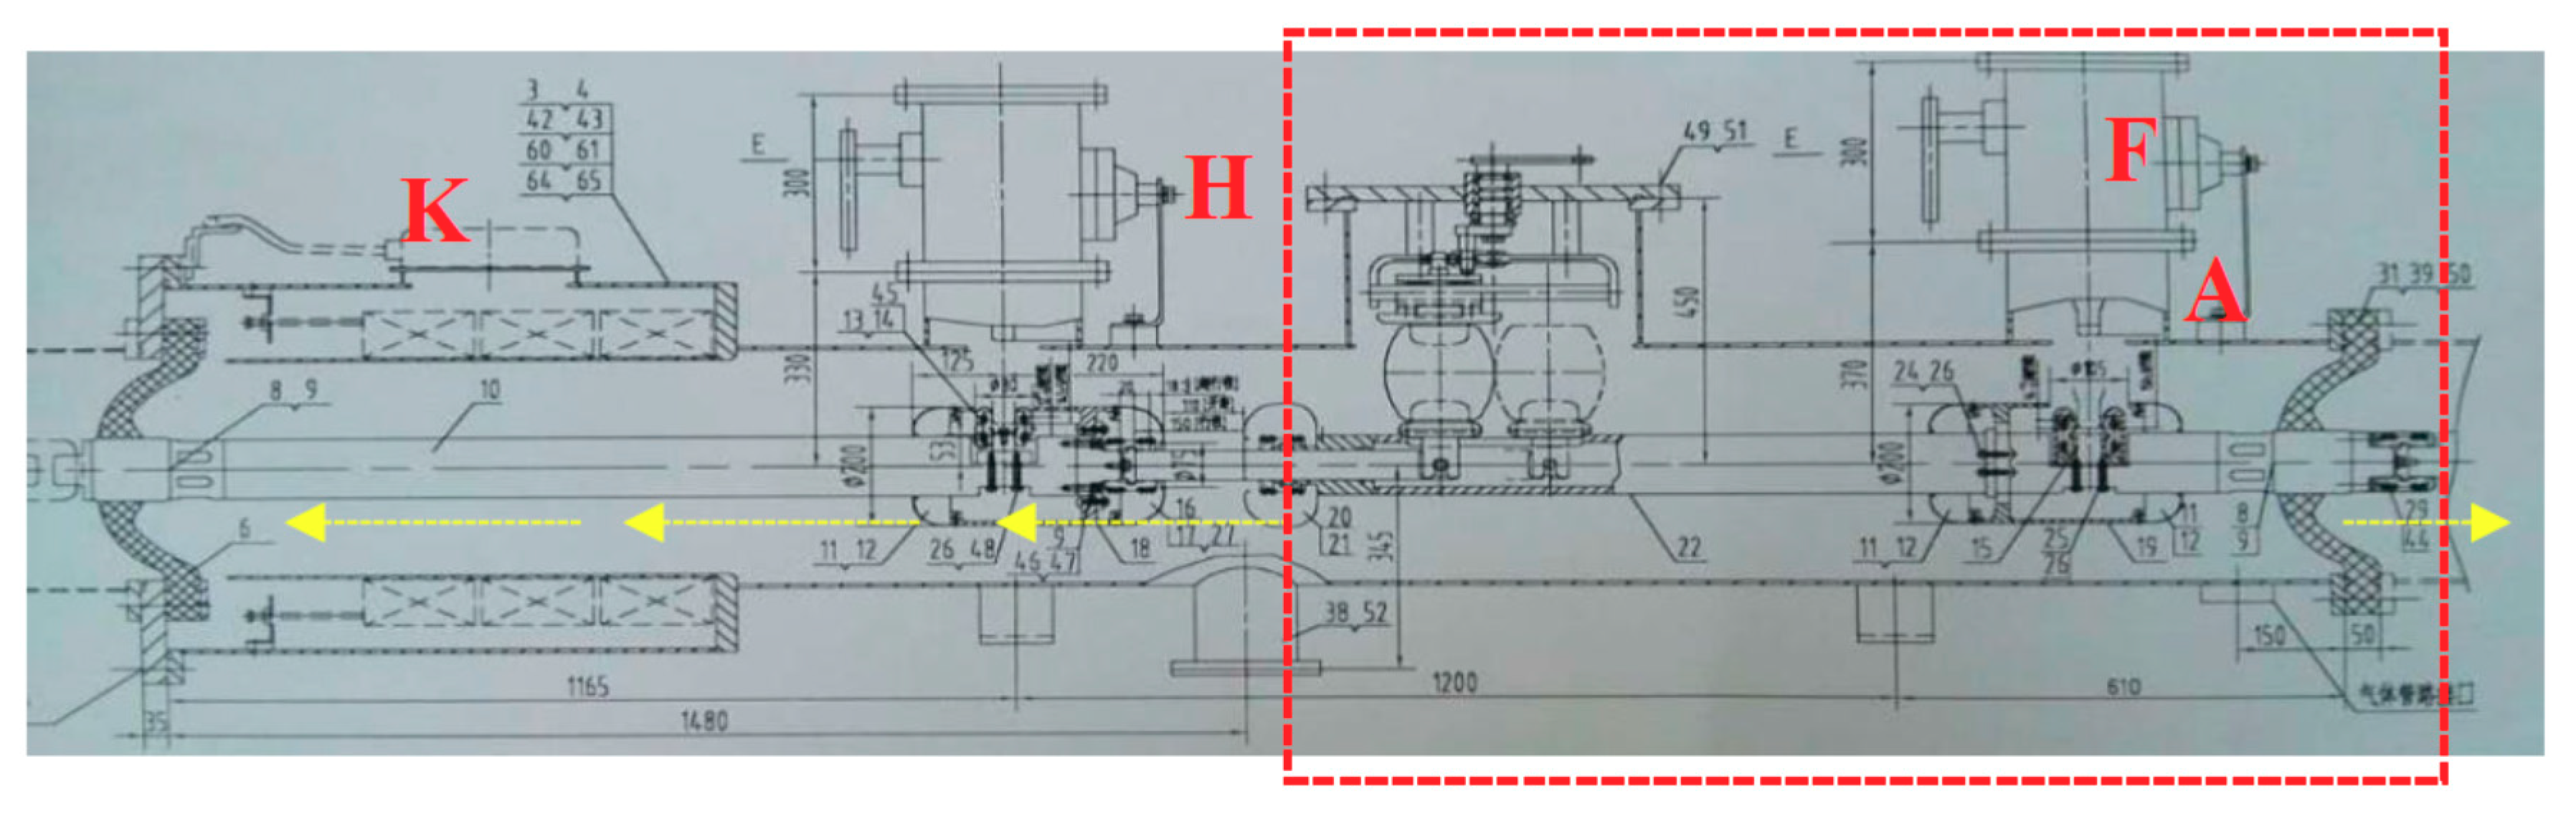
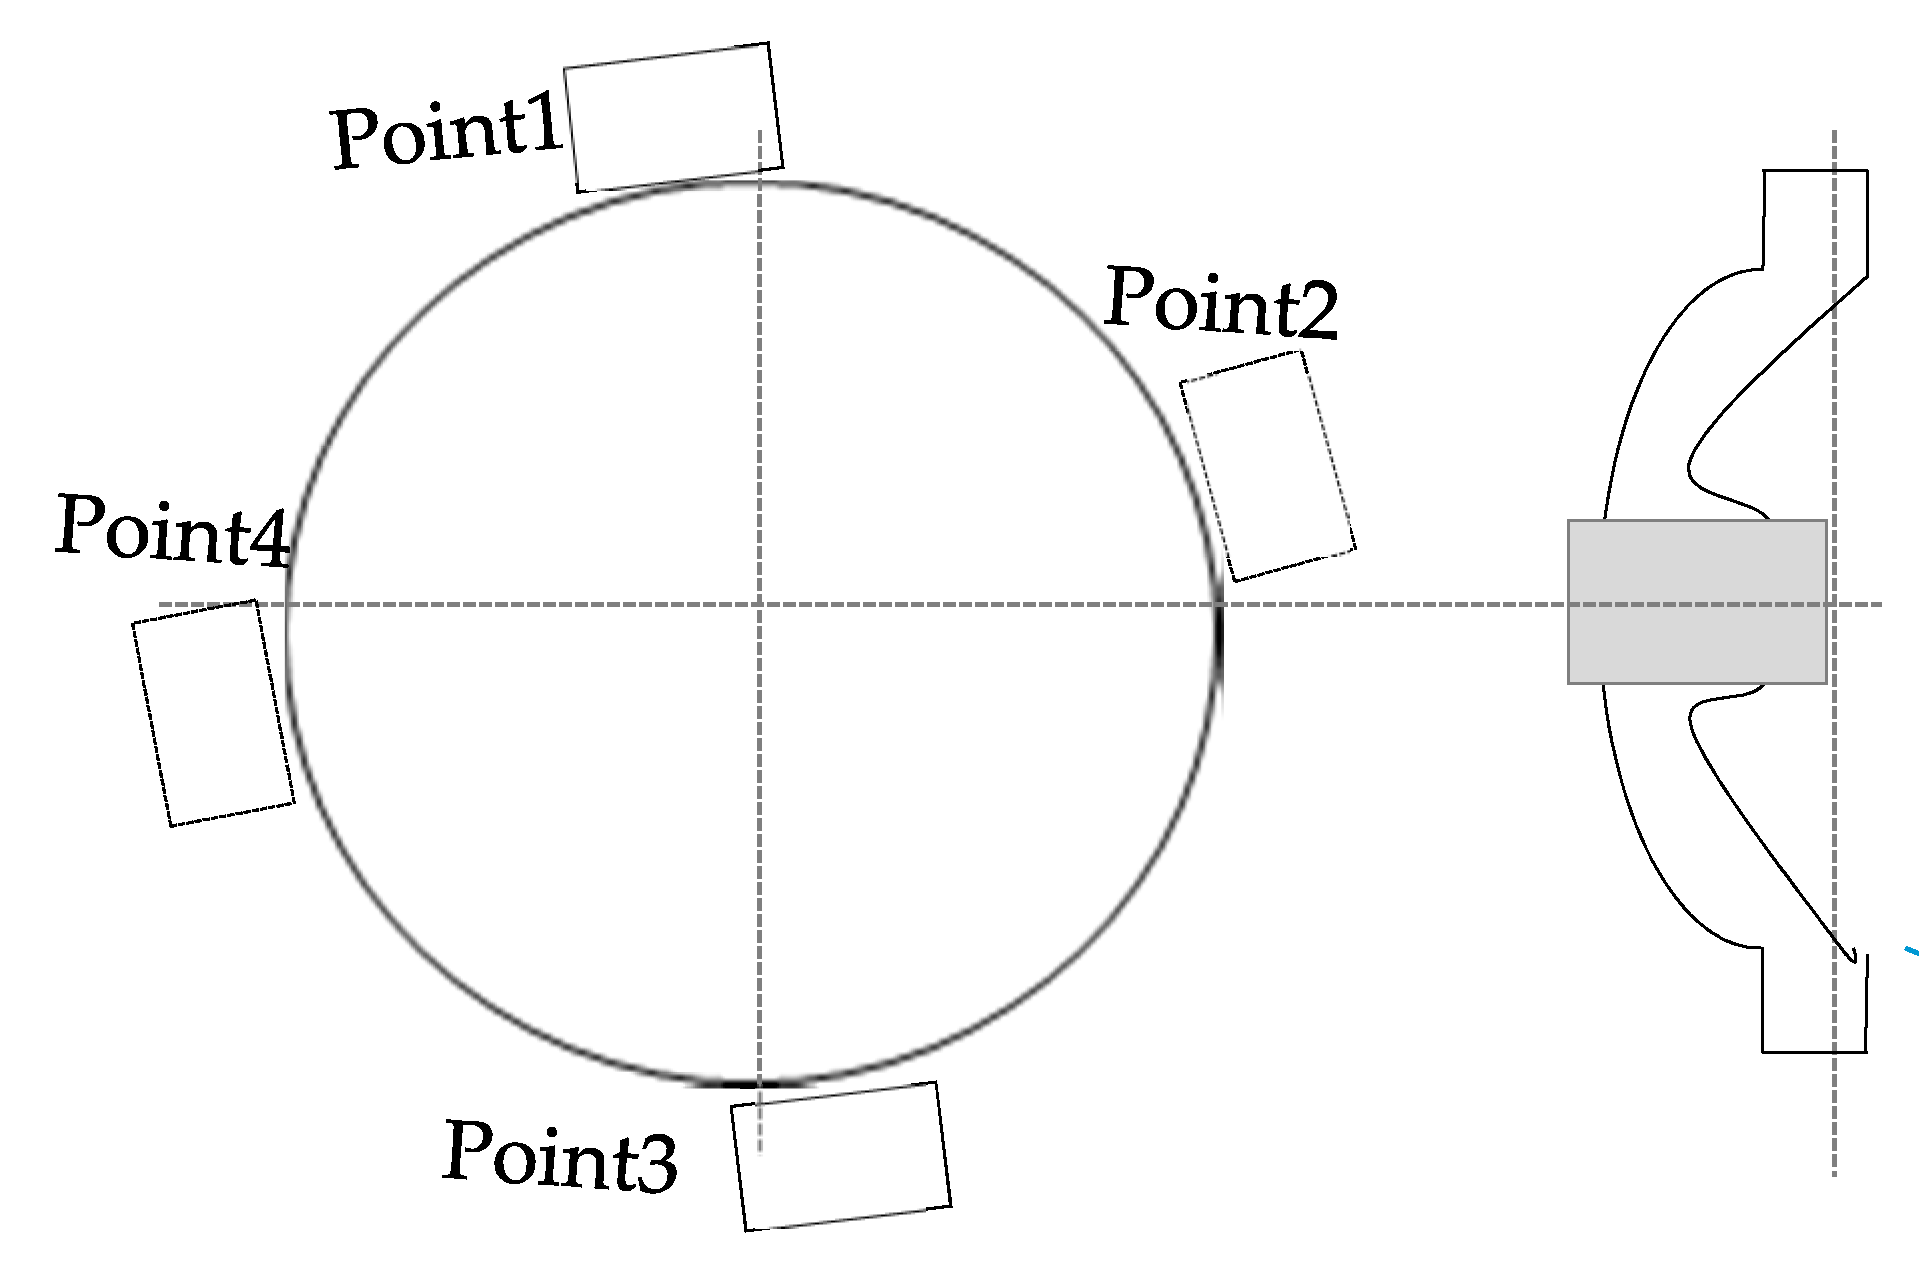
3.1.2. Positioning of PD
- UHF partial discharge detection based on multi-stage amplified signal conditioning and multiple weighted averages
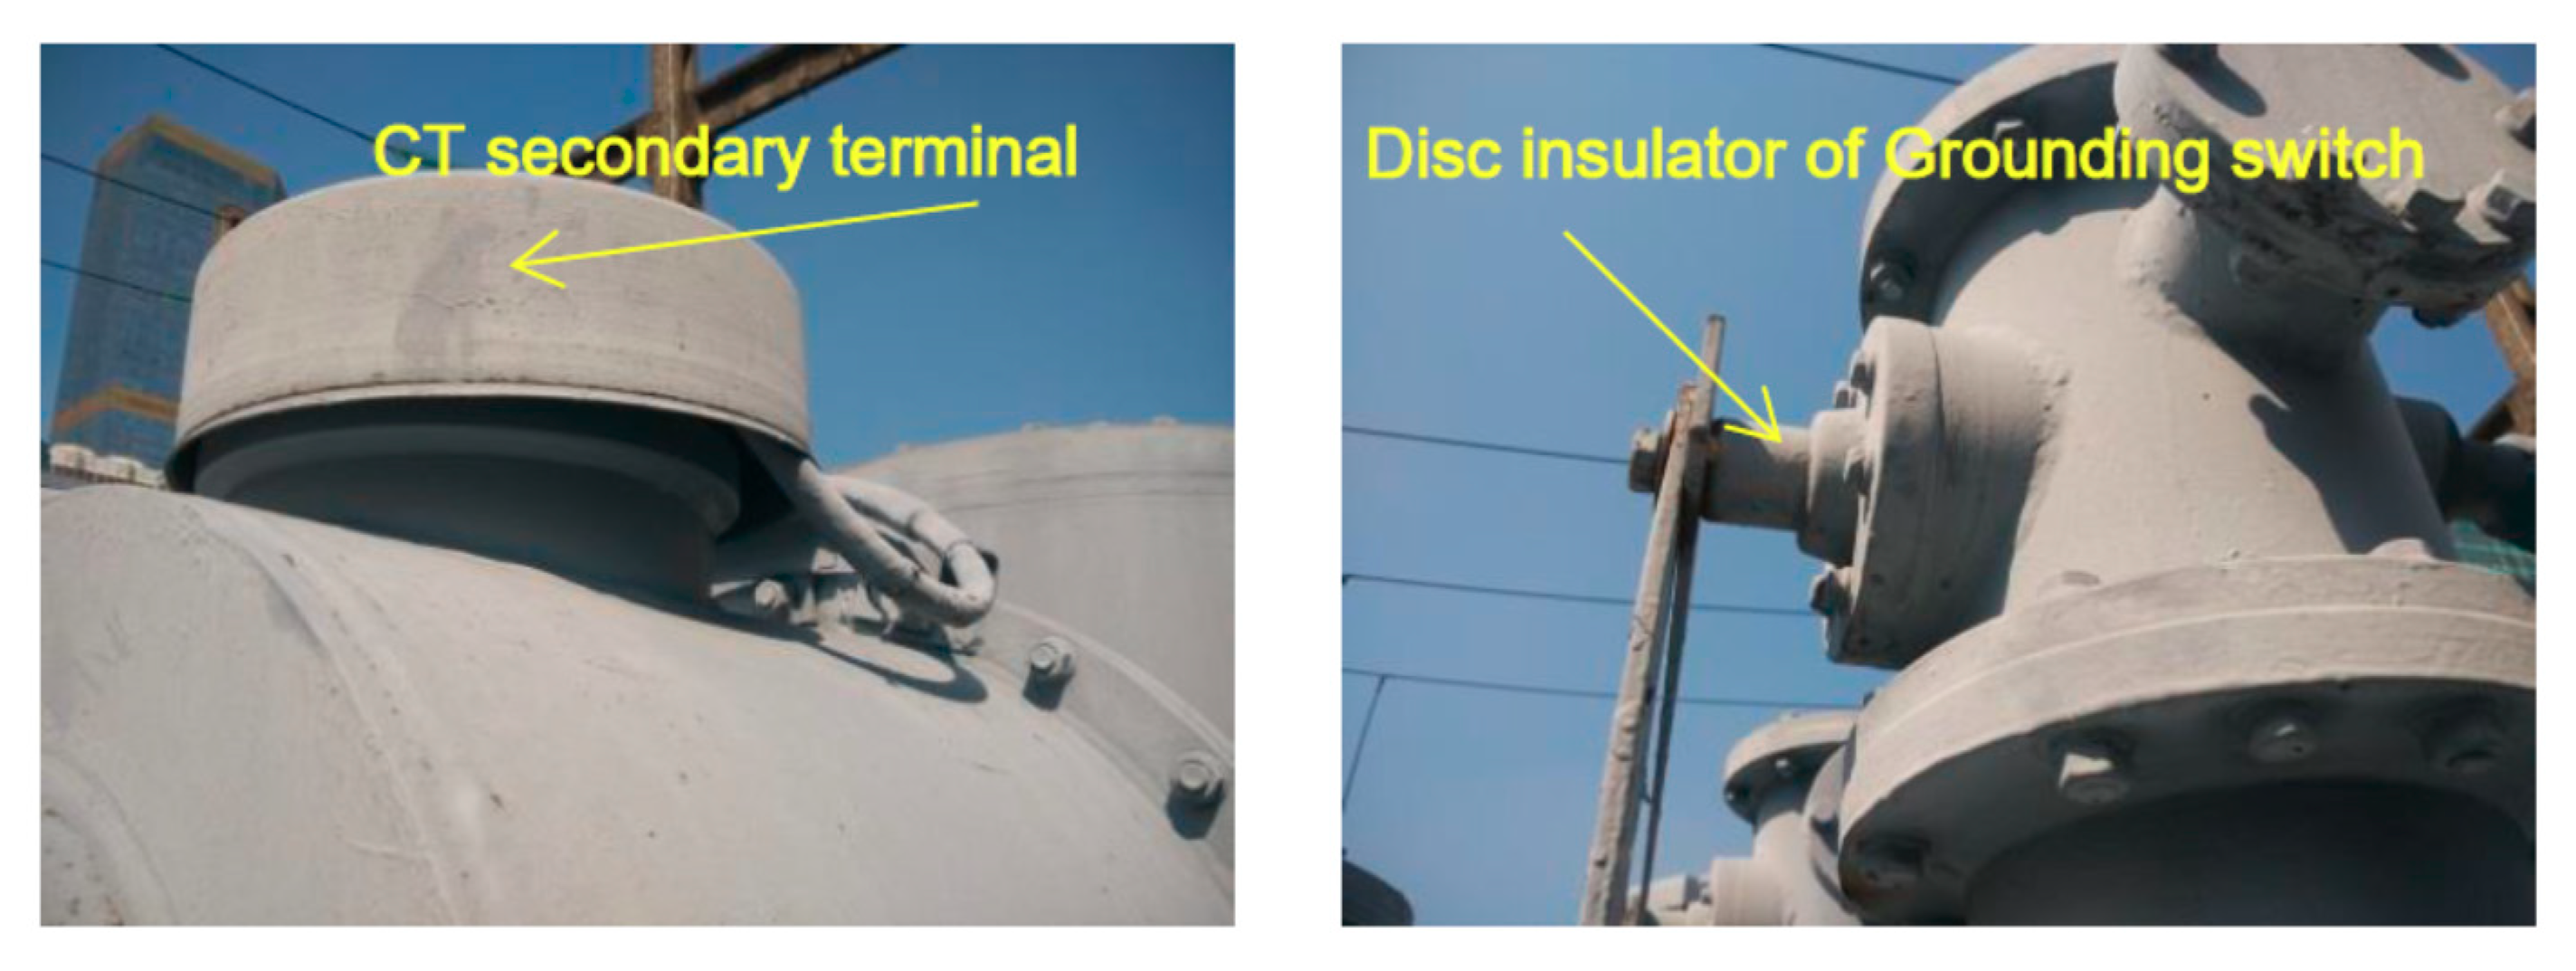
- The partial discharge detection based on the signal radiated from the hole of insulation disk at the ground connection
- The positioning method based on UHF-SHF
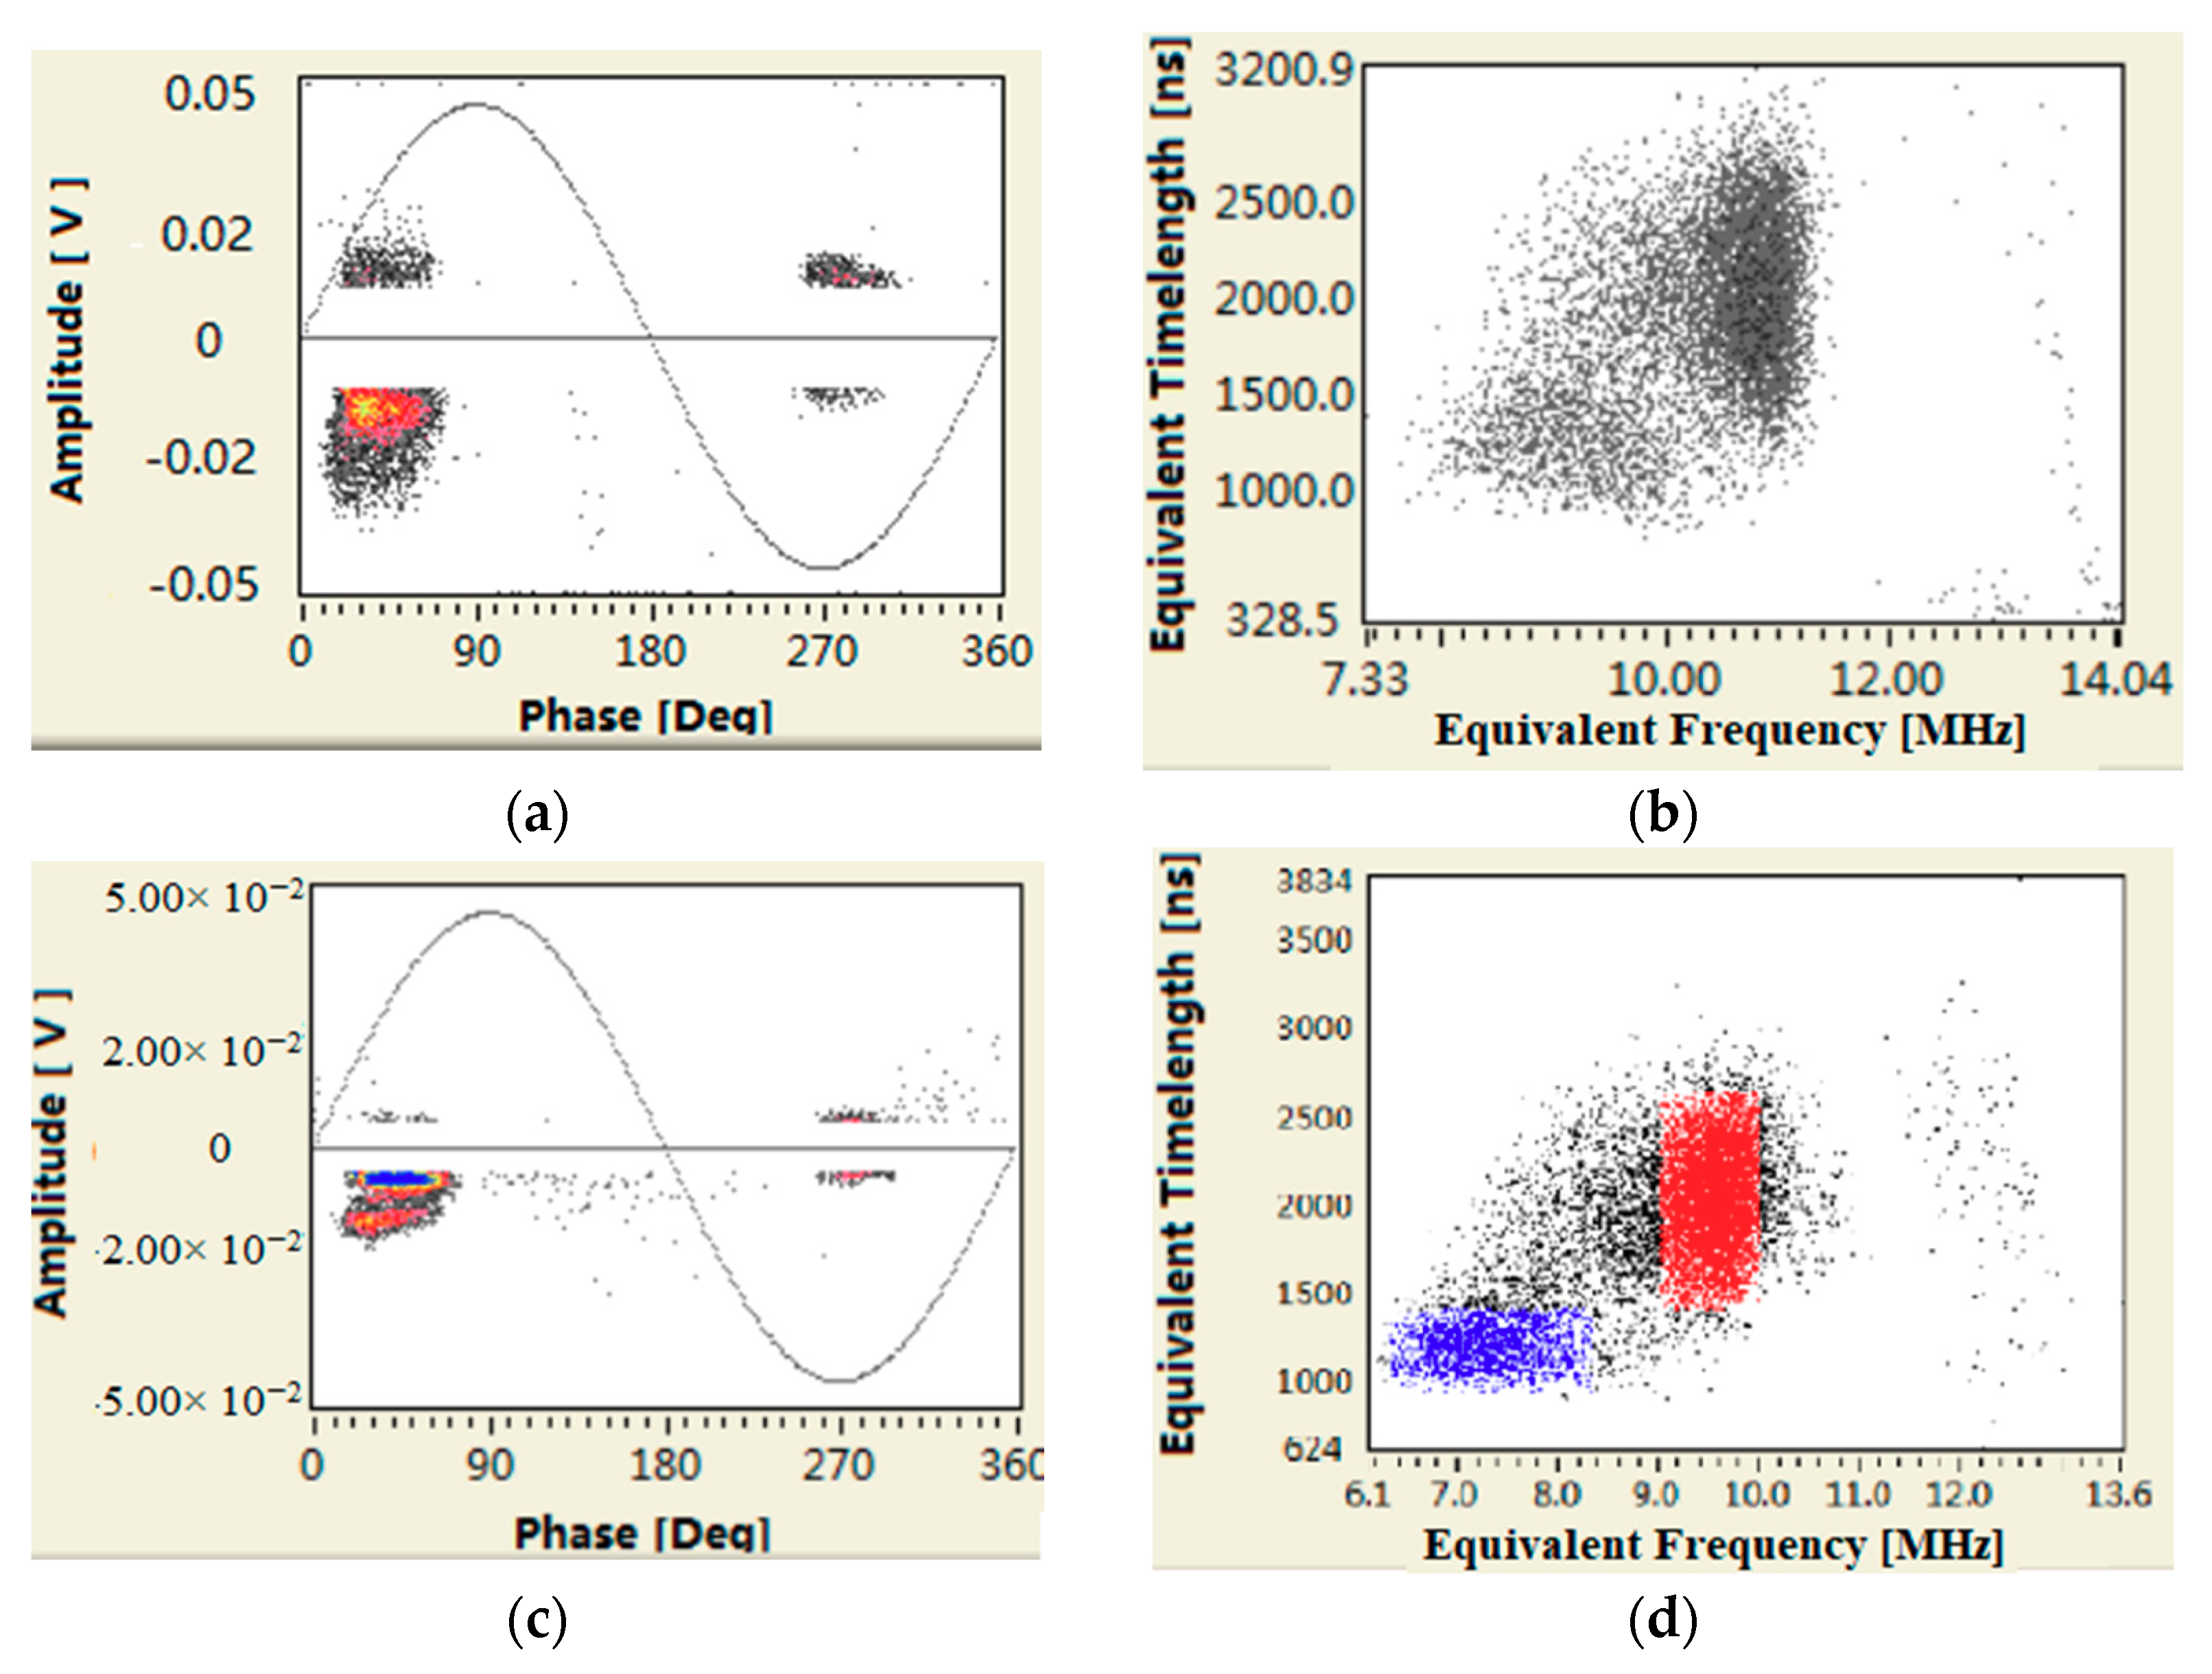
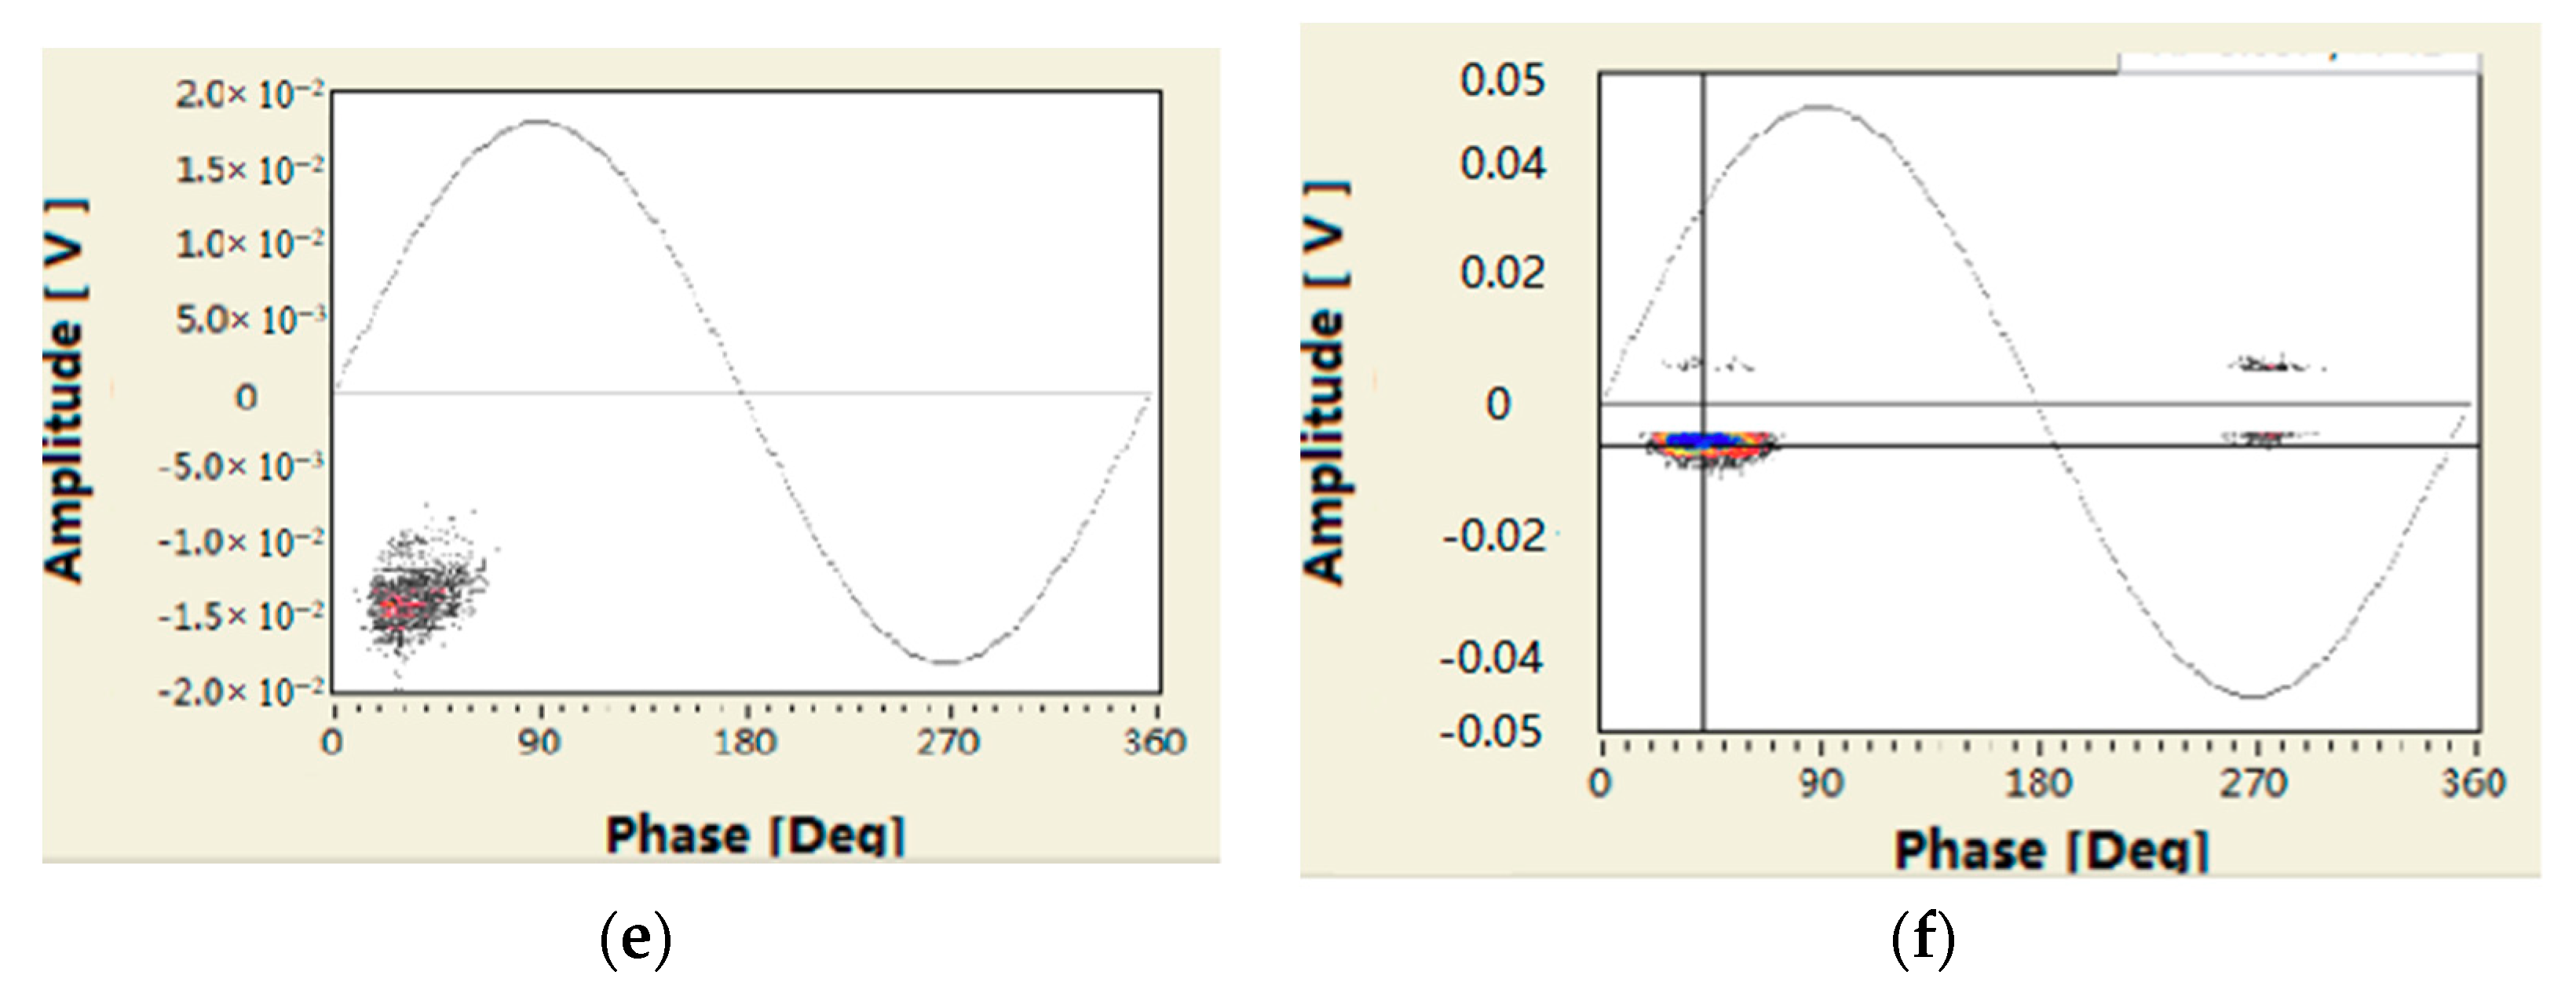
3.1.3. Confirming the Type of PD
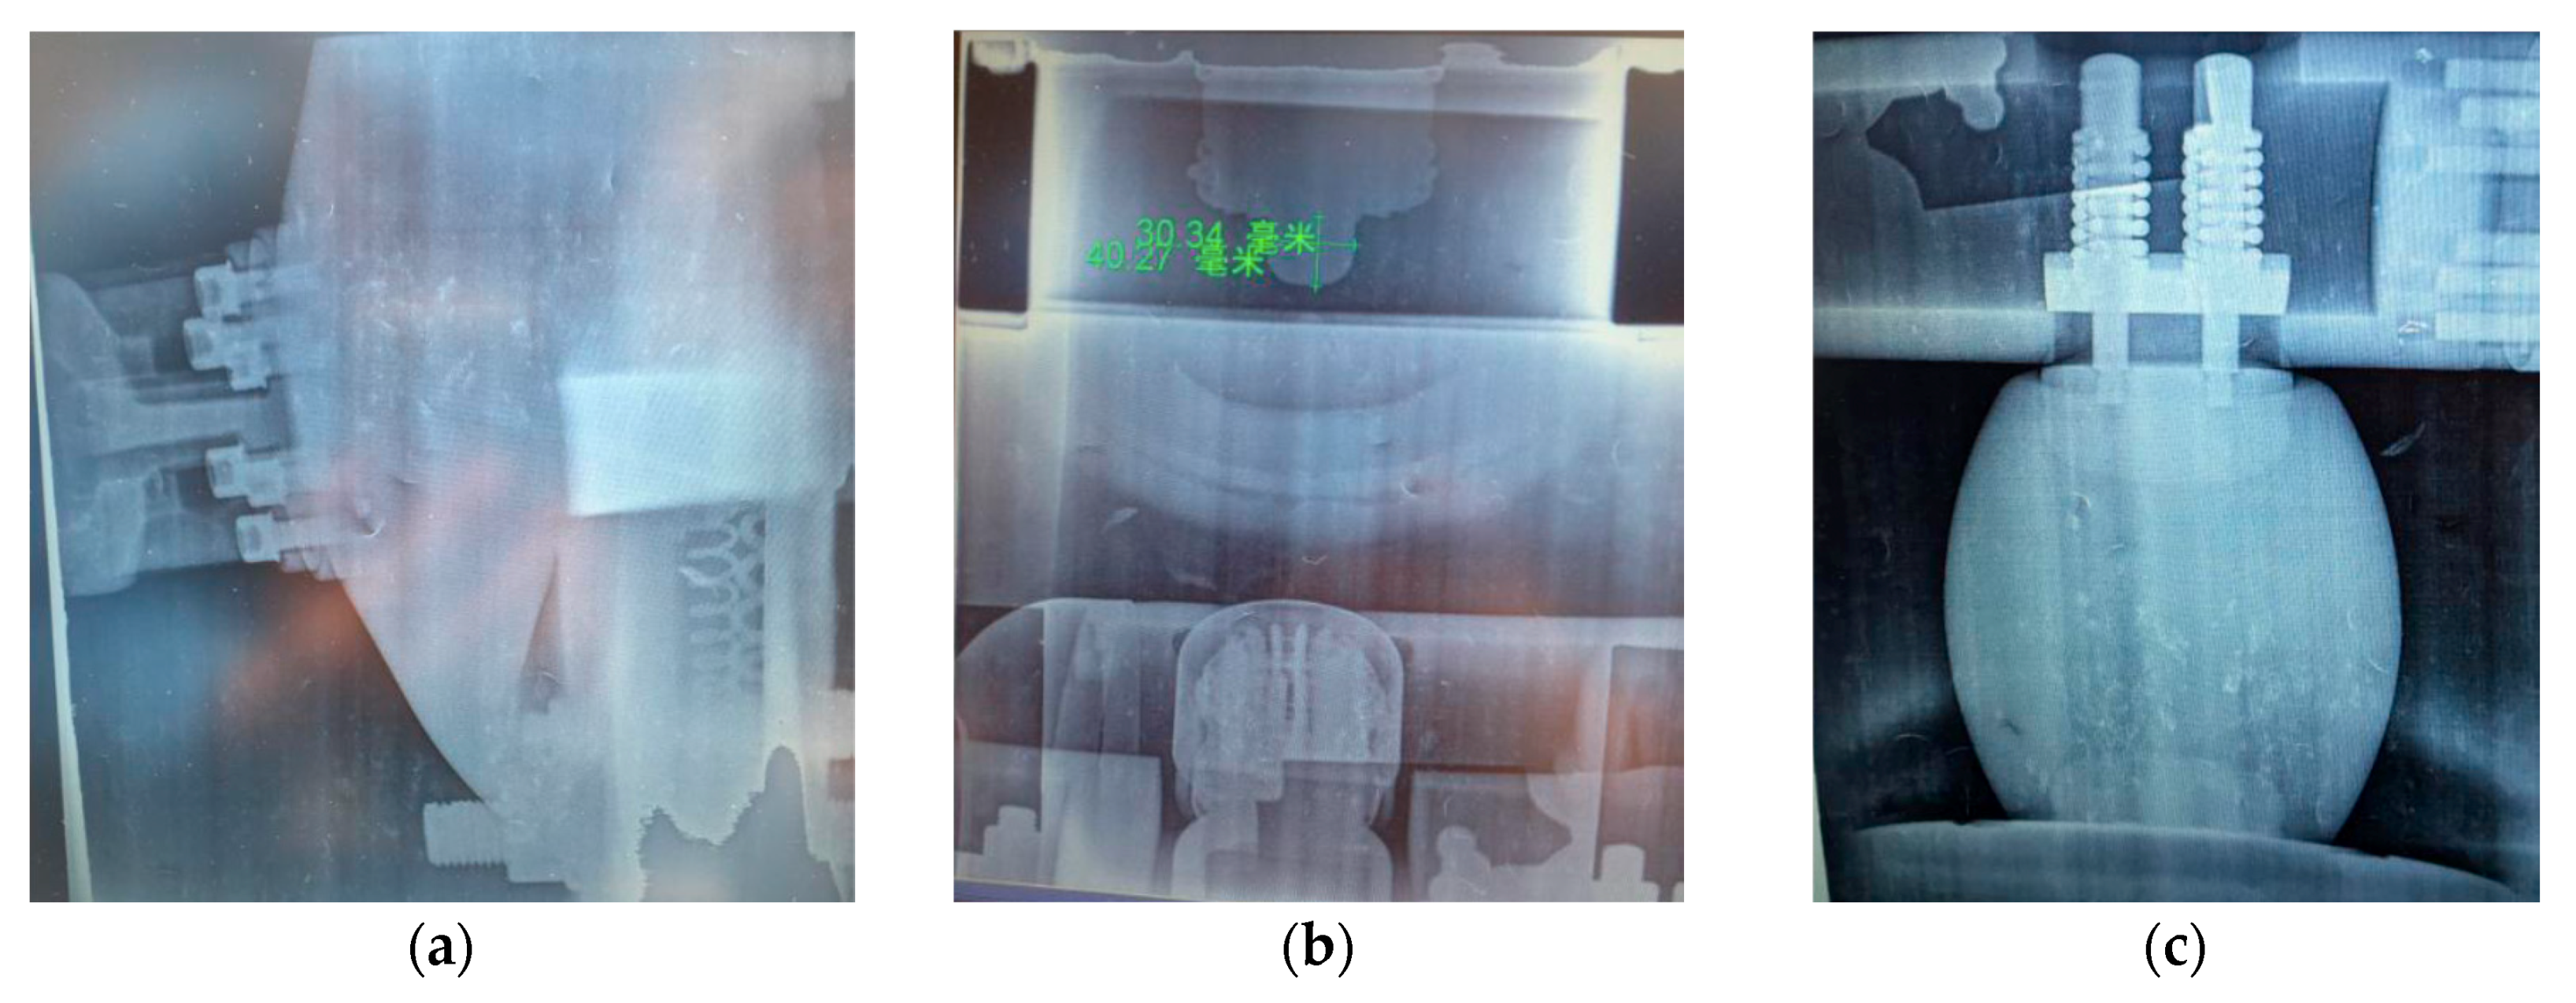
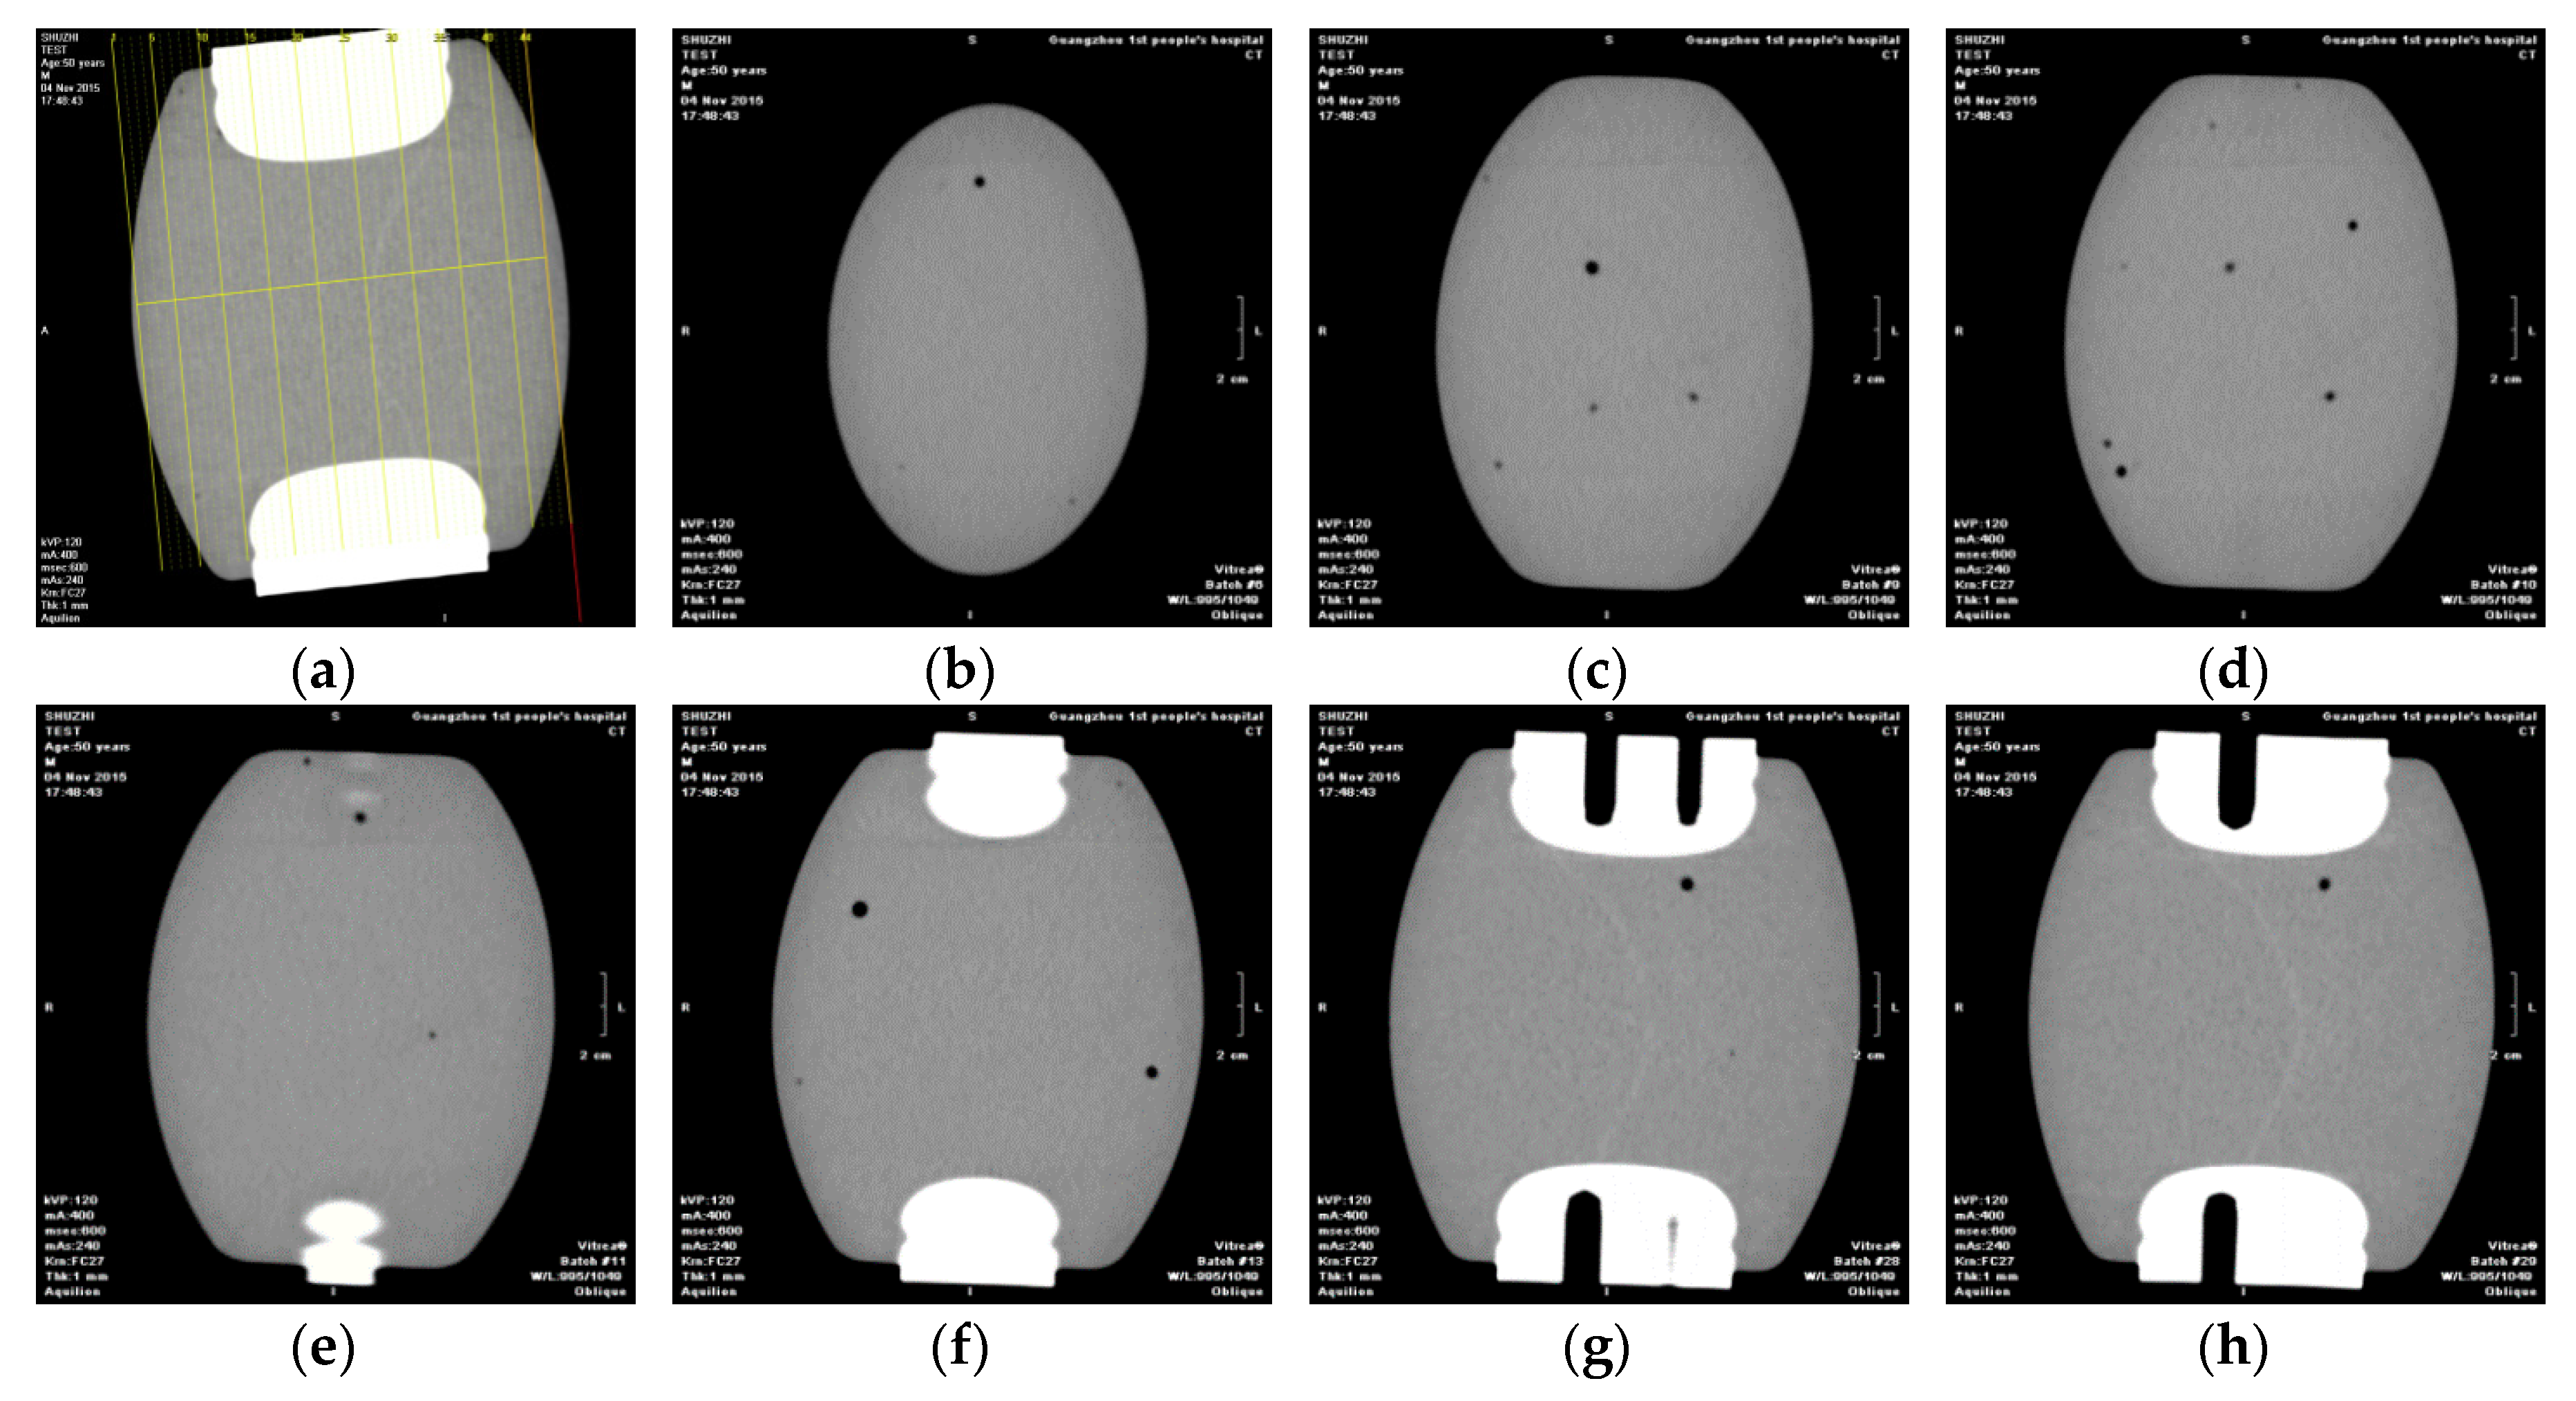
3.1.4. X-ray Live Detection
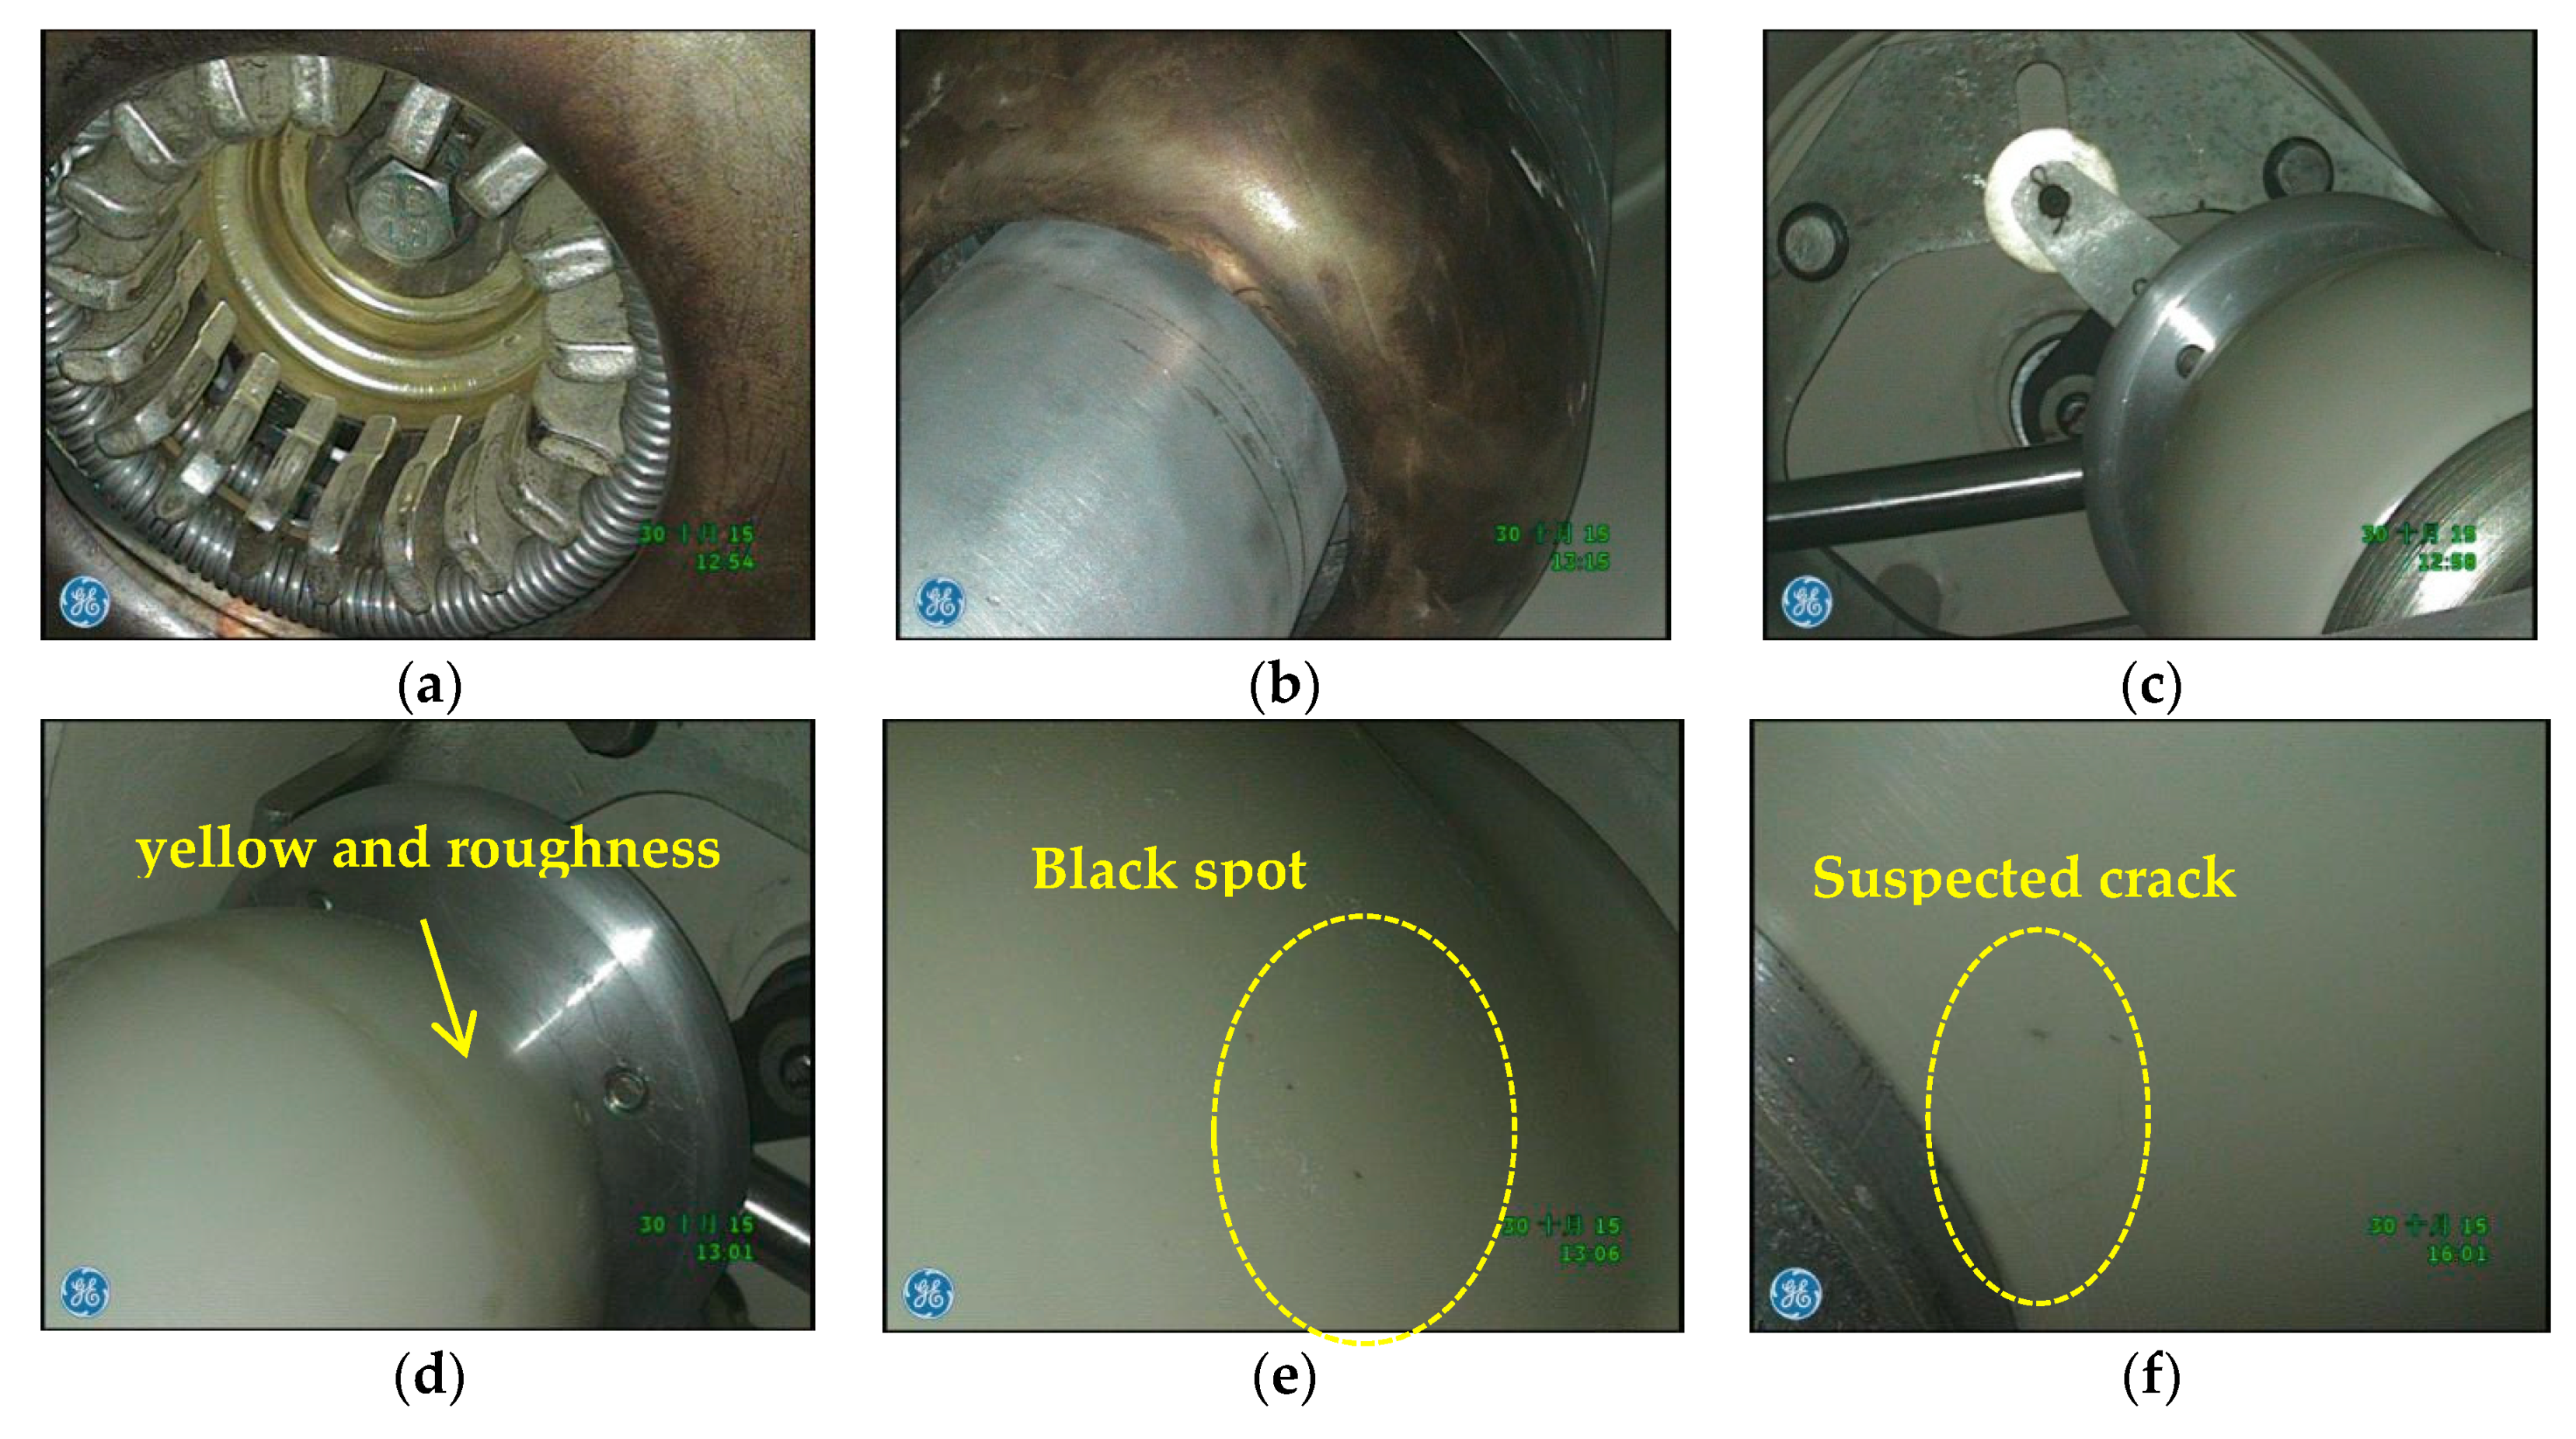
3.2. Disassembly Examination
4. Discussion and Conclusions
Author Contributions
Funding
Conflicts of Interest
References
- Cleary, G.P.; Judd, M.D. UHF and current pulse measurements of partial discharge activity in mineral oil. IEE Proc. Sci. Meas. Technol. 2006, 153, 47–54. [Google Scholar] [CrossRef]
- Judd, M.D.; Yang, L.; Hunterian, B.B. Partial discharge monitoring for power transformers using UHF sensors part 1: Sensors and signal interpretation. IEEE Electr. Insul. Mag. 2005, 2, 5–14. [Google Scholar] [CrossRef]
- Niemeyer, L. A Generalized Approach to Partial Discharge Modeling. IEEE Trans. Dielectr. Insul. 1995, 2, 510–528. [Google Scholar] [CrossRef]
- Zeng, F.P.; Dong, Y.I.; Tang, J. Feature extraction and severity assessment of partial discharge under protrusion defect based on fuzzy comprehensive evaluation. IET Gener. Transm. Distrib. 2015, 9, 2493–2500. [Google Scholar] [CrossRef]
- Boggs, S.A. Electromagnetic techniques for fault and PD location in gas insulated cables and substations. IEEE Trans. Power Appar. Syst. 1982, PAS-101, 1935–1941. [Google Scholar] [CrossRef]
- Judd, M.D.; Cleary, G.P.; Bennoch, C.J. Applying UHF partial discharge detection to power transformers. IEEE Power Eng. Rev. 2002, 22, 57–59. [Google Scholar]
- Han, Y.; Song, Y.H. Condition monitoring techniques for electrical equipment—A literature survey. IEEE Trans. Power Deliv. 2003, 18, 4–13. [Google Scholar] [CrossRef]
- Gao, W.; Ding, D.; Liu, W. Research on the typical partial discharge using the UHF detection method for GIS. IEEE Trans. Power Deliv. 2011, 26, 2621–2629. [Google Scholar] [CrossRef]
- Liu, J.; Zhang, G.; Dong, J.; Wang, J. Study on miniaturized UHF antennas for partial discharge detection in high-voltage electrical equipment. Sensors 2015, 15, 29434–29451. [Google Scholar] [CrossRef] [PubMed]
- Rudd, S.; McArthur, S.D.; Judd, M.D. A generic knowledge-based approach to the analysis of partial discharge data. IEEE Trans. Dielectr. Electr. Insul. 2010, 17, 149–156. [Google Scholar] [CrossRef]
- Yao, C.; Chen, P.; Huang, C.; Chen, Y.; Qiao, P. Study on the Application of an Ultra-High-Frequency Fractal Antenna to Partial Discharge Detection in Switchgears. Sensors 2013, 13, 17362–17378. [Google Scholar] [CrossRef] [PubMed]
- Li, Z.; Luo, L.; Zhou, N.; Sheng, G.; Jiang, X. A novel partial discharge localization method in substation based on a wireless UHF sensor array. Sensors 2017, 17, 1909. [Google Scholar] [CrossRef] [PubMed]
- Robles, G.; Fresno, J.M.; Martínez-Tarifa, J.M.; Ardila-Rey, J.A.; Parrado-Hernández, E. Partial Discharge Spectral Characterization in HF, VHF and UHF Bands Using Particle Swarm Optimization. Sensors 2018, 18, 746. [Google Scholar] [CrossRef] [PubMed]
- Hou, H.; Sheng, G.; Jiang, X. Robust time delay estimation method for locating UHF signals of partial discharge in substation. IEEE Trans. Power Deliv. 2013, 28, 1960–1968. [Google Scholar]
- Wang, X.H.; Li, X.; Rong, M.Z.; Xie, D.L.; Ding, D.; Wang, Z.X. UHF Signal Processing and Pattern Recognition of Partial Discharge in Gas-Insulated Switchgear Using Chromatic Methodology. Sensors 2017, 17, 177. [Google Scholar] [CrossRef] [PubMed]
- Zhang, X.; Cheng, Z.; Gui, Y. Design of a new built-in UHF multi-frequency antenna sensor for partial discharge detection in high-voltage switchgears. Sensors 2016, 16, 1170. [Google Scholar] [CrossRef] [PubMed]
- Boya, C.; Rojas-Moreno, M.V.; Ruiz-Llata, M.; Robles, G. Location of Partial Discharges Sources by Means of Blind Source Separation of UHF Signals. IEEE Trans. Dielectr. Electr. Insul. 2015, 22, 2302–2310. [Google Scholar] [CrossRef]
- Qian, Y.; Huang, C.; Jiang, X.C.; Xiao, Y.; Zuo, Y.H. Current Status and Development of PD Online Monitoring Technology in GIS. High Volt. Appar. 2004, 40, 453–456. [Google Scholar]
- Liu, J.H.; Yao, M.; Wang, J.; Duan, D.P.; Huang, C.J.; Jiang, X.C. A partial discharge location method based on the characteristics of the electromagnetic wave propagation routine in GIS. Autom. Electr. Power Syst. 2008, 32, 77–81. [Google Scholar]
- Hou, H.J.; Sheng, G.H.; Miao, P.Q.; Li, X.W.; Hu, Y.; Jiang, X.C. Partial Discharge Location Based on Radio Frequency Antenna Array in Substation. High Volt. Eng. 2012, 38, 1334–1340. [Google Scholar]
- Hou, H.; Sheng, G.; Jiang, X. Localization algorithm for the PD source in substation based on L-shaped antenna array signal processing. IEEE Trans. Power Deliv. 2015, 30, 472–479. [Google Scholar] [CrossRef]
- Li, T.; Rong, M.; Zheng, C.; Wang, X. Development simulation and experiment study on UHF Partial Discharge Sensor in GIS. IEEE Trans. Dielectr. Electr. Insul. 2012, 19, 1421–1430. [Google Scholar] [CrossRef]
- Pearson, J.S.; Farish, O.; Hampton, B.F.; Judd, M.D.; Templeton, D.; Pryor, B.M.; Welch, I.M. Partial discharge diagnostics for gas insulated substations. IEEE Trans. Dielectr. Electr. Insul. 1995, 2, 893–905. [Google Scholar] [CrossRef]
- Hoshino, T.; Kato, K.; Hayakawa, N.; Okubo, H. A novel technique for detecting electromagnetic wave caused by partial discharge in GIS. IEEE Trans. Power Deliv. 2001, 16, 545–551. [Google Scholar] [CrossRef]
- Zaharis, Z.; Skeberis, C.; Xenos, T.; Lazaridis, P.; Cosmas, J. Design of a novel antenna array beamformer using neural networks trained by modified adaptive dispersion invasive weed optimization based data. IEEE Trans. Broadcast. 2013, 59, 455–460. [Google Scholar] [CrossRef]
- Robles, G.; Sánchez-Fernández, M.; Sánchez, R.A.; Rojas-Moreno, M.V.; Rajo-Iglesias, E.; Martínez-Tarifa, J.M. Antenna parametrization for the detection of partial discharges. IEEE Trans. Instrum. Meas. 2013, 62, 932–941. [Google Scholar] [CrossRef]
- Cai, X.; Wang, D.; Yu, H.; Zhao, X.; Zhang, W. The application of X-ray digital real-time imaging technology in GIS defect diagnosis. Procedia Eng. 2011, 23, 137–143. [Google Scholar] [CrossRef]
- Guo, T.; Wang, D.; Yu, H.; Wu, Z.; Yan, W.; Zhang, S. The application of X-ray radiographic parameters selection in the DR nondestructive testing. Lect. Notes Inf. Technol. 2012, 18, 100. [Google Scholar]
- Cavallini, A.; Conti, M.; Contin, A.; Montanari, G.C.; Puletti, F. A new algorithm for the identification of defects generating partial discharges in rotating machines. In Proceedings of the Conference Record of the 2004 IEEE International Symposium on Electrical Insulation, Indianapolis, IN, USA, 19–22 September 2004; pp. 204–207. [Google Scholar]


| Group 1 | Group 2 | Group 3 | Group 4 | Group 5 | Vpp | Energy Loss | Time Differences | Distance | |
|---|---|---|---|---|---|---|---|---|---|
| Point B | 20.20 ns | 19.65 ns | 19.35 ns | 22.50 ns | 21.10 ns | ≈3 mV | –30 dB | 20.56 ns | 6.17 m |
| Point E | 21.00 ns | 26.35 ns | 22.95 ns | 28.80 ns | 25.35 ns | ≈2 mV | –35 dB | 24.89 ns | 7.47 m |
| Point 1 | Point 2 | Point 3 | Point 4 | |
|---|---|---|---|---|
| Group 1 | 0 ns | 0.20 ns | 0.29 ns | 0.05 ns |
| Group 2 | 0 ns | 0.17 ns | 0.30 ns | 0.00 ns |
| Group 3 | 0 ns | 0.12 ns | 0.27 ns | 0.10 ns |
| Group 4 | 0 ns | 0.15 ns | 0.29 ns | 0.06 ns |
| Group 5 | 0 ns | 0.13 ns | 0.26 ns | –0.03 ns |
| Average time difference | 0 ns | 0.154 ns | 0.282 ns | 0.036 ns |
© 2018 by the authors. Licensee MDPI, Basel, Switzerland. This article is an open access article distributed under the terms and conditions of the Creative Commons Attribution (CC BY) license (http://creativecommons.org/licenses/by/4.0/).
Share and Cite
Xiong, J.; Wang, Y.; Ma, G.-M.; Zhang, Q.; Zheng, S.-S. Field Applications of Ultra High Frequency Techniques for Defect Detection in GIS. Sensors 2018, 18, 2425. https://doi.org/10.3390/s18082425
Xiong J, Wang Y, Ma G-M, Zhang Q, Zheng S-S. Field Applications of Ultra High Frequency Techniques for Defect Detection in GIS. Sensors. 2018; 18(8):2425. https://doi.org/10.3390/s18082425
Chicago/Turabian StyleXiong, Jun, Yuan Wang, Guo-Ming Ma, Qiang Zhang, and Shu-Sheng Zheng. 2018. "Field Applications of Ultra High Frequency Techniques for Defect Detection in GIS" Sensors 18, no. 8: 2425. https://doi.org/10.3390/s18082425
APA StyleXiong, J., Wang, Y., Ma, G.-M., Zhang, Q., & Zheng, S.-S. (2018). Field Applications of Ultra High Frequency Techniques for Defect Detection in GIS. Sensors, 18(8), 2425. https://doi.org/10.3390/s18082425