Article

Simultaneous Detection of Adenosine Triphosphate and Glucose Based on the Cu-Fenton Reaction

1
The Key Laboratory of Life-Organic Analysis, Qufu Normal University, Qufu 273165, China
2
Key Laboratory of Pharmaceutical Intermediates and Analysis of Natural Medicine, Qufu Normal University, Qufu 273165, China
3
Laboratory Animal Center, Chongqing Medical University, Chongqing 400016, China
4
Northwest Institute of Plateau Biology, Chinese Academy of Sciences, Xining 810001, China
*
Author to whom correspondence should be addressed.
Sensors 2018, 18(7), 2151; https://doi.org/10.3390/s18072151
Submission received: 28 May 2018 / Revised: 28 June 2018 / Accepted: 28 June 2018 / Published: 4 July 2018
(This article belongs to the Special Issue Colorimetric and Fluorescent Sensors 2018)

Abstract

:
Both adenosine triphosphate (ATP) and glucose are important to human health, and their abnormal levels are closely related to angiocardiopathy and hypoglycaemia. Therefore, the simultaneous determination of ATP and glucose with a single test mode is highly desirable for disease diagnostics and early recognition. Herein, a new fluorescence on/off switch sensing platform is developed by carbon nanodots (CNDs) to detect ATP and glucose simultaneously. The fluorescence of CNDs can be quenched by Cu2+ and hydrogen peroxide (H2O2), due to the formation of hydroxyl radicals (·OH) produced in the Cu-Fenton reaction. Based on the high affinity of Cu2+ with ATP, the fluorescence of CNDs will recover effectively after adding ATP. Additionally, glucose can be efficiently catalyzed by glucose oxidase (GOx) to generate H2O2, so the platform can also be utilized to analyze glucose. Under optimum conditions, this sensing platform displays excellent sensitivity and the linear ranges are from 0.1 to 7 μM for ATP with a limit of detection (LOD) of 30.2 nM, and from 0.1 to 7 mM for glucose with a LOD 39.8 μM, respectively. Benefiting from the high sensitivity and selectivity, this sensing platform is successfully applied for simultaneous detection of ATP and glucose in human serum samples with satisfactory recoveries.

1. Introduction

As is well known, both adenosine triphosphate (ATP) and glucose are sources of energy and important for energy metabolism. ATP supplies energy for metabolic processes and glucose is a metabolic intermediate in biological systems. Furthermore, the ATP and glucose levels in blood are indicators of human health conditions. For example, the excessive production of ATP by creatine kinase is the pathogenesis of angiocardiopathy [1] and the aberrant concentration of ATP will cause energy disturbance, resulting in hypoglycaemia, ischemia, and Parkinsons’ disease [2]. On the other hand, the high glucose levels will produce diabetes mellitus, which damages the eyes, kidneys, feet, and heart, and also causes a series of angiocardiopathy [3], while hypoglycaemia is usually due to the low concentration of glucose. This means that both the levels of ATP and glucose are related to angiocardiopathy and hypoglycaemia by virtue of the coexistence of ATP and glucose in biological samples [4,5,6,7], thus, the simultaneous determination of ATP and glucose with a single test mode is highly desirable for disease diagnostics and early recognition.
A comparison with the traditional methods, such as chromatography and electrochemical techniques [8,9], fluorescence analysis receives a great deal of attention due to its simplicity, rapid response, and high selectivity. The fluorescence sensing strategy for ATP is usually developed according to the reaction between ATP and aptamer or between ATP and copper ions (Cu2+). For example, ATP-aptamer complexes provided greater protection for gold nanoparticles (AuNPs) against salt-induced aggregation than either aptamer or ATP alone, and the dispersive AuNPs rather than aggregation could efficiently quench the fluorescence of Tb ion-functionalized carbon dots due to the fluorescence resonance energy transfer [10]. In addition, compared with other cations, ATP has a strong affinity for Cu2+, which can completely quench the emission of perylene diimide functionalized with histidine. Thus, the fluorescence recovery positively correlated with ATP concentrations [11]. On the other hand, many fluorescence glucose sensors based on new fluorescence transduction schemes are already developed [12]. In these reports, the enzyme glucose oxidase (GOx) has been widely employed in glucose sensing because hydrogen peroxide (H2O2) is the main product of the reaction between glucose and GOx. For instance, H2O2 formed in the oxidization of glucose by GOx, resulting in the fluorescence quenching of carbon nanodots (CNDs) in the presence of Fe2+, and the concentration of glucose could be measured indirectly [13]. Although these reports showed good sensitivity and selectivity, these strategies could not incorporate both elements which responded, respectively, to Cu2+ and H2O2, so the simultaneous measurement of ATP and glucose could not be achieved. Up to now, only an amperometric biosensor was reported for the simultaneous determination of ATP and glucose [14], and other ways, especially fluorescence techniques, have not been presented.
Herein, it is found that the complex of Cu2+ and H2O2, rather than either Cu2+ or H2O2 alone, can quench the fluorescence of CNDs due to the hydroxyl radicals (·OH) produced in the Cu-Fenton reaction [15,16,17]. By virtue of the binding of ATP to Cu2+ and arising H2O2 in the reaction between glucose and GOx, ATP and glucose can be simultaneously detected. The linear range of ATP is 0.1 to 7 µM and the linear response of glucose is from 0.1 to 7 mM. Benefiting from the superior sensitivity and selectivity, this sensing platform is successfully applied for simultaneous detection of ATP and glucose in human serum samples with satisfactory recoveries.

2. Materials and Methods

2.1. Chemicals and Materials

Ascorbic acid (AA), hydrogen peroxide (H2O2), glucose oxidase (GOx), glucose, galactose, fructose, sucrose, mannose, lactose, sodium citrate, adenosine triphosphate (ATP), cytidine 5′-triphosphate disodium salt (CTP), adenosine 5′-diphosphate (ADP), uridine-5′-triphosphate (UTP), guanosine triphosphate (GTP) were purchased from Aladdin (Shanghai, China). CH3COONa, HCl, KCl and CuSO4 were obtained from Shanghai Shenbo Chemical Co., Ltd., Shanghai, China. All reagents were of analytical grade. All the solutions were prepared using ultrapure water produced with a Millipore-Q water system.

2.2. Instruments

The fluorescence spectra were recorded with a Hitachi F-7000 fluorescence spectrophotometer (Tokyo, Japan). Transmission electron microscopy (TEM) images were recorded on a JEM-2100PLUS (JEOL, Japan). The Fourier transform infrared (FT-IR) spectra of the samples were analyzed using Thermo Nicolet Nexus 470 FT-IR ESP spectrometer (Nicolet, WI, USA). The ultraviolet-visible (UV-vis) absorption spectra were obtained on a Cary 300 Bio UV-vis spectrophotometer (Varian, Palo Alto, CA, USA) and the pH values of solutions were measured using a pH meter (Mettler Toledo FE20, Zurich, Switzerland).

2.3. Synthesis of CNDs

Typically, 0.8 g AA was dissolved in 20 mL water. Then the above solution was stirred thoroughly and then transferred into a 50 mL autoclave reactor. The reactor was heated to 160 °C in a constant temperature drying oven for 70 min. After cooling to room temperature, a clear yellow aqueous dispersion containing CNDs was gained. Subsequently, the resulting yellow solution (20 mL) was dried in a drying oven at 60 °C to constant weight (for about 14 h). Then, 39 mg powder of carbon nanodots was weighed and diluted in 1 mL water to obtain CNDs solution (39 mg/mL). The prepared solution of CNDs was diluted 100 times before use, and the concentration was 0.39 mg/mL.

2.4. Fluorescence Responses of Cu2+

The fluorescence detection of Cu2+ was performed as follows: briefly, 35 µL CNDs (0.39 mg/mL), 50 µL H2O2 (0.1 M), different concentrations of Cu2+, 200 µL HCl-CH3COONa buffers (pH = 5) and water were mixed together, and the final volume was 1 mL. After incubation for 10 min at room temperature, the fluorescence of the mixture was measured at 380 nm with an excitation of 315 nm. With increasing the concentration of Cu2+, the fluorescence of CNDs decreased linearly and the fluorescence differences were expressed as F0-F, in which F0 and F represented the fluorescence intensities of CNDs-H2O2 in the absence and presence of Cu2+, respectively.
Additionally, the LOD is the limit of detection, which is defined as the concentration of analyte that corresponds to three times the signal-to-noise ratio (S/N = 3) [18]. LOD is calculated according to the expression LOD = 3σ/K, where σ is the standard deviation for the blank solution (n = 10), and K is the slope of the calibration curve.

2.5. Fluorescent H2O2 Assay

A typical H2O2 detection procedure was conducted as follows: Firstly, 35 µL CNDs (0.39 mg/mL), 60 µL Cu2+ (0.01 mM), 200 µL HCl-CH3COONa buffers (pH = 5), various concentrations of H2O2 and water were mixed thoroughly. The final volume of the mixture was 1 mL. After incubation for 10 min at ambient temperature, the concentration of H2O2 linearly responded to the fluorescence differences of F1-F2 (F1 and F2 represented the fluorescence intensity of CNDs-Cu2+ in the absence and presence of H2O2).

2.6. Fluorescence Detection of ATP

The assay was carried out as follows: (i) 200 µL HCl-CH3COONa buffers (pH = 5), 60 µL Cu2+ (0.01 mM) and ATP with different concentrations were added to a certain amount of water and reacted for 10 min at room temperature; (ii) 35 µL CNDs (0.39 mg/mL) and 50 µL H2O2 (0.1 M) were injected to the mixture and the volume of final solution was 1 mL. After the mixture reacted for 10 min at room temperature, a linear correlation was found between the concentration of ATP and the fluorescence differences of F4 − F3, in which F3 was the fluorescence intensity of CNDs-Cu2+-H2O2 system and F4 was the fluorescence intensity of the system with the addition of various concentrations of ATP.

2.7. Fluorescence Measurement of Glucose

Firstly, the mixture containing 13 μL GOx (765 U/mL) and different concentrations of glucose was incubated at 37 °C for 60 min, and then 200 µL HCl-CH3COONa buffers (pH = 5), 60 μL Cu2+ (0.01 mM) and 35 µL CNDs (0.39 mg/mL) were added to the mixture. Ten minutes later, their fluorescence spectra were recorded. The concentration of glucose linearly responded to the fluorescence differences of F5 − F6, where F5 and F6 were the fluorescence of CNDs-Cu2+-GOx system in the absence and presence of glucose.

2.8. Real Sample Detection

The real sample detection in our assay was carried out as follows: Typically, a 1.5 mL blood sample was kept at 37 °C in a water bath for about 0.5 h. Then, 3.0 mL acetonitrile was added and followed by centrifugation at 4000 rpm for 20 min to remove large molecules and proteins. Subsequently, the supernatant was removed and kept in a water bath (60 °C) for about 1 h to evaporate acetonitrile. The supernatant of the serum sample was diluted 10 times and measured by the present sensing system to detect ATP and glucose. Then, the standard ATP and glucose solutions with different concentrations were spiked into the human serum samples, respectively, to investigate the reliability of this assay.

2.9. Validation Test of TMB

The validation of the Cu-Fenton activity was performed as follows: the experiments were performed in 200 µL HCl-CH3COONa buffers (pH = 5) containing 5 mM TMB, 500 mM H2O2 and differing concentrations of Cu2+ followed by the addition of water to a final volume of 1 mL. After reaction for 10 min, the colour was present in these samples.

3. Results and Discussion

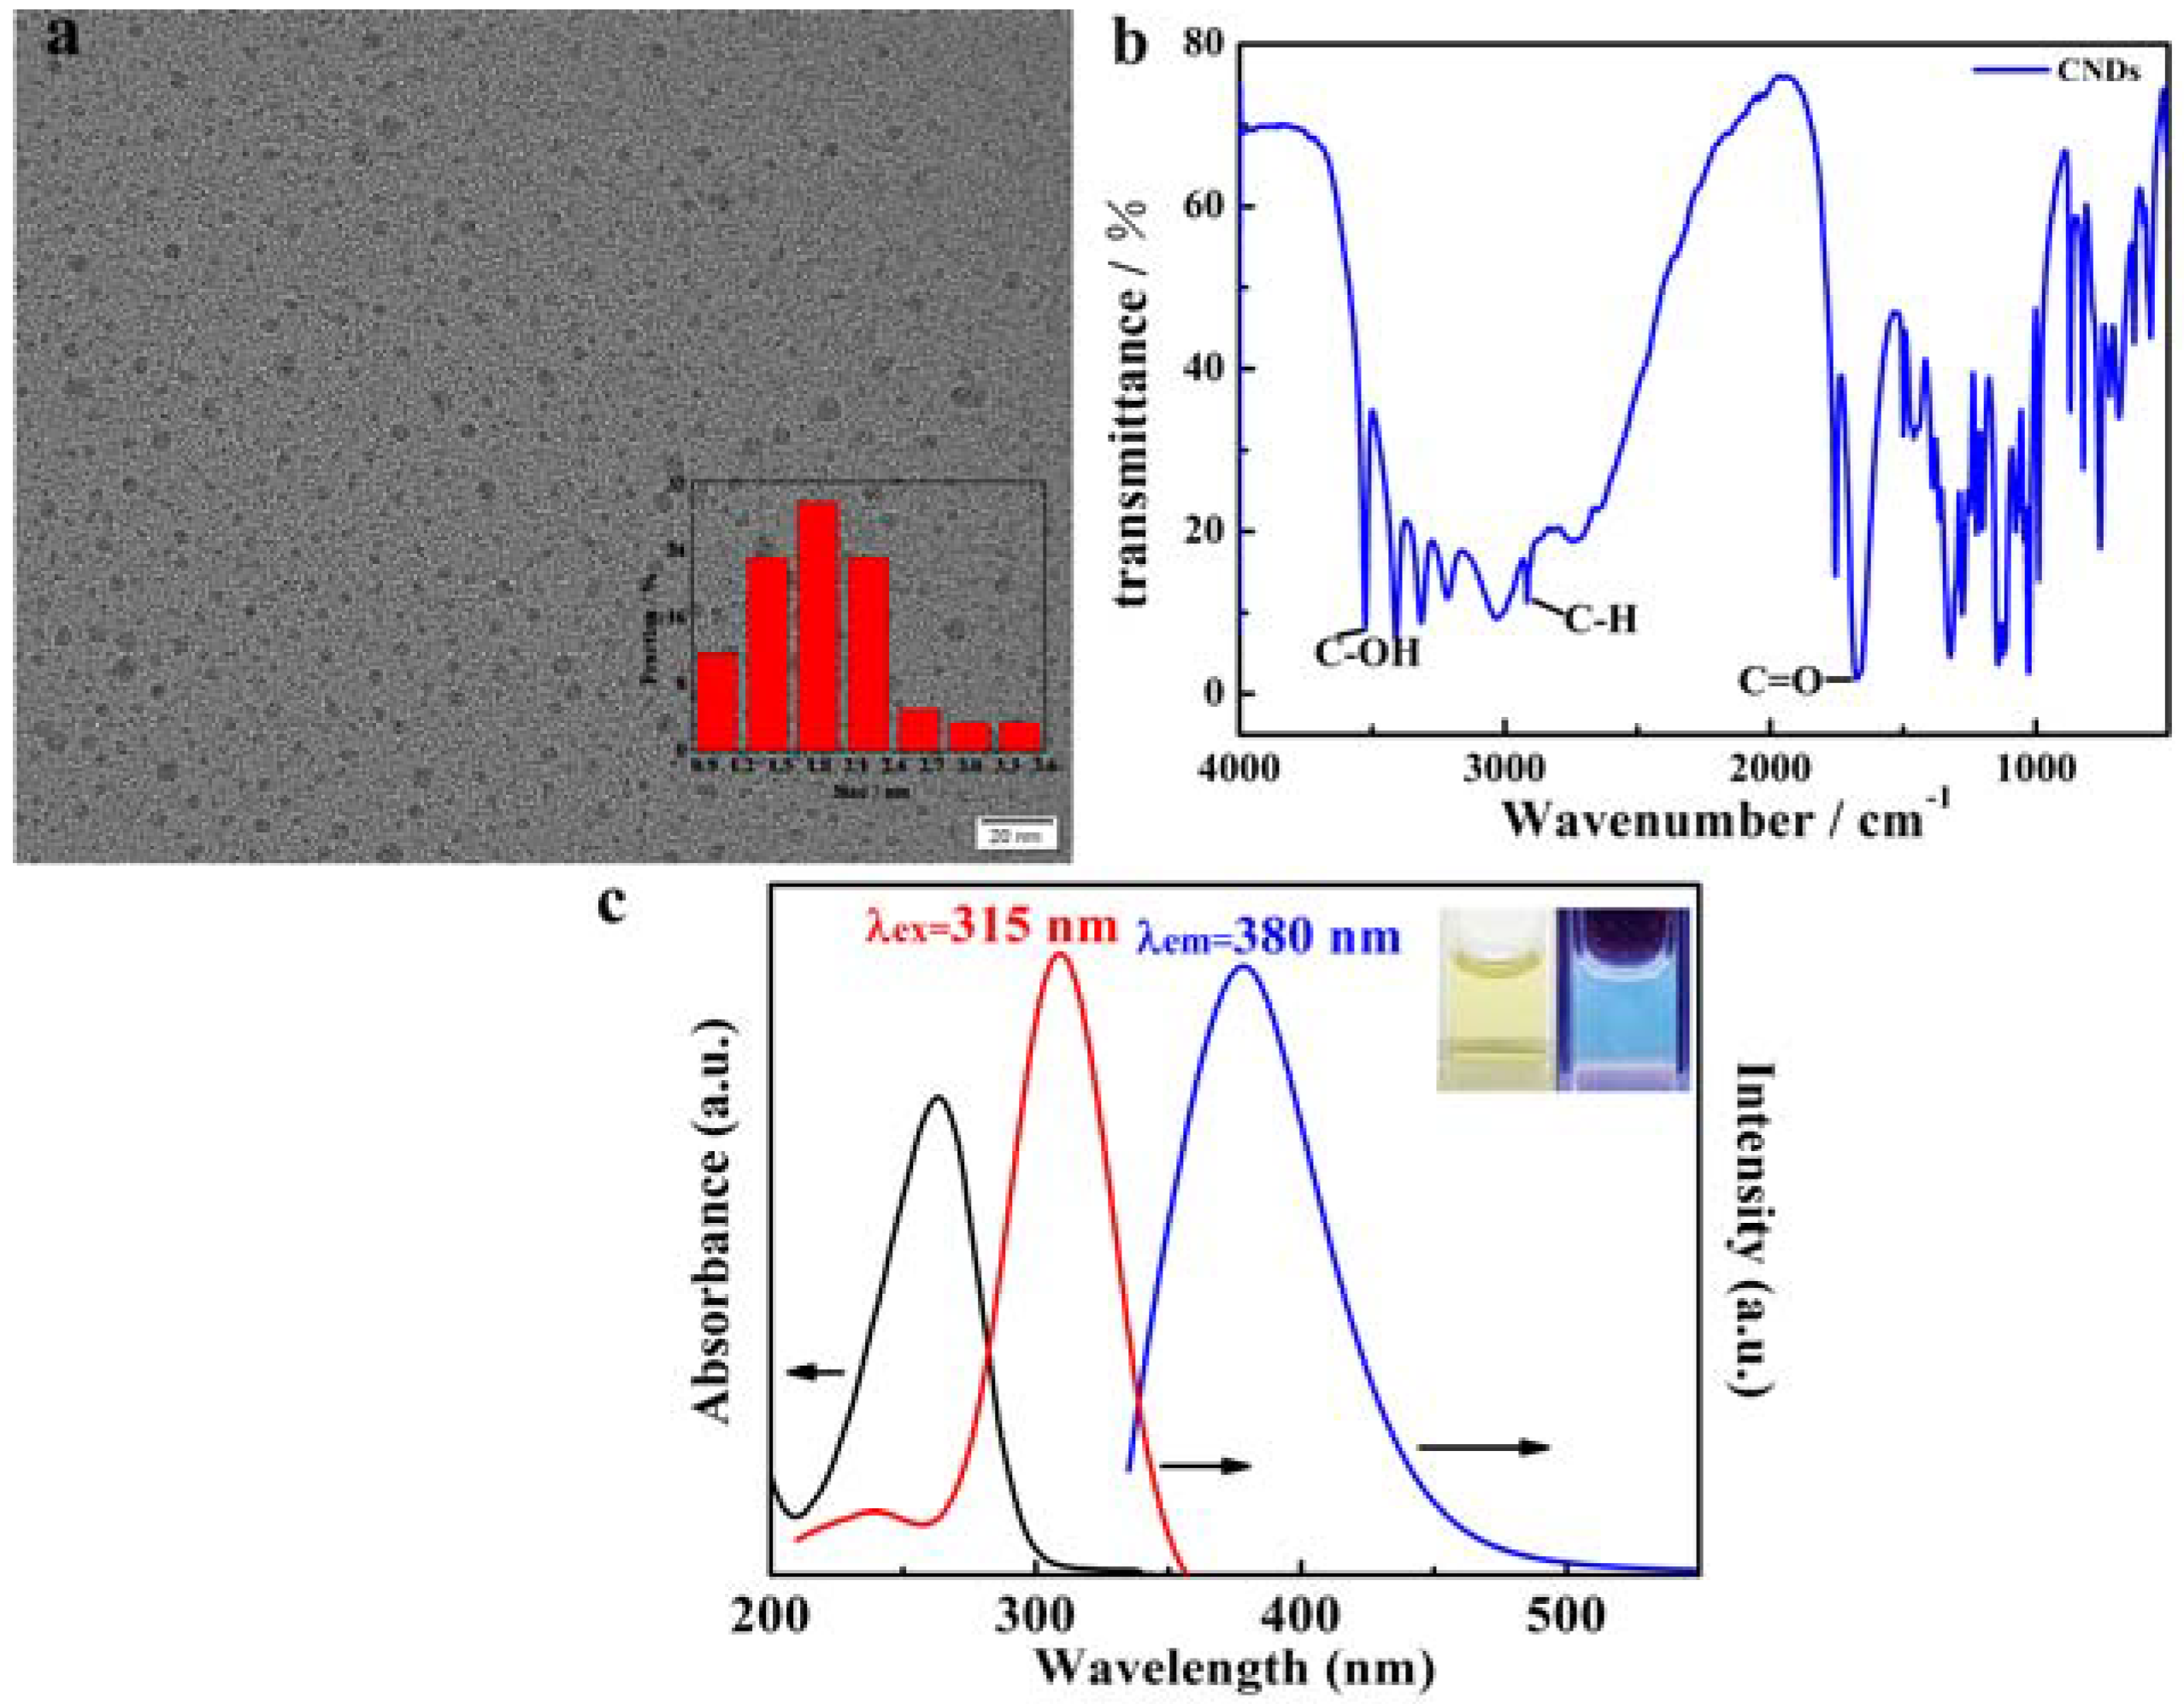
3.1. Characterization of CNDs

As shown in the TEM image (Figure 1a), the CNDs exhibit an approximately spherical shape and are well-dispersed. These nanoparticles have a size distribution from 1 to 3.4 nm and the average diameter of CNDs is about 1.8 nm by estimating the size of 100 dots in the TEM image. The structure and composition of CNDs are characterized by FT-IR spectroscopy (Figure 1b). The CNDs have a main absorption of C-H stretching vibration at 2900 cm−1, the C=O stretching at 1740 cm−1, and the peak at 3452 cm−1 is related to the C-OH bond stretching vibrations. It demonstrates the presence of oxygen-containing functional groups such as hydroxyl and carbonyl groups on the surface of particles. Additionally, these nanodots show a strong peak at 260 nm (Figure 1c), which is ascribed to π-π* transition of carbon [19]. Next, the emission is found to be excitation-dependent, including wavelength and intensity in a well-regulated mode within the exciting range of 285–345 nm (Figure S1). Although the emission peak shifts from 375 to 390 nm with increasing excitation wavelengths, its intensity reaches a maximum at 315 nm excitation (Figure 1c). The excitation-dependent emission spectra have been reported by various works involving CNDs [20,21]. Meanwhile, the CNDs solution under UV light exhibits bright blue fluorescence, whereas it is yellow under daylight.

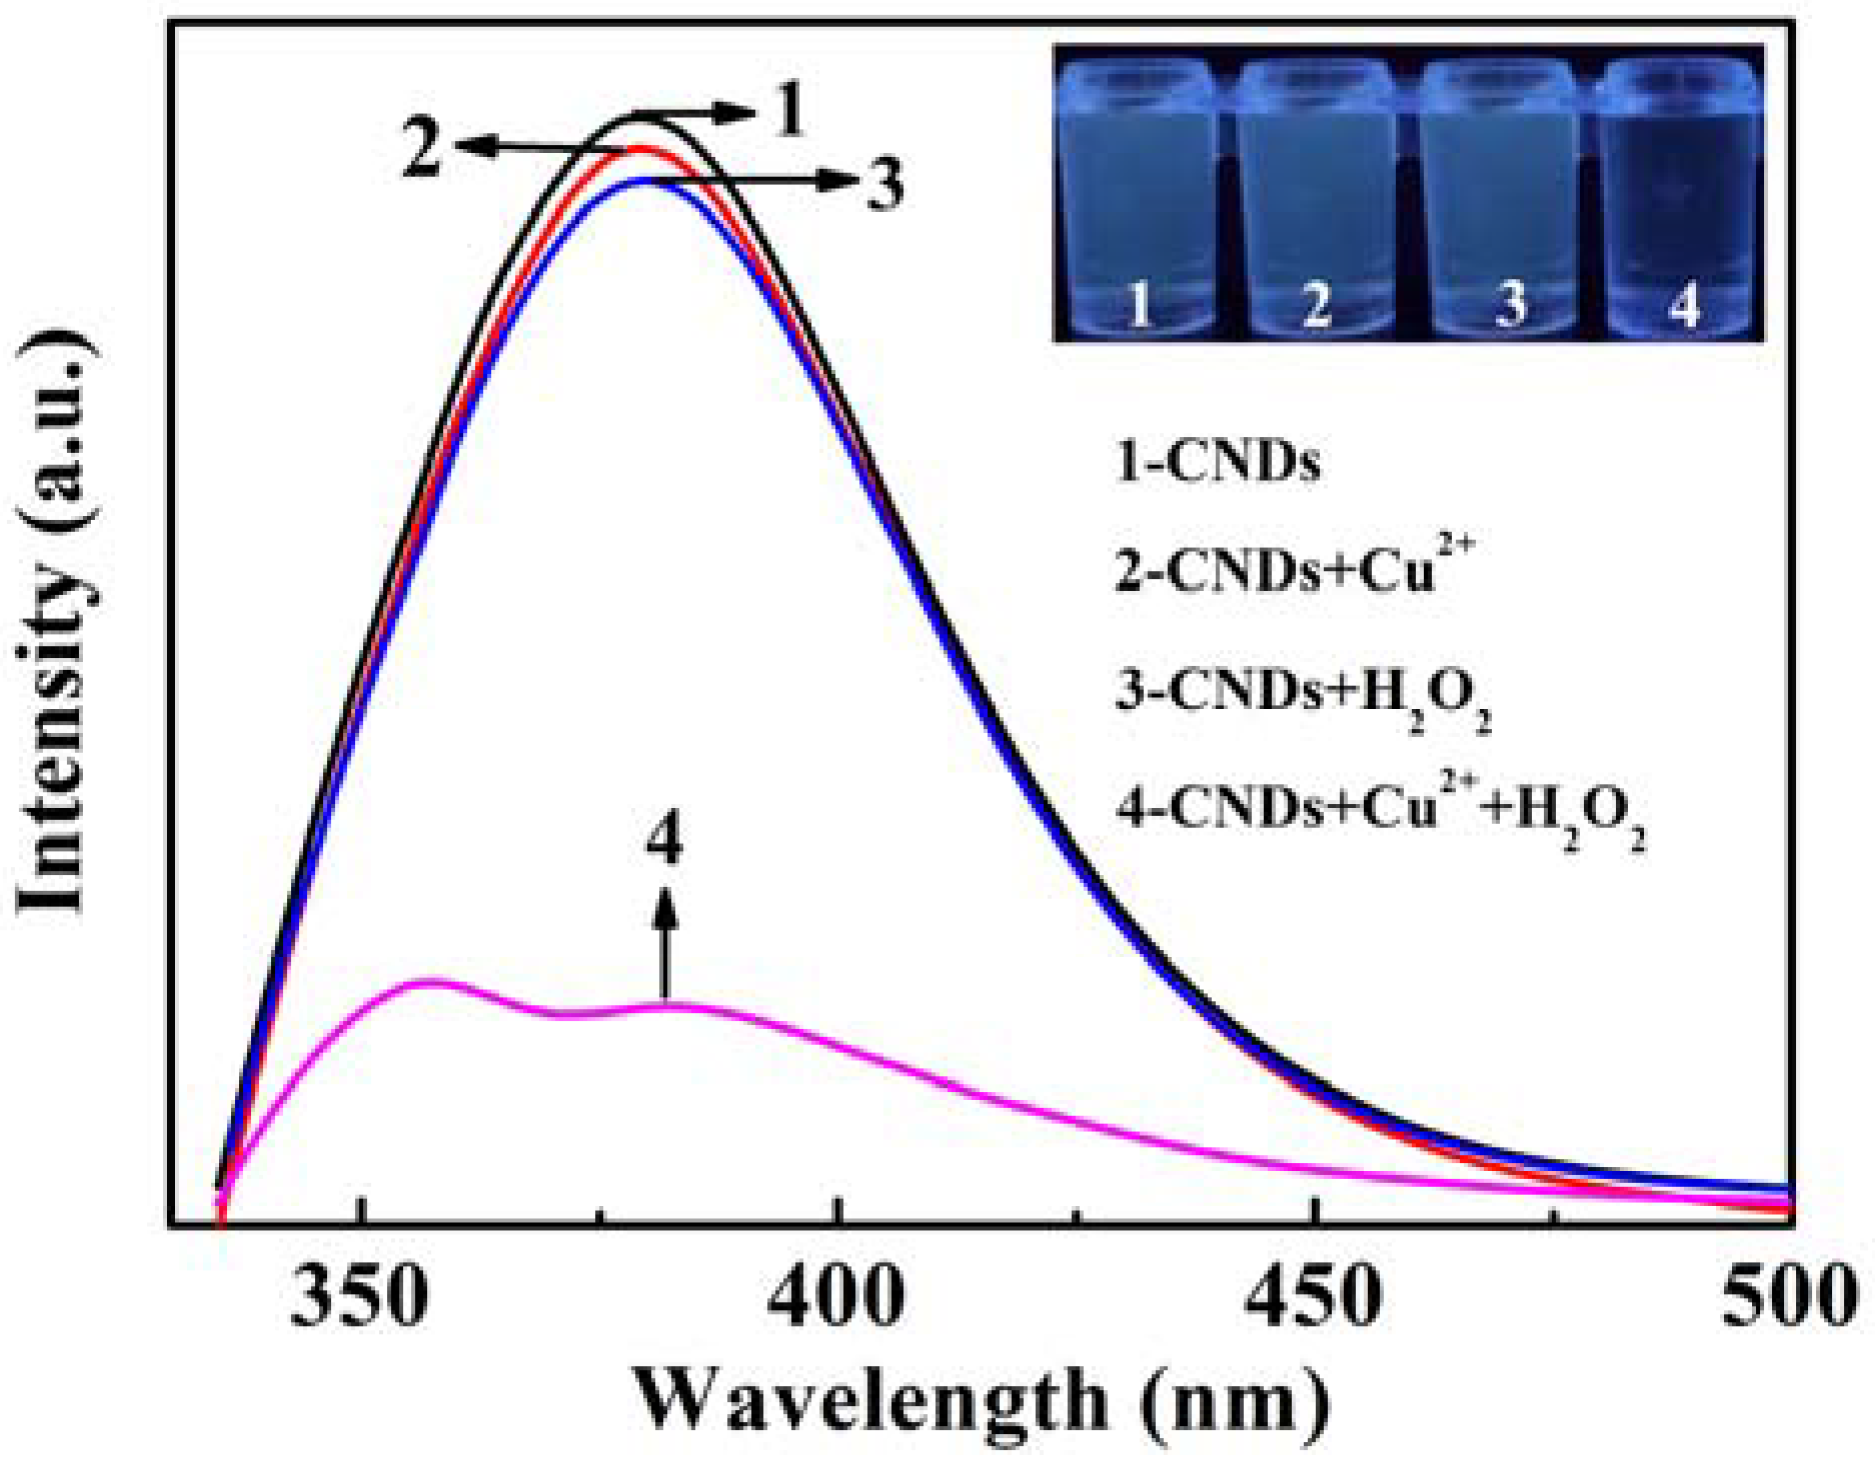
3.2. Fluorescence Quenching of CNDs

According to Figure 2, when only H2O2 or Cu2+ is mixed with CNDs, the emission at 380 nm changes inconspicuously. However, by both adding H2O2 and Cu2+, the fluorescence of CNDs is quenched effectively. While the amount of H2O2 is fixed, the emission of CNDs sensitively responds to the concentration of Cu2+ in the range from 1 nM to 2 μM with LOD 0.65 nM (Figure S2), which is lower than most works [22,23]. Additionally, it should be noted that when the concentration of Cu2+ is higher than 4 μM (Figure S3), it can directly quench the fluorescence of CNDs without the addition of H2O2, which is consistent with previous literature [24], but Cu2+ ions with a low amount (especially below 2 μM) is invalid. Additionally, with the unchanged amount of Cu2+, the fluorescence of these nanoparticles also decreases linearly when the concentration of H2O2 increases from 25 µM to 5 mM with LOD 7.8 µM (Figure S4). Like the Fenton reaction between Fe2+ and H2O2, Cu2+ and H2O2 can also produce the reactive ·OH. In this process, Cu2+ oxidizes H2O2 to generate O2•-and Cu+, and Cu+ is able to react with excess H2O2 to form ·OH [25,26,27,28], which can catalyse the oxidation of TMB to produce the blue colour reaction (Figure S5). TMB oxidation-induced colour development is positively correlated with Cu2+ concentrations. Therefore, the ·OH is believed to quench the fluorescence of CNDs, and the quenching efficiency reaches the maximum at pH 5 (Figure S6). Cu-Fenton reaction is different from the Fe-Fenton reaction, and it usually requires a small amount of Cu2+ and a large amount of H2O2, which just correspond to the low concentration of ATP and high concentration of glucose in human serum. Based on the binding of ATP to Cu2+ and arising H2O2 in the reaction between glucose and GOx, ATP, and glucose can be simultaneously detected with a single test mode (Scheme 1).

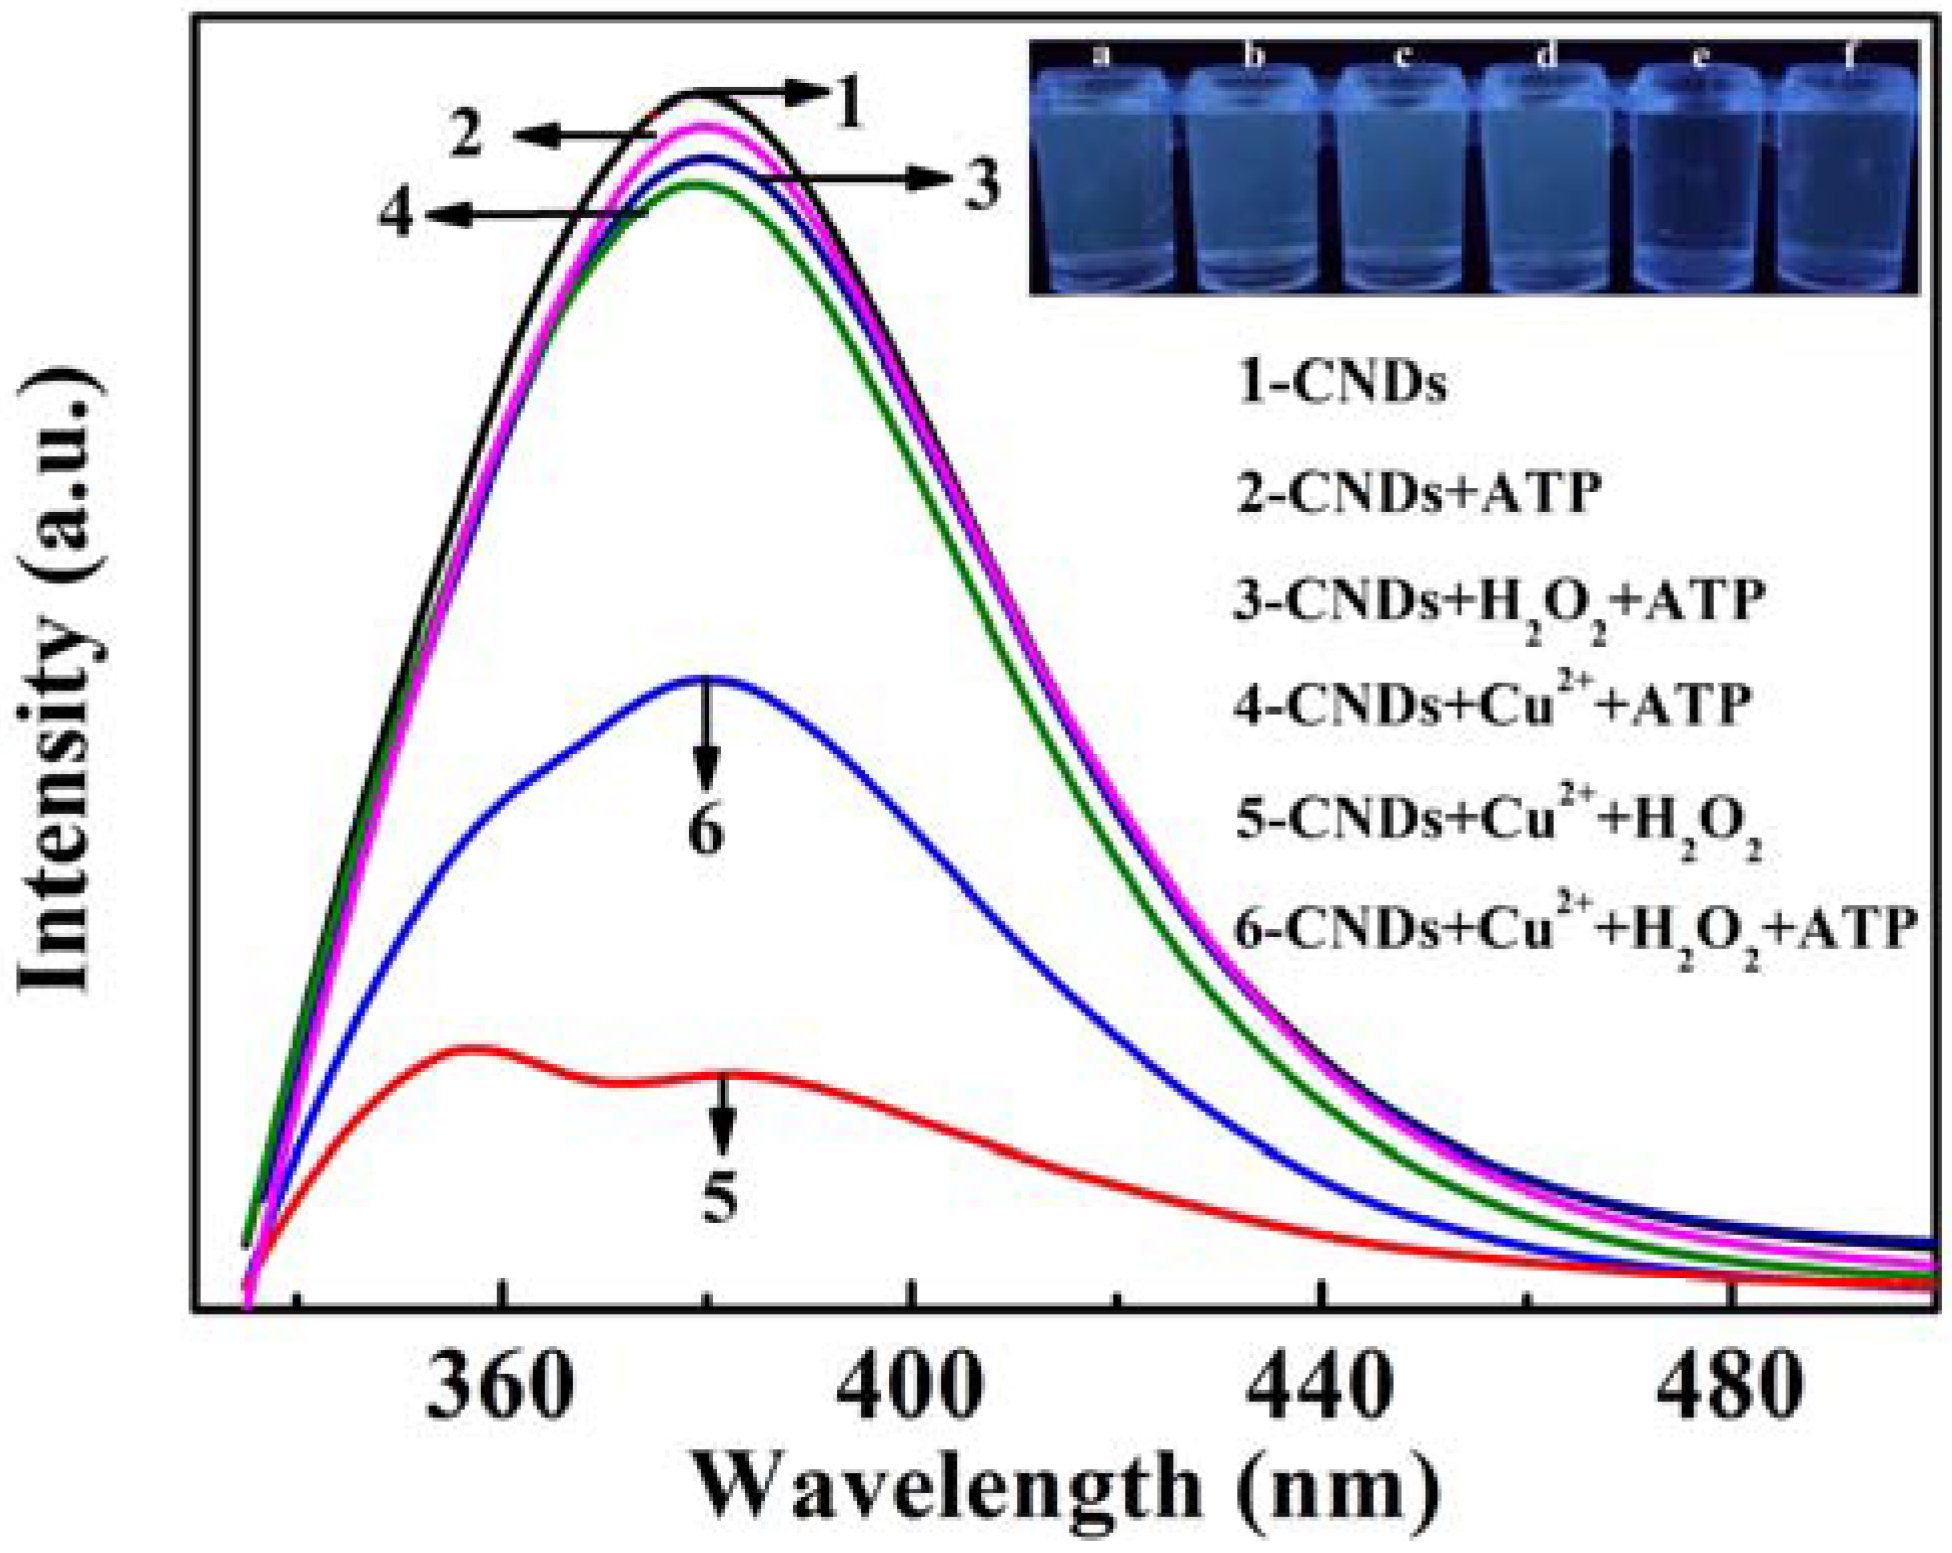
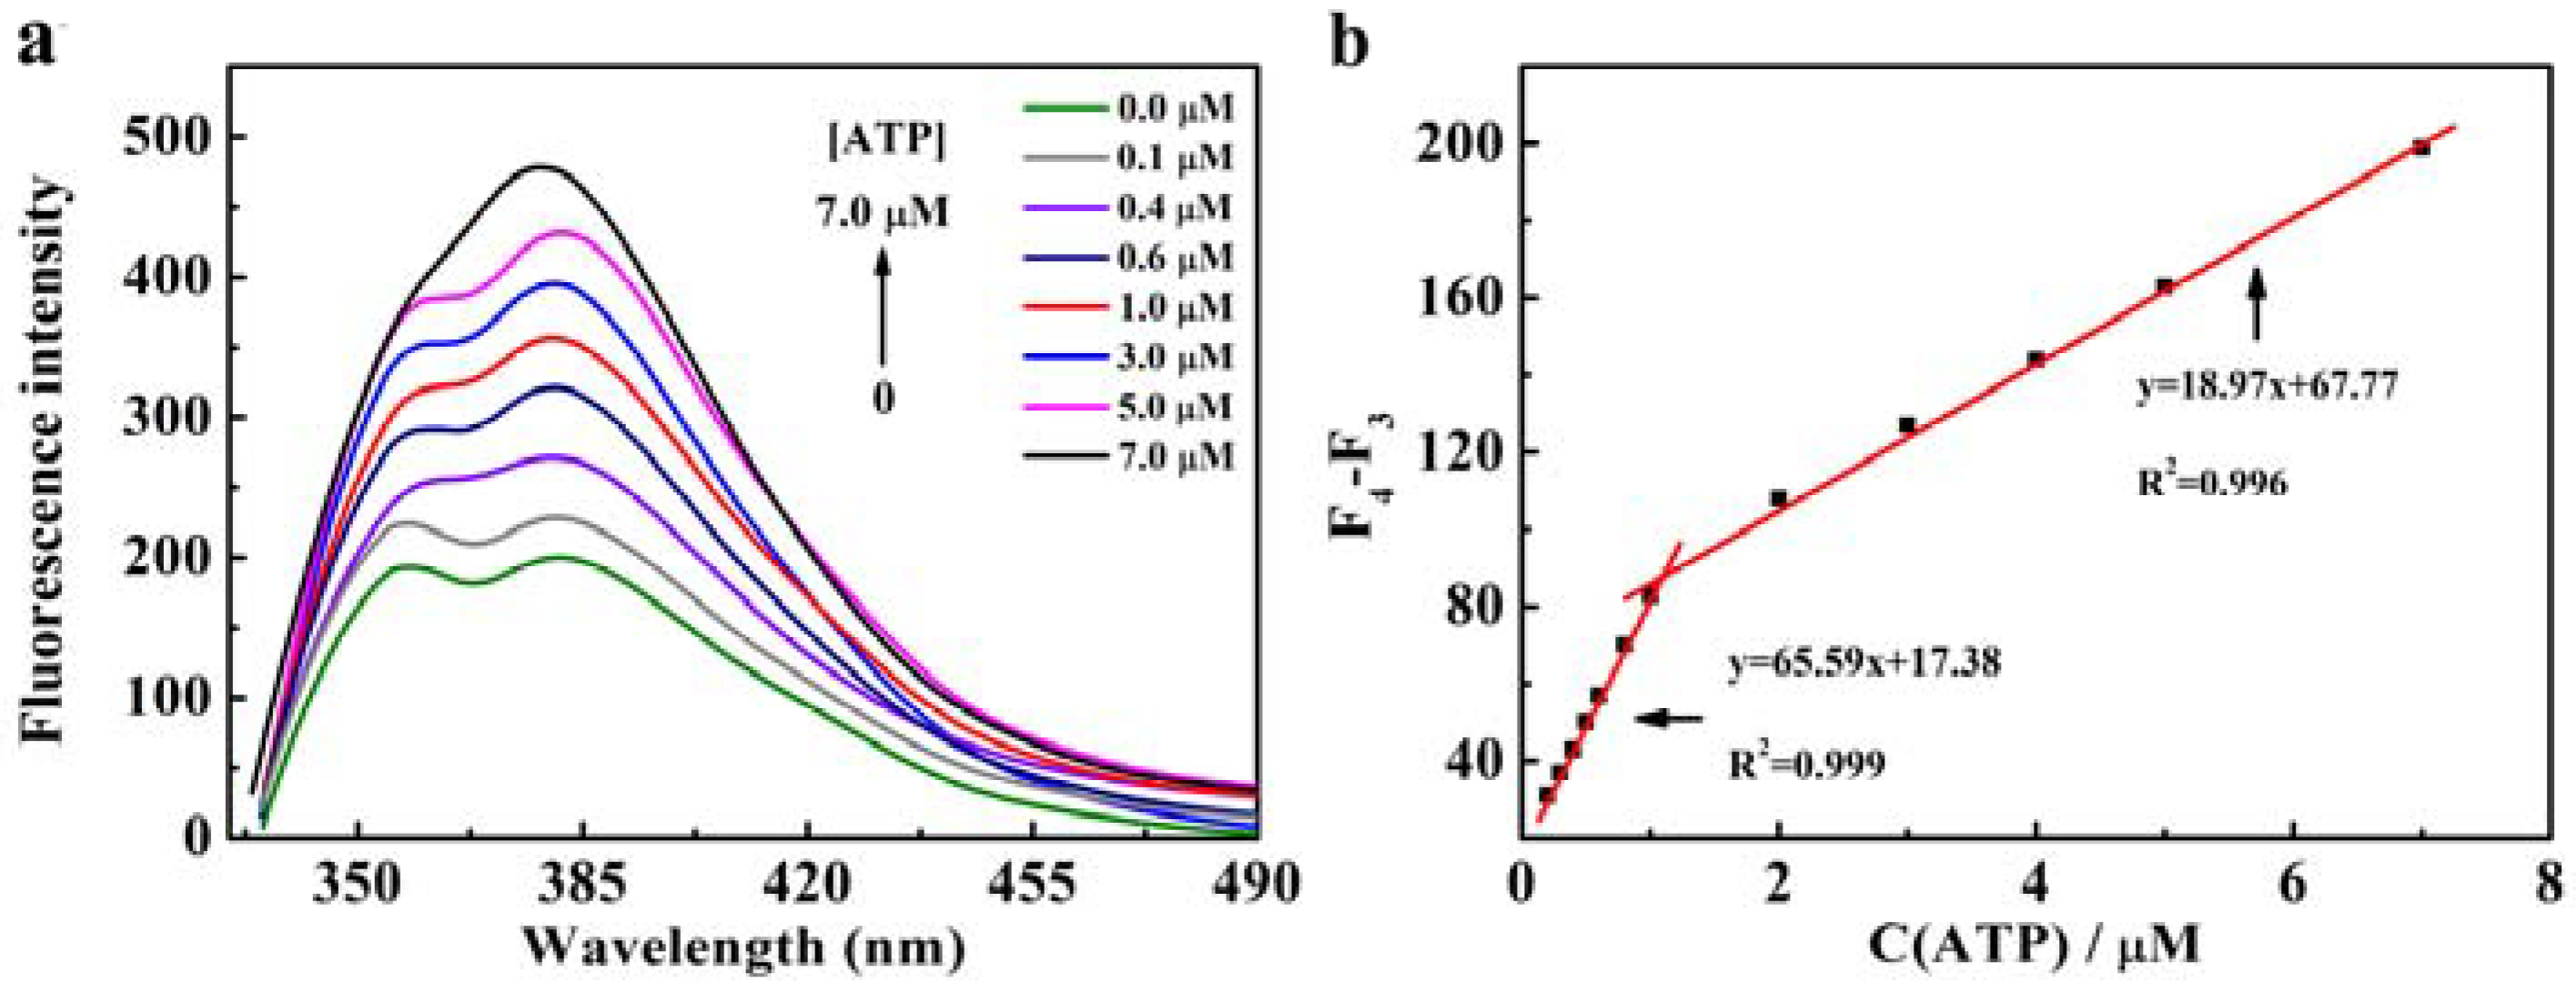
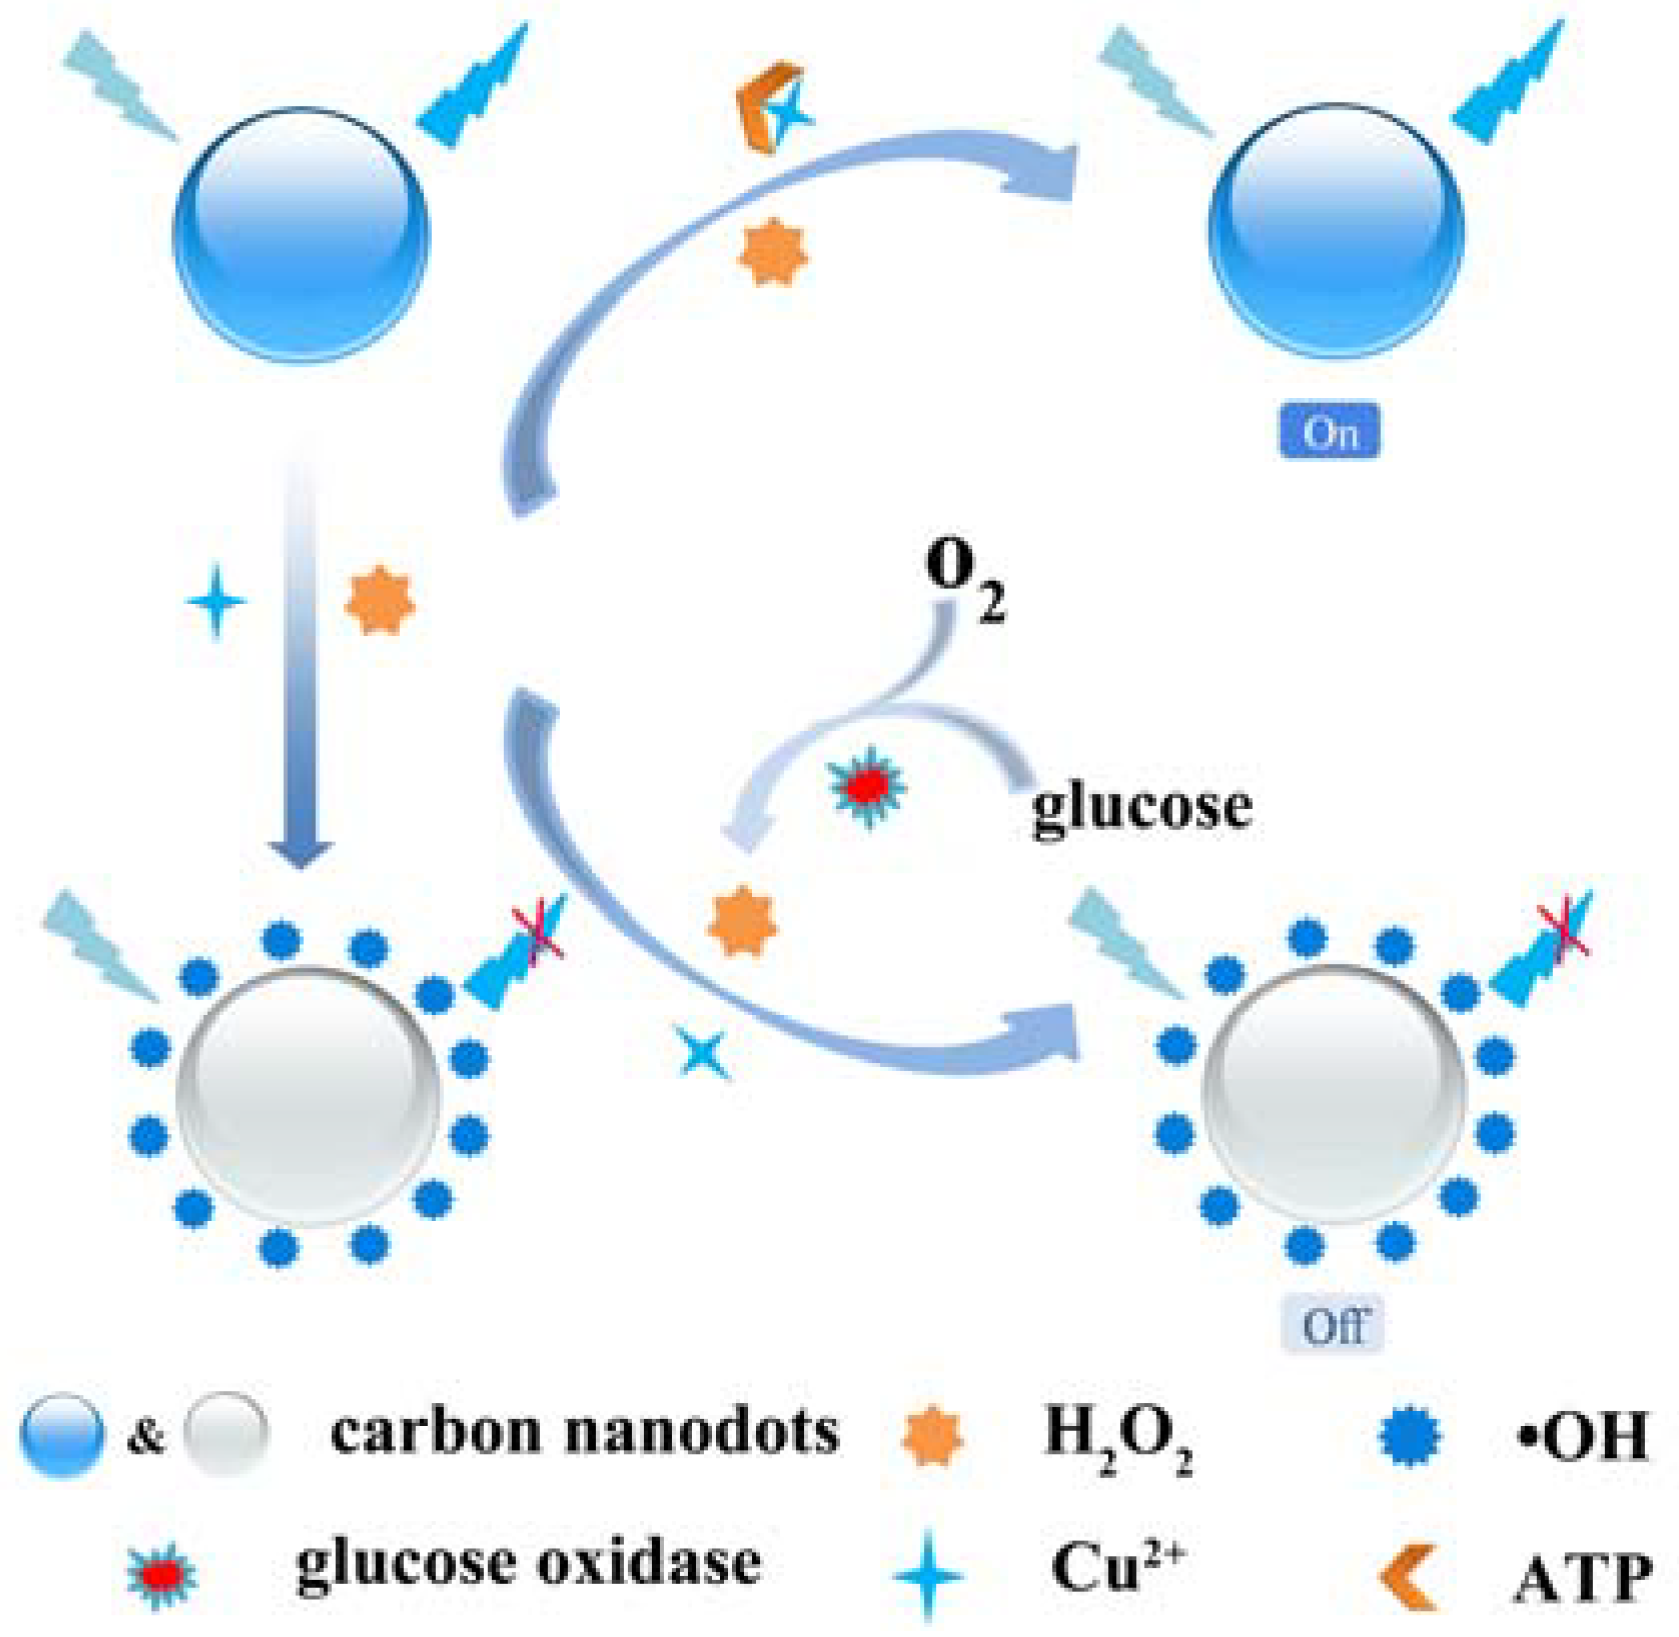
3.3. Fluorescence Recovery of CNDs-Cu2+-H2O2 System by ATP

As shown in Figure 3, when the ATP is introduced in the CNDs-Cu2+-H2O2 system, the quenched fluorescence recovers effectively because Cu2+ ions exhibit a strong binding affinity to ATP with respect to multiple phosphates, while ATP alone will not influence the fluorescence of CNDs, CNDs-Cu2+, and CNDs-H2O2. All of results indicate that ATP indeed binds with Cu2+ ions, which cannot react with H2O2 to form ·OH. At the same time, the reaction between ATP and Cu2+ ions can complete within 10 min, suggesting a rapid reaction rate (Figure S7). The enhanced fluorescence positively correlates with the concentration of ATP in the linear range from 0.1 to 7 µM with LOD 30.2 nM (Figure 4). Comparing with the previous reports (Table 1), our method is not inferior to others [29,30,31,32,33,34,35] and also exhibits relatively wide linear ranges and a low limit of detection of ATP.

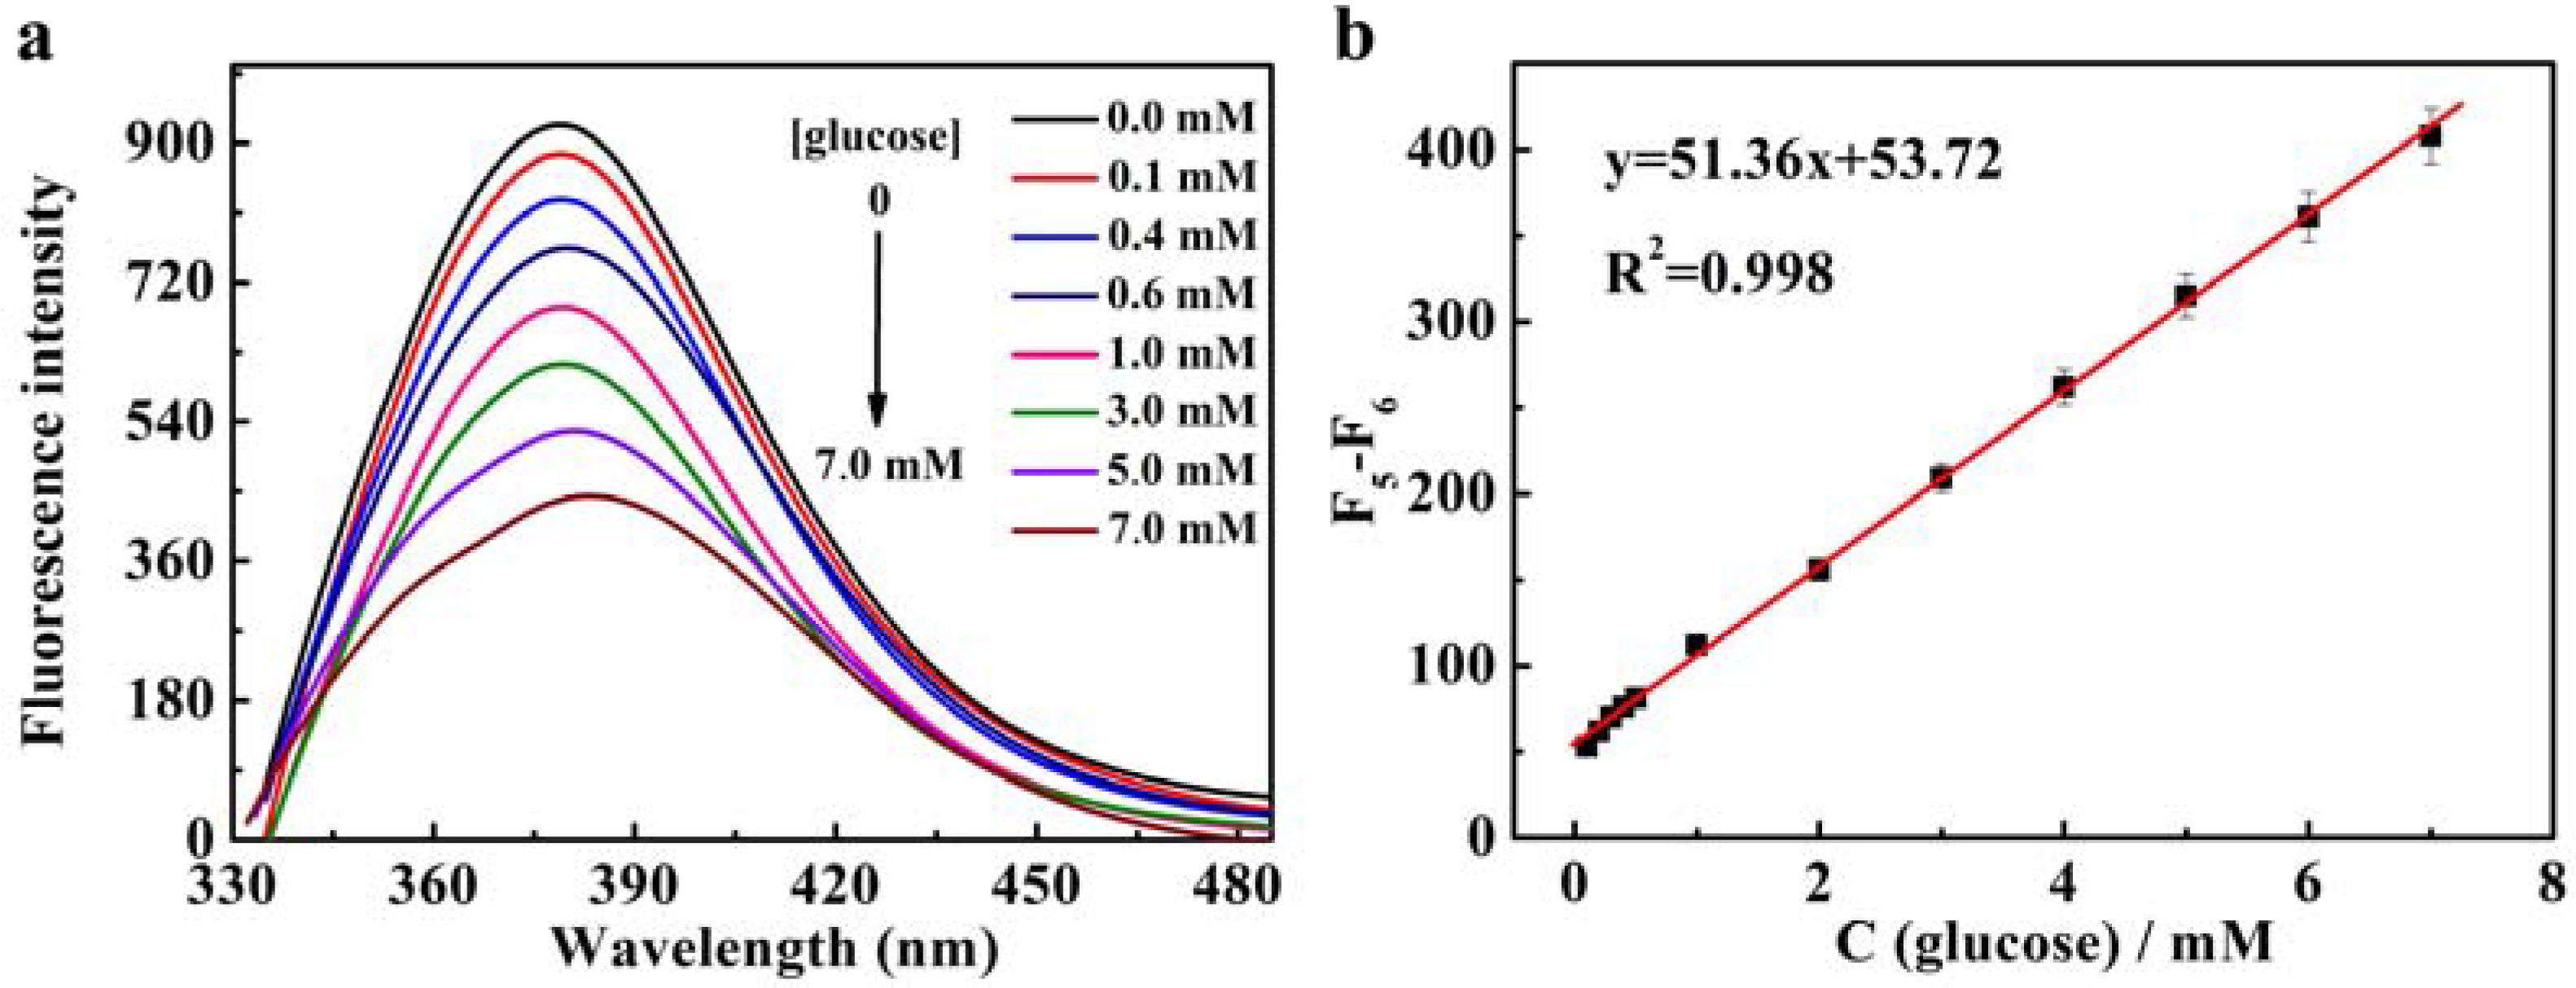
3.4. Detection of Glucose Based on CNDs-Cu2+ System

H2O2 is the main product of the reaction between glucose and GOx, so CNDs-Cu2+-H2O2 system can be utilized to analyse glucose. As illustrated in Figure 5, there is no significant difference when glucose or GOx is added in CNDs and CNDs-Cu2+ system. When glucose is oxidized by GOx, the fluorescence of CNDs-Cu2+ platform was quenched effectively. The fluorescence difference was proportional to the concentration of glucose in the range from 0.1 to 7 mM with LOD 39.8 µM (Figure 6). The fluorescence response of this platform to the glucose ranging from 0 to 1.0 mM is depicted in Figure S8, where the slope of the linear equation is similar to that of glucose with concentration from 0.1 to 7.0 mM, indicating that the glucose with low concentrations can be also sensitively detected. In comparison with the reported studies (Table 2), this new strategy is demonstrated to not be inferior to other works [36,37,38,39,40,41]. Additionally, CNDs involved in this assay, as a novel probe, are easily synthesized, experimentally convenient, and low-cost, and can be used to detect ATP and glucose simultaneously.

3.5. Selectivity for ATP and Glucose

To examine the selectivity of this CNDs-Cu2+-H2O2 system for ATP, other analogous molecules, including CTP, ADP, UTP, and GTP are investigated under the optimized conditions. As shown in Figure 7a, only the addition of ATP produces an obvious fluorescence recovery, suggesting the highly selectivity for ATP. Additionally, some interference substances, such as galactose, fructose, sucrose, mannose, lactose, sodium citrate, AA, and KCl, are evaluated. Due to the high specificity of GOx for glucose, other compounds cannot induce the effective fluorescence quenching of CNDs, indicating a high selectivity of our proposed sensing system for glucose.

3.6. Detection of ATP and Glucose in Human Serum Samples

To evaluate the applicability of this sensing system, the proposed strategy is used to determine ATP and glucose in human serum samples. The results are shown in Table 3, the concentration of ATP in human serum sample (without dilution) measured by our method is about 4.3 µM, which is consistent with the value detected by the high-performance liquid chromatograph (HPLC). With a standard addition method, the real samples are spiked with certain amounts of ATP and the satisfactory recoveries of ATP in the range from 102.4 to 106.4% are reached. On the other hand, the concentration of glucose in human serum sample (without dilution) detected by our method is about 3.41 mM, which is similar to the clinic value provided by local hospital (3.78 mM). Next, the recoveries in the ranges from 98.0 to 104.8% are obtained by spiking different concentrations standard glucose solutions into human serum samples (Table 4). All results demonstrate that this proposed method is practicable, reliable, and can be used for simultaneous determination of ATP and glucose in human serum samples.

4. Conclusions

Herein, a fluorescence sensing platform based on CNDs for the detection of ATP and glucose with superior sensitivity and selectivity has constructed. The sensing mechanism is that Cu2+ can react with H2O2 to generate ·OH, which quenches the fluorescence of CNDs. Incorporating both ATP and glucose, which respond respectively to Cu2+ and H2O2, the measurements of ATP and glucose can be simultaneously achieved in human serum samples with satisfactory recoveries. Due to the abnormal levels of ATP and glucose closely related to some diseases, this assay has been proposed in an effort to find a proper candidate for use in routine clinical practice.

Supplementary Materials

The following are available online at https://www.mdpi.com/1424-8220/18/7/2151/s1, Figure S1. Excitation-dependent fluorescence spectra of CNDs. Figure S2. Fluorescence spectra of CNDs upon addition of different concentrations of Cu2+ (a) in the presence of H2O2 (5 mM) and the corresponding linear ranges of Cu2+ (b). Figure S3. Fluorescence spectra of CNDs upon addition of different concentrations of Cu2+ in the absence of H2O2. Figure S4. Fluorescence spectra of CNDs upon addition of different concentrations of H2O2 (a) in the presence of Cu2+ (2 µM) and the corresponding linear ranges of H2O2 (b). Figure S5. Photographs of Cu2+-H2O2-TMB system with different concentrations of Cu2+ under visible light. Figure S6. Influence of pH values on CNDs-Cu2+-H2O2 system. Figure S7. Influence of the incubation time between Cu2+and ATP. The concentrations of CNDs, H2O2, Cu2+ and ATP were 0.014 mg/mL, 5 mM, 600 nM and 1 µM, respectively. Figure S8. Fluorescence spectra of CNDs in the presence of different concentrations of glucose (a) and the corresponding linear range from 0.1 mM to 1 mM (b). The concentrations of CNDs, Cu2+, and GOx were 0.014 mg/mL, 600 nM, and 10 U/mL respectively.

Author Contributions

F.Q. and J.L. conceived and designed the experiments; J.L. performed the experiments; F.Q. and J.L. wrote and checked the paper; and W.H., L.X. and J.Y. contributed the analysis of the experiment results.

Funding

This research was funded by the National Natural Science Foundation of China (Youth Fund Project) (21405093), the Scientific Research Foundation of Qufu Normal University (BSQD20130117), and the Experimental Research Project of Qufu Normal University (jp201716).

Conflicts of Interest

The authors declare no conflict of interest.

References

  1. Wei, Y.; Chen, Y.; Li, H.; Shuang, S.; Dong, C.; Wang, G. An exonuclease I-based label-free fluorometric aptasensor for adenosine triphosphate (ATP) detection with a wide concentration range. Biosens. Bioelectron. 2015, 63, 311–316. [Google Scholar] [CrossRef] [PubMed]
  2. Ma, K.; Wang, H.; Li, H.; Wang, S.; Li, X.; Xu, B.; Tian, W. A label-free aptasensor for turn-on fluorescent detection of ATP based on AIE-active probe and water-soluble carbon nanotubes. Sens. Actuators B 2016, 230, 556–558. [Google Scholar] [CrossRef]
  3. Hao, G.; Wang, D.; Sun, Y.; Yu, J.; Lin, F.; Cao, H. Association of blood glucose and lipid levels with complete blood count indices to establish a regression model. Biomed. Rep. 2017, 6, 339–345. [Google Scholar] [CrossRef] [PubMed] [Green Version]
  4. Zhu, J.; Yu, C.; Chen, Y.; Shin, J.; Cao, Q.; Kim, J. A self-assembled amphiphilic imidazolium-based ATP probe. Chem. Commun. 2017, 53, 4342–4345. [Google Scholar] [CrossRef] [PubMed]
  5. He, H.; Ma, V.P.Y.; Leung, K.H.; Chan, D.S.H.; Yang, H.; Cheng, Z.; Leung, C.H.; Ma, D.L. A label-free G-quadruplex-based switch-on fluorescence assay for the selective detection of ATP. Analyst 2012, 137, 1538–1540. [Google Scholar] [CrossRef] [PubMed]
  6. Rastogi, L.; Karunasagar, D.; Sashidhar, R.B.; Giri, A. Peroxidase-like activity of gum kondagogu reduced/stabilized palladium nanoparticles and its analytical application for colorimetric detection of glucose in biological samples. Sens. Actuators B 2017, 240, 1182–1188. [Google Scholar] [CrossRef]
  7. Hu, A.; Liu, Y.; Deng, H.; Hong, G.; Liu, A.L.; Lin, X.; Xia, X.; Chen, W. Fluorescent hydrogen peroxide sensor based on cupric oxide nanoparticles and its application for glucose and l-lactate detection. Biosens. Bioelectron. 2014, 61, 374–378. [Google Scholar] [CrossRef] [PubMed]
  8. Lu, L.; Si, J.; Gao, Z.; Zhang, Y.; Lei, J.; Luo, H.; Li, N. Highly selective and sensitive electrochemical biosensor for ATP based on the dual strategy integrating the cofactor-dependent enzymatic ligation reaction with self-cleaving DNAzyme-amplified electrochemical detection. Biosens. Bioelectron. 2015, 63, 14–20. [Google Scholar] [CrossRef] [PubMed]
  9. Schweinsberg, P.D.; Loo, T.L. Simultaneous analysis of ATP, ADP, AMP, and other purines in human erythrocytes by high-performance liquid chromatography. J. Chromatogr. B Biomed. Sci. Appl. 1980, 181, 103–107. [Google Scholar] [CrossRef]
  10. Xu, M.; Gao, Z.; Zhou, Q.; Lin, Y.; Lu, M.; Tang, D. Terbium ion-coordinated carbon dots for fluorescent aptasensing of adenosine 5′-triphosphate with unmodified gold nanoparticles. Biosens. Bioelectron. 2016, 86, 978–984. [Google Scholar] [CrossRef] [PubMed]
  11. Muthuraj, B.; Chowdhury, S.R.; Mukherjee, S.; Patra, C.R.; Iyer, P.K. Aggregation deaggregation influenced selective and sensitive detection of Cu2+ and ATP by histidine functionalized water-soluble fluorescent perylene diimide under physiological conditions and in living cells. RSC Adv. 2015, 5, 28211–28218. [Google Scholar] [CrossRef]
  12. Moschou, E.A.; Sharma, B.V.; Deo, S.K.; Daunert, S. Fluorescence glucose detection: Advances toward the ideal in vivo biosensor. J. Fluoresc. 2004, 14, 535–547. [Google Scholar] [CrossRef] [PubMed]
  13. Qu, F.; Guo, X.; Liu, D.; Chen, G.; You, J. Dual-emission carbon nanodots as a ratiometric nanosensor for the detection of glucose and glucose oxidase. Sens. Actuators B 2016, 233, 320–327. [Google Scholar] [CrossRef]
  14. Liu, S.; Sun, Y. Co-immobilization of glucose oxidase and hexokinase on silicate hybrid sol–gel membrane for glucose and ATP detections. Biosens. Bioelectron. 2007, 22, 905–911. [Google Scholar] [CrossRef] [PubMed]
  15. Shan, Z.; Lu, M.; Wang, L.; MacDonald, B.; MacInnis, J.; Mkandawire, M.; Zhang, X.; Oakes, K.D. Chloride accelerated Fenton chemistry for the ultrasensitive and selective colorimetric detection of copper. Chem. Commun. 2016, 52, 2087–2090. [Google Scholar] [CrossRef] [PubMed]
  16. Cappella, P.; Giansanti, V.; Pulici, M.; Gasparri, F. From “Click” to “Fenton” chemistry for 5-bromo-2′-deoxyuridine determination. Cytom. Part A 2013, 83, 989–1000. [Google Scholar] [CrossRef] [PubMed] [Green Version]
  17. Stohs, S.J.; Bagchi, D. Oxidative mechanisms in the toxicity of metal ions. Free Radic. Biol. Med. 1995, 18, 321–336. [Google Scholar] [CrossRef] [Green Version]
  18. Wang, H.; Zhang, H.; Chen, Y.; Huang, K.; Liu, Y. A label-free and ultrasensitive fluorescent sensor for dopamine detection based on double-stranded DNA templated copper nanoparticles. Sens. Actuators B 2015, 220, 146–153. [Google Scholar] [CrossRef]
  19. Shen, P.; Xia, Y. Synthesis-modification integration: One-step fabrication of boronic acid functionalized carbon dots for fluorescent blood sugar sensing. Anal. Chem. 2014, 86, 5323–5329. [Google Scholar] [CrossRef] [PubMed]
  20. De, B.; Karak, N. A green and facile approach for the synthesis of water soluble fluorescent carbon dots from banana juice. RSC Adv. 2013, 3, 8286–8290. [Google Scholar] [CrossRef]
  21. Wang, F.; Xie, Z.; Zhang, H.; Liu, C.; Zhang, Y. Highly luminescent organosilane-functionalized carbon dots. Adv. Funct. Mater. 2011, 21, 1027–1031. [Google Scholar] [CrossRef]
  22. Purbia, R.; Paria, S. A simple turn on fluorescent sensor for the selective detection of thiamine using coconut water derived luminescent carbon dots. Biosens. Bioelectron. 2016, 79, 467–475. [Google Scholar] [CrossRef] [PubMed]
  23. Chen, J.; Li, Y.; Lv, K.; Zhong, W.; Wang, H.; Wu, Z.; Yi, P.; Jiang, J. Cyclam-functionalized carbon dots sensor for sensitive and selective detection of copper (II) ion and sulfide anion in aqueous media and its imaging in live cells. Sens. Actuators B 2016, 224, 298–306. [Google Scholar] [CrossRef]
  24. Zu, F.; Yan, F.; Bai, Z.; Xu, J.; Wang, Y.; Huang, Y.; Zhou, X. The quenching of the fluorescence of carbon dots: A review on mechanisms and applications. Microchim. Acta 2017, 184, 1899–1914. [Google Scholar] [CrossRef]
  25. Pham, A.N.; Xing, G.; Miller, C.J.; Waite, T.D. Fenton-like copper redox chemistry revisited: Hydrogen peroxide and superoxide mediation of copper-catalyzed oxidant production. J. Catal. 2013, 301, 54–64. [Google Scholar] [CrossRef]
  26. Moffett, J.W.; Zika, R.G. Reaction kinetics of hydrogen peroxide with copper and iron in seawater. Environ. Sci. Technol. 1987, 21, 804–810. [Google Scholar] [CrossRef] [PubMed]
  27. Millero, F.J.; Sharma, V.K.; Karn, B. The rate of reduction of copper (II) with hydrogen peroxide in seawater. Mar. Chem. 1991, 36, 71–83. [Google Scholar] [CrossRef]
  28. Gray, R.D. Kinetics of oxidation of copper (I) by molecular oxygen in perchloric acid-acetonitrile solutions. J. Am. Chem. Soc. 1969, 91, 56–62. [Google Scholar] [CrossRef]
  29. Wang, J.; Jiang, Y.; Zhou, C.; Fang, X. Aptamer-based ATP assay using a luminescent light switching complex. Anal. Chem. 2005, 77, 3542–3546. [Google Scholar] [CrossRef] [PubMed]
  30. Zhu, Y.; Hu, X.; Shi, S.; Gao, R.; Huang, H.; Zhu, Y.; Lv, X.; Yao, T. Ultrasensitive and universal fluorescent aptasensor for the detection of biomolecules (ATP, adenosine and thrombin) based on DNA/Ag nanoclusters fluorescence light-up system. Biosens. Bioelectron. 2016, 79, 205–212. [Google Scholar] [CrossRef] [PubMed]
  31. Wang, J.; Wang, L.; Liu, X.; Liang, Z.; Song, S.; Li, W.; Li, G.; Fan, C. A Gold Nanoparticle-Based Aptamer Target Binding Readout for ATP Assay. Adv. Mater. 2007, 19, 3943–3946. [Google Scholar] [CrossRef]
  32. Tedsana, W.; Tuntulani, T.; Ngeontae, W. A highly selective turn-on ATP fluorescence sensor based on unmodified cysteamine capped CdS quantum dots. Anal. Chim. Acta 2013, 783, 65–73. [Google Scholar] [CrossRef] [PubMed]
  33. Chen, Z.; Li, G.; Zhang, L.; Jiang, J.; Li, Z.; Peng, Z.; Deng, L. A new method for the detection of ATP using a quantum-dot-tagged aptamer. Anal. Bioanal. Chem. 2008, 392, 1185–1188. [Google Scholar] [CrossRef] [PubMed]
  34. Zuo, X.; Song, S.; Zhang, J.; Pan, D.; Wang, L.; Fan, C. A target-responsive electrochemical aptamer switch (TREAS) for reagentless detection of nanomolar ATP. J. Am. Chem. Soc. 2007, 129, 1042–1043. [Google Scholar] [CrossRef] [PubMed]
  35. Li, C.; Numata, M.; Takeuchi, M.; Shinkai, S. A sensitive colorimetric and fluorescent probe based on a polythiophene derivative for the detection of ATP. Angew. Chem. Int. Ed. 2005, 44, 6371–6374. [Google Scholar] [CrossRef] [PubMed]
  36. Lin, T.; Zhong, L.; Guo, L.; Fu, F.; Chen, G. Seeing diabetes: Visual detection of glucose based on the intrinsic peroxidase-like activity of MoS2 nanosheets. Nanoscale 2014, 6, 11856–11862. [Google Scholar] [CrossRef] [PubMed]
  37. Jiang, Y.; Zhao, H.; Lin, Y.; Zhu, N.; Ma, Y.; Mao, L. Colorimetric detection of glucose in rat brain using gold nanoparticles. Angew. Chem. 2010, 122, 4910–4914. [Google Scholar] [CrossRef]
  38. Liu, Q.; Chen, P.; Xu, Z.; Chen, M.; Ding, Y.; Yue, K.; Xu, J. A facile strategy to prepare porphyrin functionalized ZnS nanoparticles and their peroxidase-like catalytic activity for colorimetric sensor of hydrogen peroxide and glucose. Sens. Actuators B 2017, 251, 339–348. [Google Scholar] [CrossRef]
  39. Ling, Y.; Zhang, N.; Qu, F.; Wen, T.; Gao, Z.; Li, N.; Luo, H. Fluorescent detection of hydrogen peroxide and glucose with polyethyleneimine-templated Cu nanoclusters. Spectrochim. Acta Part A 2014, 118, 315–320. [Google Scholar] [CrossRef] [PubMed]
  40. Zhang, W.; Ma, D.; Du, J. Prussian blue nanoparticles as peroxidase mimetics for sensitive colorimetric detection of hydrogen peroxide and glucose. Talanta 2014, 120, 362–367. [Google Scholar] [CrossRef] [PubMed]
  41. Liu, S.; Tian, J.; Wang, L.; Luo, Y.; Sun, X. A general strategy for the production of photoluminescent carbon nitride dots from organic amines and their application as novel peroxidase-like catalysts for colorimetric detection of H2O2 and glucose. RSC Adv. 2012, 2, 411–413. [Google Scholar] [CrossRef]
Figure 1. TEM image (a), FT-IR spectrum (b), UV–VIS absorption (black curve), and fluorescence emission (blue curve), and excitation (red curve) spectra of CNDs (c). The inset of (c) is the photograph of CNDs under visible light and UV light at 365 nm.
Sensors 18 02151 g001
Figure 2. Fluorescence spectra of CNDs in the absence and presence of Cu2+, H2O2, and the mixture of Cu2+ and H2O2, respectively. The concentrations of CNDs, Cu2+, and H2O2 were 0.014 mg/mL, 2 µM, and 5 mM, respectively.
Sensors 18 02151 g002
Scheme 1. Schematic illustration of the CNDs as a fluorescence probe for the detection of ATP and glucose.
Sensors 18 02151 sch001
Figure 3. Fluorescence spectra of free CNDs (1) and CNDs in the presence of ATP (2), H2O2 and ATP (3), Cu2+ and ATP (4), Cu2+ and H2O2 (5) and Cu2+, H2O2, and ATP (6). The final concentrations of CNDs, H2O2, Cu2+, and ATP were 0.014 mg/mL, 5 mM, 600 nM and 7 µM respectively. The inset shows the corresponding images under UV light.
Sensors 18 02151 g003
Figure 4. Fluorescence responses to different concentrations of ATP (a) and corresponding linear ranges (b). The concentrations of CNDs, H2O2 and Cu2+ were 0.014 mg/mL, 5 mM and 600 nM, respectively.
Sensors 18 02151 g004
Figure 5. Fluorescence spectra of free CNDs (1) and CNDs in the presence of glucose (2), Cu2+ and glucose (3), GOx (4), Cu2+ and GOx (5), and the mixture of Cu2+, glucose and GOx (6). The final concentrations of CNDs, glucose, Cu2+ and GOx were 0.014 mg/mL, 5 mM, 600 nM and 10 U/mL respectively. The inset shows the corresponding images under UV light at 365 nm.
Sensors 18 02151 g005
Figure 6. Fluorescence spectra of CNDs in the presence of different concentrations of glucose (a) and the corresponding linear range (b). The concentrations of CNDs, Cu2+ and GOx were 0.014 mg/mL, 600 nM, and 10 U/mL, respectively.
Sensors 18 02151 g006
Figure 7. Selectivity of detection of ATP (a) and glucose (b). The concentrations of ATP and other interference substances in Figure 7a are 3 µM. In Figure 7b, glucose, and other substances are 3 mM.
Sensors 18 02151 g007
Table 1. Comparison of analysis methods for the detection of ATP.
MethodProbeLinear RangeLODRef.
FluorescenceRu complex0–0.1 µM20 nM29
FluorescenceDNA template Ag nanoclusters (AgNCs)0.5–8.0 µM91.6 nM30
Colorimetric detectionGold nanoparticles4.4–132.7 µM0.6 µM31
FluorescenceCysteamine capped CdS quantum dots (QDs)20–80 µM17 µM32
FluorescenceDNA binding dye berberine0.5–50 µM140 nM1
FluorescenceQD-tagged aptamer0.1–1 mM24 µM33
Electrochemicallabeled anti-ATP aptamer10 nM–1 mM-34
Fluorescence and Colorimetric detectioncationic polythiophene derivative10−8–10−4 M-35
FluorescenceCNDs0.1–7 µM30.2 nMThis work
Table 2. Comparison of analysis methods for the detection of glucose.
MethodProbeLinear RangeLODRef.
Colorimetric detectionMoS2 nanosheets5–150 µM1.2 µM36
Fluorescenceboronic acid modified carbon dots9–900 µM1.5 µM19
Colorimetric detectionGold nanoparticles0–5 mM-37
Colorimetric detectionZnS nanoparticles0.05–0.5 mM36 µM38
FluorescenceCopper nanoclusters10–100 µM8 µM39
Colorimetric detectionPrussian blue nanoparticles0.1–50 µM0.03 µM40
Fluorescencecarbon nitride dots1–100 µM0.4 µM41
FluorescenceCNDs0.1–7 mM39.8 µMThis work
Table 3. Determination of ATP in serum samples.
SampleStandard Added µMFound Value µMRecovery (%)RSD (n = 3, %)
10.00.433 *-1.43
20.10.537104.01.68
31.01.497106.41.16
45.05.553102.41.61
* The concentration of ATP in human serum sample with diluted 10 times measured by our method is 0.43 µM, which is in agreement with the values detected by HPLC (4.1 µM without dilution).
Table 4. Determination of glucose in serum samples.
SampleStandard Added mMFound Value mMRecovery (%)RSD (n = 3, %)
100.341 *-1.38
20.10.43998.01.02
31.01.389104.81.52
43.03.28498.11.83
* The concentration of glucose in human serum sample with diluted 10 times measured by our method is 0.341 mM, which is consistent with the clinical data provided by a local hospital (3.78 mM without dilution).

