Complexity of Daily Physical Activity Is More Sensitive Than Conventional Metrics to Assess Functional Change in Younger Older Adults

 ,
,  , , , ,
  ,
,  ,
, 
Abstract
1. Introduction
2. Materials and Methods
2.1. Study Protocol
2.2. Sensor Data Processing
2.3. Univariate Analysis
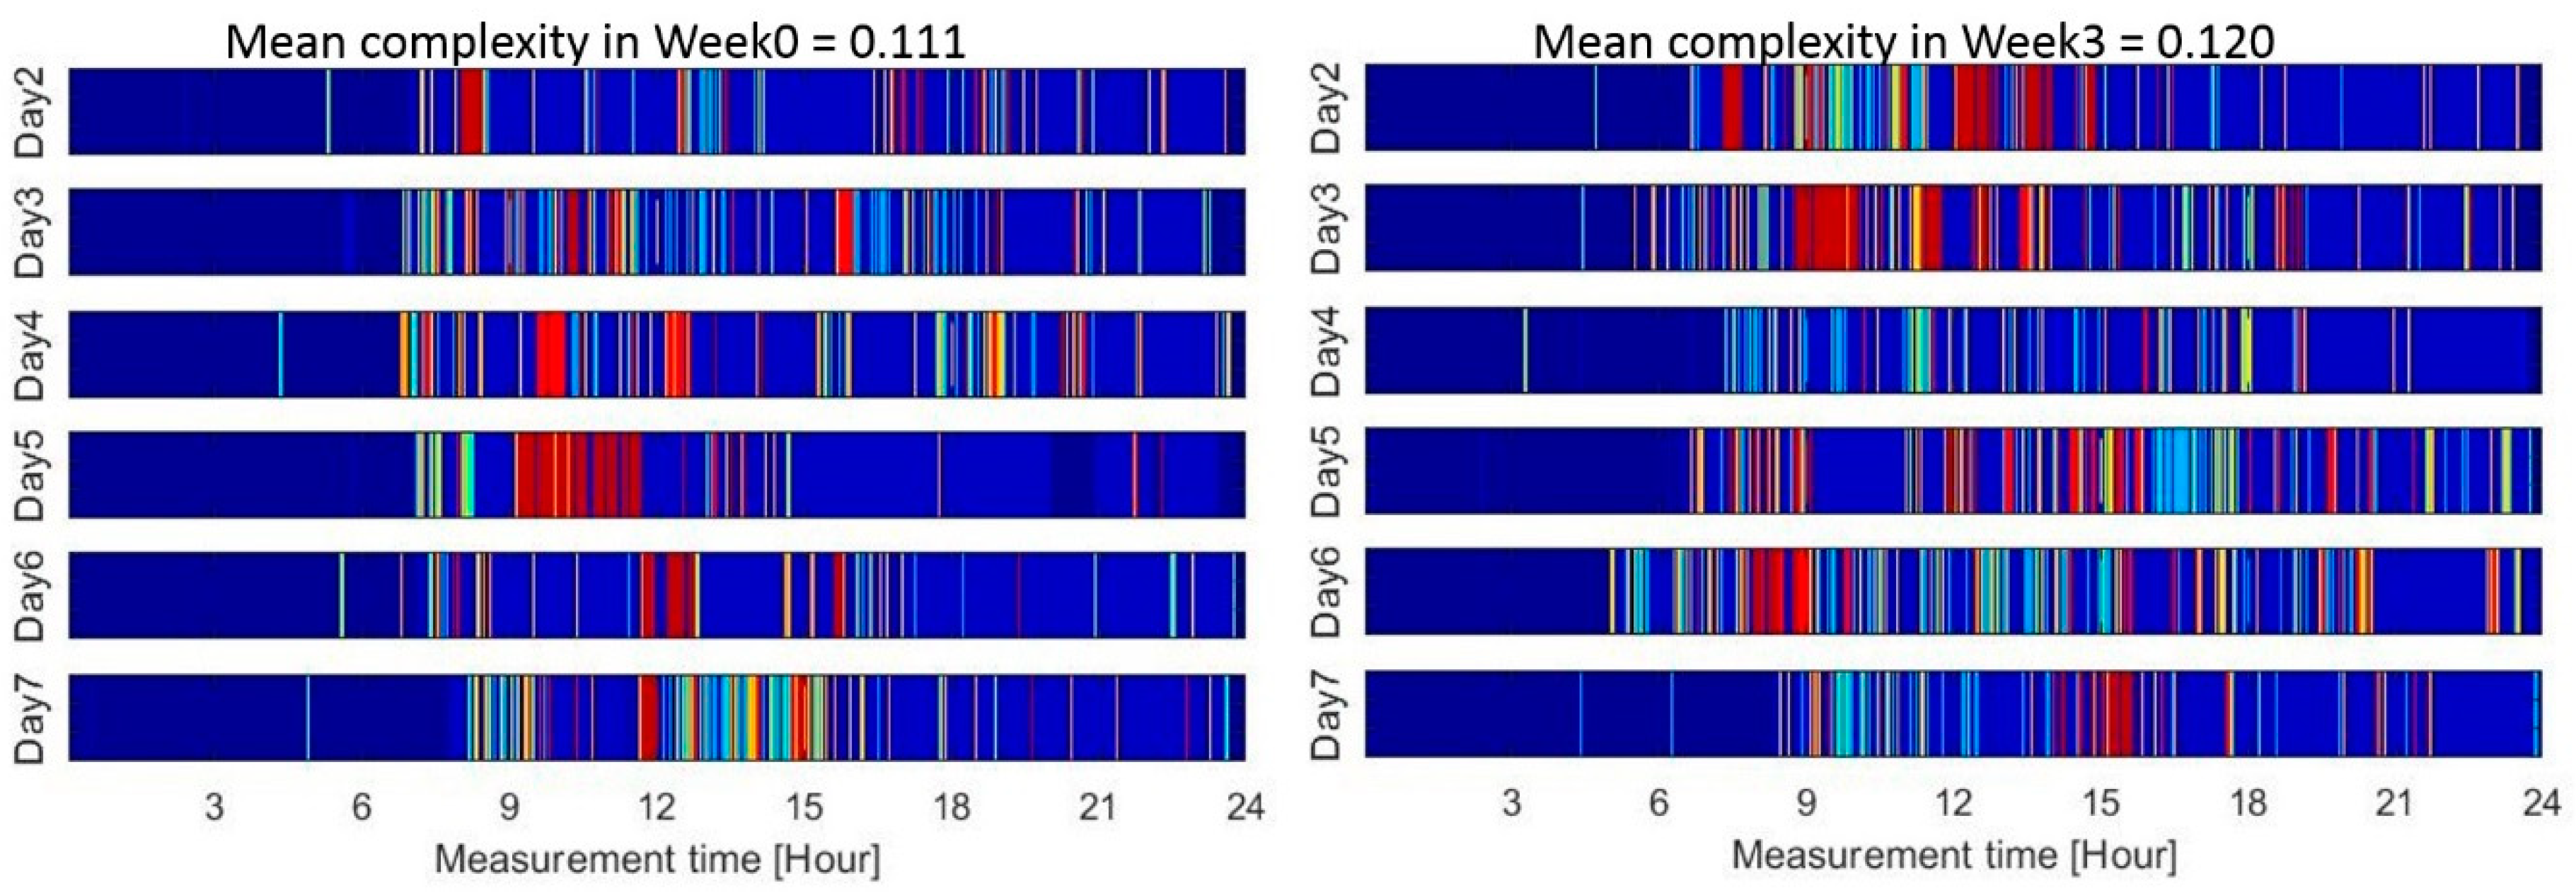
2.4. Complexity Analysis
2.5. Statistical Analysis
3. Results
4. Discussion
5. Conclusions
Author Contributions
Funding
Acknowledgments
Conflicts of Interest
Appendix A
Appendix A.1. Adapted Barcode Design and Complexity Computation

| Category | Intensity | Duration | State |
|---|---|---|---|
| Lying | 1 | ||
| Sedentary | 2 | ||
| Active | ActiCounts ≤ 3500 (counts/minute) | 3 | |
| 3500 < ActiCounts ≤ 7000 | 4 | ||
| 7000 < ActiCounts ≤ 10000 | 5 | ||
| ActiCounts > 10000 | 6 | ||
| Walking | Cadence ≤ 60 (steps/minute) | Duration ≤ 30 s | 7 |
| 60 < Cadence ≤ 90 | 8 | ||
| 90 < Cadence ≤ 140 | 9 | ||
| Cadence > 140 | 10 | ||
| Cadence ≤ 60 | 30 < Duration ≤ 120 | 11 | |
| 60 < Cadence ≤ 90 | 12 | ||
| 90 < Cadence ≤ 140 | 13 | ||
| Cadence > 140 | 14 | ||
| Cadence ≤ 60 | Duration > 120 | 15 | |
| 60 < Cadence ≤ 90 | 16 | ||
| 90 < Cadence ≤ 140 | 17 | ||
| Cadence > 140 | 18 |
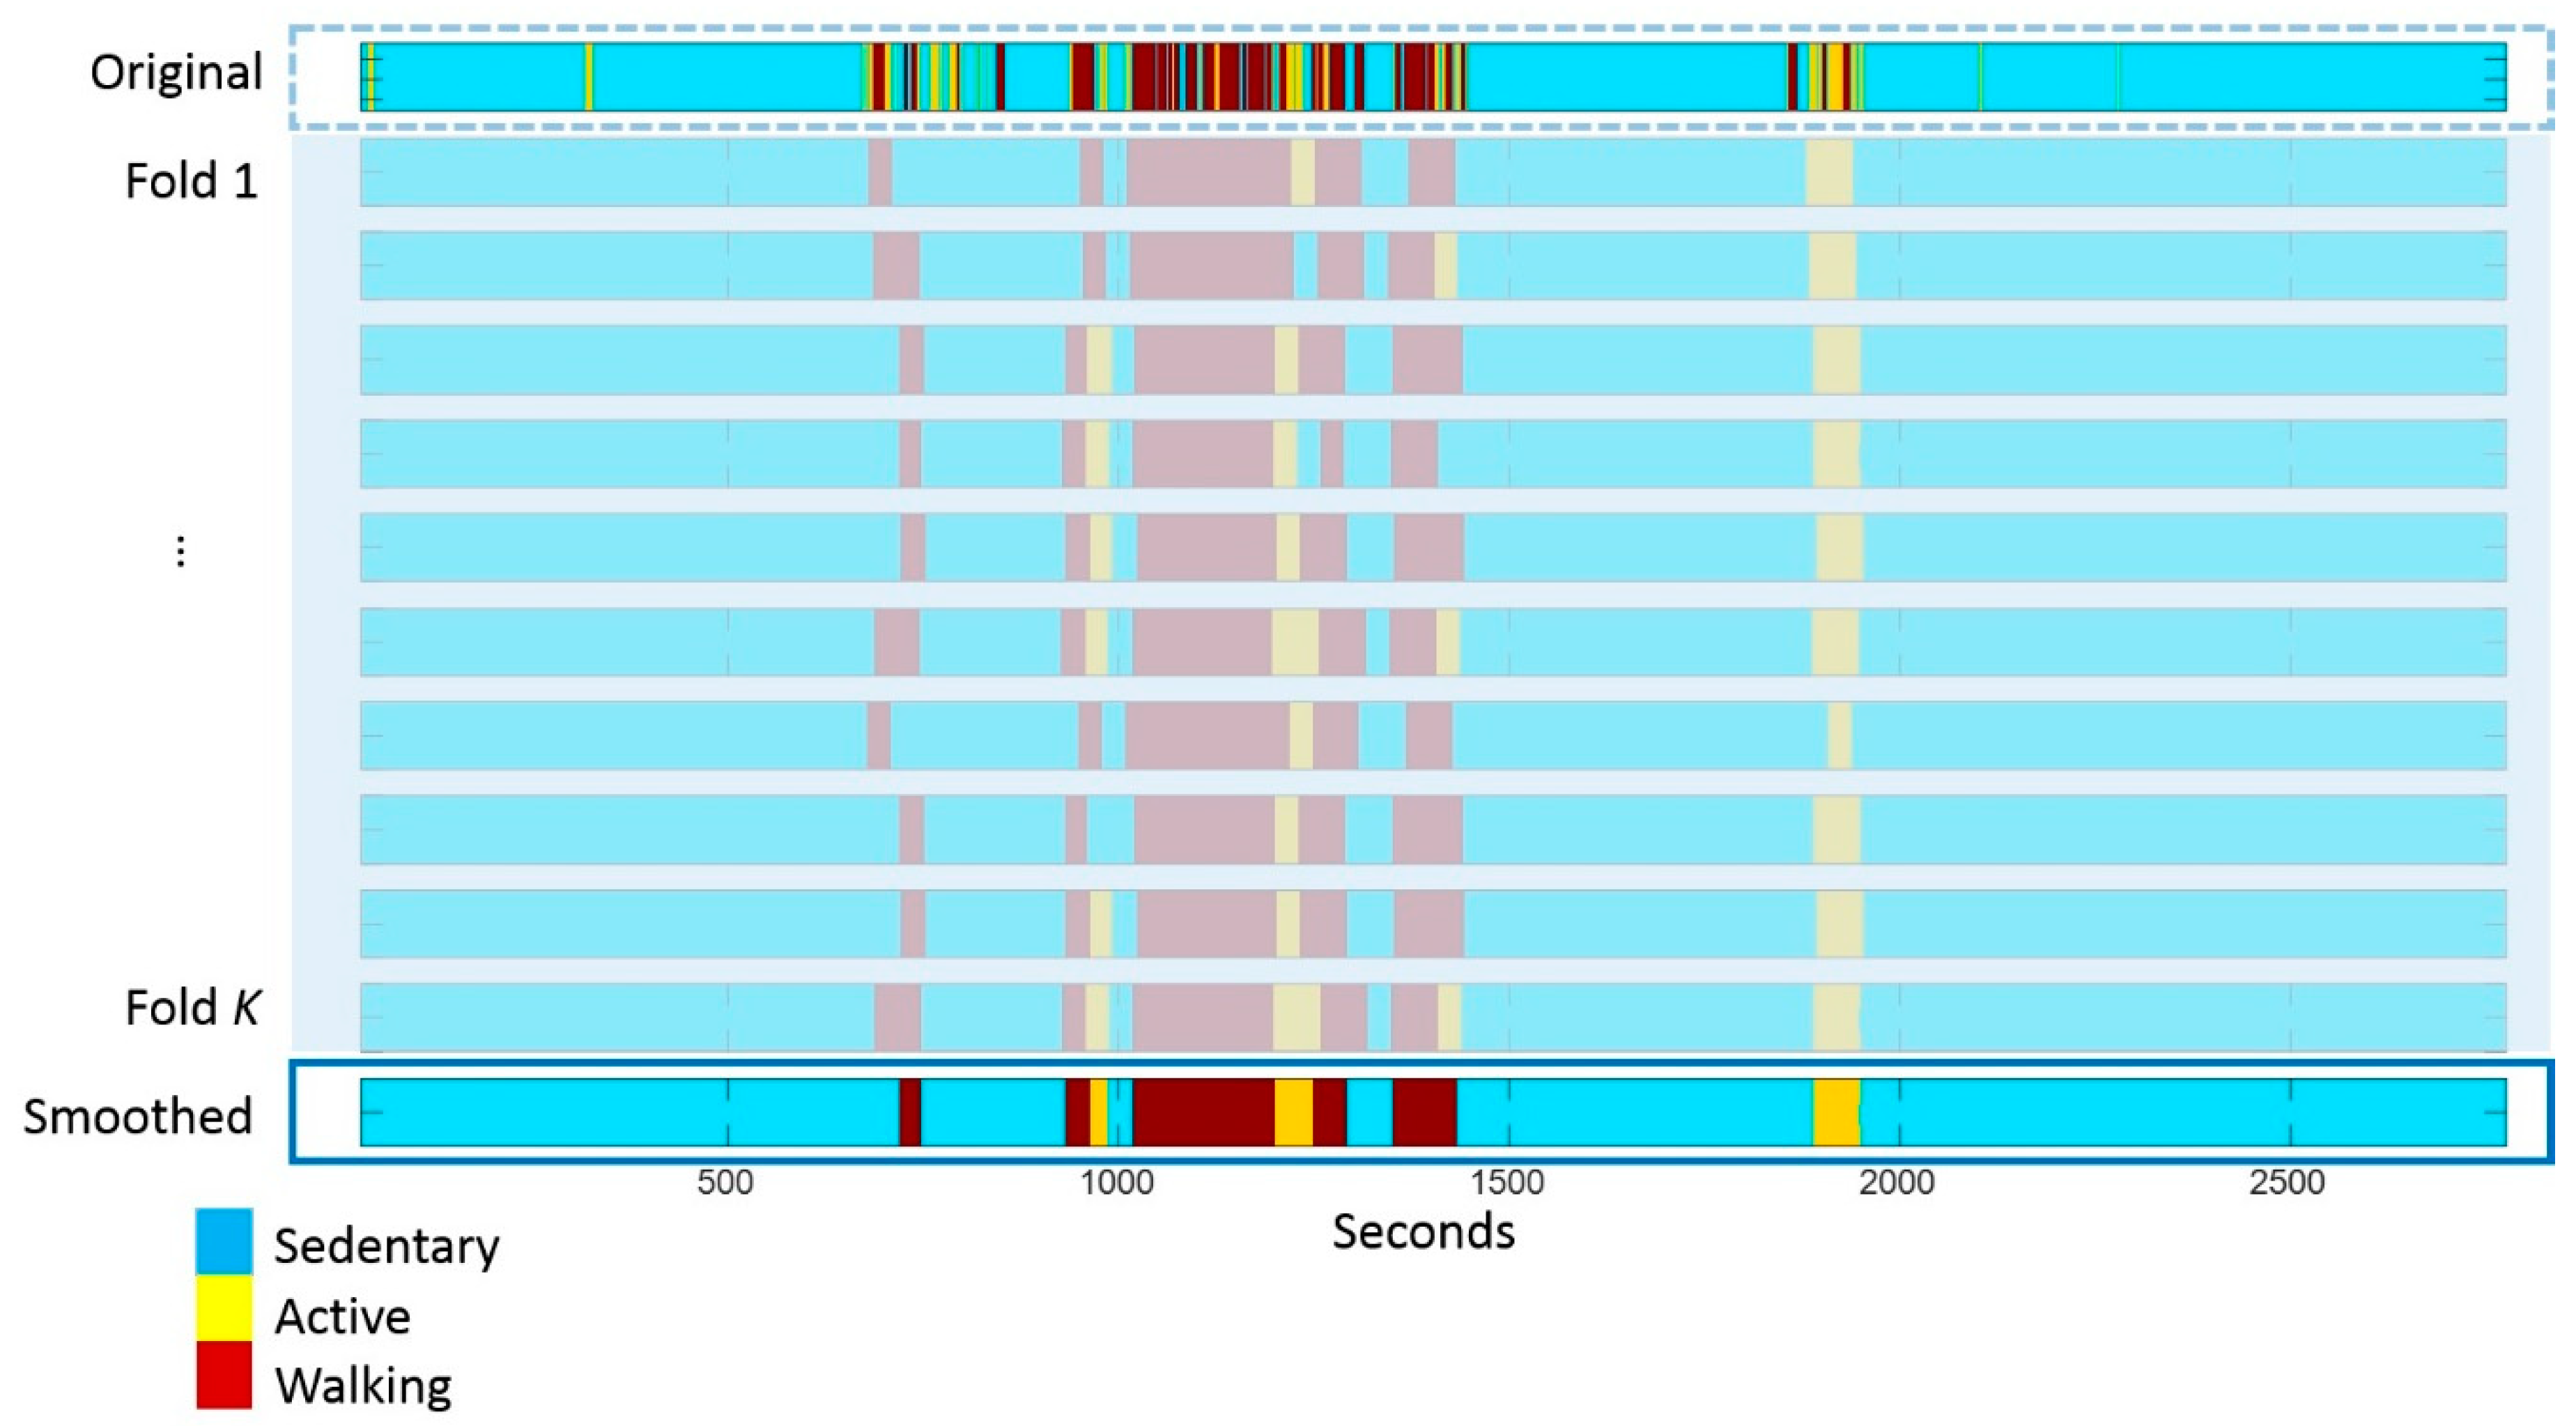
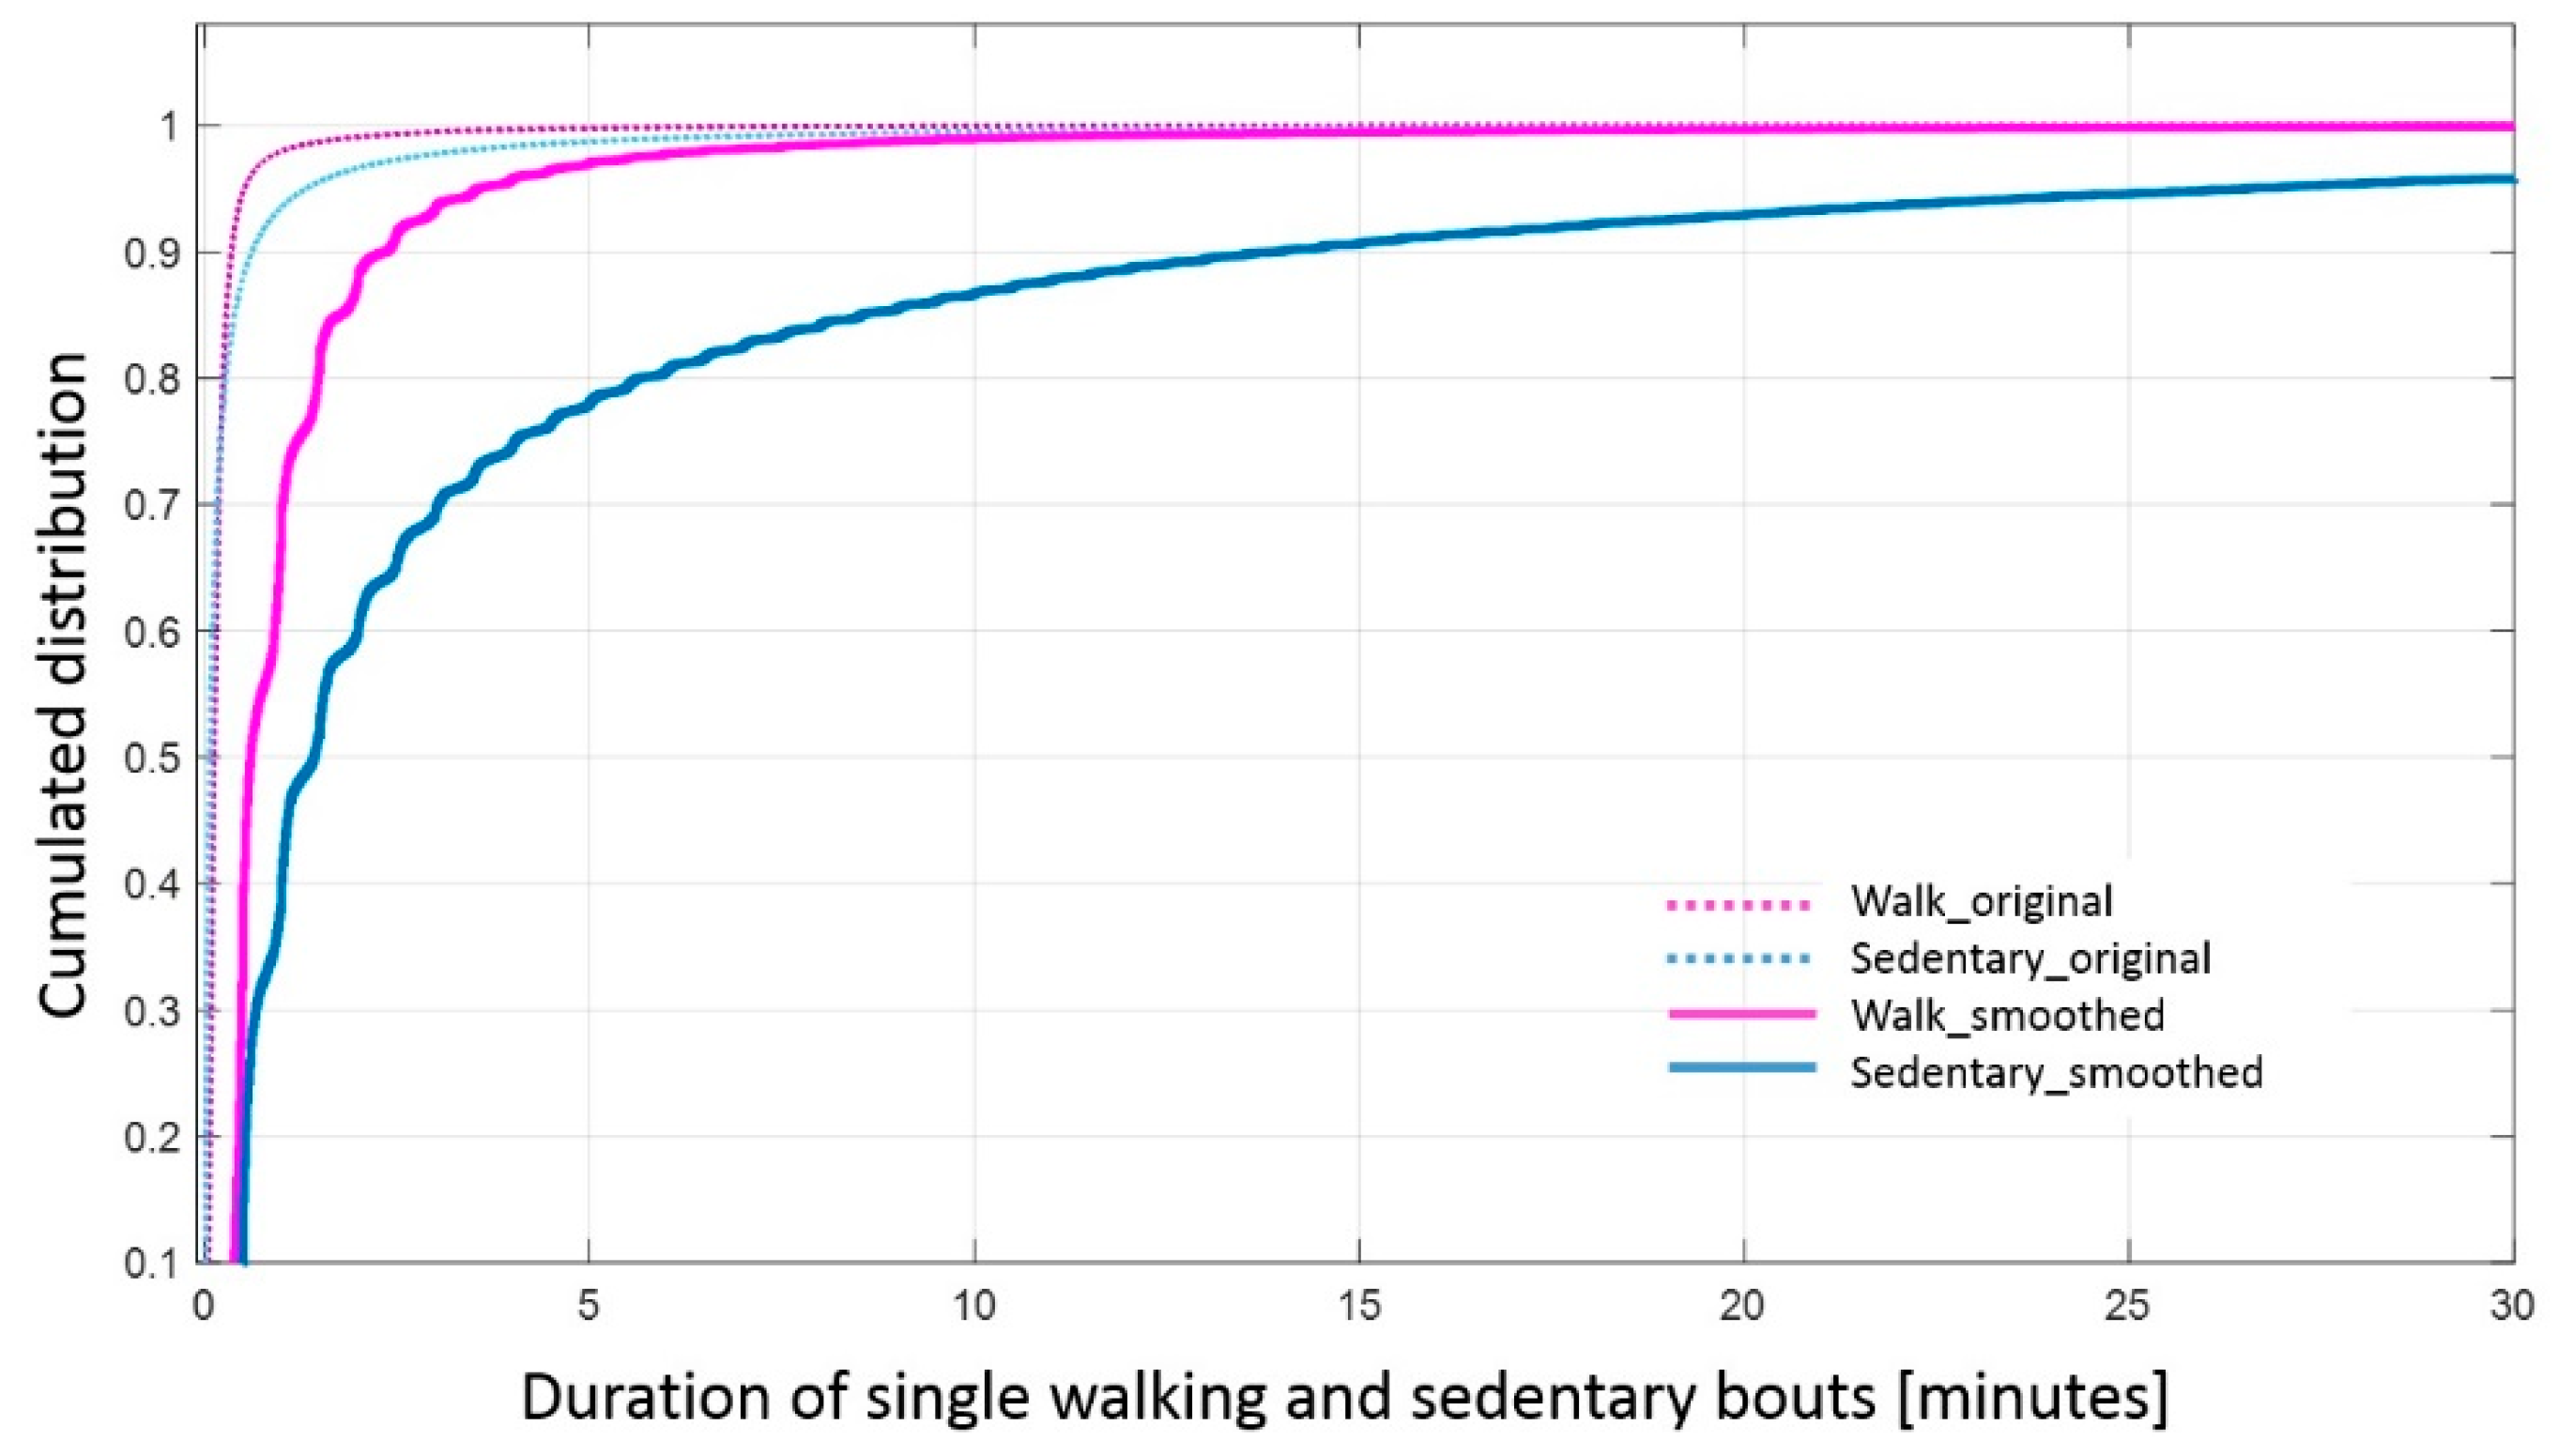
Appendix A.2. Effect of Smoothing on the Duration of Activity Bouts and Reliability of Complexity


References
- Helbostad, J.L.; Vereijken, B.; Becker, C.; Todd, C.; Taraldsen, K.; Pijnappels, M.; Aminian, K.; Mellone, S. Mobile Health Applications to Promote Active and Healthy Ageing. Sensors 2017, 17, 622. [Google Scholar] [CrossRef] [PubMed]
- World Health Organization. Global Health Risks: Mortality and Burden of Disease Attributable to Selected Major Risks; World Health Organization: Geneva, Switzerland, 2009. [Google Scholar]
- Slingerland, A.S.; van Lenthe, F.J.; Jukema, J.W.; Kamphuis, C.B.M.; Looman, C.; Huisman, M.; Narayan, K.M.; Mackenbach, J.P.; Brug, J. Aging, Retirement, and Changes in Physical Activity: Prospective Cohort Findings from the GLOBE Study. Am. J. Epidemiol. 2007, 165, 1356–1363. [Google Scholar] [CrossRef] [PubMed]
- Bort-Roig, J.; Gilson, N.D.; Puig-Ribera, A.; Contreras, R.S.; Trost, S.G. Measuring and influencing physical activity with smartphone technology: A systematic review. Sports Med. 2014, 44, 671–686. [Google Scholar] [CrossRef] [PubMed]
- Althoff, T.; Sosič, R.; Hicks, J.L.; King, A.C.; Delp, S.L.; Leskovec, J. Large-scale physical activity data reveal worldwide activity inequality. Nature 2017, 547, 336–339. [Google Scholar] [CrossRef] [PubMed]
- Taraldsen, K.; Chastin, S.F.M.; Riphagen, I.I.; Vereijken, B.; Helbostad, J.L. Physical activity monitoring by use of accelerometer-based body-worn sensors in older adults: A systematic literature review of current knowledge and applications. Maturitas 2012, 71, 13–19. [Google Scholar] [CrossRef] [PubMed]
- Brodie, M.A.; Lord, S.R.; Coppens, M.J.; Annegarn, J.; Delbaere, K. Eight-Week Remote Monitoring Using a Freely Worn Device Reveals Unstable Gait Patterns in Older Fallers. IEEE Trans. Biomed. Eng. 2015, 62, 2588–2594. [Google Scholar] [CrossRef] [PubMed]
- Ahlrichs, C.; Samà, A.; Lawo, M.; Cabestany, J.; Rodríguez-Martín, D.; Pérez-López, C.; Sweeney, D.; Quinlan, L.R.; Laighin, G.Ò.; Counihan, T.; et al. Detecting freezing of gait with a tri-axial accelerometer in Parkinson’s disease patients. Med. Biol. Eng. Comput. 2016, 54, 223–233. [Google Scholar] [CrossRef] [PubMed]
- Hausdorff, J.M. Gait Dynamics, Fractals and Falls: Finding Meaning in the Stride-To-Stride Fluctuations of Human Walking. Hum. Mov. Sci. 2007, 26, 555–589. [Google Scholar] [CrossRef] [PubMed]
- Paraschiv-Ionescu, A.; Perruchoud, C.; Buchser, E.; Aminian, K. Barcoding Human Physical Activity to Assess Chronic Pain Conditions. PLoS ONE 2012, 7, e32239. [Google Scholar] [CrossRef] [PubMed]
- Paraschiv-Ionescu, A.; Perruchoud, C.; Rutschmann, B.; Buchser, E.; Aminian, K. Quantifying dimensions of physical behavior in chronic pain conditions. J. Neuroeng. Rehabil. 2016, 13, 85. [Google Scholar] [CrossRef] [PubMed]
- Paraschiv-Ionescu, A.; Buchser, E.; Aminian, K. Unraveling dynamics of human physical activity patterns in chronic pain conditions. Sci. Rep. 2013, 3, 2019. [Google Scholar] [CrossRef] [PubMed]
- Moufawad el Achkar, C.; Lenoble-Hoskovec, C.; Paraschiv-Ionescu, A.; Major, K.; Büla, C.; Aminian, K. Physical Behavior in Older Persons during Daily Life: Insights from Instrumented Shoes. Sensors 2016, 16, 1225. [Google Scholar] [CrossRef] [PubMed]
- ISRCTN—ISRCTN37750605: Feasibility of the Adapted LiFE (aLiFE) Intervention—A pilot Study. Available online: http://www.isrctn.com/ISRCTN37750605 (accessed on 16 February 2017).
- Balasubramanian, C.K. The community balance and mobility scale alleviates the ceiling effects observed in the currently used gait and balance assessments for the community-dwelling older adults. J. Geriatr. Phys. Ther. 2015, 38, 78–89. [Google Scholar] [CrossRef] [PubMed]
- Fleiner, T.; Haussermann, P.; Mellone, S.; Zijlstra, W. Sensor-based assessment of mobility-related behavior in dementia: Feasibility and relevance in a hospital context. Int. Psychogeriatr. 2016, 28, 1687–1694. [Google Scholar] [CrossRef] [PubMed]
- Chigateri, N.; Kerse, N.; MacDonald, B.; Klenk, J. Validation of Walking Episode Recognition in Supervised and Free-living Conditions Using Triaxial Accelerometers. In Proceedings of the 2017 World Congress of International Society for Posture & Gait Research, Fort Lauderdale, FL, USA, 25–29 June 2017; pp. 289–290. [Google Scholar]
- Bourke, A.K.; Ihlen, E.A.F.; Bergquist, R.; Wik, P.B.; Vereijken, B.; Helbostad, J.L. A Physical Activity Reference Data-Set Recorded from Older Adults Using Body-Worn Inertial Sensors and Video Technology—The ADAPT Study Data-Set. Sensors 2017, 17, 559. [Google Scholar] [CrossRef] [PubMed]
- Sasaki, J.E.; John, D.; Freedson, P.S. Validation and comparison of ActiGraph activity monitors. J. Sci. Med. Sport 2011, 14, 411–416. [Google Scholar] [CrossRef] [PubMed]
- Mansoubi, M.; Pearson, N.; Clemes, S.A.; Biddle, S.J.; Bodicoat, D.H.; Tolfrey, K.; Edwardson, L.; Yates, T. Energy expenditure during common sitting and standing tasks: Examining the 1.5 MET definition of sedentary behaviour. BMC Public Health 2015, 15, 516. [Google Scholar] [CrossRef] [PubMed]
- Ryu, U.; Ahn, K.; Kim, E.; Kim, M.; Kim, B.; Woo, S.; Chang, Y. Adaptive Step Detection Algorithm for Wireless Smart Step Counter. In Proceedings of the 2013 International Conference on Information Science and Applications (ICISA), Suwon, Korea, 24–26 June 2013; pp. 1–4. [Google Scholar]
- Razjouyan, J.; Grewal, G.S.; Rishel, C.; Parthasarathy, S.; Mohler, J.; Najafi, B. Activity Monitoring and Heart Rate Variability as Indicators of Fall Risk: Proof-of-Concept for Application of Wearable Sensors in the Acute Care Setting. J. Gerontol. Nurs. 2017, 43, 53–62. [Google Scholar] [CrossRef] [PubMed]
- Orlov, Y.L.; Potapov, V.N. Complexity: An internet resource for analysis of DNA sequence complexity. Nucleic Acids Res. 2004, 32, W628–W633. [Google Scholar] [CrossRef] [PubMed]
- Seely, A.J.; Macklem, P.T. Complex systems and the technology of variability analysis. Crit. Care 2004, 8, R367. [Google Scholar] [CrossRef] [PubMed]
- Cavanaugh, J.T.; Kochi, N.; Stergiou, N. Nonlinear Analysis of Ambulatory Activity Patterns in Community-Dwelling Older Adults. J. Gerontol. Ser. A 2010, 65A, 197–203. [Google Scholar] [CrossRef] [PubMed]
- Lempel, A.; Ziv, J. On the Complexity of Finite Sequences. IEEE Trans. Inf. Theory. 1976, 22, 75–81. [Google Scholar] [CrossRef]
- De Bruin, E.D.; Najafi, B.; Murer, K.; Uebelhart, D.; Aminian, K. Quantification of everyday motor function in a geriatric population. J. Rehabil. Res. Dev. 2007, 44, 417–428. [Google Scholar] [CrossRef] [PubMed]
- Macbeth, G.; Razumiejczyk, E.; Ledesma, R.D. Cliff’s Delta Calculator: A non-parametric effect size program for two groups of observations. Univ. Psychol. 2011, 10, 545–555. [Google Scholar]
- Lipsitz, L.A. Physiological Complexity, Aging, and the Path to Frailty. Sci. Aging Knowl. Environ. 2004, 2004, pe16. [Google Scholar] [CrossRef] [PubMed]
- Vaillancourt, D.E.; Newell, K.M. Changing complexity in human behavior and physiology through aging and disease. Neurobiol. Aging. 2002, 23, 1–11. [Google Scholar] [CrossRef]
- Razjouyan, J.; Naik, A.D.; Horstman, M.J.; Kunik, M.E.; Amirmazaheri, M.; Zhou, H.; Sharafkhaneh, A.; Najafi, B. Wearable Sensors and the Assessment of Frailty among Vulnerable Older Adults: An Observational Cohort Study. Sensors 2018, 18, 1336. [Google Scholar] [CrossRef] [PubMed]


| Week0 or Pre Pilot (Mean ± SD) Original/Smoothed | Week3 or Post Pilot (Mean ± SD) Original/Smoothed | Association (ρ) with CBMS Original/Smoothed | Effect Size (Cliff’s Delta) Original/Smoothed | |
|---|---|---|---|---|
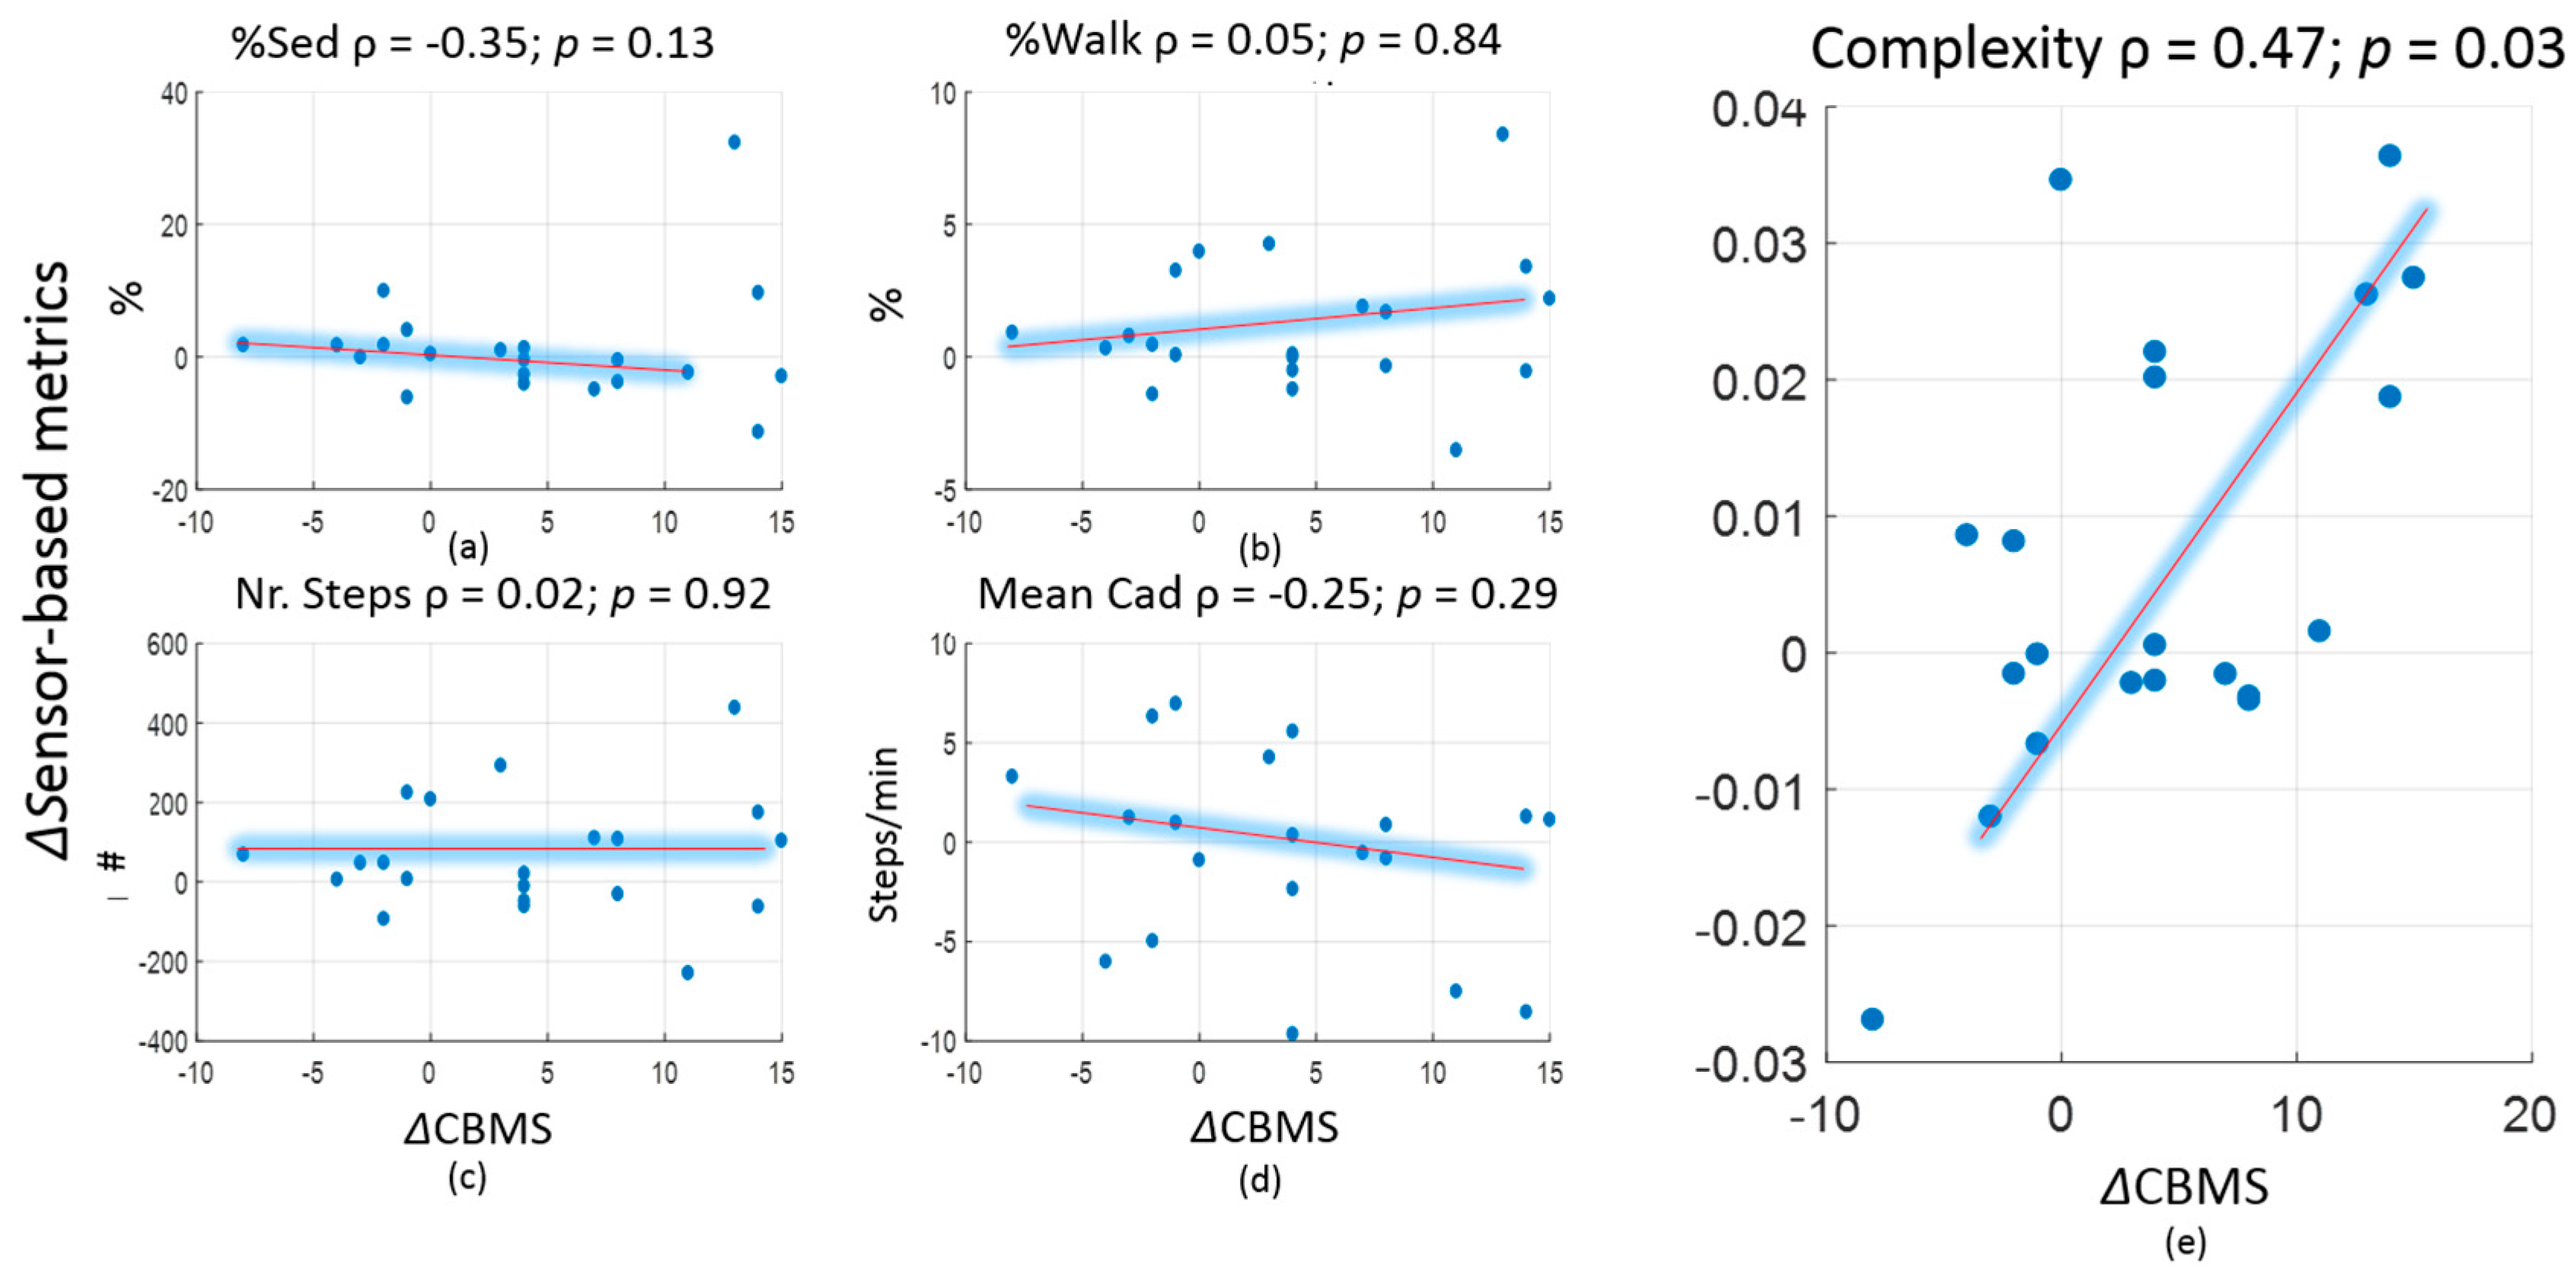
| Percentage of sedentary time (%) | 44.9 ± 6.0/47.7 ± 6.5 | 44.4 ± 5.6/47.5 ± 6.0 | −0.35/−0.28 | −0.12/−0.08 |
| Percentage of walking time (%) | 9.1 ± 2.0/9.1 ± 2.2 | 9.9 ± 3.0/10.0 ± 3.3 | 0.05/−0.01 | 0.13/0.15 a |
| Normalised nr. of steps (steps/hour) | 489 ± 123/361 ± 111 | 532 ± 182/395 ± 160 | 0.02/−0.17 | 0.11/0.08 |
| Mean cadence (steps/minute) | 78 ± 5/52 ± 8 | 78 ± 6/51 ± 7 | −0.25/−0.33 | 0/−0.13 |
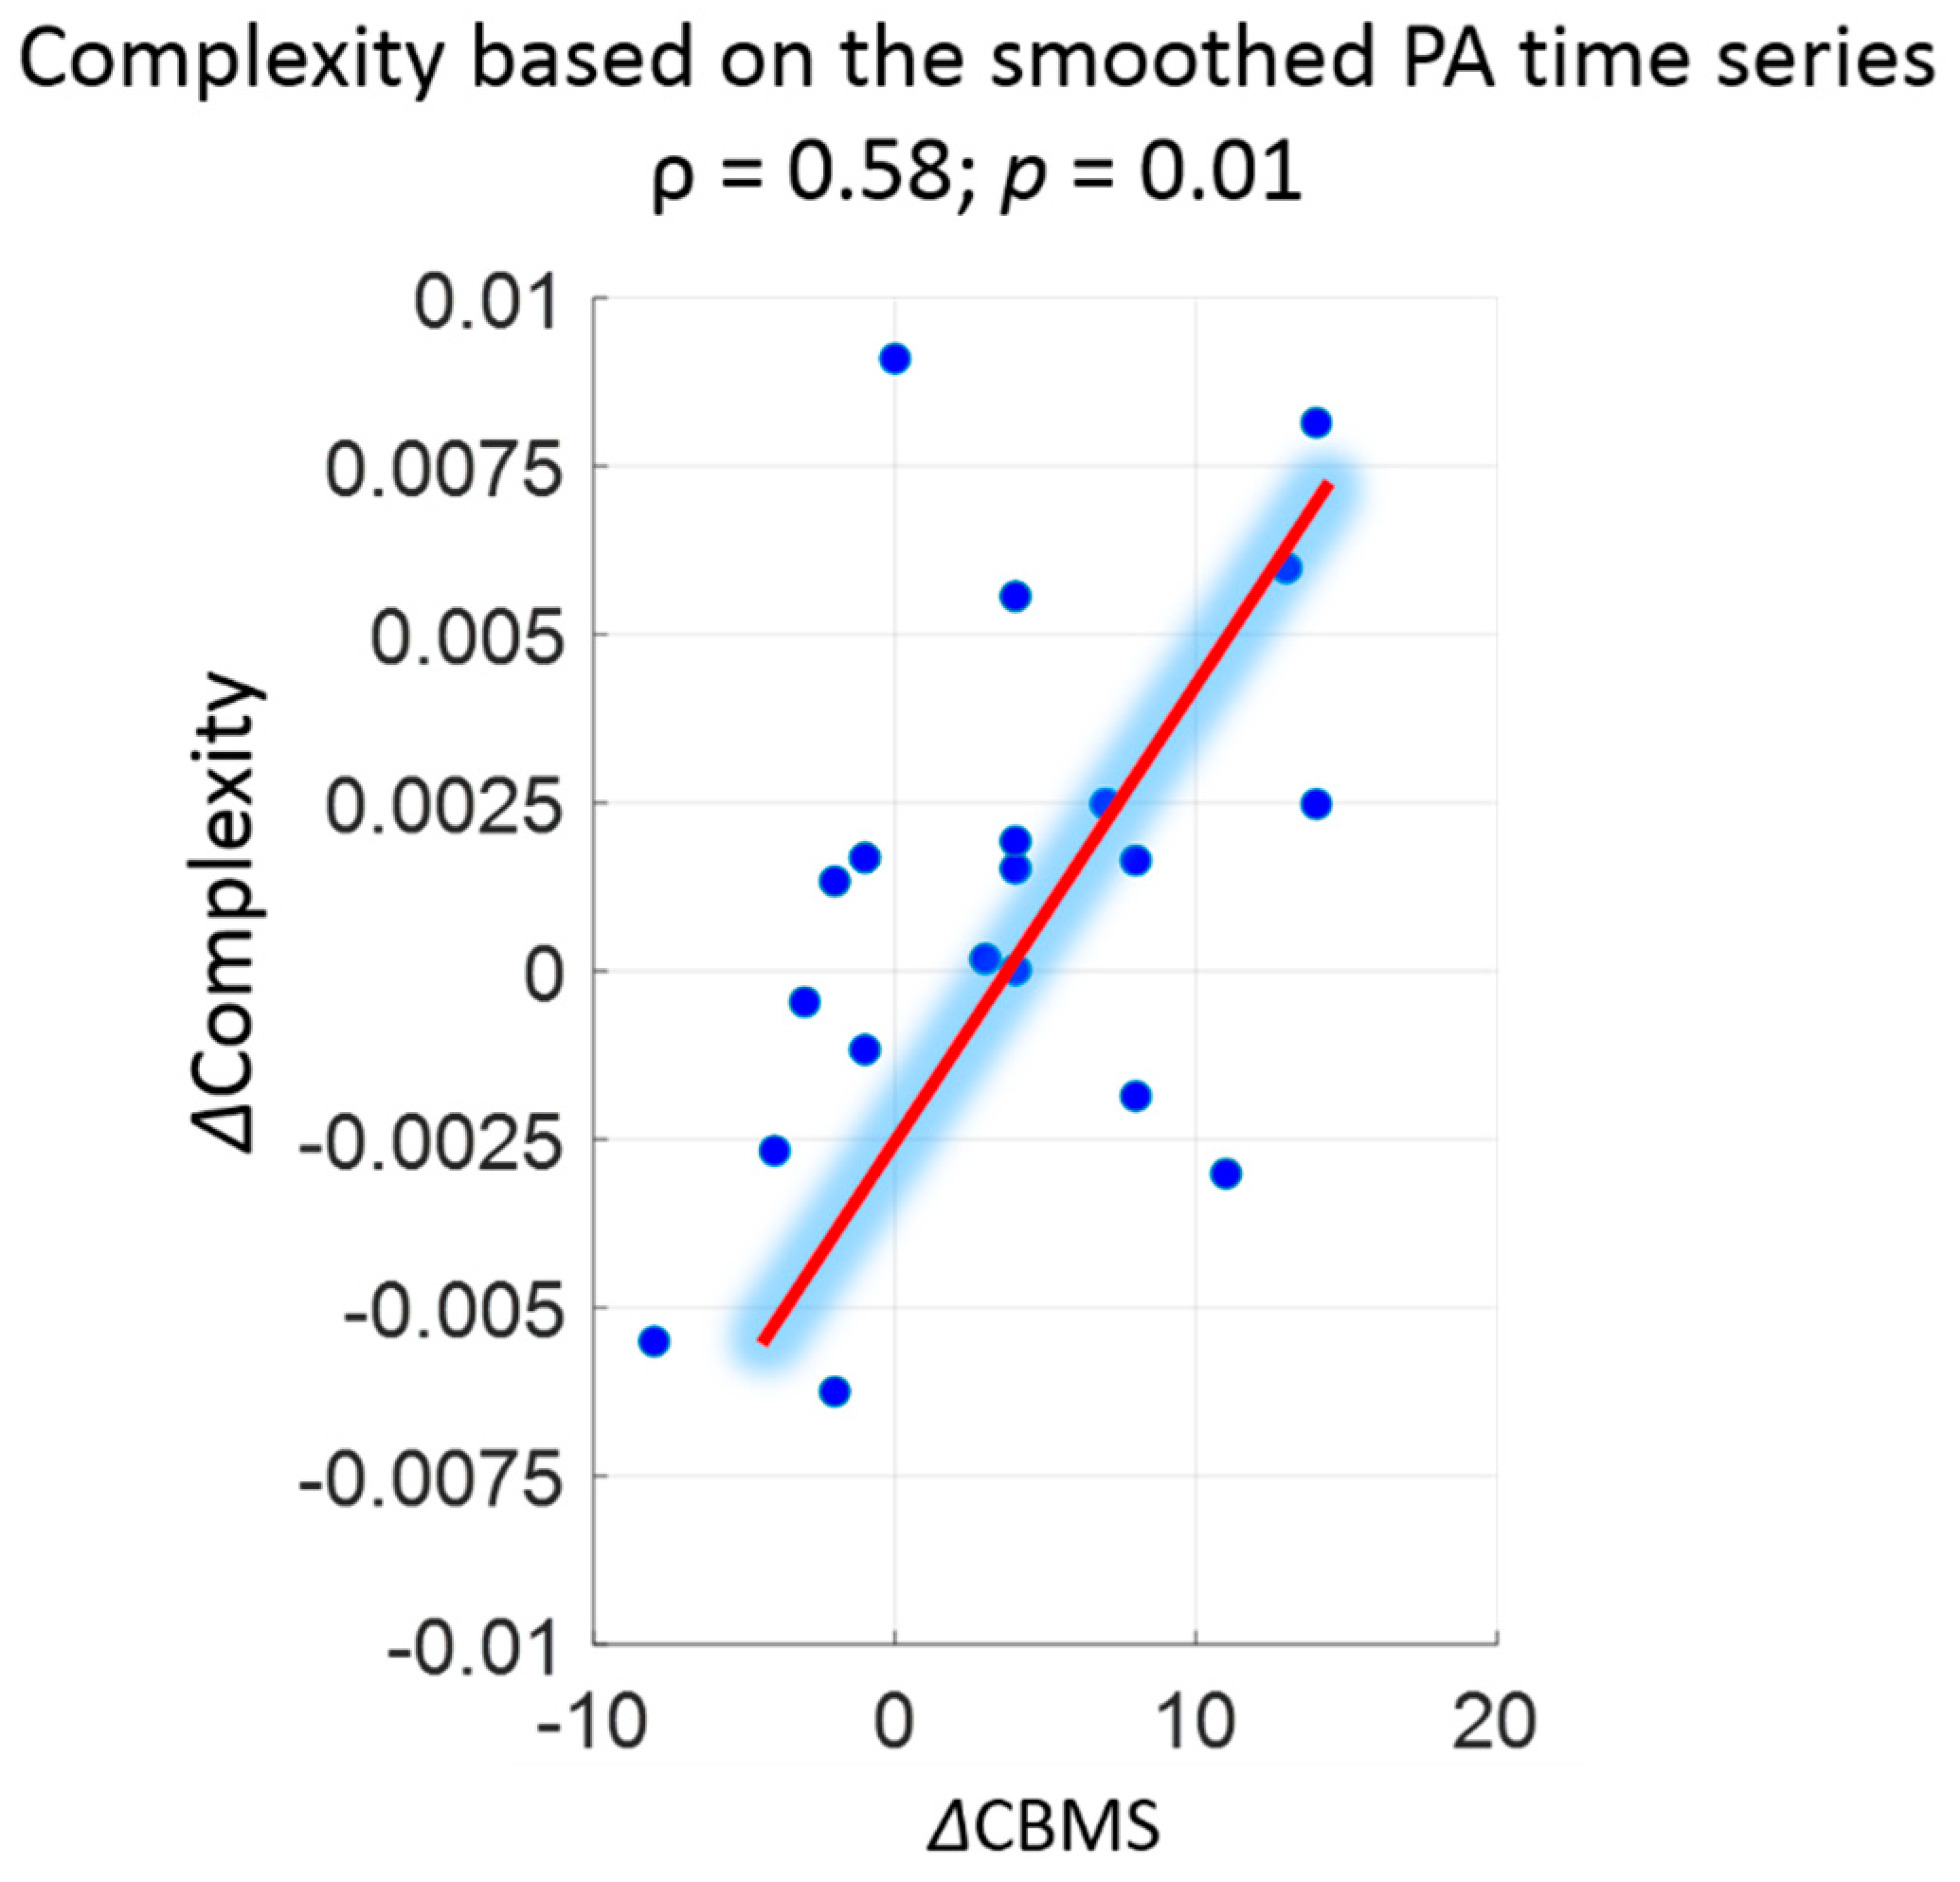
| Complexity | 0.178 ± 0.024/0.101 ± 0.006 | 0.185 ± 0.024/0.103 ± 0.007 | 0.47 a/0.58 a | 0.18/0.15 |
| CV of complexity b | 0.11 ± 0.05/0.07 ± 0.02 | |||
| CBMS score | 66.4 ± 12.8 | 70.2 ± 12.9 | 0.20 a |
© 2018 by the authors. Licensee MDPI, Basel, Switzerland. This article is an open access article distributed under the terms and conditions of the Creative Commons Attribution (CC BY) license (http://creativecommons.org/licenses/by/4.0/).
Share and Cite
Zhang, W.; Schwenk, M.; Mellone, S.; Paraschiv-Ionescu, A.; Vereijken, B.; Pijnappels, M.; Mikolaizak, A.S.; Boulton, E.; Jonkman, N.H.; Maier, A.B.; et al. Complexity of Daily Physical Activity Is More Sensitive Than Conventional Metrics to Assess Functional Change in Younger Older Adults. Sensors 2018, 18, 2032. https://doi.org/10.3390/s18072032
Zhang W, Schwenk M, Mellone S, Paraschiv-Ionescu A, Vereijken B, Pijnappels M, Mikolaizak AS, Boulton E, Jonkman NH, Maier AB, et al. Complexity of Daily Physical Activity Is More Sensitive Than Conventional Metrics to Assess Functional Change in Younger Older Adults. Sensors. 2018; 18(7):2032. https://doi.org/10.3390/s18072032
Chicago/Turabian StyleZhang, Wei, Michael Schwenk, Sabato Mellone, Anisoara Paraschiv-Ionescu, Beatrix Vereijken, Mirjam Pijnappels, A. Stefanie Mikolaizak, Elisabeth Boulton, Nini H. Jonkman, Andrea B. Maier, and et al. 2018. "Complexity of Daily Physical Activity Is More Sensitive Than Conventional Metrics to Assess Functional Change in Younger Older Adults" Sensors 18, no. 7: 2032. https://doi.org/10.3390/s18072032
APA StyleZhang, W., Schwenk, M., Mellone, S., Paraschiv-Ionescu, A., Vereijken, B., Pijnappels, M., Mikolaizak, A. S., Boulton, E., Jonkman, N. H., Maier, A. B., Klenk, J., Helbostad, J., Taraldsen, K., & Aminian, K. (2018). Complexity of Daily Physical Activity Is More Sensitive Than Conventional Metrics to Assess Functional Change in Younger Older Adults. Sensors, 18(7), 2032. https://doi.org/10.3390/s18072032