Abstract
For micromotion scatterers with small rotating radii, the micro-Doppler (m-D) effect interferes with cross-range compression in inverse synthetic aperture radar (ISAR) imaging and leads to a blurred main body image. In this paper, a novel method is proposed to remove the m-D effect by promoting the joint sparsity in the time-frequency domain. Firstly, to obtain the time-frequency representations of the limited measurements, the short-time Fourier transform (STFT) was modelled by an underdetermined equation. Then, a new objective function was used to measure the joint sparsity of the STFT entries so that the joint sparse recovery problem could be formulated as a constrained minimization problem. Similar to the smoothed (SL0) algorithm, a steepest descend approach was used to minimize the new objective function, where the projection step was tailored to make it suitable for m-D effect removal. Finally, we utilized the recovered STFT entries to obtain the main body echoes, based on which cross-range compression could be realized without m-D interference. After all contaminated range cells were processed by the proposed method, a clear main body image could be achieved. Experiments using both the point-scattering model and electromagnetic (EM) computation validated the performance of the proposed method.
1. Introduction
In inverse synthetic aperture radar (ISAR) imaging, mechanical rotations or vibrations of structures on a target may introduce additional frequency modulations on the returned signal, known as the micro-Doppler (m-D) effect [1,2,3]. The main body image is usually blurred because of the interference of the rotating or vibrating scatterers, which are also called micromotion scatterers [3]. Therefore, the m-D effect should be removed in order to obtain a clear image of the main body.
Micromotion targets with rotating structures can often be found in real world scenarios, e.g., a ship with scanning antennas or an aircraft in flight equipped with turbofans. A micromotion scatterer with a large rotating radius will generate a m-D signal which can be depicted in the form of sinusoidal modulations in the spectrogram after range compression [4,5]. In contrast, the main body signal in the spectrogram has the shape of straight lines [5]. Based on the different shapes in the spectrogram, many methods [4,5,6,7] have been proposed to eliminate the m-D signal. Li and Ling [4] put forward an adaptive chirplet decomposition algorithm in which the returned signal is decomposed into a family of chirplet functions. The main body signal and the micromotion signal subsequently are separated according to their distinct chirp rates. However, this algorithm has high computation cost because of the large chirplet dictionary. To remove the sinusoidal m-D interference, the method in Q. Zhang et al. [6] extracts the straight lines in the spectrogram using the Hough transform. Similarly, the methods in H.C. Liu et al. and L. Sun et al. [5,7] only recover the straight lines via the sparse representation (SR)-based algorithms where the sinusoids are eliminated. Nevertheless, the aforementioned methods [5,6,7] cannot remove the m-D effect generated by a micromotion scatterer with a small rotating radius, since the m-D signal has the same straight line shape as the main body signal in the spectrogram when the rotating radius is smaller than half of the range resolution.
Recently, some methods based on the time-frequency analysis have been developed to address the problem of the removal of the m-D effect under a small rotating radius. L. Stanković et al.’s method [8], based on L-statistics, performs the short-time Fourier transform (STFT) to the echoes in the contaminated range cell. It is assumed in L. Stanković et al. [8] that the m-D interference occupies a small portion of time instants at each frequency bin. Using the L-statistics, a fixed fraction of the most significant STFT entries were eliminated to achieve m-D effect removal. Subsequently, the remaining entries were utilized to recover the main body signal. However, a large amount of STFT entries corresponding to the main body might be removed together with the m-D interference, which leads to a high sidelobe level in the imaging result [9]. A method based on histogram analysis is proposed in R. Zhang et al. [9], where the STFT entries with a high frequency of occurrence were regarded as the main body components and were preserved to reconstruct the ISAR image. On the other hand, the STFT entries with a low frequency of occurrence were considered to correspond to the m-D interference and suppressed. When the m-D effect is severe, the method in R. Zhang et al. [9] cannot remove the m-D signal in the time-frequency domain completely because the m-D components might be mistaken for the main body signal. Consequently, there are some spurious points in the imaging result due to the residual m-D signal. In real world situations, the data samples of the echoes might be randomly missing at given time instants [10] where strong electromagnetic interference or sensor failure prevents effective observation. As a result, the effective pulses are limited. The L-statistics-based method is combined with the short-time compressed sensing (STCS) [11] approach in Q.K. Hou et al. [12] to reduce the m-D effect with limited pulses. The STCS was employed to recover the STFT entries where the number of the frequency bins was equal to the number of full pulses. Nevertheless, the window width in the STCS could have been much shorter than the signal duration to obtain the local frequency characteristics. Thus, the measurements in the window were much fewer than the frequency bins in the time-frequency domain. The frequency resolution of the recovered STFT entries was reduced due to the extremely limited measurements. As a result, the L-statistics-based method in Q.K. Hou et al. [12] cannot obtain the accurate support of the main body signal in the frequency dimension and some spurious points exist near the main body scatterers in the imaging result.
The main body scatterer has a constant Doppler frequency [13]. Thus, the support of the main body signal is a slow time invariant in the time-frequency domain which indicates the joint sparsity [14,15] of the main body signal. In contrast, the Doppler frequency of the micromotion scatterer varies with the slow time [13]. Based on the distinct patterns in the time-frequency domain, this paper proposes a joint sparsity-based ISAR imaging method to remove the m-D effect generated by the micromotion scatterers with small rotating radii. Firstly, the echoes in the contaminated range cell were modelled by an underdetermined equation where the relation of the echoes and the corresponding STFT entries is built on the STFT matrix. Generally, the -norm [16] of the STFT entry vector could be used to measure the joint sparsity in the time-frequency domain because it is equal to the number of frequency bins having nonzero STFT entries. Nonetheless, minimizing the -norm leads to a combinatorial optimization problem [17] that is difficult to solve. In M. Bevacqua et al. [18], the -norm of an auxiliary variable, defined as the common upper bound to the amplitudes of the electric currents, is utilized to replace the -norm so that the new problem is tractable. However, the difference between the -norm of the auxiliary variable and the original -norm is significant [19] because larger coefficients are penalized more heavily than smaller coefficients in the -norm. A reweighted -norm method is proposed in Y. Liu et al. [19] to overcome the drawback of the -norm, but this method is lack of convergence guarantee [20]. Recently, the -norm was utilized to promote the joint sparsity of highly conductive scatterer in microwave imaging [21]. Nonetheless, the -norm is a loose approximation to the original -norm and often leads to suboptimal solutions [22]. Different from the methods in M. Bevacqua et al., Y. Liu et al., and S. Sun et al. [18,19,21], we propose a new objective function in this paper which can achieve tight approximation to the original -norm with proper parameters. The new objective function was minimized, similar to the smoothed (SL0) algorithm approach [23] which consisted of two steps, i.e., the steepest descend step and the projection step. Since the m-D signal was suppressed in the steepest descend step, in this paper, the projection step of SL0 was tailored to make it suitable for m-D effect removal. By minimizing the new objective function, the joint sparsity in the time-frequency domain was promoted and the m-D interference could be effectively removed. Subsequently, we utilized the recovered STFT entries to obtain the main body echoes free of m-D effect. Finally, the cross-range compression [24] of the main body echoes was realized through the sparse Bayesian learning (SBL) algorithm [25]. When the m-D effect in all of the contaminated range cells was removed by the proposed method, a clear main body image could be achieved.
The rest of this paper is organized as follows. Section 2 presents the signal model of ISAR imaging for micromotion targets with rotating parts. Section 3 demonstrates the joint sparsity of the main body signal in the time-frequency domain. The proposed ISAR imaging method is elaborated in Section 4, where we introduce the joint sparse recovery problem based on the -norm and briefly review the SL0 algorithm. In Section 5, we discuss experiments based on the point-scattering model and electromagnetic (EM) computation which were conducted to validate the effectiveness of the proposed method. Finally, conclusions are drawn in Section 6.
We introduce the following notations in this paper. Bold uppercase letters and bold lowercase letters are reserved for matrices and vectors, respectively. denotes a matrix of size with complex elements. denotes the Frobenius norm of . For a vector , its element is denoted by . , , and represent the -norm, -norm and -norm of , respectively. and stand for the transpose and the conjugate transpose of a matrix or a vector.
2. ISAR Imaging Model
To simplify the analysis, we consider the point-scattering model [4] to illustrate the m-D effect. As shown in Figure 1, the radar is located at the origin of the coordinate system . The target center is located at the -axis which indicates the line of sight (LOS). Without loss of generality, we assume that the target moves within the 2-dimensional (2-D) imaging plane with velocity and the motion compensation [26] has been accomplished. The projection of along the direction of the -axis is denoted by which generates the aspect angle variation utilized in ISAR imaging. and denote the main body scatterer and the micromotion scatterer, respectively. is the rotating center of the micromotion part. rotates around with radius , angle frequency , and initial rotation angle . At the initial processing time, the distances from , , and to the radar are , , and , respectively.
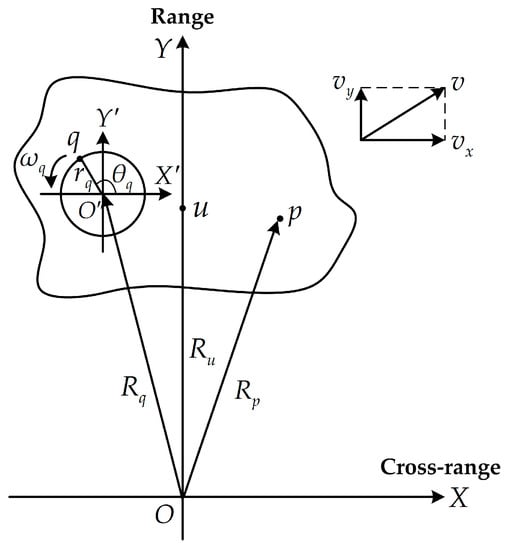
Figure 1.
Inverse synthetic aperture radar (ISAR) imaging geometry with rotating scatterers.
The transmitted chirp signal is
where and denote the fast time and the slow time, respectively. is the pulse duration, is the carrier frequency, and is the chirp rate. represents the rectangular function, which is defined as
To reduce the received effective bandwidth, the dechirp method is applied. Taking the target center as the reference point in the dechirping process, the reference signal is given by
where is the duration of the reference signal with , and denotes the speed of light. After dechirping and removing the residual video phase, the echo can be expressed as
where and denote the backscattering coefficients of the main body scatterer and the micromotion scatterer, respectively. After the Fourier transform to Equation (4) along the dimension, the range compression is achieved and the spectrogram can be written as
where is the fast frequency and is the wavelength. and denote the complex coefficients of scatterers and , respectively.
It is assumed that the target has a constant velocity in a short coherent processing interval (CPI). Thus, the aspect angle variation of the target is calculated to be . Because the target is far from the radar, the instantaneous distances from and to the reference point can be approximately expressed as
Substituting Equations (6) and (7) into Equation (5) yields
It can be seen from Equation (8) that the peaks of the spectrogram are located at
and the range resolution is . For the targets with large rotors, the rotating radius might be much larger than the range resolution. Equation (8) indicates that the signal of the micromotion scatterer migrates through the range cells in the spectrogram and has the shape of a sinusiod. In contrast, the position of the main body signal is slow time invariant, which has the shape of a straight line. The sinusoid in the spectrogram will seriously affect the cross-range compression, i.e., the integration in the slow time domain, and lead to a smeared ISAR image. To remove the sinusoidal m-D interference, the method in Q. Zhang et al. [6] extracts the straight lines in the spectrogram using the Hough transform. Similarly, the methods in H.C. Liu et al. and L. Sun et al. [5,7] only recover the straight lines where the sinusoids are eliminated. However, when the target has small rotors, might be smaller than half of the range resolution. In this condition, the signal of the micromotion scatterer is located in a constant range cell and also has the shape of a straight line. The spectrogram can be approximately expressed as
Because the main body signal and the signal of the micromotion scatterer have the same straight line shapes in the spectrogram, the methods in H.C. Liu et al., Q. Zhang et al., and L. Sun et al. [5,6,7] are invalid to remove the m-D effect. According to Equation (11), the Doppler frequencies of the main body scatterer and the micromotion scatterer are
It is obvious from Equations (12) and (13) that the main body scatterer has a constant Doppler frequency while the Doppler frequency of the micromotion scatterer is slow time variant. Therefore, it is possible to separate the main body signal from the micromotion signal in the time-frequency domain.
3. Joint Sparsity of Main Body Signal in Time-Frequency Domain
Typical time-frequency transforms include the Wigner–Ville distribution (WVD) [27] and the STFT. Although WVD has better time-frequency resolution than STFT, it suffers from cross-terms for multiple signal components. Thus, we chose the STFT to achieve the time-frequency representations of the echoes in the contaminated range cell. In order to obtain the STFT entries, the echoes in the contaminated range cell were first segmented into narrow time intervals so that the signal in each segment could be considered stationary. Then, the Fourier transform was carried out for the windowed signal in each segment to obtain the local spectral representations. In this paper, we chose the rectangular window function and the segmentation of the echoes could be realized by a sliding window with proper time step.
To demonstrate the joint sparsity of the main body signal in the time-frequency domain, we conducted the following simulation. The target model was composed of nine main body scatterers and two micromotion scatterers, as described in Figure 2. The micromotion scatterers and rotated around the origin counterclockwise with radii of 0.1 m and 0.2 m, and with rotating frequencies of 10 Hz and 3 Hz, respectively. The initial rotating phases were rad and 0 rad, respectively. The target moved along the cross-range direction with a velocity of 300 m/s. The radar carrier frequency was 10 GHz, the bandwidth was 600 MHz, the pulse repetition interval (PRI) was 1 ms, and the CPI was 1 s.
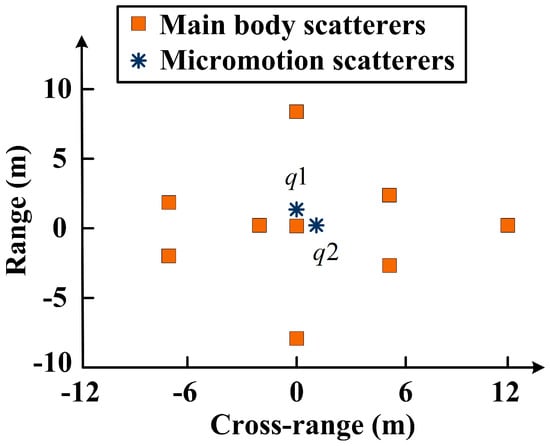
Figure 2.
Target model.
According to the radar system parameters, the range resolution was calculated to be 0.25 m, which was larger than twice the rotating radii of both and . Thus, the micromotion signal did not migrate through the range cells in the spectrogram. As shown in Figure 3a, the micromotion signal was located in the 40th range cell and had the same straight line shape as the main body signal. In this situation, the methods in H.C. Liu et al., Q. Zhang et al., and L. Sun et al. [5,6,7] were invalid to eliminate the micromotion components. As a result from the m-D effect, the application of a fast Fourier transform (FFT) to the spectrogram along the slow time dimension would lead to a blurred main body image, as depicted in Figure 3b. We selected 50 cross-range cells where the target was located in the imaging result to display.
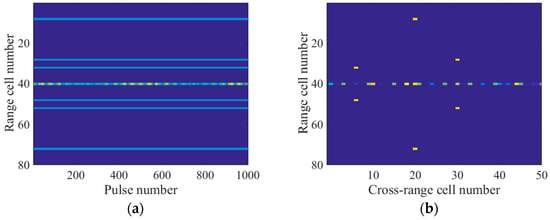
Figure 3.
(a) Spectrogram; (b) Imaging result by the FFT-based method.
To obtain the time-frequency representations, we applied the STFT to the echoes in the 40th range cell of the spectrogram. The time step was 10 PRI and the window width was 30 PRI. Thus, there were 30 frequency bins in the time-frequency domain. As shown in Figure 4, the main body signal was located at the 15th and 16th frequency bins. Consequently, the support of the main body signal in the time-frequency domain was slow time invariant which indicated the joint sparsity of the main body signal. In contrast, the micromotion scatterers’ Doppler frequencies were slow time variant and the micromotion signal had the shape of sinusoids, as illustrated in Figure 4. Because of the distinct patterns, the micromotion signal could be removed by promoting the joint sparsity in the time-frequency domain, which is detailed in the next section.
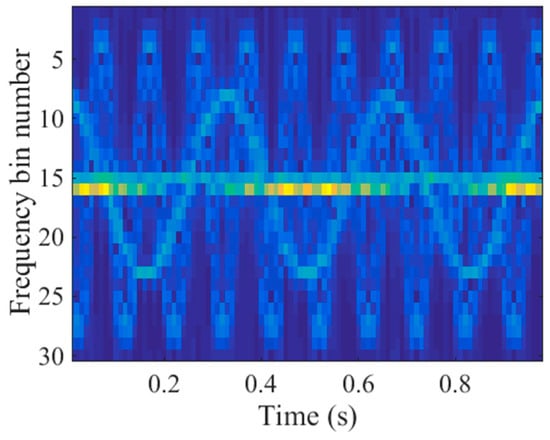
Figure 4.
Short-time Fourier transform (STFT) entries of the echoes in the 40th range cell.
4. M-D Effect Removal by Promoting Joint Sparsity
4.1. Problem Formulation for Joint Sparse Recovery
The echoes in the range cell contaminated by the m-D effect are denoted by , and we assume that the number of the received pulses is . The window width and the time step of the STFT are denoted by and , respectively. Thus, the number of the segments in the STFT is , where denotes rounding to the nearest integer towards infinity.
The discrete Fourier matrix for each segment is
where . Denoting the STFT entries in Figure 4 by , the corresponding STFT entry vector is , which is generated by stacking the columns of into a single vector. Then, the STFT of can be written in a compact matrix form
where denotes the STFT matrix
and is the number of the STFT entries in . denotes a matrix of size , whose elements are equal to 0.
The echoes in the contaminated range cell can be modeled as follows:
where denotes the noise, and is the Moore–Penrose inverse of the STFT matrix . However, the data samples of the echoes might be randomly missing in real world scenarios where strong electromagnetic interference or sensor failure prevents effective observation. The data samples under strong electromagnetic interference must be discarded and the remaining samples constitute the measurement vector , which can be expressed as
where is the noise. is formed by omitting the rows of which correspond to the missing samples. Because the remaining samples are fewer than the STFT entries to recover, i.e., , Equation (18) is underdetermined.
To facilitate the notation, we rearrange the STFT entries in the frequency bin into a vector
According to the analysis in Section 3, the micromotion components in the time-frequency domain can be eliminated by promoting the joint sparsity of . The joint sparse recovery problem is usually formulated by the following minimization problem
where bounds the -norm of the noise in the measurements. stands for the -norm of defined as [16]
where . It is obvious that is equivalent to the number of frequency bins which have nonzero STFT entries. Therefore, by solving the problem in Equation (20), we can find the solution which occupies the fewest frequency bins and the joint sparsity in the time-frequency domain can be promoted.
However, the problem in Equation (20) is essentially a combinatorial optimization problem [17], which is difficult to solve. Inspired by the smoothed (SL0) algorithm, we propose a novel objective function to replace , so that the new problem is tractable. In the following subsections, the original SL0 algorithm is briefly reviewed at first. Then, we elaborate the proposed ISAR imaging method.
4.2. Brief Review of SL0 Algorithm
The basic idea of the SL0 algorithm is to approximate the -norm of with the following function [23]
where
and
It can be seen from Equations (22) and (24) that for small values of . Furthermore, this approximation becomes equality as . The SL0 algorithm obtains the sparse solution of Equation (18) by solving the following problem
To avoid trapping into local maxima, a decreasing sequence of is utilized, i.e., , where for . is the iteration number and the current maximizer of is used as the starting point of the next iteration. To maximize for a fixed , there are two steps in each iteration: the unconstrained maximization step and the projection to the feasible set
where , and is the gradient of .
4.3. Proposed Method
Although it has been shown in H. Mohimani et al. [23] that the SL0 algorithm is effective to obtain the sparse solution of Equation (18), the joint sparsity of cannot be promoted. It can be seen from Equation (22) that the SL0 algorithm only promotes the sparsity of the individual entries in , and is merely able to approximate rather than , which measures the joint sparsity of . As a result, the SL0 algorithm is inappropriate to remove the m-D effect in ISAR imaging for micromotion targets. In this paper, we propose a smoothed (SL2L0) algorithm, where in Equation (20) is approximated by a new objective function
Since is equivalent to the number of frequency bins which have nonzero STFT entries, it is obvious from Equations (19), (24) and (27) that when . Therefore, the joint sparsity can be promoted by minimizing the new objective function with small values of . The joint sparse recovery problem can be formulated as
Similar to the SL0 algorithm, a decreasing sequence of is used to avoid trapping into local minimum and a steepest descend approach is employed to minimize in each iteration, i.e.,
where is the parameter controlling the step-size . The gradient in Equation (29) is calculated to be
where is a vector of length with its entries equal to 1, is the Kronecker product, is the Hadamard product, and is
Since the micromotion components are eliminated by promoting the joint sparsity of , we modify the projection step in Equation (26) as follows:
where bounds the -norm of the micromotion components in the echoes. Equation (32) can be rewritten into an unconstrained optimization problem
where and . is the regularization parameter related to . is called the regularizer which indicates that the optimization problem in Equation (33) is convex. We use the fast iterative shrinkage-thresholding algorithm (FISTA) [28,29] to solve the problem in Equation (33) efficiently. The key concept in FISTA is known as Moreau’s proximal operator, or proximal operator for short, which is expressed as
and in Equation (34) is a positive constant with .
In summary, the successive steps of the proposed SL2L0 algorithm are given in Algorithm 1.
| Algorithm 1 Proposed smoothed (SL2L0) algorithm | |
| Input: | The echo sampling vector , the overcompleted dictionary , positive constants , the maximum number of outer loop iterations , the maximum number of inner loop iterations , a suitable decreasing sequence , the tolerance values and ; initialization and . |
| Iteration: | |
| For ; ; ; ; ; For ; ; ; if , then break; End ; if or , then break; End | |
| Output: | |
By promoting the joint sparsity in the time-frequency domain, the output of the SL2L0 algorithm only contains the main body components. Based on the recovered STFT entries, we can obtain the main body echoes free of m-D effect as . Assuming that the residual noise in is , can be rewritten as
where is the cross-range compression result of , and is a partial Fourier matrix with its element given by . is the Doppler frequency bin, and is the sampling point of the slow time. Subsequently, we used the sparse Bayesian learning (SBL) [25] algorithm to achieve the cross-range compression of by recovering in Equation (35).
Although the discussions in this section are focused on the echoes in a single range cell, the proposed method is also suitable for other contaminated range cells. After all of the contaminated range cells are processed by the proposed method, a clear main body image can be achieved.
5. Experimental Results and Performance Comparisons
In this section, we discuss the experiments conducted using the echoes generated by the point-scattering model and EM computation, respectively. To validate the effectiveness, the imaging results of the proposed method and other existing methods are compared. The parameters of the proposed method used in the experiments are set as follows: , , , , for , , and . Since is related to the noise level, this parameter is tuned manually in each experiment.
5.1. Experiments Using the Point-Scattering Model
The target model is depicted in Figure 2, and the radar system parameters are the same as in Section 3. We obtained the limited measurements by choosing 500 pulses randomly in the slow time domain, and the signal-to-noise ratio (SNR) was 20 dB. The number of cross-range cells to be recovered was 1000. The window width of the STFT was 30 PRI and the time step was 10 PRI. According to the above parameters, the size of was calculated to be . Similar to Figure 3b, we selected 50 cross-range cells to display in the imaging results.
To eliminate the micromotion components of the echoes in the contaminated range cell, both the method in R. Zhang et al. [9] and the L-statistics-based method utilize the time-frequency representations obtained by the STCS [11]. However, part of the main body signal in the time-frequency domain is missing due to the discarded pulses, as illustrated in Figure 5. Additionally, there is a strong m-D signal which has the shape of sinusoids. As a result, the histogram analysis in R. Zhang et al. [9] could not be used to remove the m-D signal, which might have been mistaken for the main body signal. Figure 6a shows the imaging result produced by the method in R. Zhang et al. [9]. Many spurious points exist in the 40th range cell due to the m-D interference and the main body scatterers are defocused. Because the measurements within the sliding window are much fewer than the frequency bins in STCS, the frequency resolution in the time-frequency domain is lower than the reciprocal of the CPI. Therefore, the L-statistics-based method cannot obtain the accurate support of the main body scatterers in the cross-range domain. As depicted in Figure 6b, some spurious points exist near the main body scatterers. In addition, one of the main body scatterers in the 40th range cell cannot be recovered because part of the main body signal is missing in Figure 5. In contrast to STCS, the proposed SL2L0 algorithm can remove the m-D signal by promoting the joint sparsity in the time-frequency domain, where only the main body signal with constant Doppler frequencies are preserved, as shown in Figure 7a. Based on the recovered STFT entries, the proposed method achieves a clear main body image in Figure 7b.
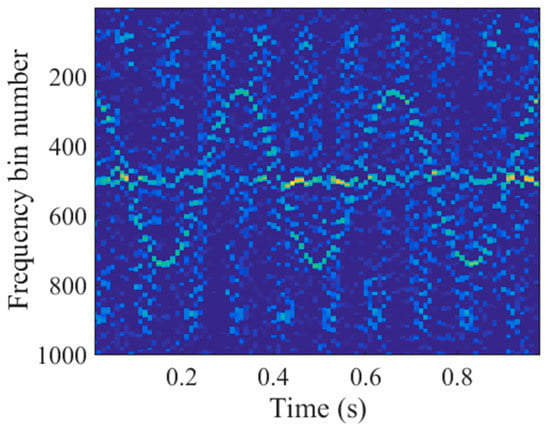
Figure 5.
Time-frequency representations obtained by the short-time compressed sensing (STCS).
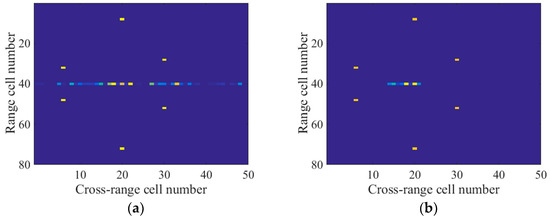
Figure 6.
(a) Imaging result by the method in [9]; (b) Imaging result by the L-statistics-based method.
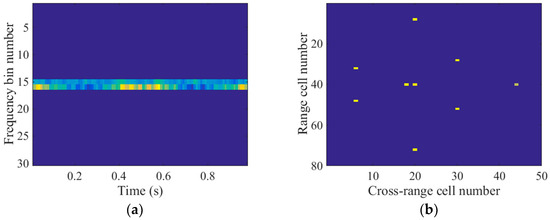
Figure 7.
(a) STFT entries recovered by the SL2L0 algorithm; (b) Imaging result by the proposed method.
In addition to the visual results, we introduce the normalized mean square error (NMSE) and the image contrast (IC) as two metrics to compare the performance of different methods. A lower NMSE means the image has less recovery error, and a higher IC indicates the image is better focused. The NMSE is computed by [30]
where independent trials are conducted, and denotes the recovered result of the true main body image in the trial. The IC is computed by X. Z. Gao et al. [24]
where represents the intensity matrix of the recovered main body image with its element equal to . denotes the mean operator, which is defined as
Figure 8 gives the NMSEs and ICs obtained by different methods against the undersampling factor [31], which is calculated as , i.e., the number of measurements in slow time dimension divided by the number of cross-range cells to recover. For each , the IC is averaged over 100 independent trials. It can be observed from Figure 8 that the proposed method achieves the lowest NMSEs and the highest ICs among all of the methods, which indicate the least recovery error and the best focused quality, respectively.
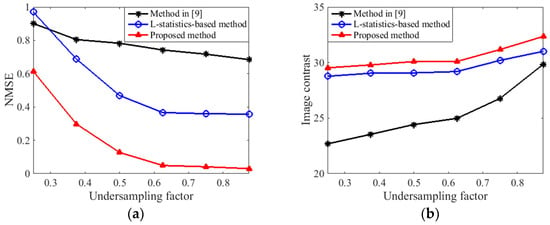
Figure 8.
Performance of different methods: (a) Normalized mean square error (NMSE) against undersampling factor; (b) Image contrast (IC) against undersampling factor.
5.2. Experiments Using EM Computation
To further testify the performance of the proposed method, we used the echoes of a ship target generated by the graphic electromagnetic computing (GRECO) technique [32], which combines physical optical (PO) theory and physical theory of diffraction (PTD). The target model is described in Figure 9a, where the dashed circle indicates the antenna rotating with a frequency of 1 Hz. Figure 9b depicts the imaging geometry. The ship was 6.9 km from the airborne radar and located at the origin. The radar operated at 5 GHz, the bandwidth was 1 GHz, and the radar moved along the opposite direction of the -axis with a constant velocity of 300 m/s. 256 pulses were collected in a CPI of 2.3 s and the SNR was 20 dB. We obtained the limited measurements by choosing 128 pulses randomly. Within each pulse, there were 128 complex range samples. The window width and the time step of the STFT were 20 PRI and 2 PRI, respectively. According to the aforementioned parameters, the size of was calculated to be .
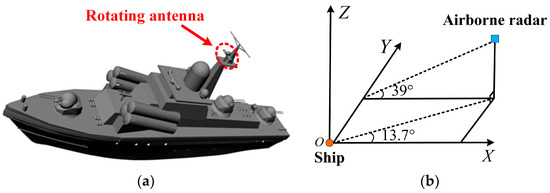
Figure 9.
(a) Ship model; (b) Imaging geometry.
The imaging results by different methods are shown in Figure 10. It can be seen from Figure 10a that the m-D effect led to a blurred main body image by the FFT-based method. Though the method in R. Zhang et al. [9] and the L-statistics-based method suppressed the m-D effect to some degree, there were residuals and some spurious points exist in Figure 10b,c. In contrast, the proposed method could remove the m-D effect through the SL2L0 algorithm and a clear image with the least spurious points is achieved in Figure 10d.
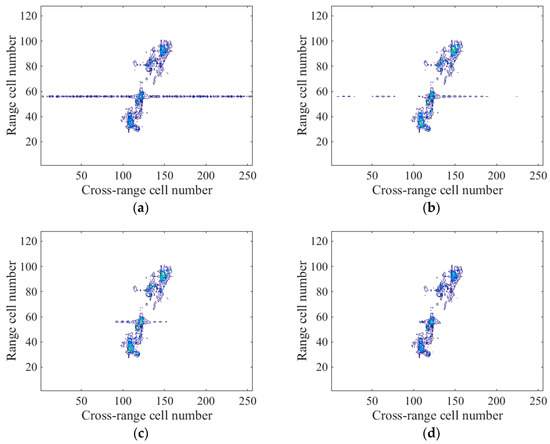
Figure 10.
(a) Imaging result by the FFT-based method; (b) Imaging result by the method in R. Zhang et al. [9]; (c) Imaging result by the L-statistics-based method; (d) Imaging result by the proposed method.
To quantitatively evaluate the performance of different methods, we used the image entropy (IE). Generally, a smaller IE indicates a better focused quality of the image. The IE is defined by W. Qiu et al. [33]
where is the power normalized image computed by
The IEs of the imaging results are given in Table 1. The proposed method achieved the minimum IE which verifies the superiority of the proposed method to other methods.

Table 1.
Performance Evaluation by Image Entropy.
The computational time of different methods was recorded based on the MATLAB code and summarized in Table 2, where the results are given by the averages of 50 independent trials conducted on an Intel Core i7 machine at 3.50 GHz. The computational time of the FFT-based method was not recorded since it could not suppress the m-D effect, as shown in Figure 10a. It can be seen from Table 2 that the proposed method is more computationally efficient than the method in R. Zhang et al. [9] and the L-statistics-based method.

Table 2.
Computational Time.
6. Conclusions
In ISAR imaging, the m-D effect generated by the micromotion scatterers with small rotating radii leads to a blurred main body image. It is claimed that the Doppler frequency of the micromotion scatterer is slow time variant while the main body scatterer has a constant Doppler frequency, indicating the joint sparsity property in the time-frequency domain. To remove the m-D effect, this paper proposes a novel algorithm named SL2L0, where a new objective function is used to measure the joint sparsity and is minimized in a way similar to the SL0 algorithm. We have tailored the projection step in the SL0 algorithm to make it suitable for m-D effect removal. Experimental results showed that the proposed SL2L0 algorithm can effectively remove the m-D effect by promoting the joint sparsity in the time-frequency domain and a clear main body image can be achieved after cross-range compression. Diverse metrics, including the NMSE, IC, and IE, were employed to validate the superiority of the proposed method to other existing methods.
Acknowledgments
This work was supported by the National Natural Science Foundation of China under Grant No. 61431016.
Author Contributions
L.S. conceived the experiments, conducted the theoretical analyses, and wrote the paper; W.C. contributed analysis tools, revised the manuscript, and provided valuable suggestions.
Conflicts of Interest
The authors declare no conflict of interest.
References
- Chen, V.C. Analysis of radar micro-Doppler with time-frequency transform. In Proceedings of the Tenth IEEE Workshop on Statistical Signal and Array Processing, Pocono Manor, PA, USA, 16 August 2000; pp. 463–466. [Google Scholar]
- Chen, V.C.; Li, F.; Ho, S.-S.; Wechsler, H. Analysis of micro-Doppler signatures. IEE Proc. Radar Sonar Navig. 2003, 150, 271–276. [Google Scholar] [CrossRef]
- Chen, V.C.; Li, F.; Ho, S.-S.; Wechsler, H. Micro-Doppler effect in radar: Phenomenon, model, and simulation study. IEEE Trans. Aerosp. Electron. Syst. 2006, 42, 2–21. [Google Scholar] [CrossRef]
- Li, J.; Ling, H. Application of adaptive chirplet representation for ISAR feature extraction from targets with rotating parts. Proc. Inst. Electr. Eng. Radar Sonar Navig. 2003, 150, 284–291. [Google Scholar] [CrossRef]
- Liu, H.C.; Jiu, B.; Liu, H.W.; Bao, Z. A novel ISAR imaging algorithm for micromotion targets based on multiple sparse Bayesian learning. IEEE Geosci. Remote Sens. Lett. 2014, 11, 1772–1776. [Google Scholar]
- Zhang, Q.; Yeo, T.S.; Tan, H.S.; Luo, Y. Imaging of a moving target with rotating parts based on the Hough transform. IEEE Trans. Geosci. Remote Sens. 2008, 46, 291–299. [Google Scholar] [CrossRef]
- Sun, L.; Lu, X.F.; Chen, W.D. Joint sparsity-based ISAR imaging for micromotion targets. IEEE Geosci. Remote Sens. Lett. 2016, 13, 1734–1738. [Google Scholar] [CrossRef]
- Stanković, L.; Orović, I.; Stanković, S.; Amin, M. Compressive sensing based separation of nonstationary and stationary signals overlapping in time-frequency. IEEE Trans. Aerosp. Electron. Syst. 2013, 61, 4562–4572. [Google Scholar] [CrossRef]
- Zhang, R.; Li, G.; Zhang, Y.D. Micro-Doppler interference removal via histogram analysis in time-frequency domain. IEEE Trans. Aerosp. Electron. Syst. 2016, 52, 755–768. [Google Scholar] [CrossRef]
- Bai, X.R.; Zhou, F. Radar imaging of micromotion targets from corrupted data. IEEE Trans. Aerosp. Electron. Syst. 2016, 52, 2789–2802. [Google Scholar] [CrossRef]
- Liu, Z.; Wei, X.Z.; Li, X. Aliasing-free micro-Doppler analysis based on short-time compressed sensing. IET Signal Process. 2013, 8, 176–187. [Google Scholar] [CrossRef]
- Hou, Q.K.; Liu, Y.; Chen, Z.P. Reducing micro-Doppler effect in compressed sensing ISAR imaging for aircraft using limited pulses. Electron. Lett. 2015, 51, 937–939. [Google Scholar] [CrossRef]
- Bai, X.R.; Xing, M.D.; Zhou, F.; Lu, G.Y.; Bao, Z. Imaging of micromotion targets with rotating parts based on empirical-mode decomposition. IEEE Trans. Geosci. Remote Sens. 2008, 46, 3514–3523. [Google Scholar] [CrossRef]
- Mishali, M.; Eldar, Y.C. Reduce and boost: Recovering arbitrary sets of jointly sparse vectors. IEEE Trans. Signal Process. 2008, 56, 4692–4702. [Google Scholar] [CrossRef]
- Wang, L.; Zhao, L.F.; Bi, G.A.; Wan, C.R.; Zhang, L.R.; Zhang, H.J. Novel wideband DOA estimation based on sparse Bayesian learning with Dirichlet process priors. IEEE Trans. Signal Process. 2016, 64, 275–289. [Google Scholar] [CrossRef]
- Zeinalkhani, Z.; Banihashemi, A.H. Iterative reweighted l2/l1 recovery algorithms for compressed sensing of block sparse signals. IEEE Trans. Signal Process. 2015, 63, 4516–4531. [Google Scholar] [CrossRef]
- Chen, J.; Huo, X.M. Theoretical results on sparse representations of multiple-measurement vectors. IEEE Trans. Signal Process. 2006, 54, 4634–4643. [Google Scholar] [CrossRef]
- Bevacqua, M.; Isernia, T. Shape reconstruction via equivalence principles, constrained inverse source problems and sparsity promotion. Prog. Electromagn. Res. 2017, 158, 37–48. [Google Scholar] [CrossRef]
- Liu, Y.; You, P.; Zhu, C.; Tan, X.; Liu, Q.H. Synthesis of sparse or thinned linear and planar arrays generating reconfigurable multiple real patterns by iterative linear programming. Prog. Electromagn. Res. 2016, 155, 27–38. [Google Scholar] [CrossRef]
- Candes, E.J.; Wakin, M.B.; Boyd, S.P. Enhancing sparsity by reweighted l1 minimization. J. Fourier Anal. Appl. 2008, 14, 877–905. [Google Scholar] [CrossRef]
- Sun, S.; Kooij, B.J.; Yarovoy, A.G. A linear model for microwave imaging of highly conductive scatterers. IEEE Trans. Microw. Theory Technol. 2018, 66, 1149–1164. [Google Scholar] [CrossRef]
- Zeng, J.; Lin, S.; Wang, Y.; Xu, Z. L1/2 regularization: Convergence of iterative half thresholding algorithm. IEEE Trans. Signal Process. 2014, 62, 2317–2329. [Google Scholar] [CrossRef]
- Mohimani, H.; Babaie-Zadeh, M.; Jutten, C. A fast approach for overcomplete sparse decomposition based on smoothed l0 norm. IEEE Trans. Signal Process. 2009, 57, 289–301. [Google Scholar] [CrossRef]
- Gao, X.Z.; Liu, Z.; Chen, H.W.; Li, X. Fourier-sparsity integrated method for complex target ISAR imagery. Sensors 2015, 15, 2723–2736. [Google Scholar] [CrossRef] [PubMed]
- Tipping, M.E. Sparse Bayesian learning and the relevance vector machine. J. Mach. Learn. Res. 2001, 1, 211–244. [Google Scholar]
- Wang, Y.X.; Ling, H.; Chen, V.C. ISAR motion compensation via adaptive joint time–frequency technique. IEEE Trans. Aerosp. Electron. Syst. 1998, 34, 670–677. [Google Scholar] [CrossRef]
- Boashash, B.; Black, P. An efficient real-time implementation of the Wigner-Ville distribution. IEEE Trans. Acoust. Speech Signal Process. 1987, 35, 1611–1618. [Google Scholar] [CrossRef]
- Beck, A.; Teboulle, M. A fast iterative shrinkage-thresholding algorithm for linear inverse problems. SIAM J. Imaging Sci. 2009, 2, 183–202. [Google Scholar] [CrossRef]
- Tan, Z.; Yang, P.; Nehorai, A. Joint sparse recovery method for compressed sensing with structured dictionary mismatches. IEEE Trans. Signal Process. 2014, 62, 4997–5008. [Google Scholar] [CrossRef]
- Wang, L.; Zhao, L.F.; Bi, G.A.; Wan, C.R.; Yang, L. Enhanced ISAR imaging by exploiting the continuity of the target scene. IEEE Trans. Geosci. Remote Sens. 2014, 52, 5736–5750. [Google Scholar] [CrossRef]
- Anitori, L.; Maleki, A.; Otten, M.; Baraniuk, R.G.; Hoogeboom, P. Design and analysis of compressed sensing radar detectors. IEEE Trans. Signal Process. 2013, 61, 813–827. [Google Scholar] [CrossRef]
- Rius, J.; Ferrando, M.; Jofre, L. GRECO: Graphical electromagnetic computing for RCS prediction in real time. IEEE Trans. Antennas Propag. 1993, 35, 7–17. [Google Scholar] [CrossRef]
- Qiu, W.; Giusti, E.; Bacci, A.; Martorella, M.; Berizzi, F.; Zhao, H.Z.; Fu, Q. Compressive sensing–based algorithm for passive bistatic ISAR with DVB-T signals. IEEE Trans. Aerosp. Electron. Syst. 2015, 51, 2166–2180. [Google Scholar] [CrossRef]
© 2018 by the authors. Licensee MDPI, Basel, Switzerland. This article is an open access article distributed under the terms and conditions of the Creative Commons Attribution (CC BY) license (http://creativecommons.org/licenses/by/4.0/).