Evaluation of Over-The-Row Harvester Damage in a Super-High-Density Olive Orchard Using On-Board Sensing Techniques

 ,
,  , , , ,
  and
and
Abstract
1. Introduction
- -
- to develop a novel platform combining two LiDAR sensor scans in different orientations to select the most reliable one for measuring the olive tree crown volume,
- -
- to evaluate the proposed methodology for identifying structural changes related to the tree damage caused by harvesting, and
- -
- to relate the tree structure changes to fruit removal and the possible damage it caused.
2. Materials and Methods
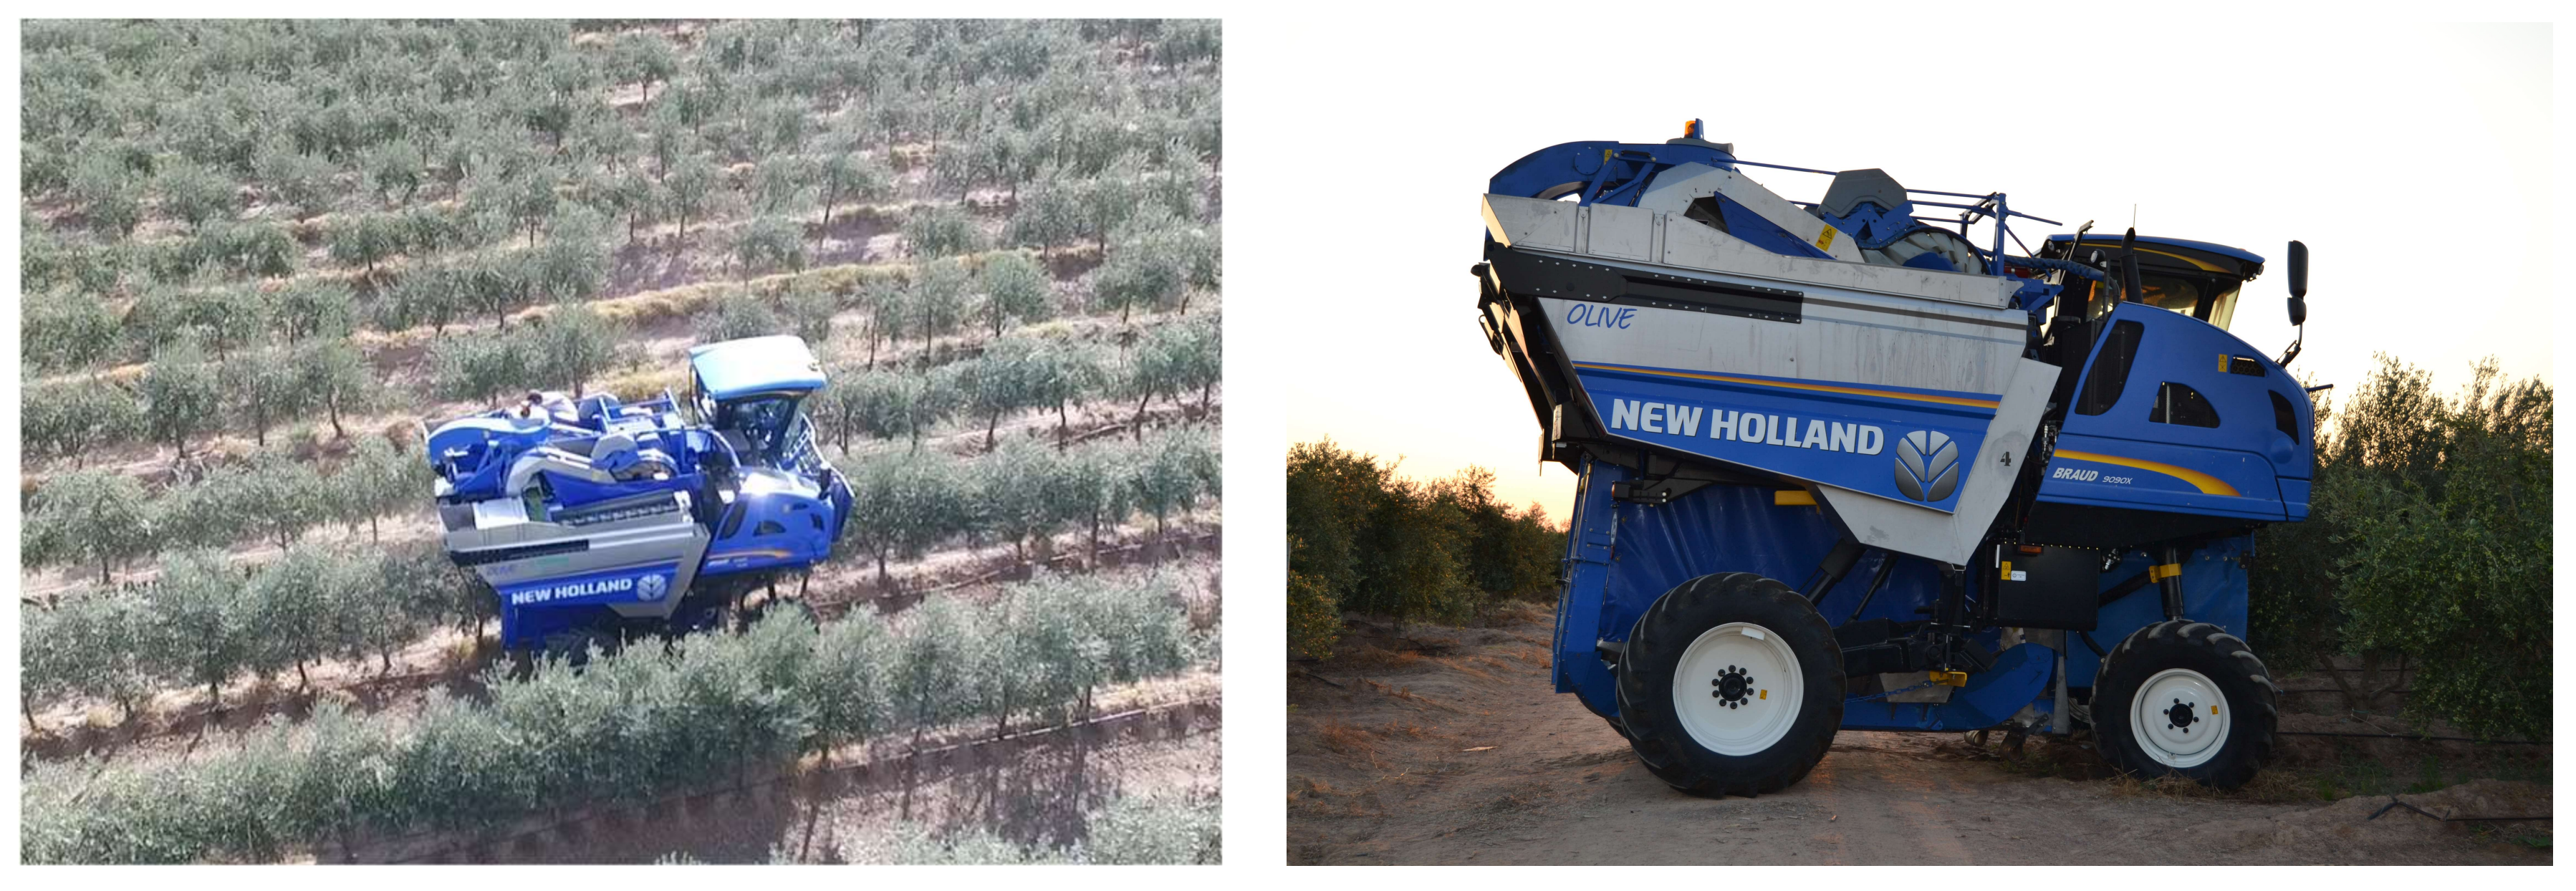
2.1. Field Site and Experimental Design
2.2. Harvesting Efficiency
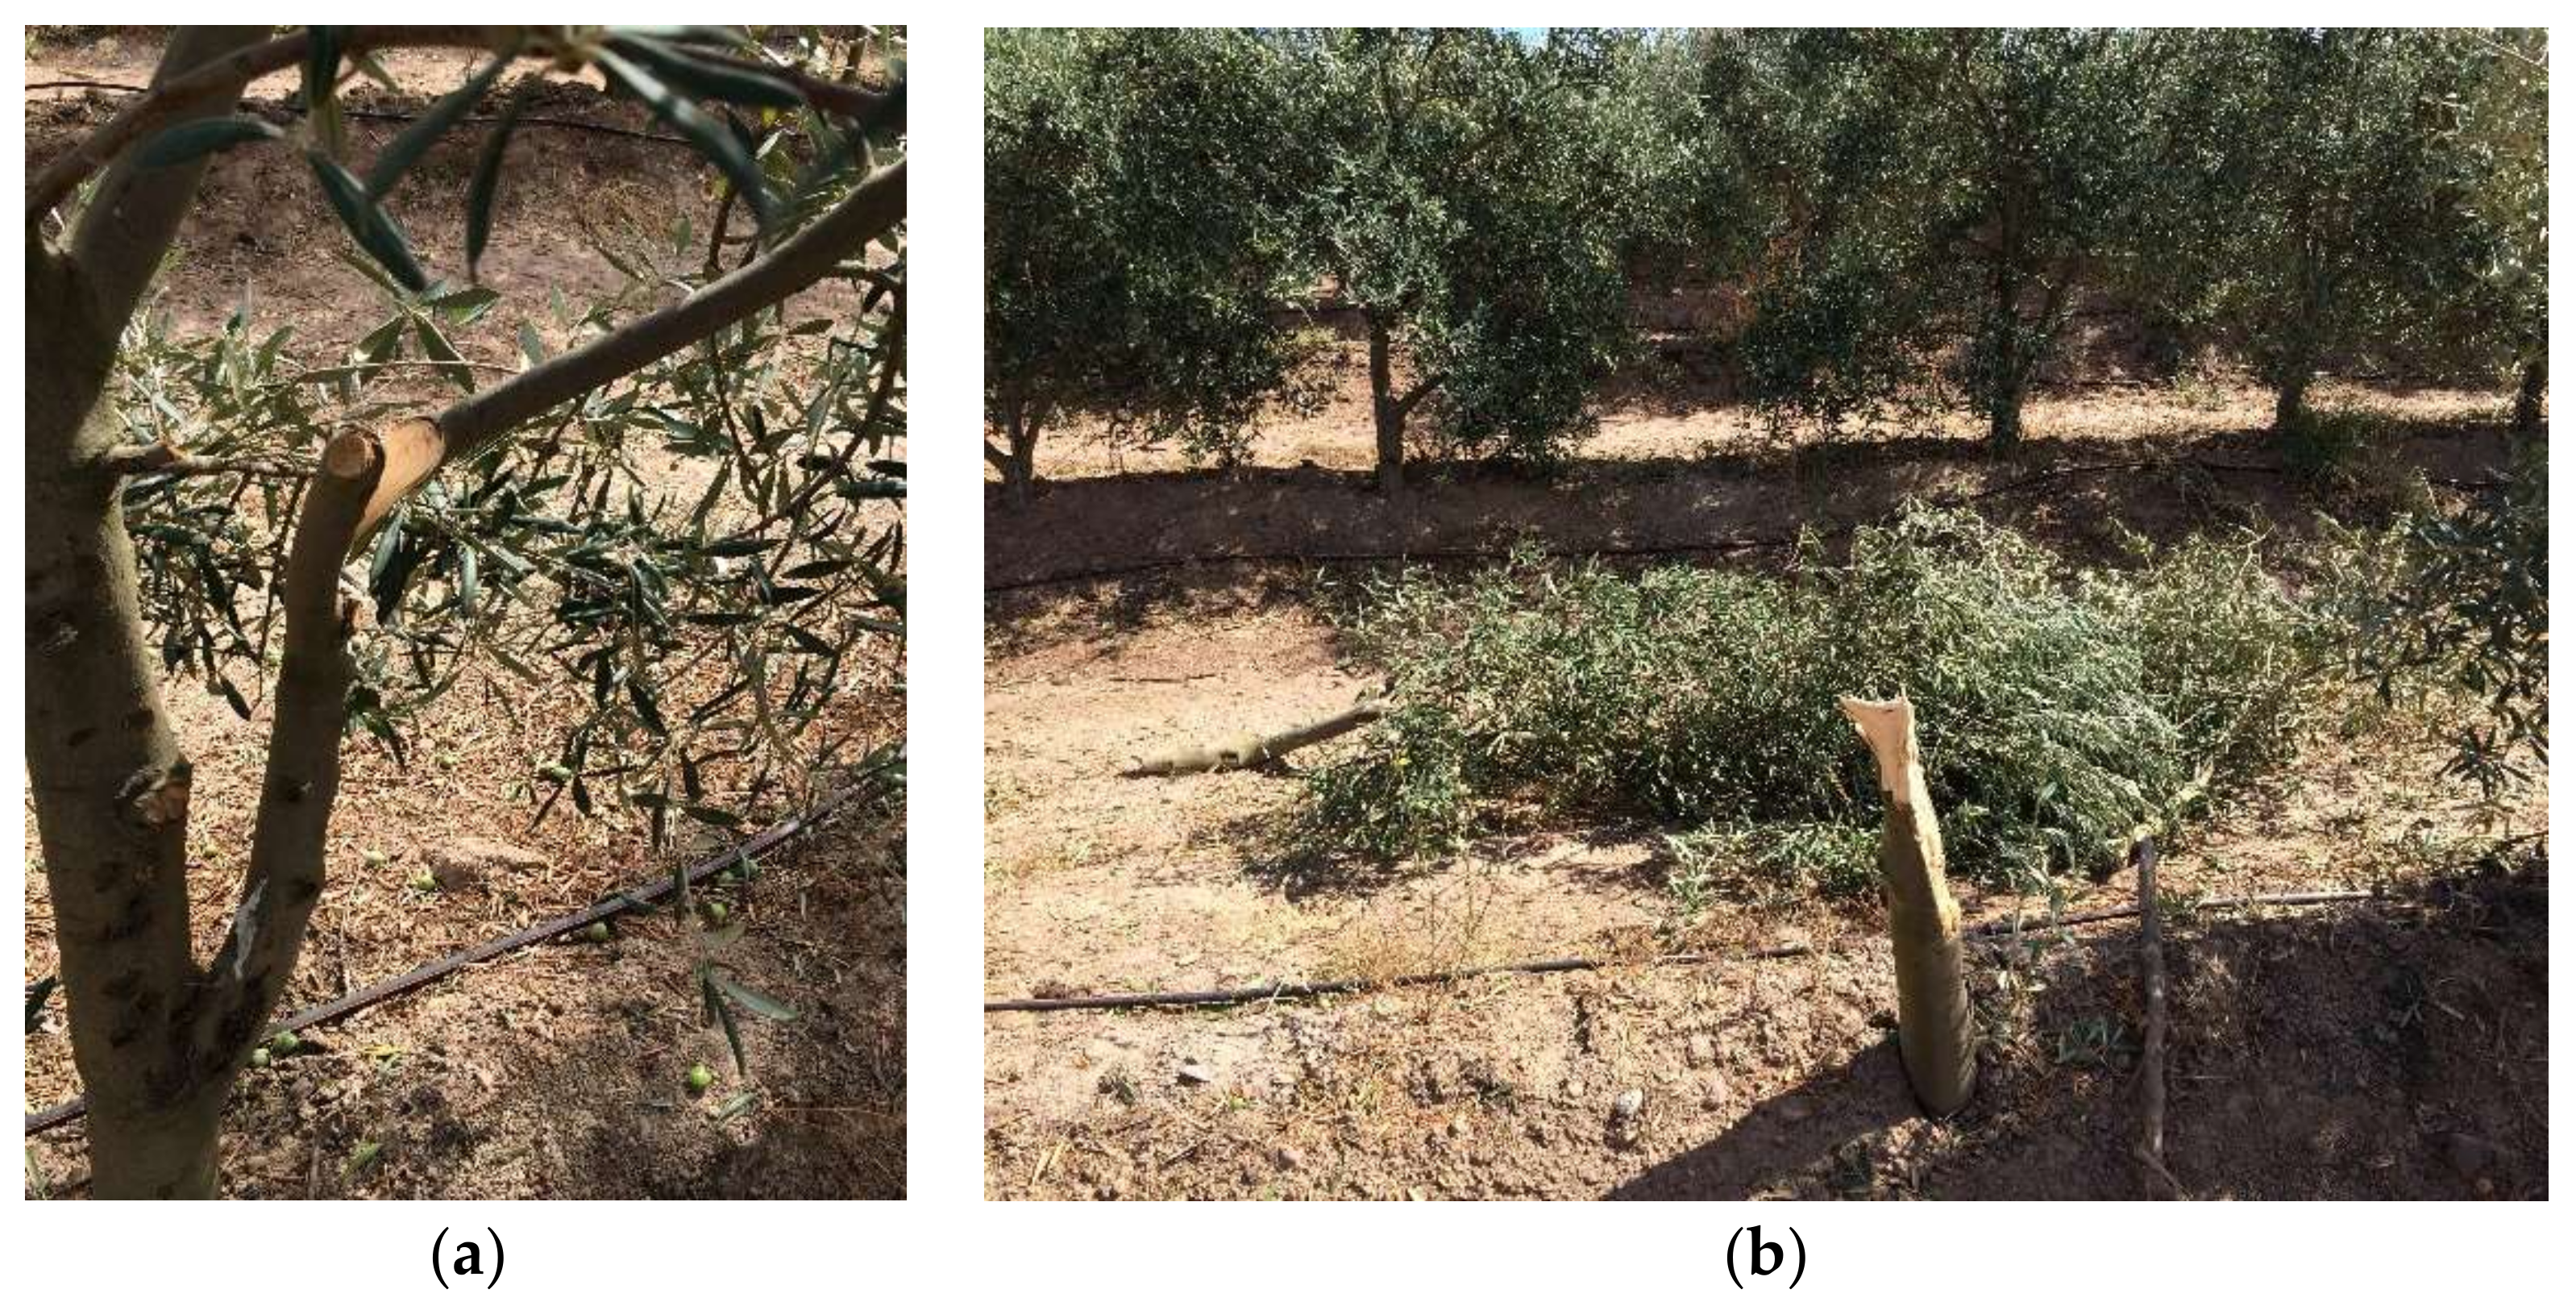
2.3. Olive Fruit Damage Caused by Mechanical Harvesting
2.4. Statistical Analysis
2.5. Structural Olive Tree Damage Caused by Mechanical Harvesting
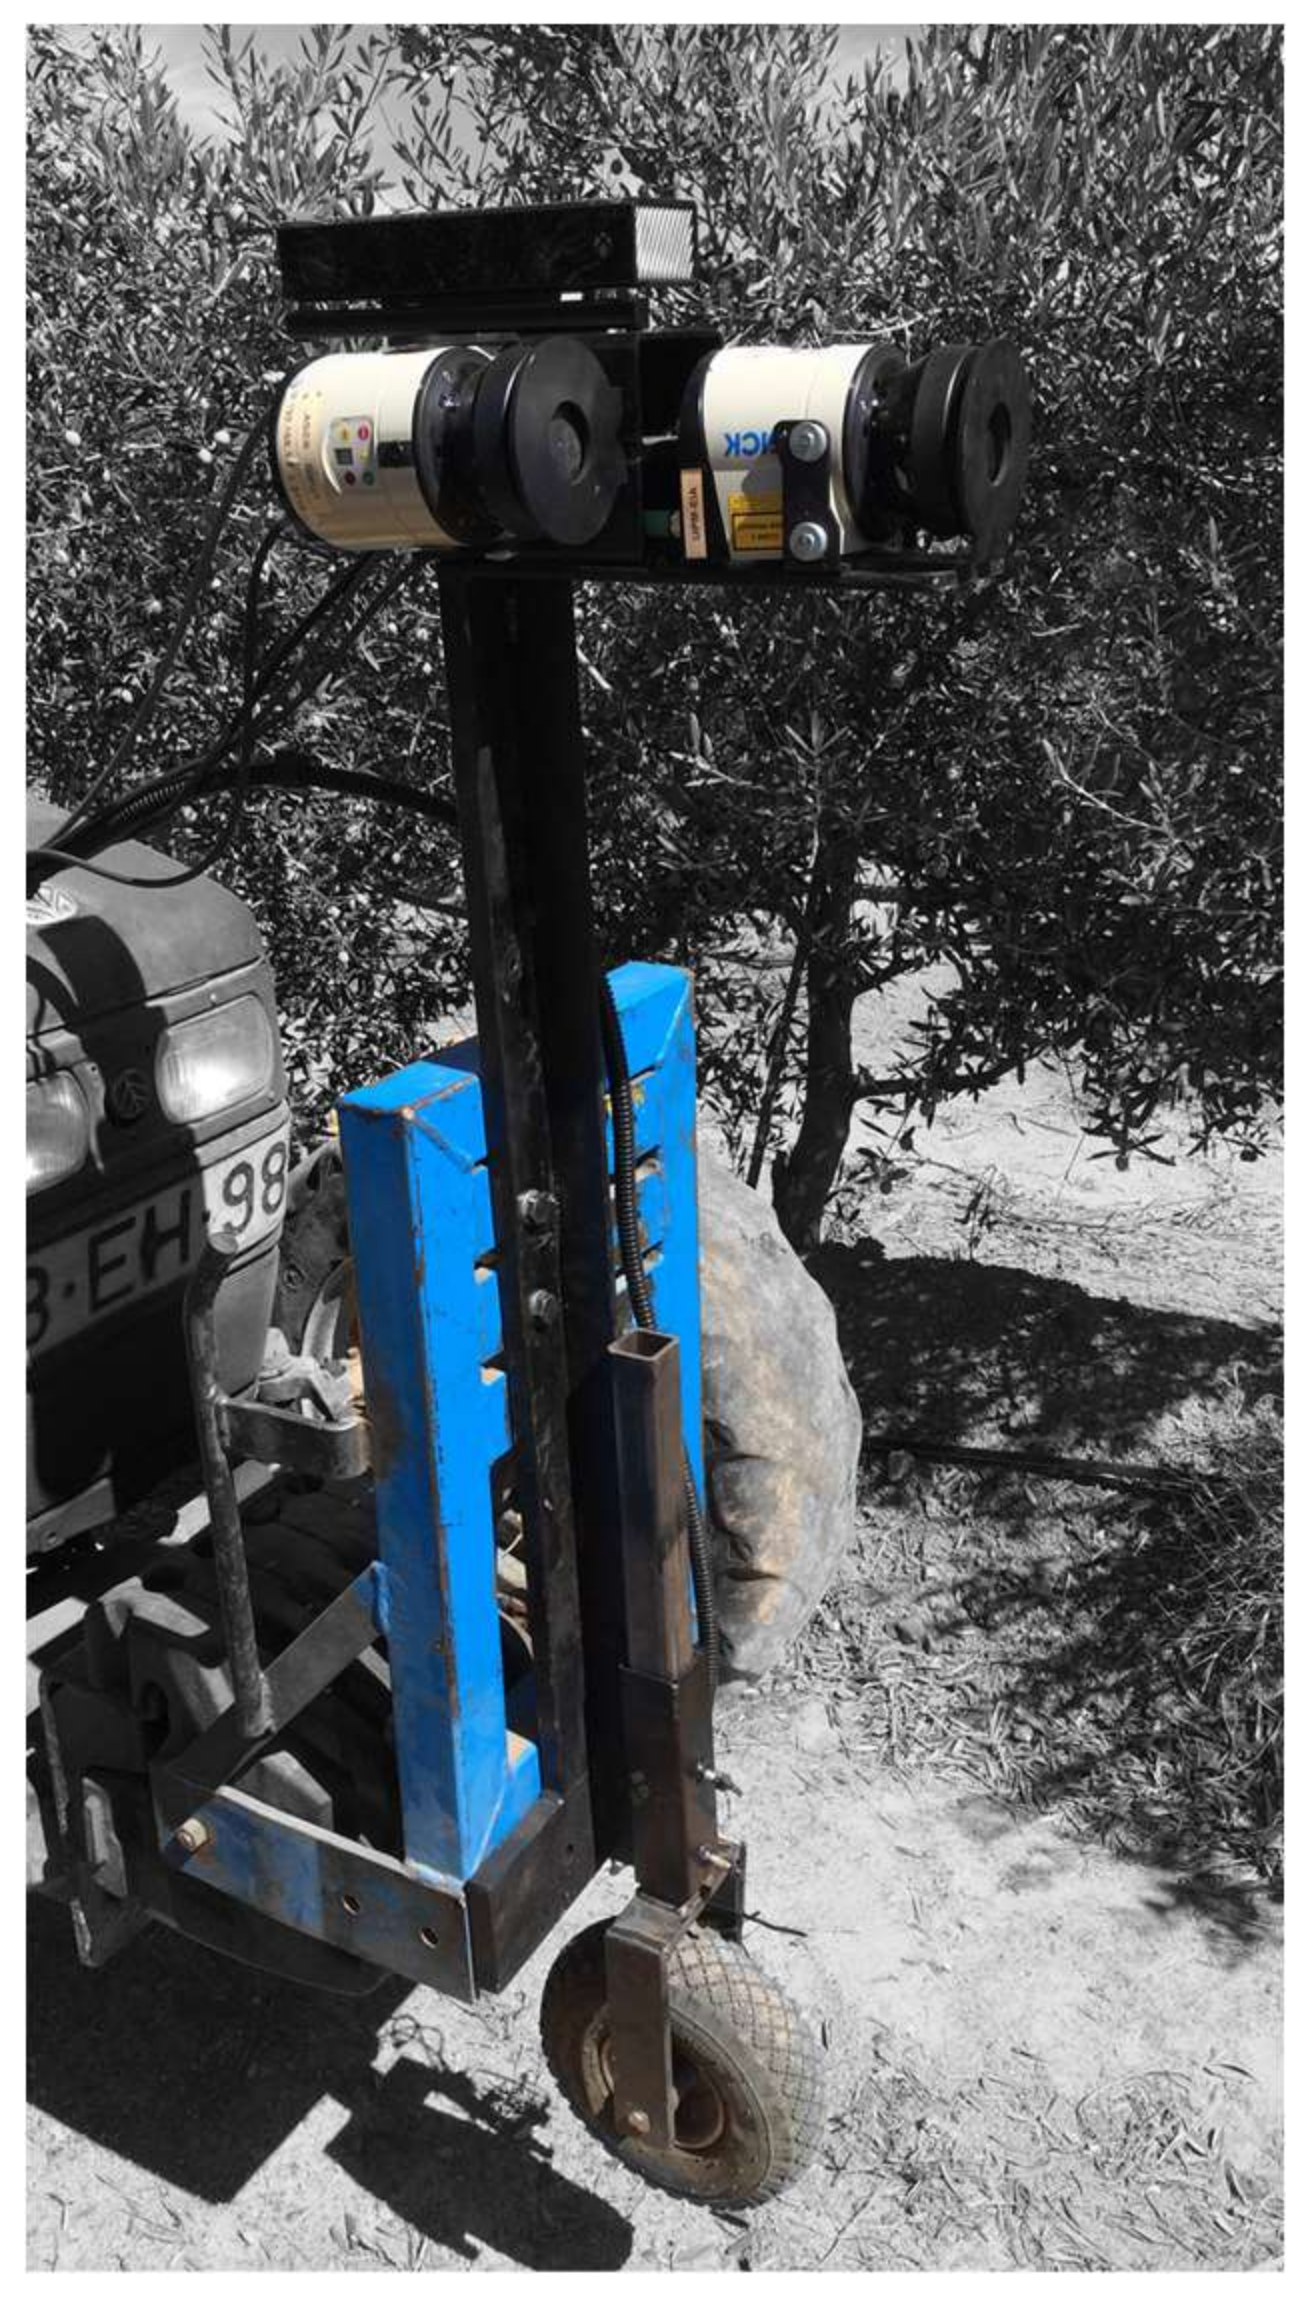
2.5.1. LiDAR Data Acquisition in Field Tests
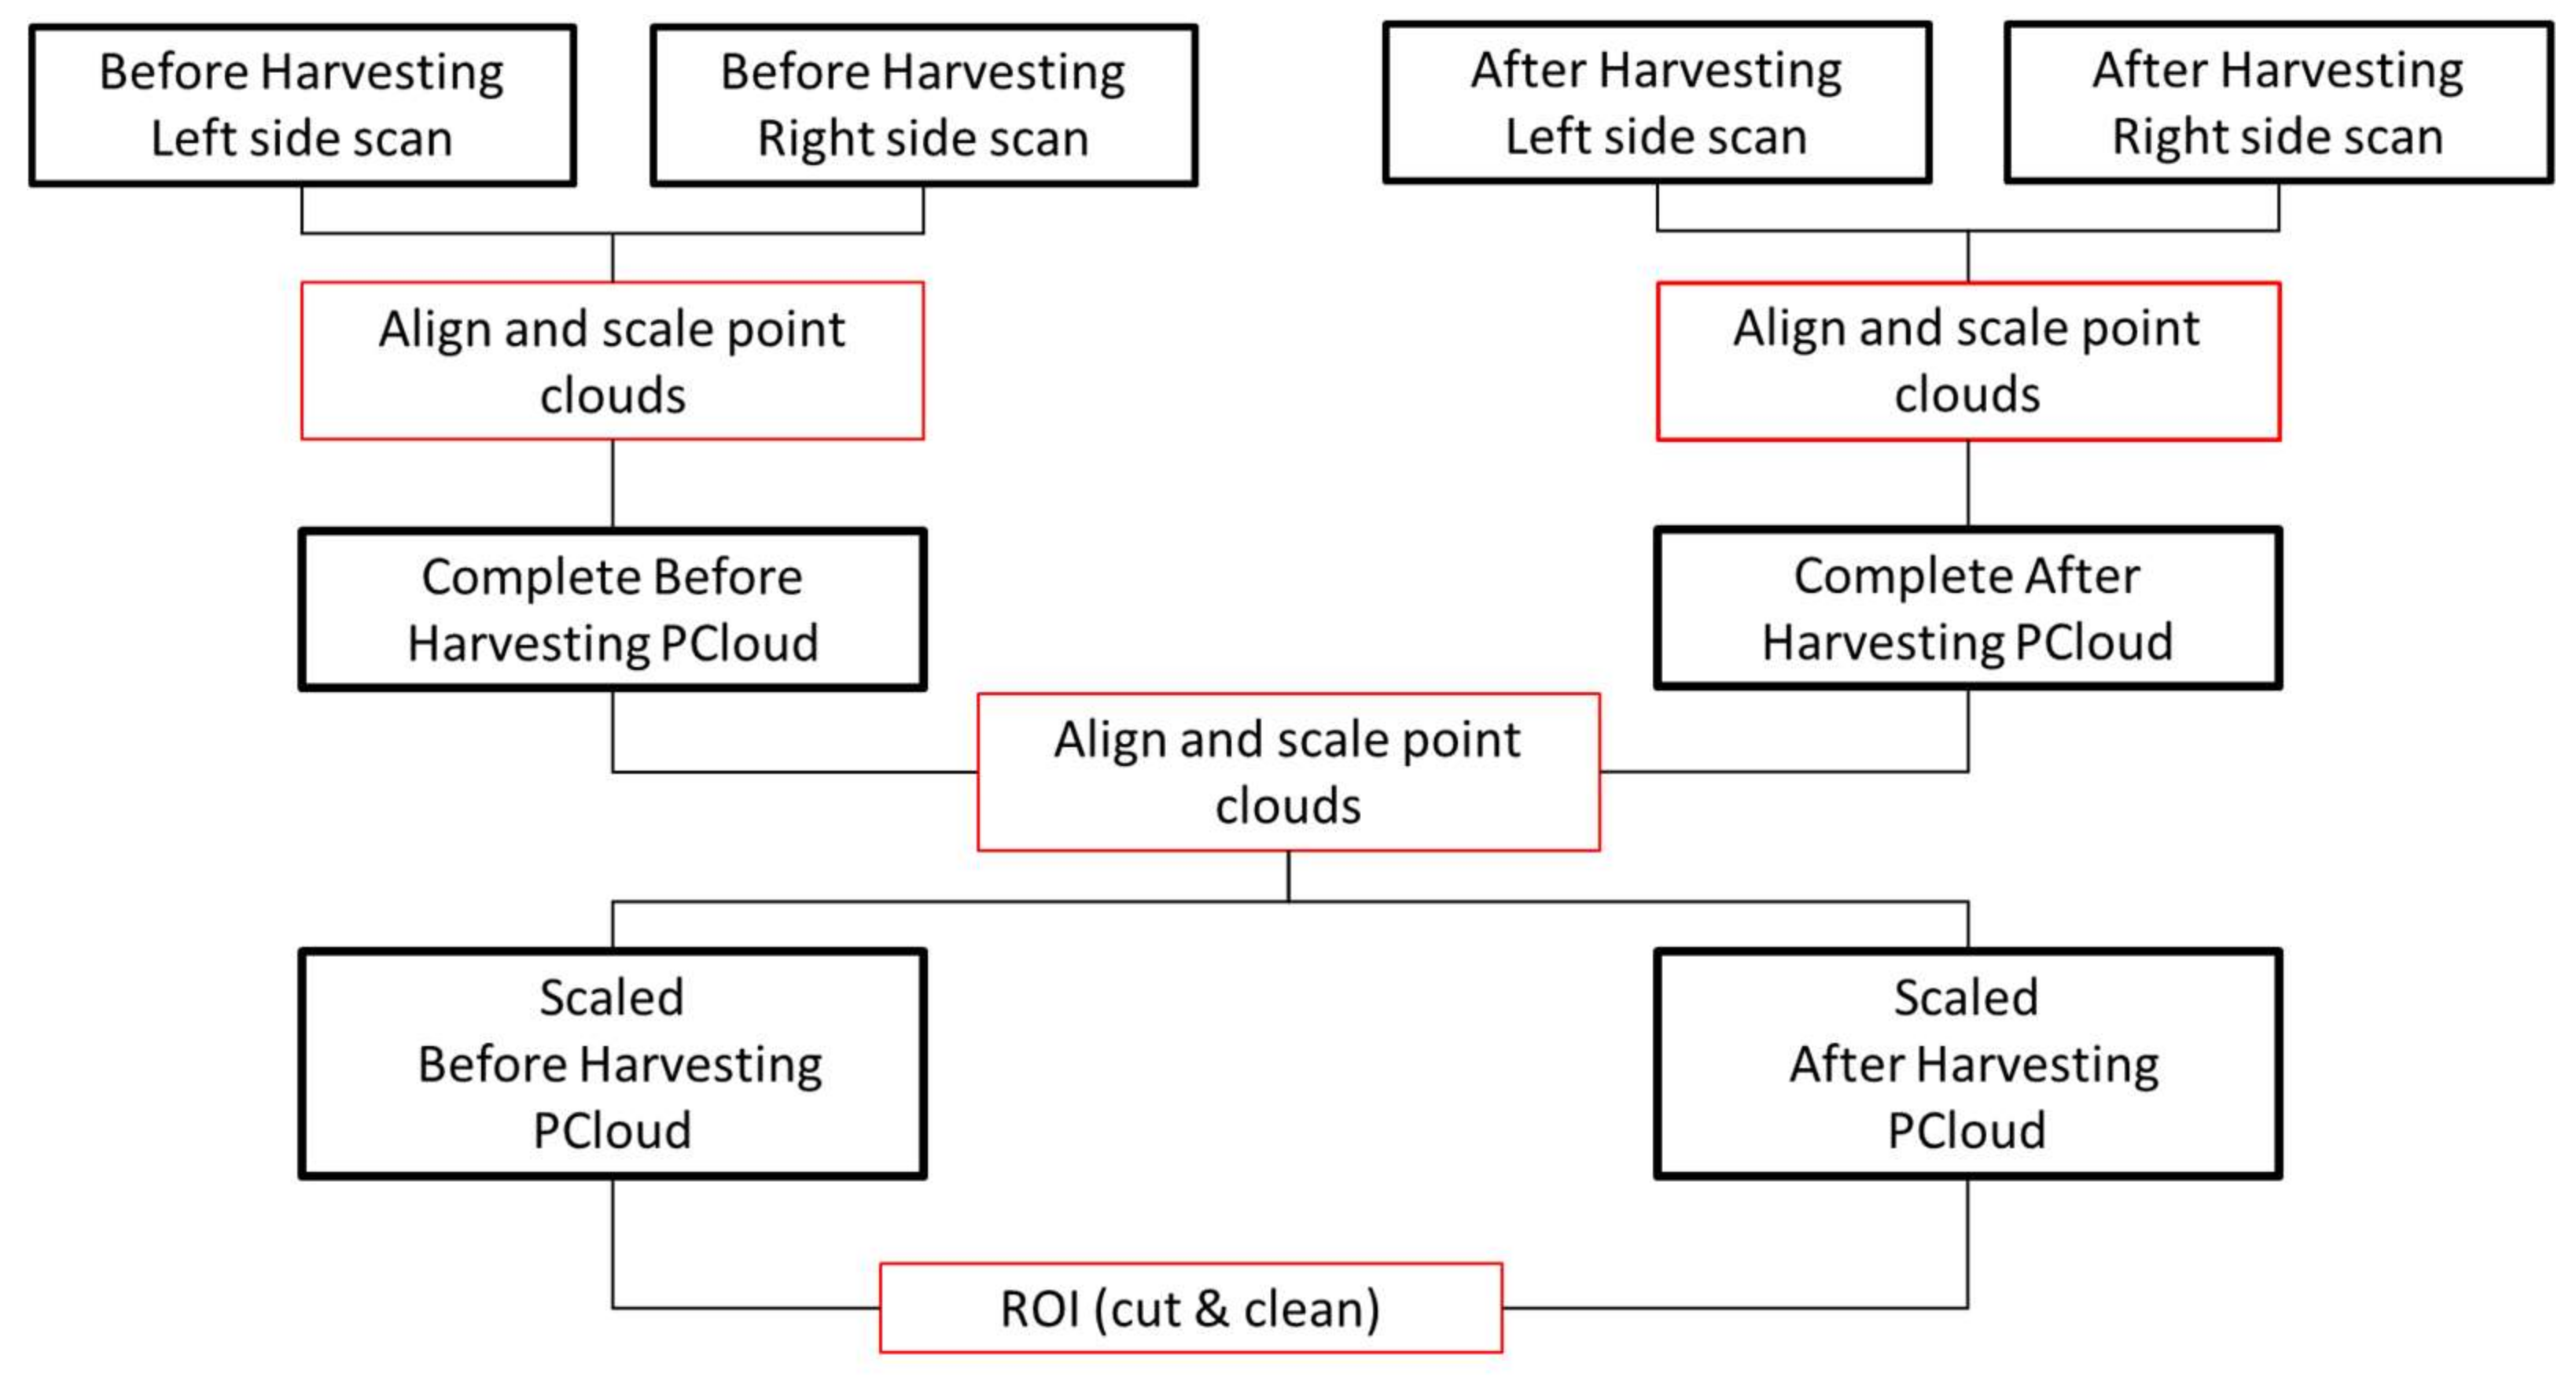
2.5.2. LiDAR Data-Processing Methodology
Point Cloud Representation
Point Cloud Alignment and Filtering
Tree Row Volume Calculation Used to Estimate Biomass Loss Due to Harvesting
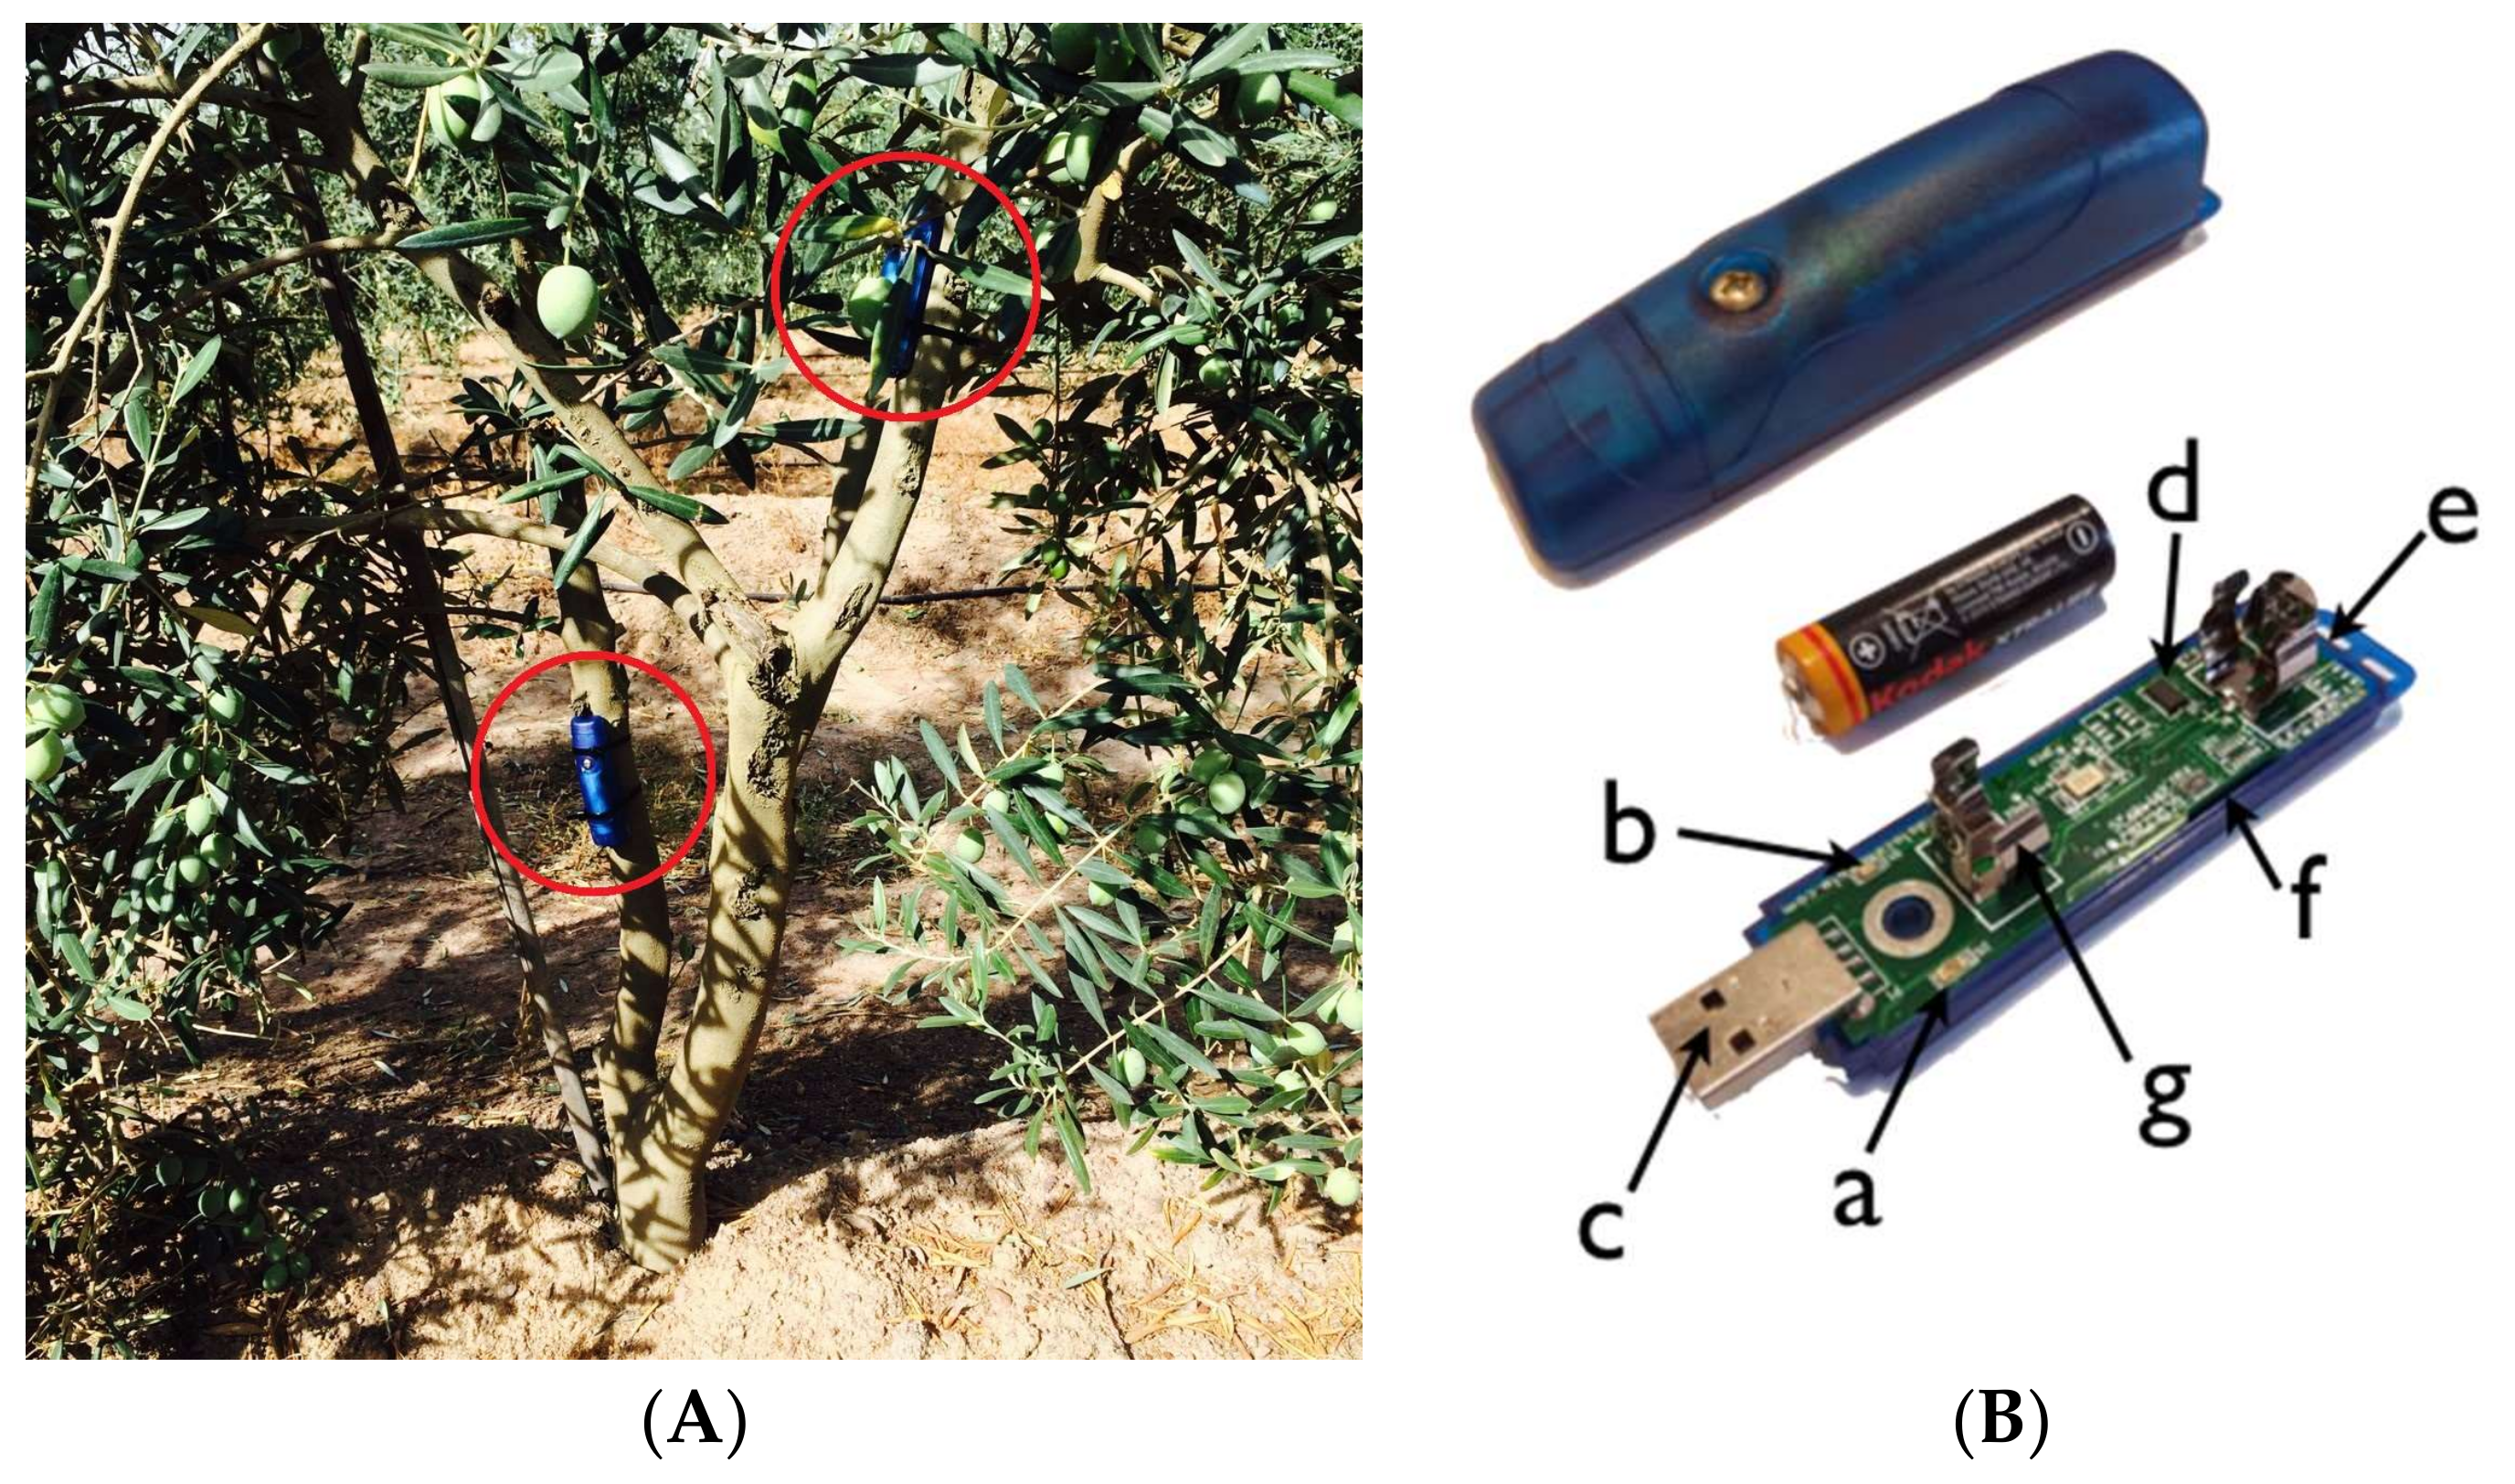
2.5.3. USB Accelerometer Data Logger
3. Results and Discussion
3.1. Harvesting Efficiency
3.2. Olive Fruit Damage Caused by Mechanical Harvesting
3.3. Structural Olive Tree Damage Caused by Mechanical Harvesting
3.3.1. LiDAR Results
3.3.2. Accelerometer Results
4. Conclusions
- -
- The evaluated methodology for on-board data collection and off-line volume measuring was able to determine the row-tree volume properly with a high level of localization. Even when using a low-cost odometry reference system, the correct spatial localization of laser scans was achieved, allowing for the generation of accurate point clouds in the tree rows.
- -
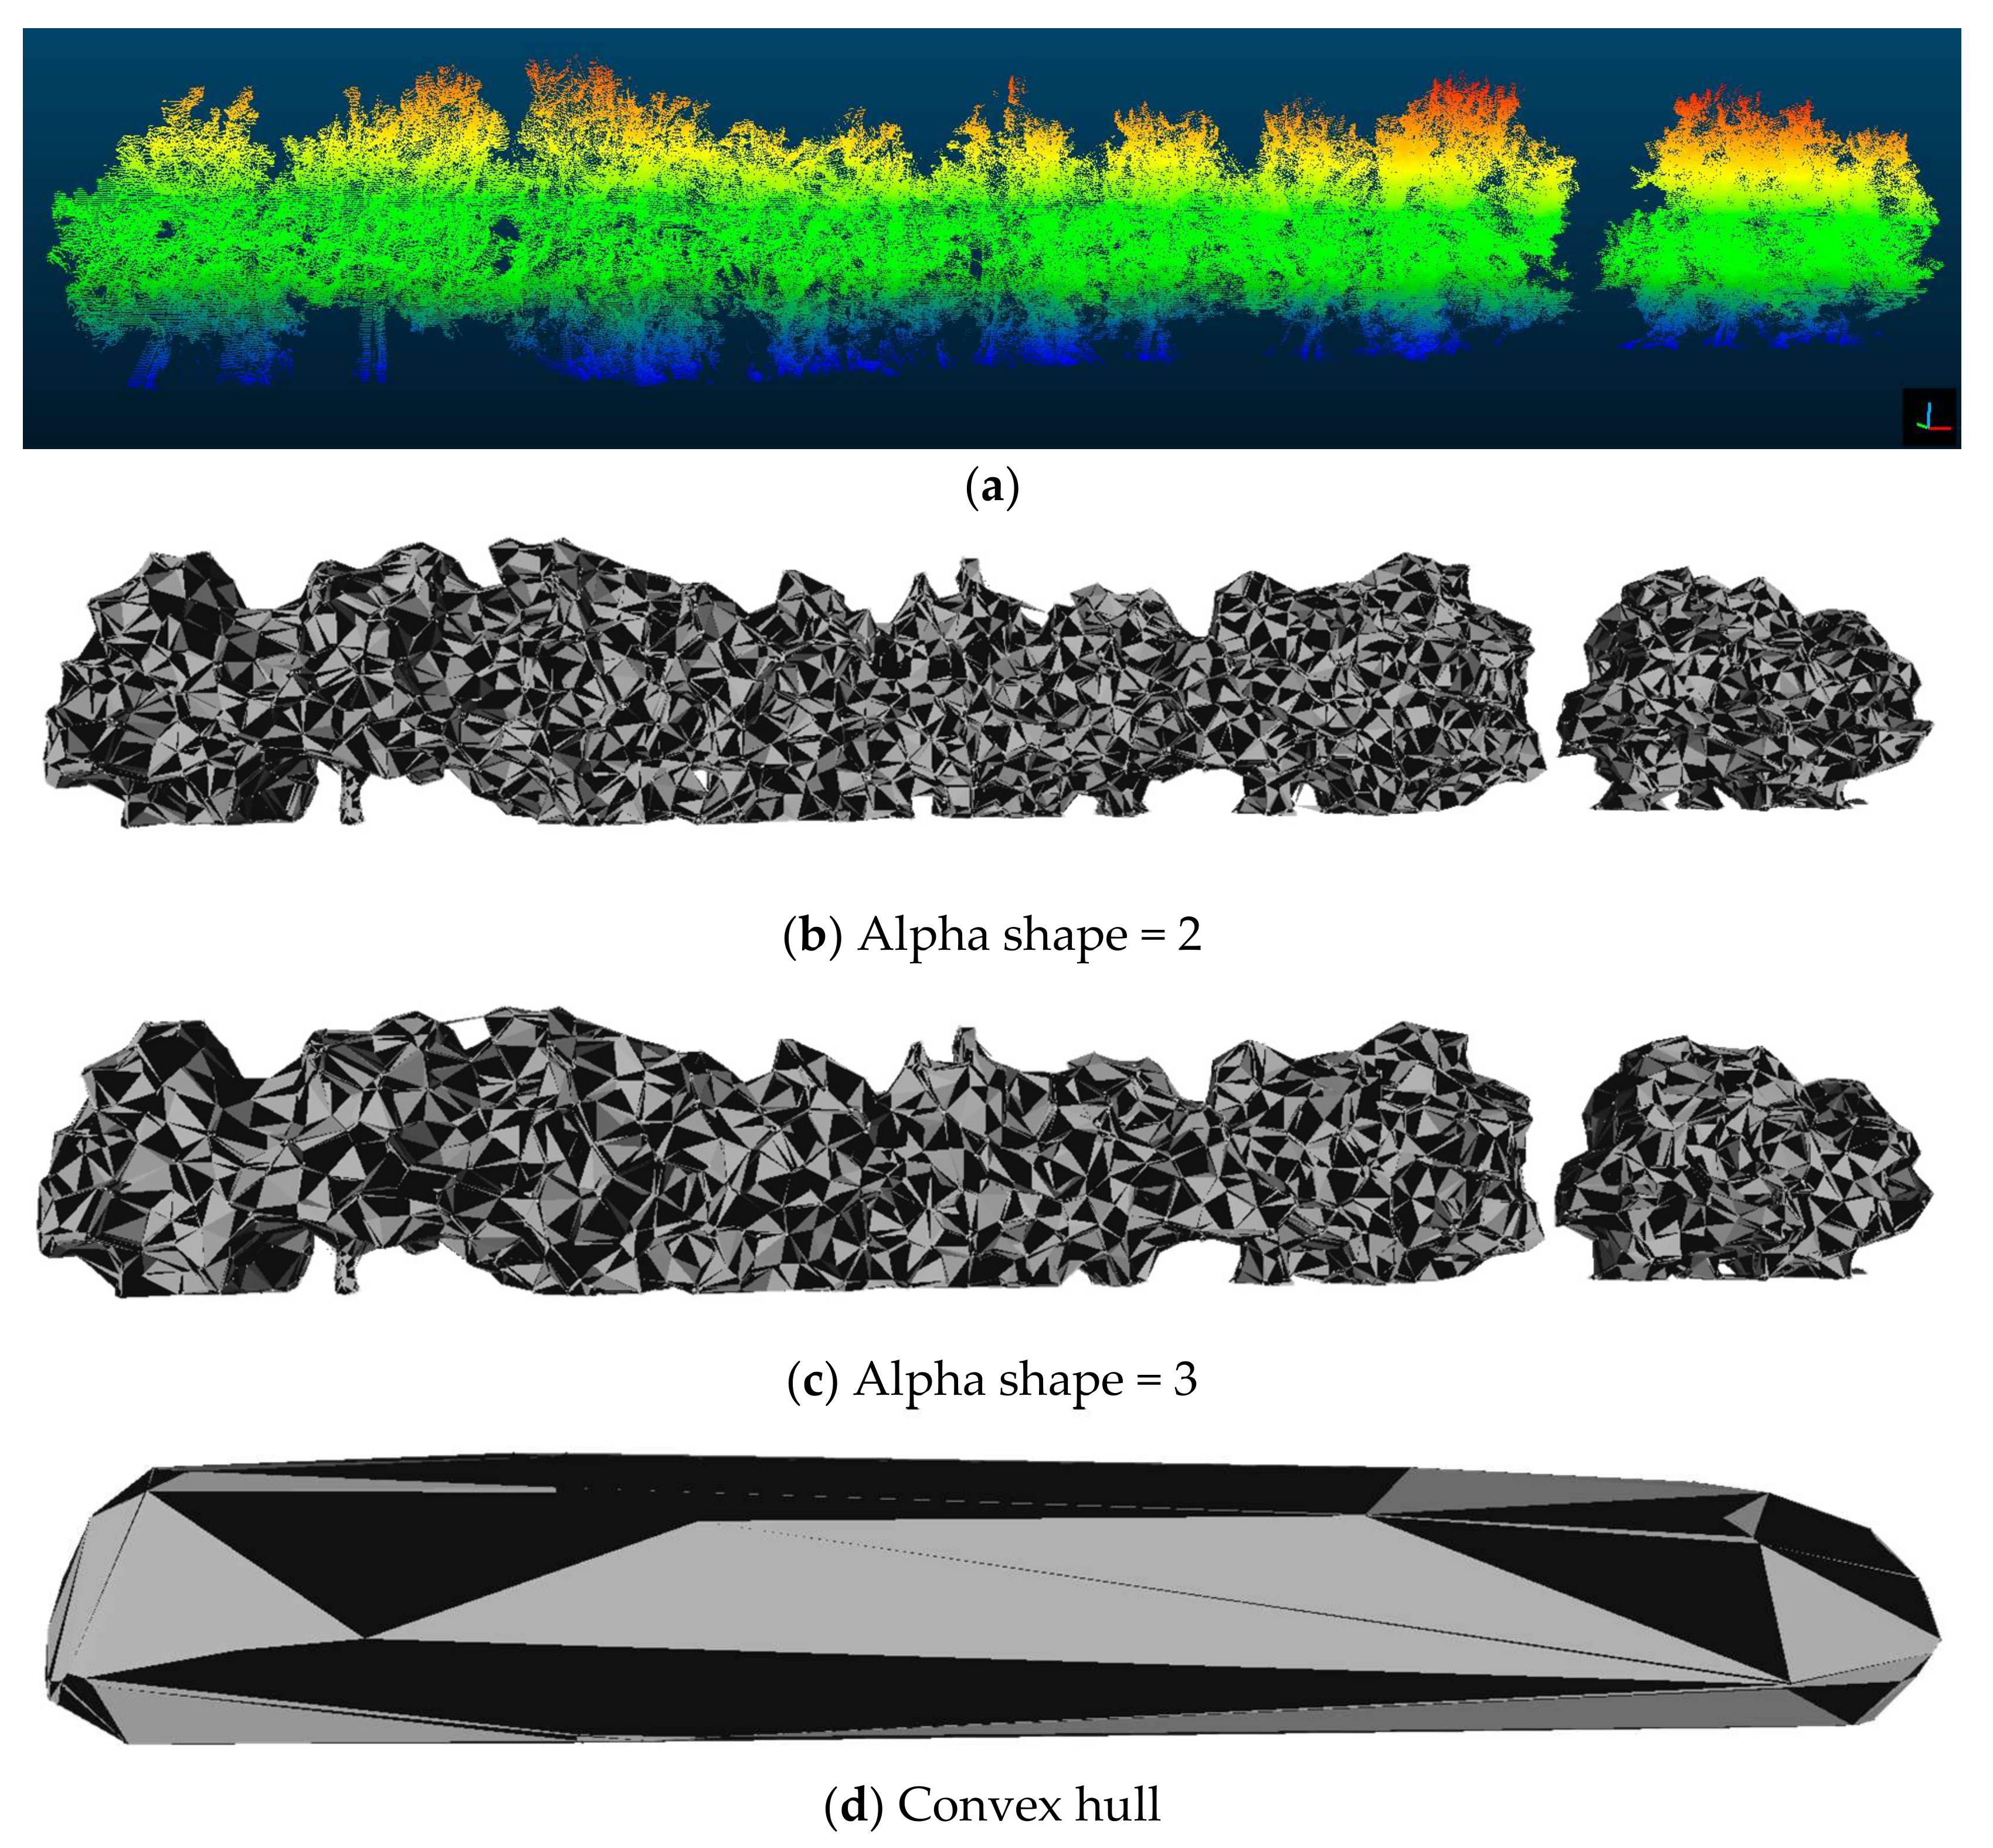
- Field experiments using the LiDAR sensors indicate that in all cases, there is a notable loss of biomass between the pre- and post-harvest mass. This biomass combines both the fruit that is harvested and the structure of the tree itself. For this reason, the most relevant indicator of tree damage was established via the study of the canopy volume through the alpha function for surface generation. In this manner, information was obtained from the outer points of the cloud, producing a surface that envelopes the object and shapes the geometry of the tree.
- -
- The average biomass volume variation in the harvest was 1.11 m3, and it was fairly uniform in both varieties.
- -
- Two different laser scan orientations (one scanning upwards and the other one scanning sideways) were tested with the same scanning range to compare the point cloud densities and accuracies in the volume measurements. The results show that the upwards LiDAR obtained a slightly smaller tree volume than the lateral one, which could be explained because of its position and orientation; the points remaining on the inside-bottom part of the canopy were occluded from its laser beam.
- -
- The agricultural use of on-board sensing techniques, such as LiDAR sensors, could reduce costs in the near future, in terms of yield estimation, tree damage calculation or help with autonomous navigation. As mentioned in previous studies referred to in the introduction (for example, in [20,24,29]) the complexity in the use of LiDAR sensors and the analysis of the large amount of data generated by these systems still causes them to have long processing times, while specific software must be developed to obtain accurate user-friendly information. Thus, the authors can also conclude that these systems still lack the robustness and quicker response needed to be pre-commercially deployable under unstructured scenarios such as real field conditions.
Acknowledgments
Author Contributions
Conflicts of Interest
References
- International Olive Council. 2017. Available online: http://www.internationaloliveoil.org (accessed on 1 February 2018).
- Lavee, S. Integrated mechanical, chemical and horticultural methodologies for harvesting of oil olives and the potential interaction with different growing systems: A general review. Adv. Hortic. Sci. 2010, 24, 5–15. [Google Scholar]
- Connor, D.J.; Gómez-del-Campo, M.; Rousseaux, M.C.; Searles, P.S. Structure, management and productivity of hedgerow olive orchards: A review. Sci. Hortic. 2014, 169, 71–93. [Google Scholar] [CrossRef]
- Tous, J.; Romero, A.; Hermoso, J.F. New trends in olive orchard design for continuous mechanical harvesting. Adv. Hortic. Sci. 2010, 24, 43–52. [Google Scholar]
- Morales-Sillero, A.; Rallo, P.; Jiménez, M.R.; Casanova, L.; Suárez, M.P. Suitability of two table olive cultivars (‘Manzanilla de Sevilla’ and ‘Manzanilla Cacereña’) for mechanical harvesting in superhigh-density hedgerows. HortScience 2014, 49, 1028–1033. [Google Scholar]
- Riquelme, M.T.; Barreiro, P.; Ruiz-Altisent, M.; Valero, C. Olive classification according to external damage using image analysis. J. Food Eng. 2008, 87, 371–379. [Google Scholar] [CrossRef]
- Jiménez, M.R.; Rallo, P.; Rapoport, H.F.; Suárez, M.P. Distribution and timing of cell damage associated with olive fruit bruising and its use in analyzing susceptibility. Postharvest Biol. Technol. 2016, 111, 117–125. [Google Scholar] [CrossRef]
- Jiménez, M.R.; Casanova, L.; Suárez, M.P.; Rallo, P.; Morales-Sillero, A. Internal fruit damage in table olive cultivars under superhigh-density hedgerows. Postharvest Biol. Technol. 2017, 132, 130–137. [Google Scholar] [CrossRef]
- Morales-Sillero, A.; García, J.M. Impact assessment of mechanical harvest on fruit physiology and consequences on oil physicochemical and sensory quality from ‘Manzanilla de Sevilla’ and ‘Manzanilla Cacereña’ super-high-density hedgerows. A preliminary study. J. Sci. Food Agric. 2015, 95, 2445–2453. [Google Scholar] [CrossRef] [PubMed]
- Yousfi, K.; Weiland, C.M.; García, J.M. Responses of fruit physiology and virgin oil quality to cold storage of mechanically harvested ‘Arbequina’ olives cultivated in hedgerow. Grasas y Aceites 2013, 64, 572–582. [Google Scholar]
- Gupta, S.K.; Ehsani, R.; Kim, N.H. Optimization of a citrus canopy shaker harvesting system: Mechanistic tree damage and fruit detachment models. Trans. ASABE 2016, 59, 761–776. [Google Scholar]
- Barranco, D.; de Toro, C.C.; Oriq, M.; Rapoport, H.F. Monopotassium phosphate (PO4H2K) for olive fruit abscission. Acta Hortic. 2002, 586, 263–266. [Google Scholar] [CrossRef]
- Camposeo, S.; Vivaldi, G.A.; Gattullo, C.E. Ripening indices and harvesting times of different olive cultivars for continuous harvest. Sci. Hortic. 2013, 151, 1–10. [Google Scholar] [CrossRef]
- Ravetti, L.M. Evaluation of new olive mechanical harvesting techniques in Australia. Acta Hortic. 2008, 791, 387–392. [Google Scholar] [CrossRef]
- Ross, J. The Radiation Regime and Architecture of Plant Stands; Springer: Berlin, Germany, 2012; Volume 3. [Google Scholar]
- Norman, J.M.; Campbell, G.S. Canopy structure. In Plant Physiological Ecology; Pearcy, R.W., Ehleringer, J.R., Mooney, H.A., Rundel, P.W., Eds.; Springer: Dordrecht, The Netherlands, 1989; pp. 301–325. [Google Scholar]
- Palacín, J.; Pallejá, T.; Tresanchez, M.; Sanz, R.; Llorens, J.; Ribes-Dasi, M.; Masip, J.; Arnó, J.; Escolá, A.; Rosell, J.R. Real-Time Tree-Foliage Surface Estimation Using a Ground Laser Scanner. IEEE Trans. Instrum. Meas. 2007, 56, 1377–1383. [Google Scholar]
- Rosell, J.R.; Sanz, R. A review of methods and applications of the geometric characterization of tree crops in agricultural activities. Comput. Electron. Agric. 2012, 81, 124–141. [Google Scholar] [CrossRef]
- Llorens, J.; Gil, E.; Llop, J.; Escolà, A. Ultrasonic and LIDAR Sensors for Electronic Canopy Characterization in Vineyards: Advances to Improve Pesticide Application Methods. Sensors 2011, 11, 2177–2194. [Google Scholar] [CrossRef] [PubMed]
- Tumbo, S.D.; Salyani, M.; Whitney, J.D.; Wheaton, T.A.; Miller, W.M. Investigation of laser and ultrasonic ranging sensors for measurements of citrus canopy volume. Appl. Eng. Agric. 2002, 18, 367–372. [Google Scholar] [CrossRef]
- Sanz, R.; Rosell, J.R.; Llorens, J.; Gil, E.; Planas, S. Relationship between tree row LIDAR-volume and leaf area density for fruit orchards and vineyards obtained with a LIDAR 3D Dynamic Measurement System. Agric. For. Meteorol. 2013, 171–172, 153–162. [Google Scholar] [CrossRef]
- Llop, J.; Gil, E.; Llorens, J.; Miranda-Fuentes, A.; Gallart, M. Testing the suitability of a terrestrial 2D LiDAR scanner for canopy characterization of greenhouse tomato crops. Sensors 2016, 16, 1435. [Google Scholar] [CrossRef] [PubMed]
- Miranda-Fuentes, A.; Llorens, J.; Gamarra-Diezma, J.L.; Gil-Ribes, J.A.; Gil, E. Towards an optimized method of olive tree crown volume measurement. Sensors 2015, 15, 3672–3687. [Google Scholar] [CrossRef] [PubMed]
- Choi, J.; Yin, X.; Yang, L.; Noguchi, N. Development of a laser scanner-based navigation system for a combine harvester. Agric. Environ. Food 2014, 7, 7–13. [Google Scholar] [CrossRef]
- Andújar, D.; Escolà, A.; Rosell-Polo, J.R.; Fernández-Quintanilla, C.; Dorado, J. Potential of a terrestrial LiDAR-based system to characterise weed vegetation in maize crops. Comput. Electron. Agric. 2013, 92, 11–15. [Google Scholar] [CrossRef]
- Armbrust, C.; Braun, T.; Föhst, T.; Proetzsch, M.; Renner, A.; Schäfer, B.H.; Berns, K. RAVON: The robust autonomous vehicle for off-road navigation. In Using Robots in Hazardous Environments; Elsevier: New York, NY, USA, 2011; pp. 353–396. [Google Scholar]
- Zhang, L.; Grift, T.E. A LIDAR-based crop height measurement system for Miscanthus giganteus. Comput. Electron. Agric. 2012, 85, 70–76. [Google Scholar] [CrossRef]
- Martínez-Guanter, J.; Garrido-Izard, M.; Valero, C.; Slaughter, D.C.; Pérez-Ruiz, M. Optical sensing to determine tomato plant spacing for precise agrochemical application: Two scenarios. Sensors 2017, 17, 1096. [Google Scholar] [CrossRef] [PubMed]
- Garrido, M.; Paraforos, D.; Reiser, D.; Vázquez Arellano, M.; Griepentrog, H.; Valero, C. 3D Maize Plant Reconstruction Based on Georeferenced Overlapping LiDAR Point Clouds. Sensors 2015, 7, 17077–17096. [Google Scholar] [CrossRef]
- Rosell, J.R.; Sanz, R.; Llorens, J.; Arnó, J.; Escolà, A.; Ribes-Dasi, M.; Masip, J.; Camp, F.; Gràcia, F.; Solanelles, F.; et al. A tractor-mounted scanning LIDAR for the non-destructive measurement of vegetative volume and surface area of tree-row plantations: A comparison with conventional destructive measurements. Biosyst. Eng. 2009, 102, 128–134. [Google Scholar] [CrossRef]
- Escolà, A.; Sanz, R.; Martínez-Casasnovas, J.A.; Masip, J.; Sebé, F.; Arnó, J.; Gregorio, E.; Rufat, J.; Arbonés, A.; Ribes-Dasi, M.; et al. Obtaining and mapping relevant characteristics of olive tree canopies using a multi-echo mobile terrestrial laser scanner (MTLS). In Proceedings of the International Conference on Agricultural Engineering, Zurich, Switzerland, 6–10 July 2014; pp. 1–8. [Google Scholar]
- Castellano, J.M.; García, J.M.; Morilla, A.; Gutiérrez, F.; Perdiguero, S. Quality of ‘Picual’ olive fruits under controlled atmospheres. J. Agric. Food Chem. 1993, 41, 537–539. [Google Scholar] [CrossRef]
- Box, G.E.; Cox, D.R. An analysis of transformations. J. R. Stat. Soc. Ser. B Methodol. 1964, 26, 211–252. [Google Scholar]
- Colaço, A.F.; Trevisan, R.G.; Molin, J.P.; Rosell-Polo, J.R.; Escolà, A. Orange tree canopy volume estimation by manual and LiDAR-based methods. Adv. Anim. Biosci. 2017, 8, 477–480. [Google Scholar] [CrossRef]
- Castro-García, S.; Castillo-Ruiz, F.J.; Jiménez-Jiménez, F.; Gil-Ribes, J.A.; Blanco-Roldan, G.L. Suitability of spanish ‘Manzanilla’ table olive orchards for trunk shaker harvesting. Biosyst. Eng. 2015, 129, 388–395. [Google Scholar] [CrossRef]
- Pezzi, F.; Caprara, C. Mechanical grape harvesting: Investigation of the transmission of vibrations. Biosyst. Eng. 2009, 103, 281–286. [Google Scholar] [CrossRef]
- Martinez-Guanter, J.; Garrido-Izard, M.; Agüera, J.; Valero, C.; Pérez-Ruiz, M. Over-the-row harvester damage evaluation in super-high-density olive orchard by on-board sensing techniques. Adv. Anim. Biosci. 2017, 8, 487–491. [Google Scholar] [CrossRef]


| Operational range | 0.5 to 20 m |
| Scanning field of view | 270° |
| Scanning Frequency | 50 Hz |
| Angular resolution | 0.5° |
| Light source | Infrared (905 nm) |
| Enclosure rating | IP 67 |
| - | LiDAR 1 (Facing Sideways) | LiDAR 2 (Facing Upwards) | ||
|---|---|---|---|---|
| Side of the scan | Left | Right | Left | Right |
| Roll φ | 0 | 0 | Pi/2 | Pi/2 |
| Pitch θ | Pi/2 | −Pi/2 | 0 | 0 |
| Yaw ψ | 0 | 0 | Pi/2 | −Pi/2 |
| - | ‘Manzanilla Cacereña’ | ‘Manzanilla de Sevilla’ | ||||
|---|---|---|---|---|---|---|
| 3 km/h-470 Hz | 2 km/h-470 Hz | 2 km/h-430 Hz | 3 km/h-470 Hz | 2 km/h-470 Hz | 2 km/h-430 Hz | |
| Time to harvest (h·ha−1) | 1.1a | 1.6b | 1.8b | 1.1a | 1.7b | 1.5b |
| Fruit removal (%) | 99.5 | 99.7 | 96.8 | 99.9 | 99.5 | 98.8 |
| Fruit on ground (%) | 2.1ab | 1.4a | 2.3b | 1.9 | 2.0 | 3.3 |
| Fruit Characteristics | ‘Manzanilla Cacereña’ | ‘Manzanilla de Sevilla’ | ||||
|---|---|---|---|---|---|---|
| 3 km/h-470 Hz | 2 km/h-470 Hz | 2 km/h-430 Hz | 3 km/h-470 Hz | 2 km/h-470 Hz | 2 km/h-430 Hz | |
| Bruising Incidence | 1.3 A | 1.3 A | 1.3 A | 1.5 B | 1.6 B | 1.6 B |
| Cut fruit (%) | 9.0 A | 7.3 A | 1.7 A | 16.7 bA | 9.3 aA | 9.7 aB |
| Firmness (N·cm−2) | 44.5 A | 44.5 A | 45.0 A | 46.0 aB | 47.0 abB | 47.5 bB |
| Colour Index (CI) | 23.8 A | 23.8 A | 24.8 A | 23.2 aA | 25.1 bB | 24.6 bA |
| Scan (Before Harvest, BH; After Harvest AH) | Average Volume (Convex Hull) | Average Volume (Alphashape) | ∆Volume (VBH–VAF) Using Alphashape | Average α Value | Average Point Cloud Density | ∆Point Cloud Density | ||
|---|---|---|---|---|---|---|---|---|
| ‘Manzanilla Cacereña’ | ||||||||
| 3 km/h (470 Hz) | LiDAR 1 lateral position | BH | 51.32 m3 | 38.63 m3 | - | 3.20 | 941,169 | - |
| AH | 49.94 m3 | 37.60 m3 | 1.02 m3 | 3.15 | 821,556 | 119,613 | ||
| LiDAR 2 upper position | BH | 49.24 m3 | 40.93 m3 | - | 3.30 | 1,073,330 | - | |
| AH | 45.78 m3 | 39.05 m3 | 1.87 m3 | 3.30 | 812,332 | 260,998 | ||
| 2 km/h (470 Hz) | LiDAR 1 lateral position | BH | 66.58 m3 | 58.01 m3 | - | 3.00 | 1,307,456 | - |
| AH | 62.68 m3 | 56.96 m3 | 1.05 m3 | 3.10 | 1,156,895 | 150,561 | ||
| LiDAR 2 upper position | BH | 61.17 m3 | 56.83 m3 | - | 3.10 | 984,536 | - | |
| AH | 57.22 m3 | 55.42 m3 | 1.41 m3 | 3.05 | 843,732 | 140,804 | ||
| ‘Manzanilla de Sevilla’ | ||||||||
| 3 km/h (470 Hz) | LiDAR 1 lateral position | BH | 57.52 m3 | 48.43 m3 | - | 3.20 | 969,025 | - |
| AH | 56.01 m3 | 46.78 m3 | 1.64 m3 | 3.10 | 738,178 | 230,847 | ||
| LiDAR 2 upper position | BH | 55.79 m3 | 48.19 m3 | - | 3.00 | 1,048,921 | - | |
| AH | 55.78 m3 | 47.08 m3 | 1.10 m3 | 3.00 | 875,640 | 173,281 | ||
| 2 km/h (470 Hz) | LiDAR 1 lateral position | BH | 67.16 m3 | 47.98 m3 | - | 3.50 | 1,090,924 | - |
| AH | 67.05 m3 | 47.39 m3 | 0.59 m3 | 3.50 | 984,563 | 106,361 | ||
| LiDAR 2 upper position | BH | 67.61 m3 | 45.09 m3 | - | 3.50 | 1,142,788 | - | |
| AH | 69.42 m3 | 44.87 m3 | 0.21 m3 | 3.50 | 1,089,874 | 52,914 | ||
| ‘Manzanilla Cacereña’ | ||||||
| Tree 1 | Tree 2 | Total | ||||
| Treatments | Max. Ac (g) | T (s) | Max. Ac (g) | T (s) | Mean Max. Ac (g) | Mean T (s) |
| 3 km/h-470 Hz | 7.07 | 3.25 | 6.62 | 3.13 | 6.85 | 3.19 |
| 2 km/h-470 Hz | 7.35 | 4.38 | 7.07 | 5.25 | 7.21 | 4.81 |
| 2 km/h-430 Hz | 5.46 | 4.12 | 4.71 | 4.00 | 5.08 | 4.06 |
| ‘Manzanilla de Sevilla’ | ||||||
| Tree 1 | Tree 2 | Total | ||||
| Treatments | Max. Ac (g) | T (s) | Max. Ac (g) | T (s) | Mean Max. Ac (g) | Mean T (s) |
| 3 km/h-470 Hz | 7.04 | 4.50 | 5.14 | 3.50 | 6.09 | 4.00 |
| 2 km/h-470 Hz | 7.40 | 4.68 | 8.24 | 5.37 | 7.82 | 5.25 |
| 2 km/h-430 Hz | 4.25 | 4.31 | 4.83 | 4.75 | 4.54 | 4.53 |
© 2018 by the authors. Licensee MDPI, Basel, Switzerland. This article is an open access article distributed under the terms and conditions of the Creative Commons Attribution (CC BY) license (http://creativecommons.org/licenses/by/4.0/).
Share and Cite
Pérez-Ruiz, M.; Rallo, P.; Jiménez, M.R.; Garrido-Izard, M.; Suárez, M.P.; Casanova, L.; Valero, C.; Martínez-Guanter, J.; Morales-Sillero, A. Evaluation of Over-The-Row Harvester Damage in a Super-High-Density Olive Orchard Using On-Board Sensing Techniques. Sensors 2018, 18, 1242. https://doi.org/10.3390/s18041242
Pérez-Ruiz M, Rallo P, Jiménez MR, Garrido-Izard M, Suárez MP, Casanova L, Valero C, Martínez-Guanter J, Morales-Sillero A. Evaluation of Over-The-Row Harvester Damage in a Super-High-Density Olive Orchard Using On-Board Sensing Techniques. Sensors. 2018; 18(4):1242. https://doi.org/10.3390/s18041242
Chicago/Turabian StylePérez-Ruiz, Manuel, Pilar Rallo, M. Rocío Jiménez, Miguel Garrido-Izard, M. Paz Suárez, Laura Casanova, Constantino Valero, Jorge Martínez-Guanter, and Ana Morales-Sillero. 2018. "Evaluation of Over-The-Row Harvester Damage in a Super-High-Density Olive Orchard Using On-Board Sensing Techniques" Sensors 18, no. 4: 1242. https://doi.org/10.3390/s18041242
APA StylePérez-Ruiz, M., Rallo, P., Jiménez, M. R., Garrido-Izard, M., Suárez, M. P., Casanova, L., Valero, C., Martínez-Guanter, J., & Morales-Sillero, A. (2018). Evaluation of Over-The-Row Harvester Damage in a Super-High-Density Olive Orchard Using On-Board Sensing Techniques. Sensors, 18(4), 1242. https://doi.org/10.3390/s18041242