Article

Polyacrylonitrile Nanofiber-Based Quartz Crystal Microbalance for Sensitive Detection of Safrole

1
Department of Physics, Universitas Gadjah Mada, Sekip Utara, Yogyakarta 55281, Indonesia
2
Department of Chemistry, Universitas Gadjah Mada, Sekip Utara, Yogyakarta 55281, Indonesia
3
Nanomaterial Research Group, Universitas Gadjah Mada, Sekip Utara, Yogyakarta 55281, Indonesia
4
Department of Biology, Universitas Gadjah Mada, Sekip Utara, Yogyakarta 55281, Indonesia
*
Authors to whom correspondence should be addressed.
Sensors 2018, 18(4), 1150; https://doi.org/10.3390/s18041150
Submission received: 6 March 2018 / Revised: 26 March 2018 / Accepted: 2 April 2018 / Published: 10 April 2018
(This article belongs to the Section Chemical Sensors)

Abstract

:
Safrole is the main precursor for producing the amphetamine-type stimulant (ATS) drug, N-methyl-3,4-methylenedioxyamphetamine (MDMA), also known as ecstasy. We devise a polyacrylonitrile (PAN) nanofiber-based quartz crystal microbalance (QCM) for detecting safrole. The PAN nanofibers were fabricated by direct electrospinning to modify the QCM chips. The PAN nanofiber on the QCM chips has a diameter of 240 ± 10 nm. The sensing of safrole by QCM modified with PAN nanofiber shows good reversibility and an apparent sensitivity of 4.6 Hz·L/mg. The proposed method is simple, inexpensive, and convenient for detecting safrole, and can be an alternative to conventional instrumental analytical methods for general volatile compounds.

Graphical Abstract

1. Introduction

According to the recent World Drug Report, the global abuse of amphetamine-type stimulus (ATS) drugs continues to increase. In particular, the abuse of N-methyl-3,4-methylenedioxyamphetamine (MDMA), well known as ecstasy, has been growing rapidly [1], despite its serious unhealthy side effects [2]. The drug is produced in Europe, Asia, North America, Oceania, and South America. Since 2010, the quantity of drugs seized globally has averaged around 4–5 tons. In Indonesia alone, the annual confiscated crystal meth has increased significantly from 0.1 to 1.3 tons in the last eight years [3]. Detecting and curbing the illegal trade remain a problem faced by law enforcement.
Precursors commonly used to produce amphetamine-like drugs include piperonal, safrole, and iso-safrole [3]. They are also used in the chemical and pharmaceutical industries, making them prone to black market trading. Safrole is a pale-yellow liquid precursor that has been smuggled throughout South Asia.
There are many conventional analytical methods for detecting drugs, which are mainly chromatographic-based, such as gas chromatography (GC), liquid chromatography (LC), and liquid chromatography coupled with mass spectrometry (LC-MS) [4,5]. Although these methods are very sensitive and selective, they are costly, not handy, and difficult to operate. Therefore, there is a need for a portable, easy-to-use, and cheap analytical instrument for drug detection.
In recent years, the development of gas sensors to detect volatile organic compounds (VOCs) in the atmosphere is rapidly growing. Many gas sensors have been developed based on sensing chip-analyte interactions such as photoelectric [6,7], resistive [8,9], optical [10], amperometric [11], and acoustic wave interactions [12]. Quartz crystal microbalance (QCM) is one example of acoustic wave sensor platform based on acoustic-electric effect and mass deposition. The QCM sensor offers accurate, real-time, and convenient detection of gases or vapors [12,13] and humidity [14]. Nanostructured materials have become one of the most studied materials for devices, especially those used for gas sensing [15,16,17]. These materials, including nanofibers, have a large specific surface area, high porosity, and interconnected porous structures [18,19,20], which are advantageous for preparing gas sensing devices. The gas sensor prepared by nanostructured materials has a better sensitivity [21,22,23] because of the increase in the specific surface area of the materials [22,23].
Several studies have been conducted to develop mobile, easy-to-use, and cheap analytical instruments for detecting safrole. Pinalli et al. developed an amphetamine precursor detection method using quinoxaline-bridge cavitands [24], whereby the detection was confirmed by GC-MS analyses. Hackner et al. reported an analytical instrument to detect amine-containing drugs with surface ionization detection method [25]. They attempt to demonstrate that illicit amine-containing drugs can be sensitively detected using flash evaporation directly into the air gap of a surface ionization detector, interfaced to gas chromatographic (GC).
In this study, we report on safrole sensing based on the QCM method using polyacrylonitrile (PAN) nanofibers produced directly on the sensing surface. This nanofiber is mechanically stable, water-insoluble, and hydrophobic. It is chemically unique since it has lone pair electrons, and its hydrophobicity is essential since QCM gas sensor is heavily interfered by water vapor. The lone pair electrons of PAN can better interact with the electron-deficient functional groups in the analytes by intermolecular bond.

2. Materials and Methods

2.1. Materials

Polyacrylonitrile with molecular weight of 150,000 g/mol was supplied by Sigma-Aldrich (St. Louis, MO, USA). Non-ionic surfactant Triton X-100 and N,N-dimethyl formamide (DMF) were purchased from Merck (Darmstadt, Germany). Safrole with 96% purity, which was used as the main analyte, was supplied by the Indonesian National Police Jakarta. Other chemicals including ammonia, formaldehyde, acetone, and toluene were purchased from Merck, Germany. The AT-Cut QCM sensors with the gold electrode and 10 MHz base resonant frequency were purchased from OpenQCM, Novaetech. R&D, Napoli, Italy. All chemicals were used as received without further purification.

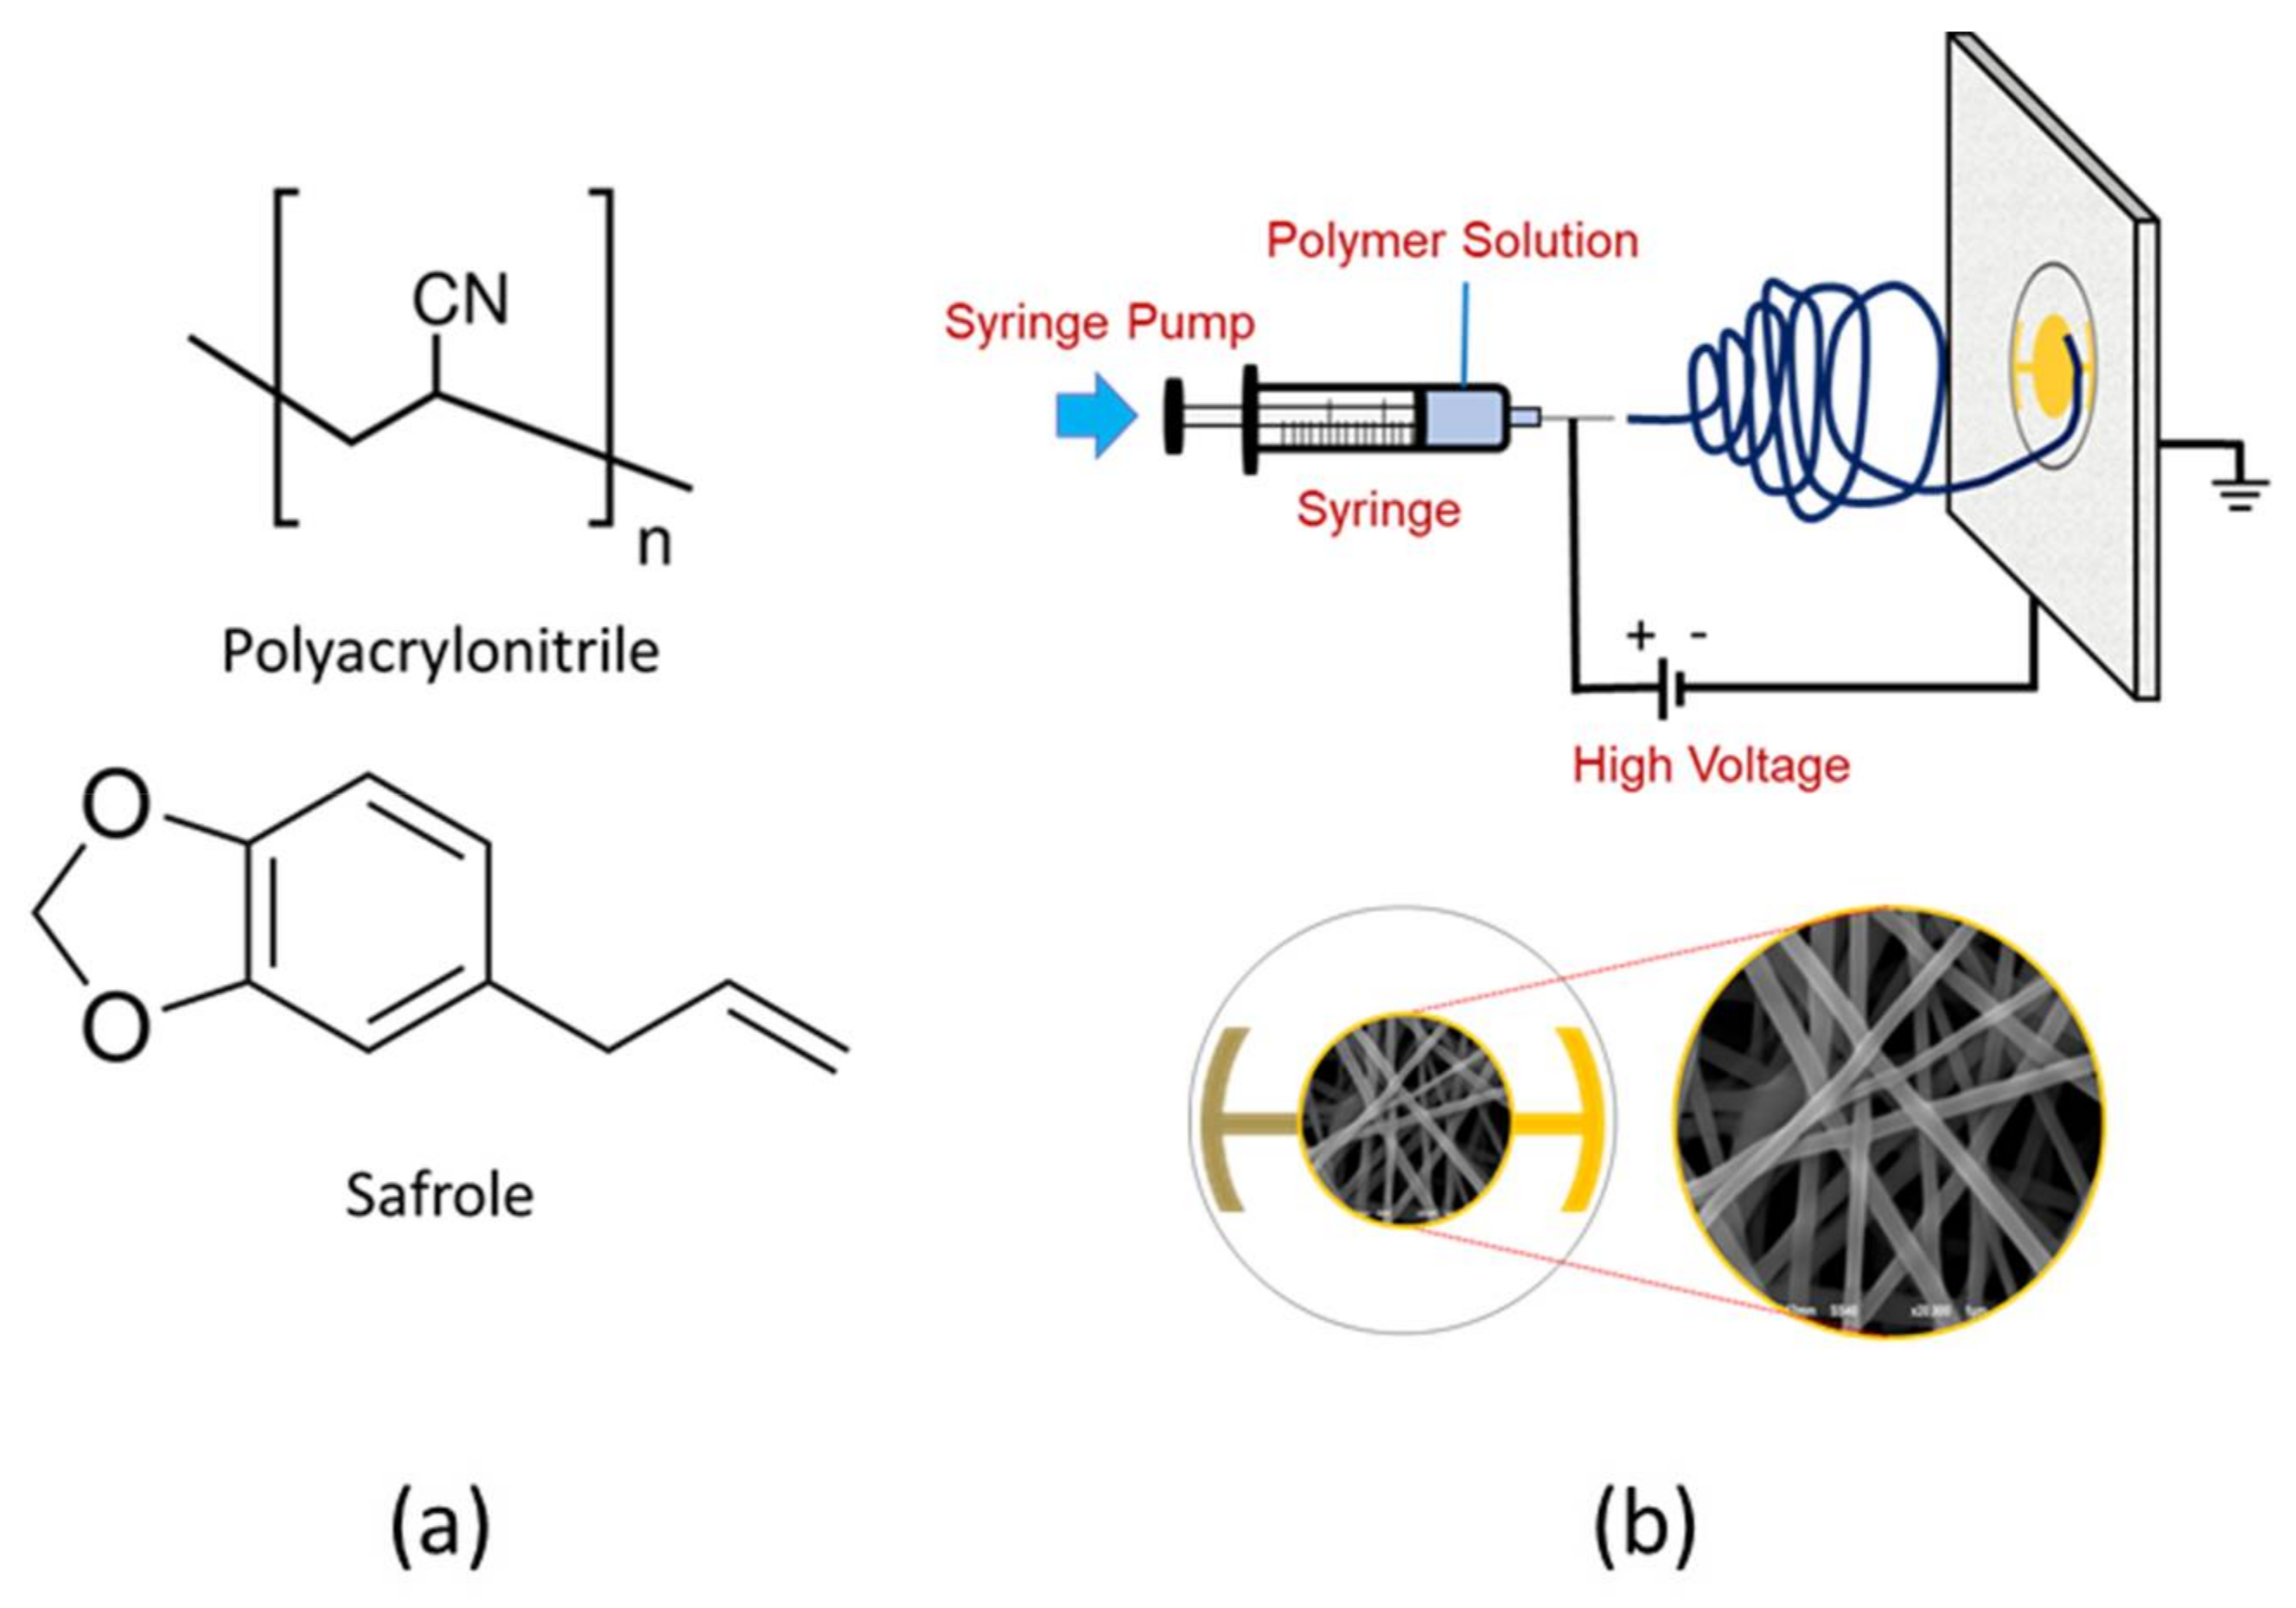
2.2. Nanofiber Preparations

Polyacrylonitrile solution was prepared by dissolving 0.60 g PAN in the 10 mL DMF, followed by stirring at 1000 rpm for 24 h. A small amount (1%) of non-ionic surfactant, Triton X-100, was added to the PAN solution to lower its surface tension. Mechanical stirring at 900 rpm was extended for 30 min to obtain a homogeneous solution in the presence of a surfactant. The schematic of the electrospinning set-up and chemical structure of PAN and safrole are shown in Figure 1.
The PAN solution was transferred into 10 mL plastic syringes for electrospinning, which was performed at a DC voltage of 10 kV with a predetermined 15 cm distance between the tip and collector. The QCM gold plate was used as fiber collector where the outer area was coated with aluminum foil. The electrospinning time was varied from 10 to 40 s. The nanofiber film was dried in a desiccator for 12 h to evaporate any residual solvent before further treatment.

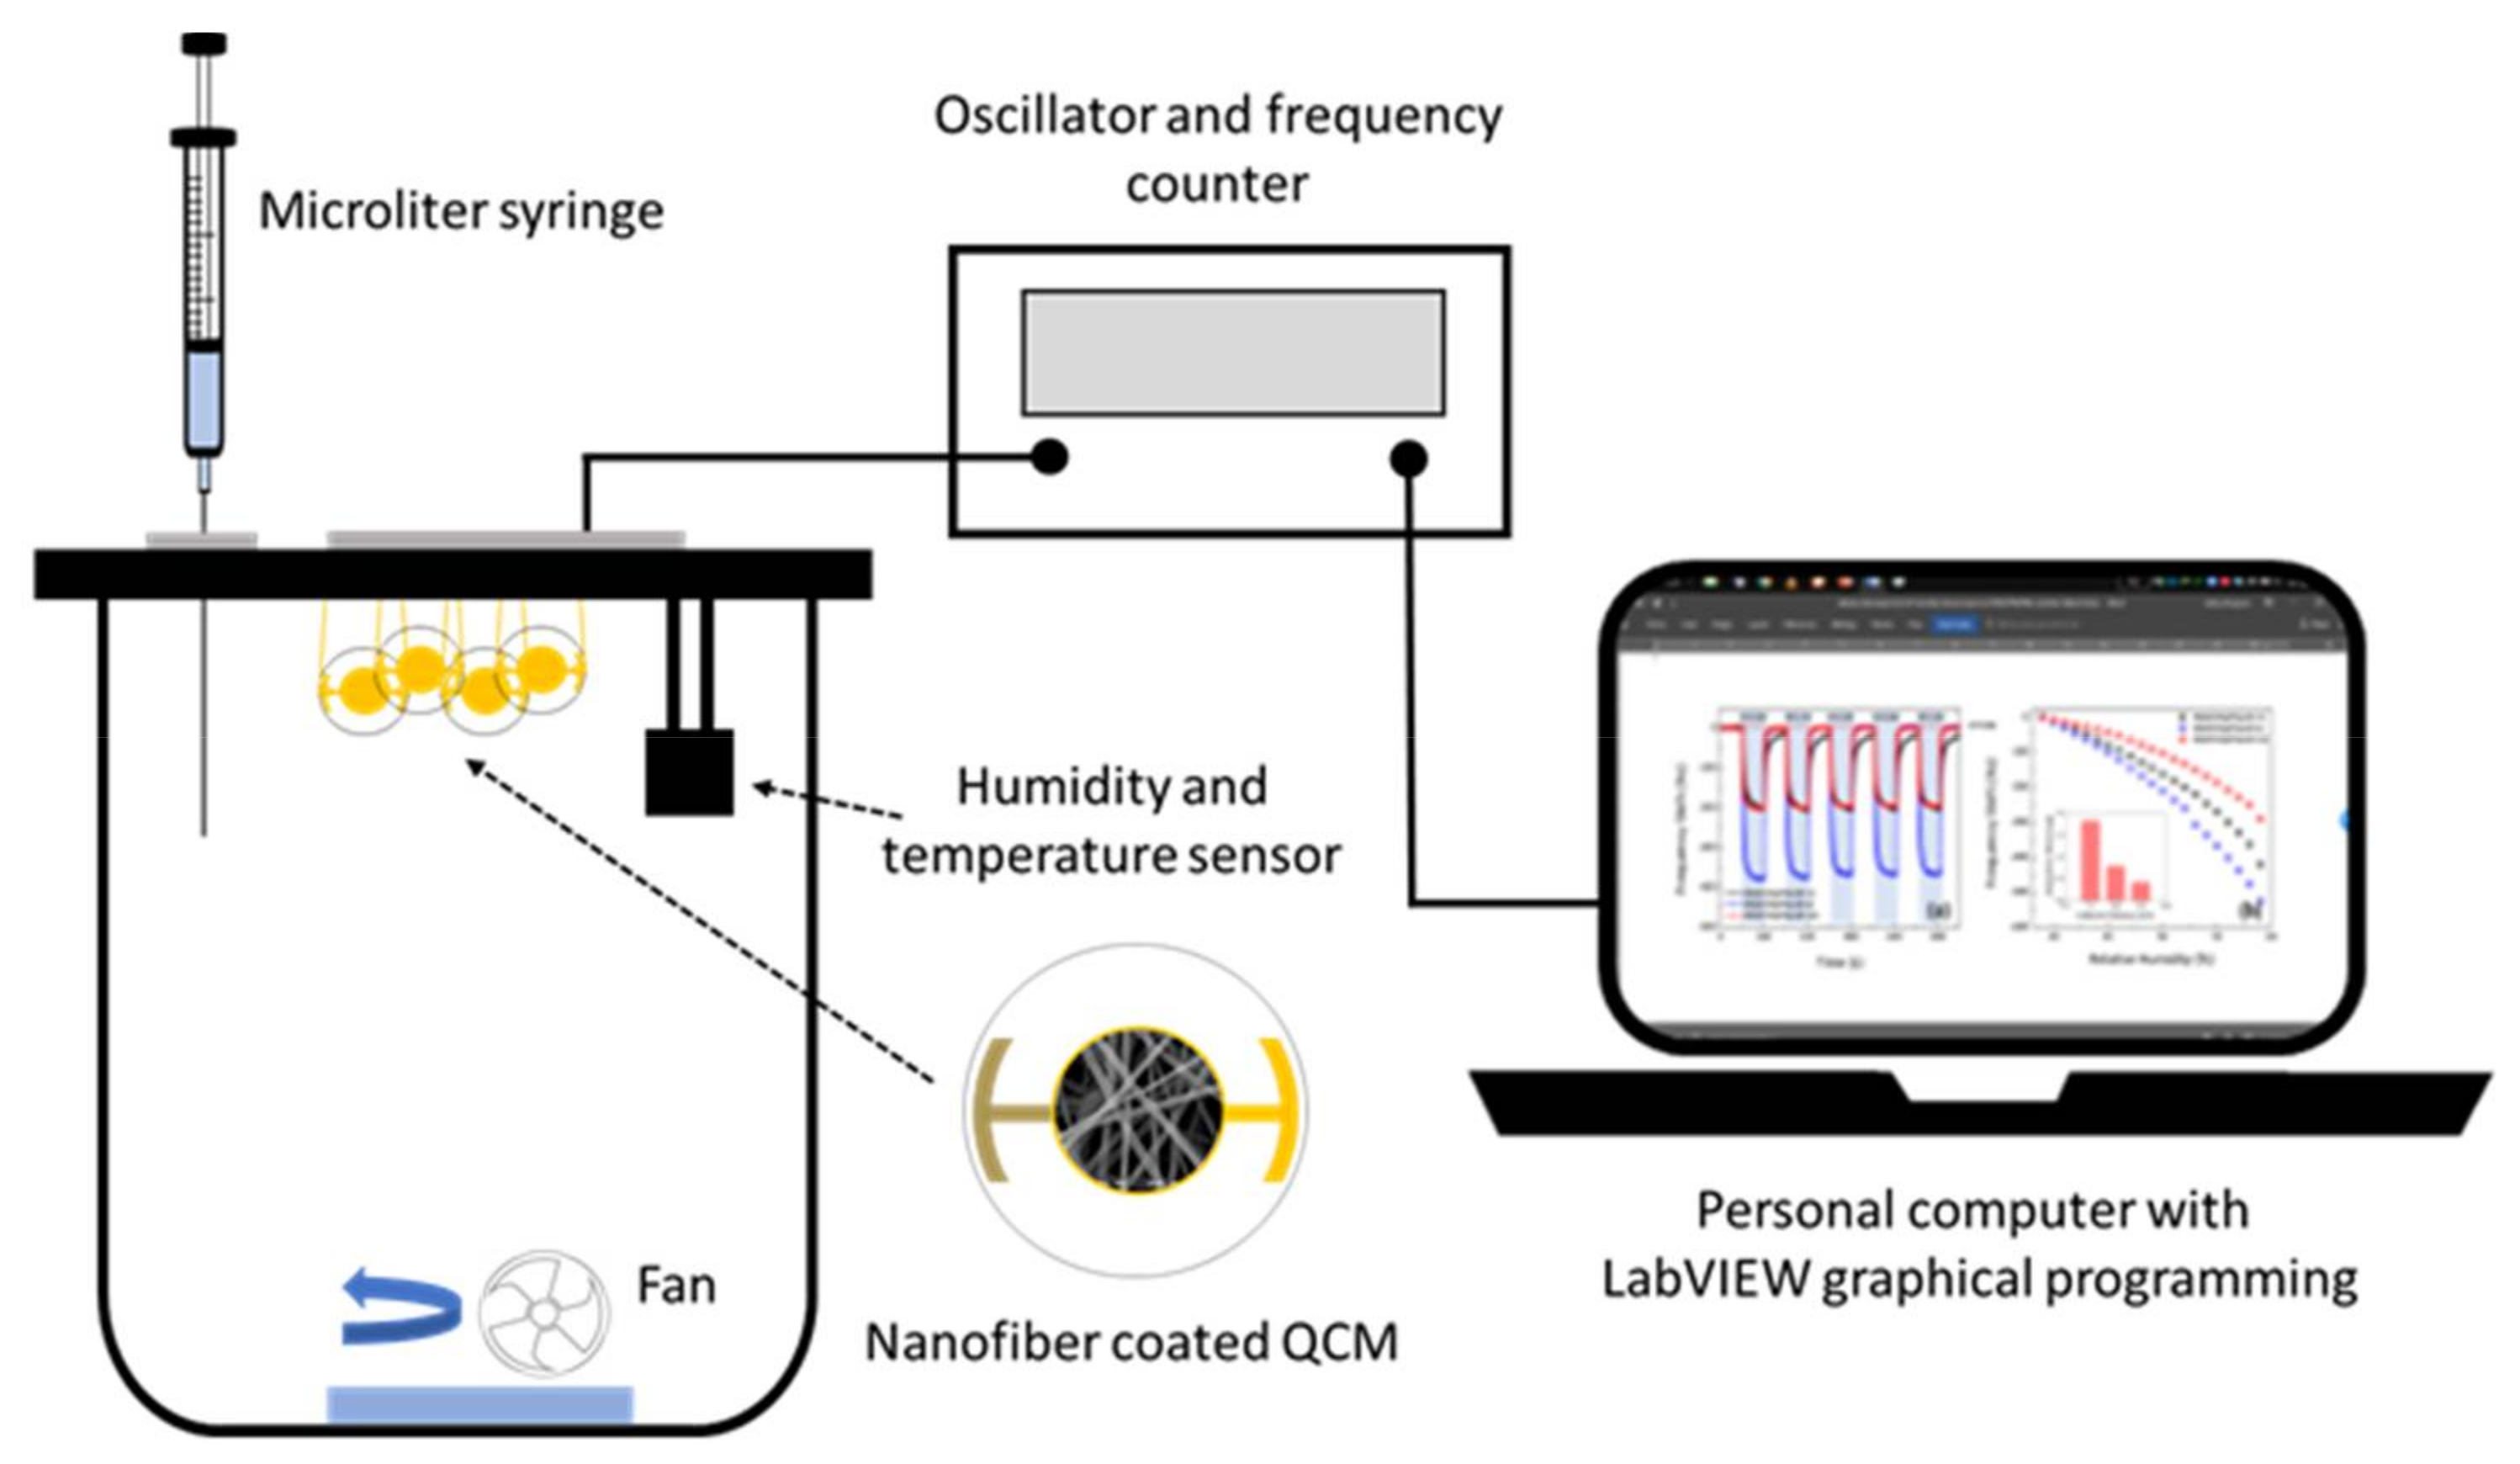
2.3. Sensor Apparatus for Safrole Detection

A schematic diagram of a static-type safrole vapor testing system is shown in Figure 2. The PAN nanofiber-based QCM sensor was installed in the testing chamber (1.25 L), which was kept at ambient temperature. The temperature and the relative humidity of the sensing chamber were controlled at (33 ± 1) °C and 55–65% RH, respectively. Sensirion SHT-31 was used as temperature and relative humidity sensors. A microliter syringe (1–10 µL, Hamilton Model 701 RN SYR) was used to inject the analyte. The frequency counter of the QCM sensor was used to measure the resonance frequency, whereby the frequency changes based on the mass shift of the sensor. The measured data were recorded by a personal computer with graphical programing language LabVIEW. The ambient air was used to desorb the analyte from the sensing membranes. The concentration of injected safrole in the vapor chamber was calculated in mg/L using its density, percent purity, and volume.

2.4. Sample Characterization

The nanofiber microstructure was analyzed by JEOL JSM–6510 scanning electron microscope (SEM). The samples were mounted on metal stubs and sputter-coated with platinum for 120 s with JEOL JEC−3000FC auto fine coater.

3. Results and Discussion

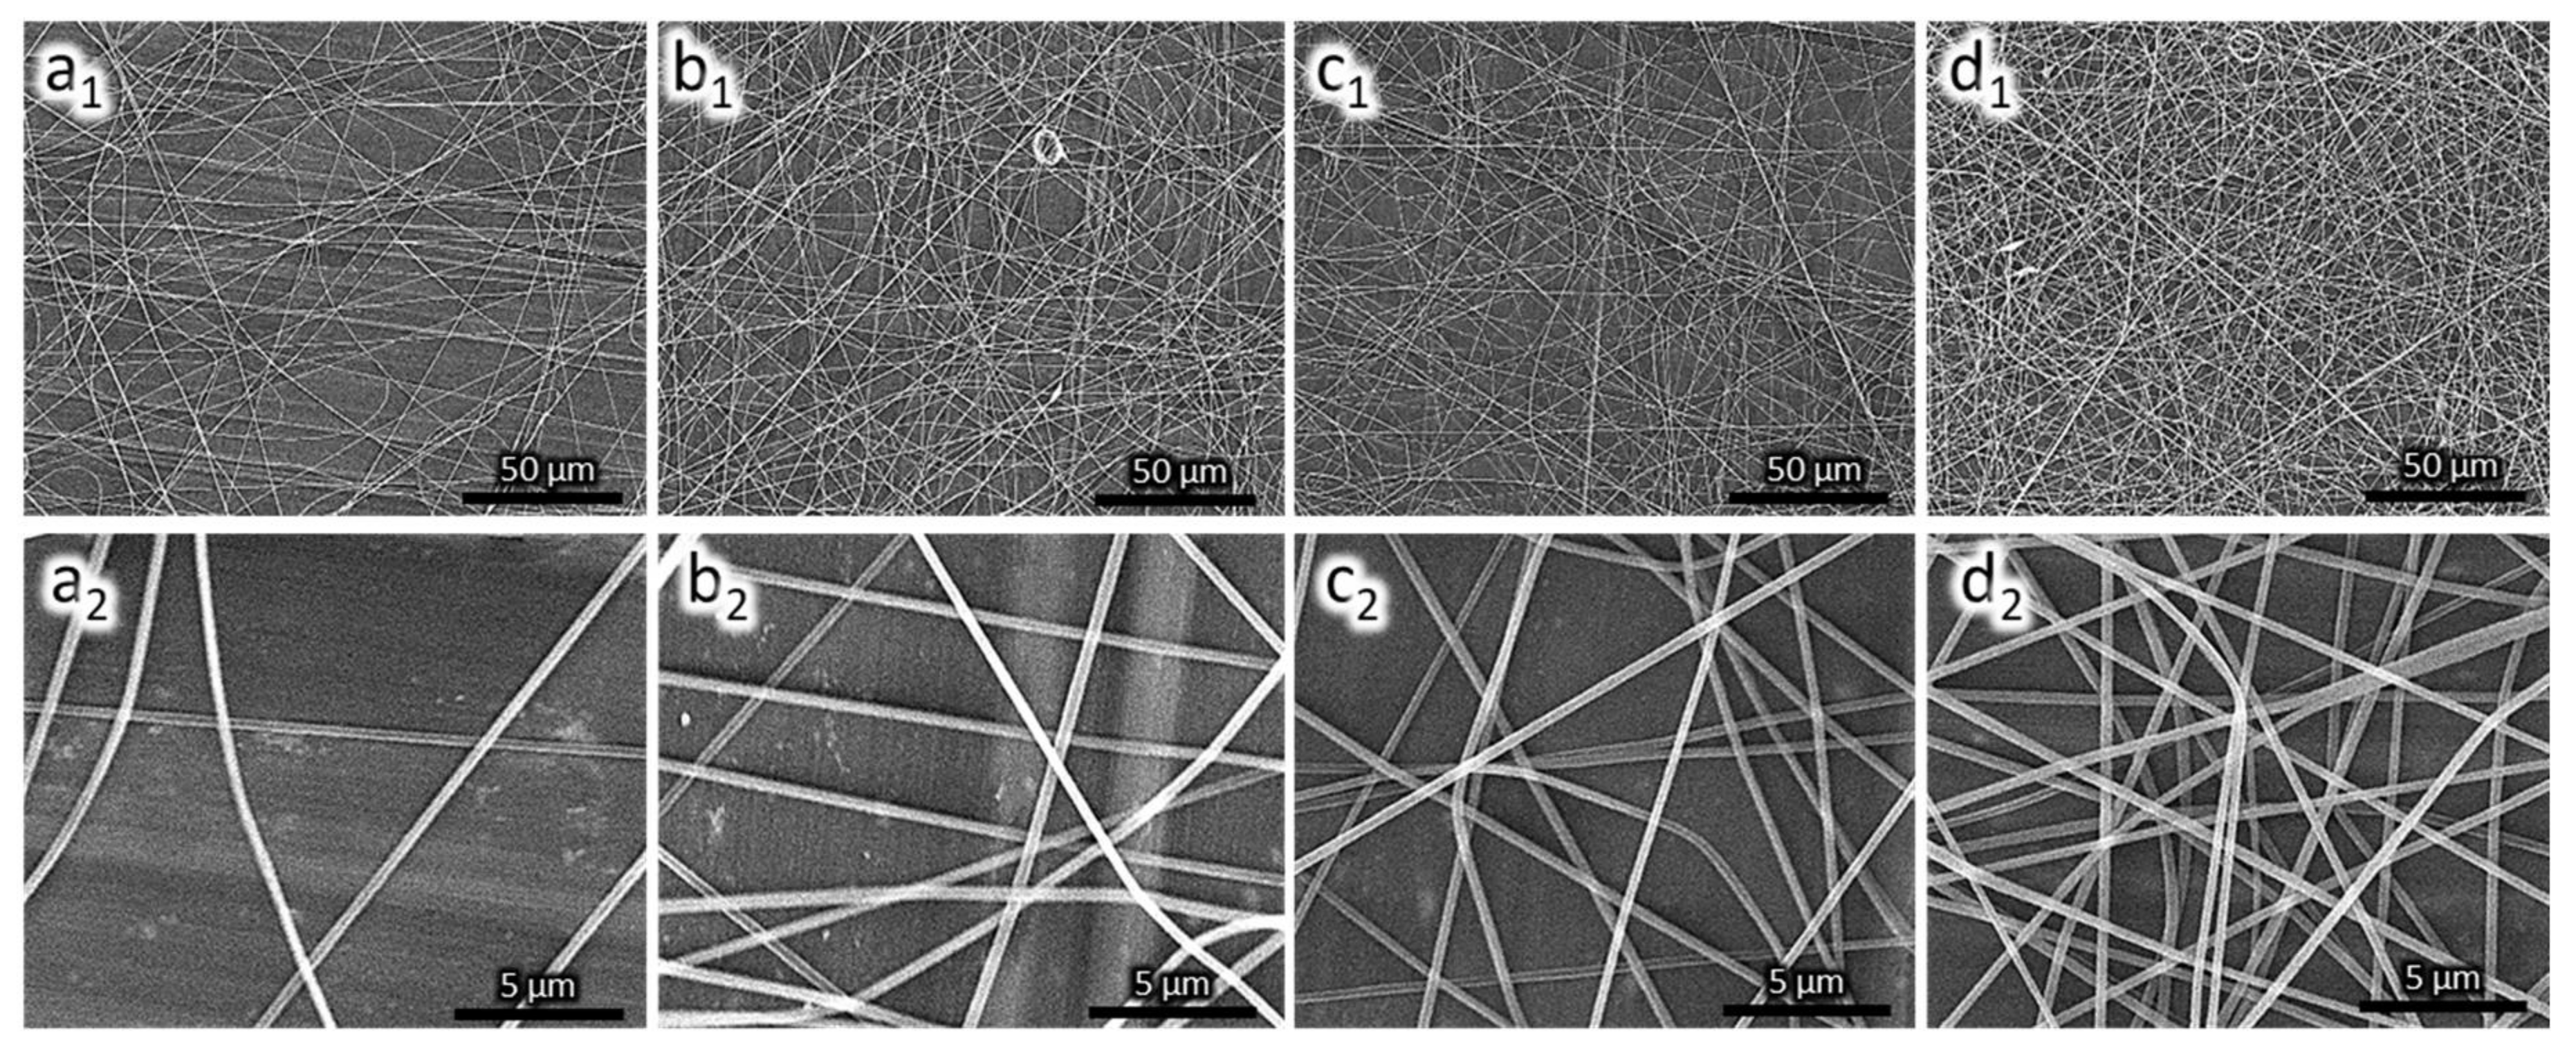
3.1. Nanofiber Morphology

Figure 3 shows the PAN nanofiber microscopic image at different magnifications. The nanofibers are smooth and continuous with an average diameter of (242 ± 10) nm. The deposition time affects the quantity of nanofiber deposited on the QCM substrate. The deposition rate remained constant. For a long deposition time, more nanofibers are deposited on the surface as indicated by an increase in frequency drop. The mass loading on the QCM substrate follows Sauerbrey equation [26] as shown in Equation (1).
Δ f = 2 f 0 2 A ρ q μ q   Δ m
where Δ f represents the frequency shift of crystal QCM (Hz), f 0 is the base resonance frequency (10 MHz), Δ m is the mass change (g), A is the electrode surface area (0.283 cm2), and μ q and ρ q are the shear modulus and density of quartz crystal (2.947 × 10¹¹ g cm−1 s−2) and (2.648 g cm−3), respectively.
The mass of PAN nanofibers deposited on the QCM chip is shown in Table 1. The mass loadings of PAN nanofiber were calculated using Equation (1) as 0.174, 0.578, 1.041 and 1.734 µg, for deposition times of 10, 20, 30 and 40 s, respectively. For convenience, we assigned the trials as indicated. The increase of mass loading is linearly dependent on the increase of deposition time. The mass loading on the active layer, for rigid film, affects gas sensor response [27].
The frequency response of the fabricated sensor is shown in Figure 4. The response time is about 8–10 min. As the mass deposition increases, the frequency shift gets higher, allowing an assumption that the surface area of the PAN nanofiber sensor increases with increase in the PAN nanofiber loading mass as stated in literature [23]; hence, the surface area becomes the vital parameter in developing a gas sensor based on QCM technique. However, the mass loading affects the maximum electrode contact area fully covered by the nanofiber, as it limits the response of the sensor.

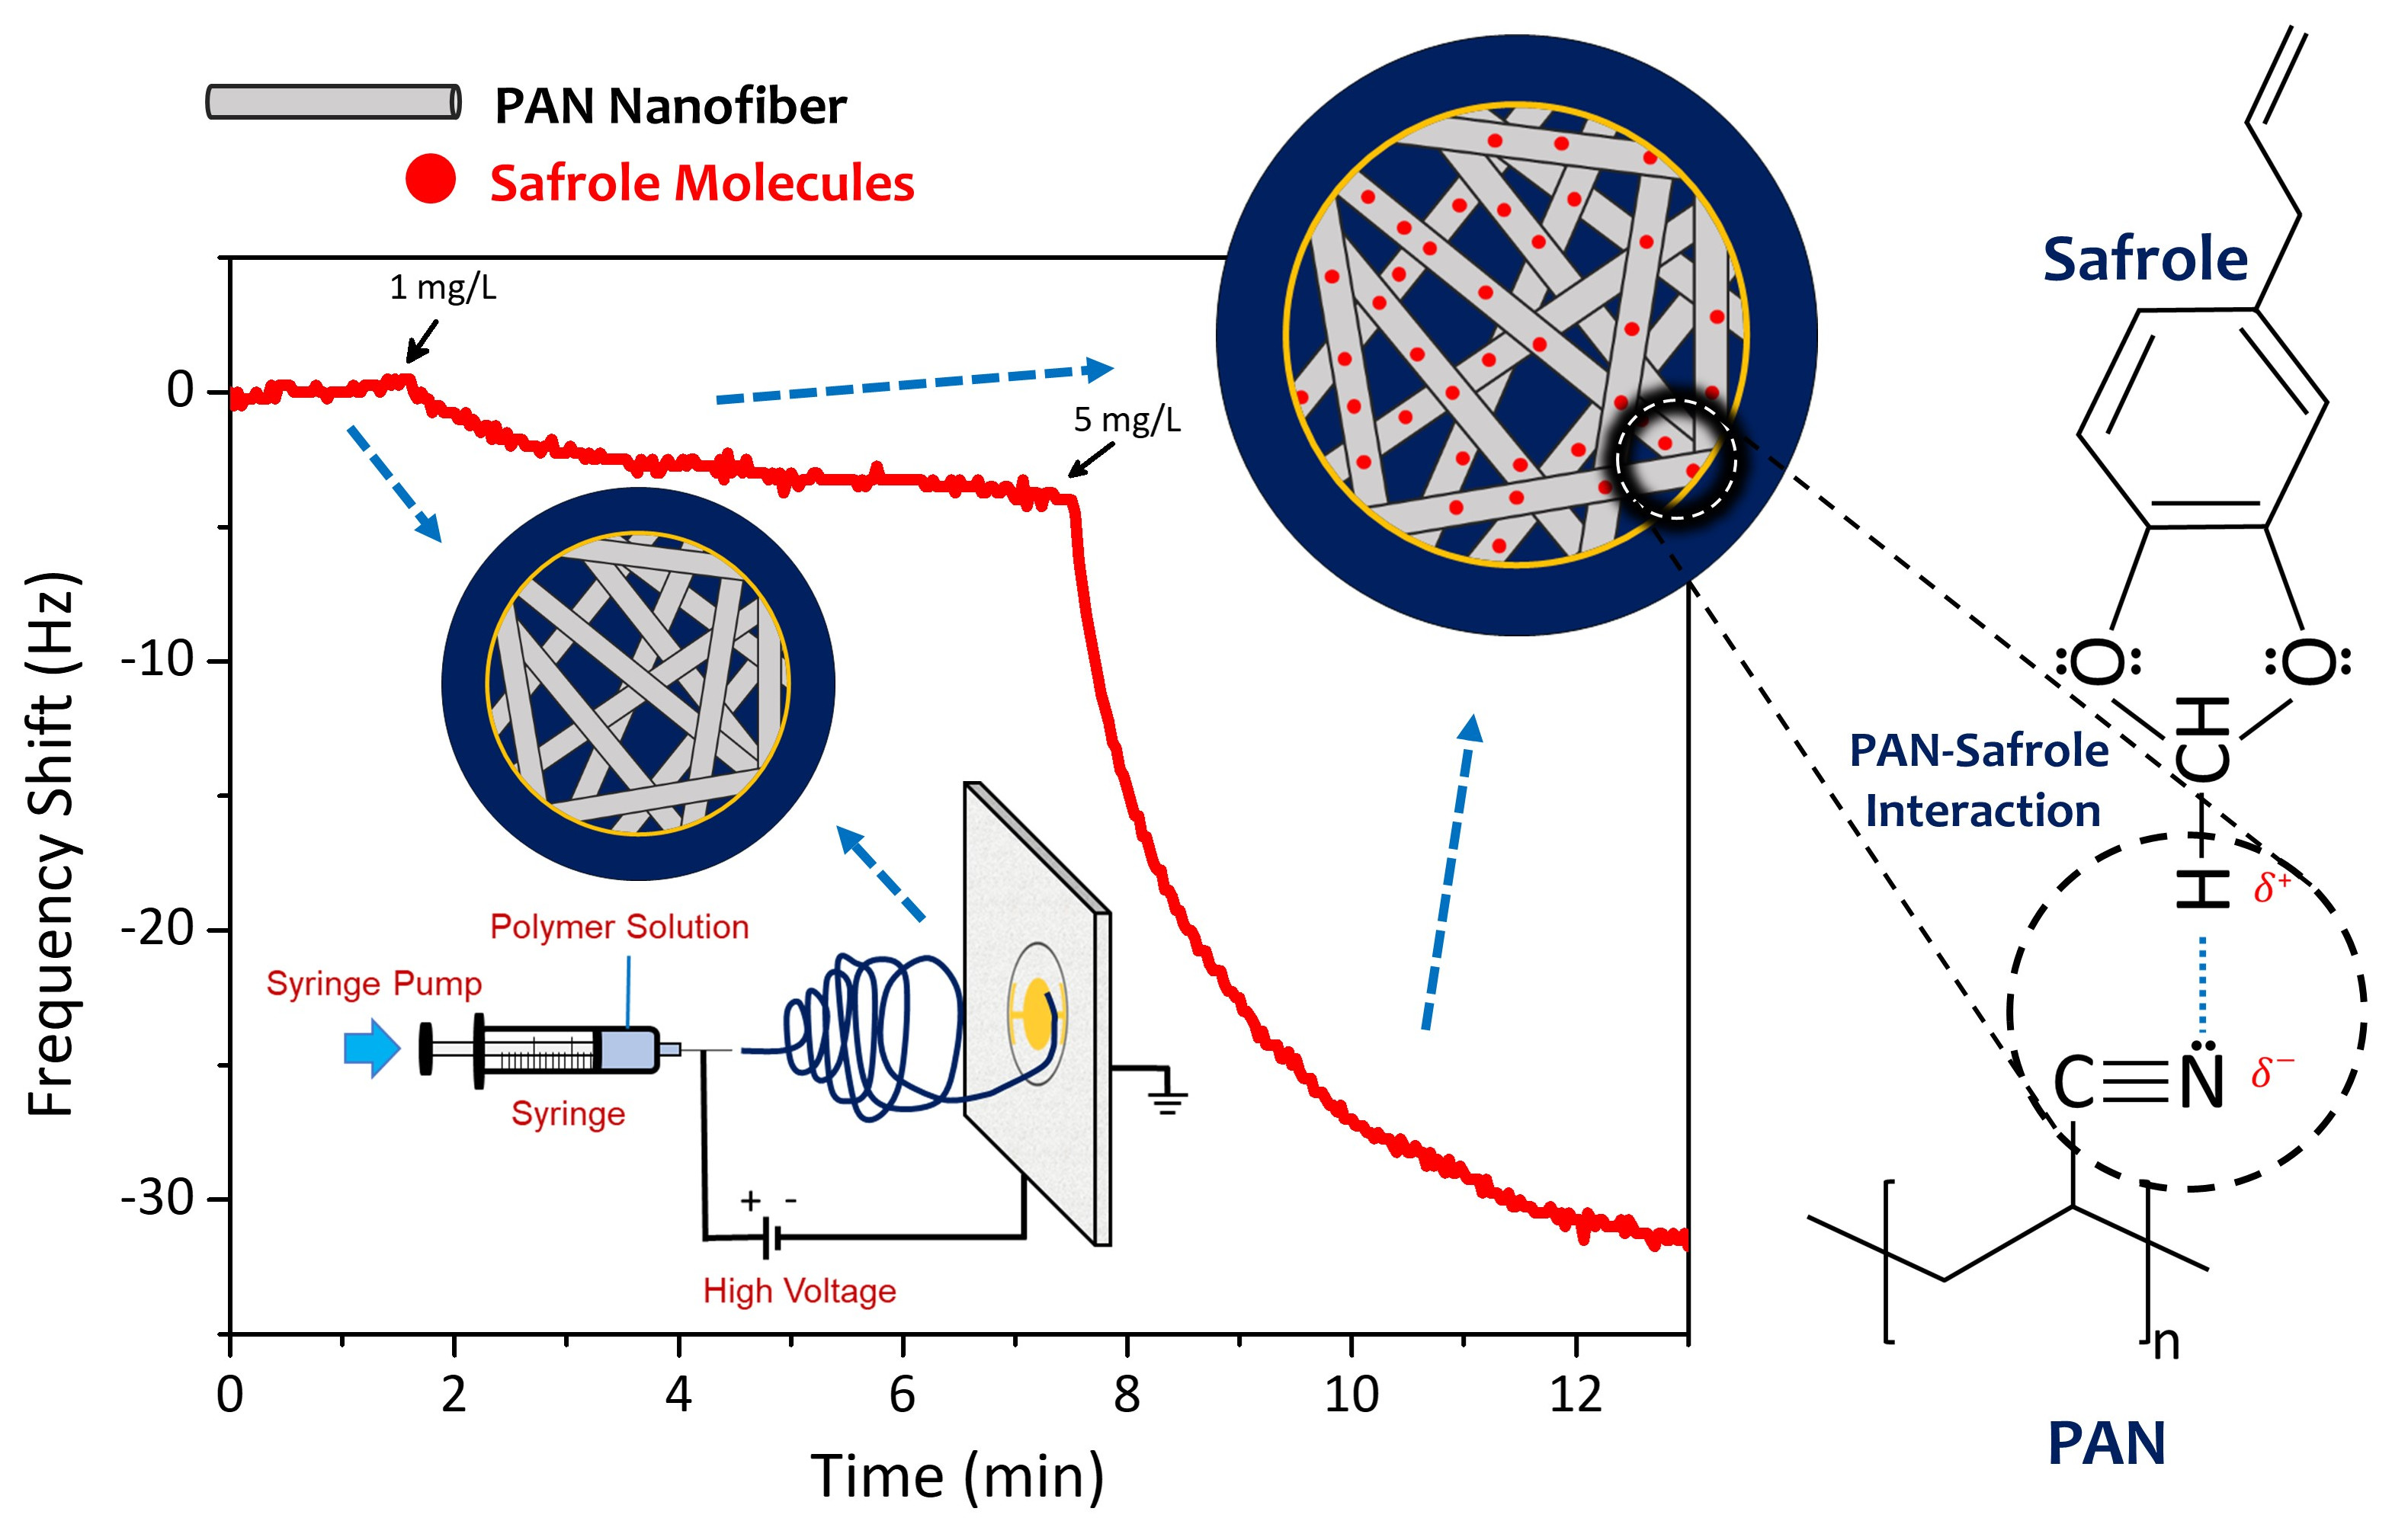
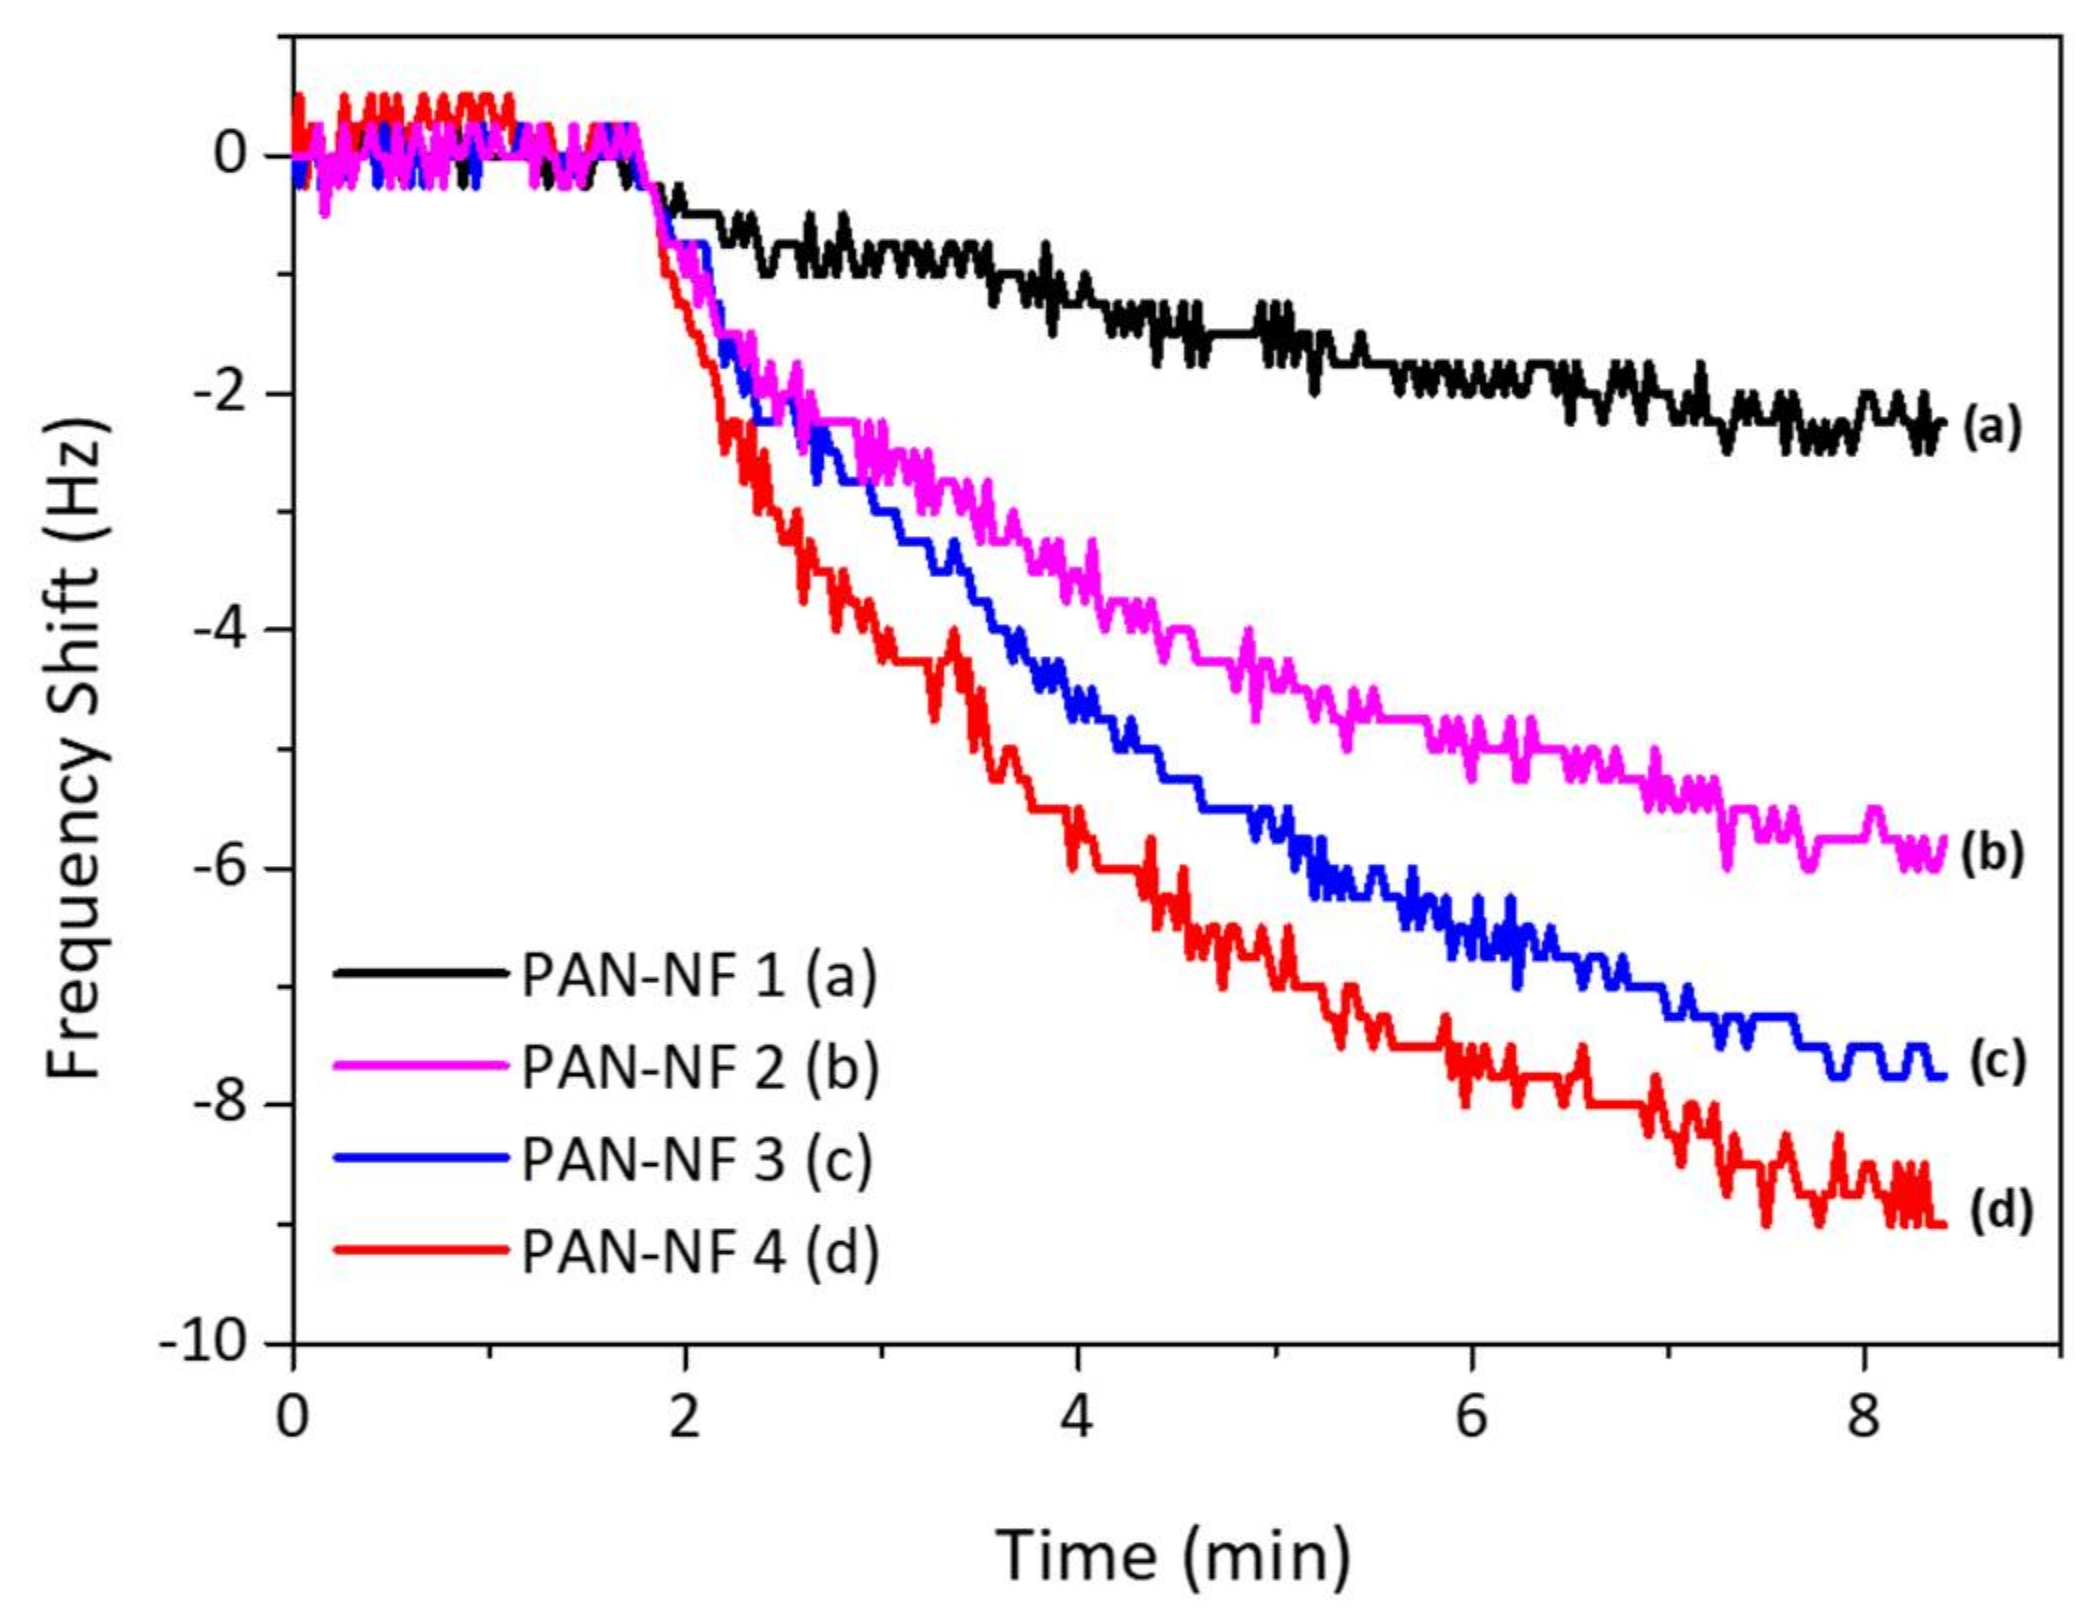
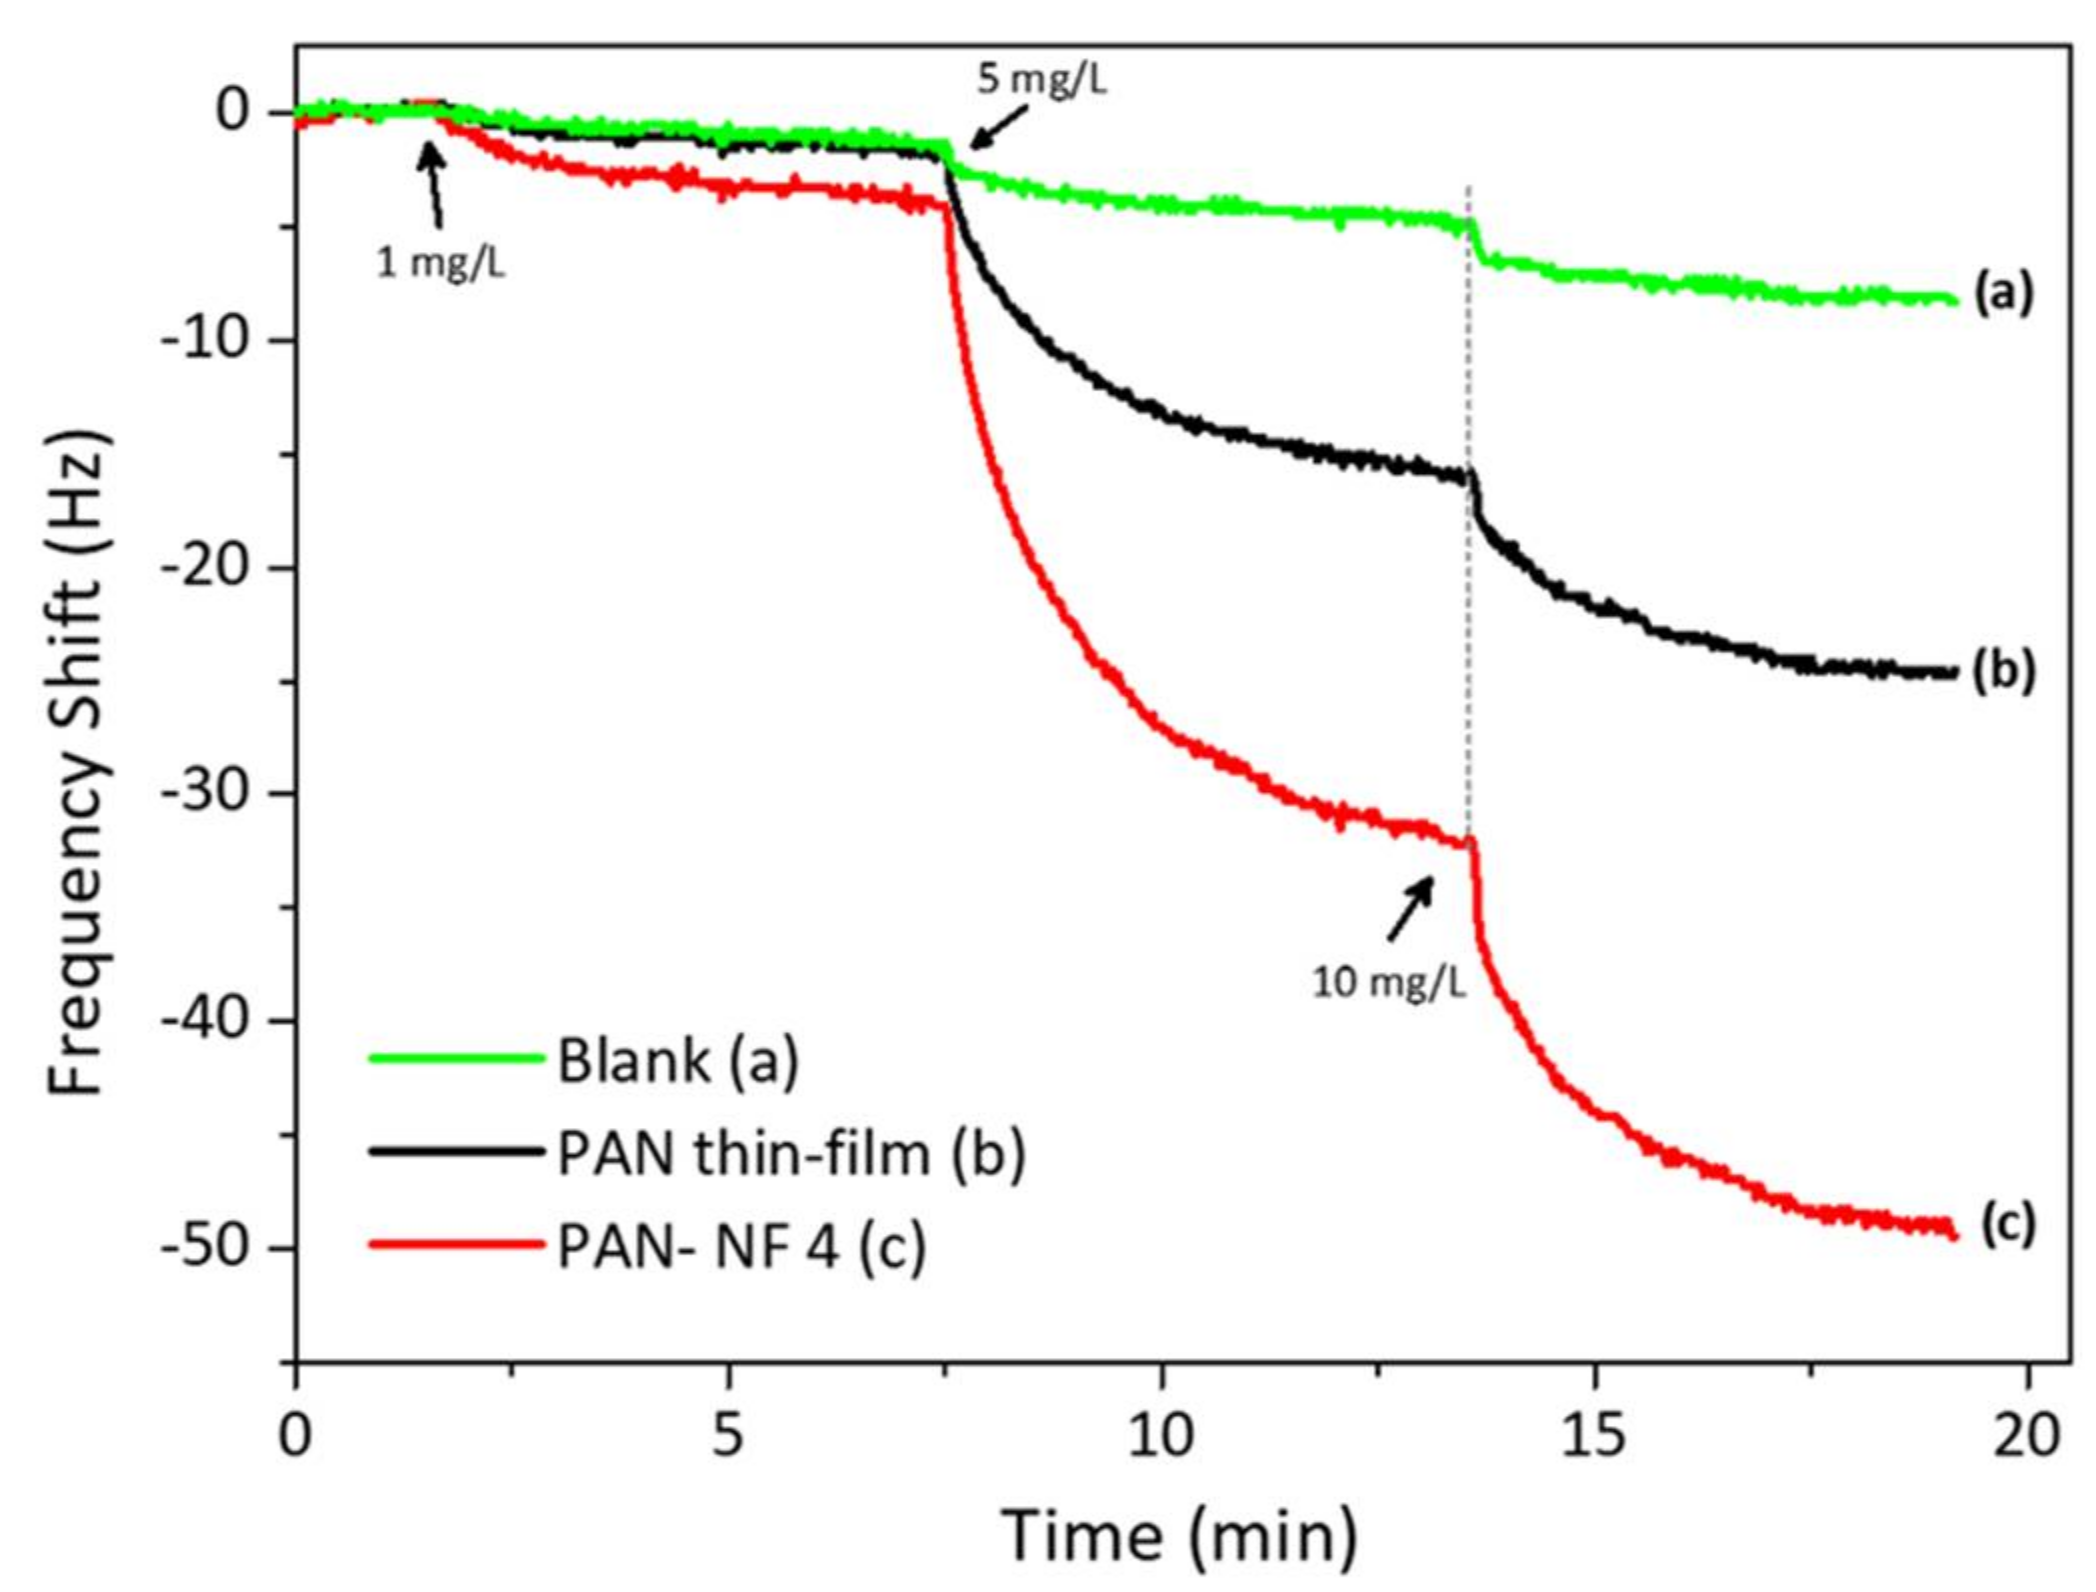
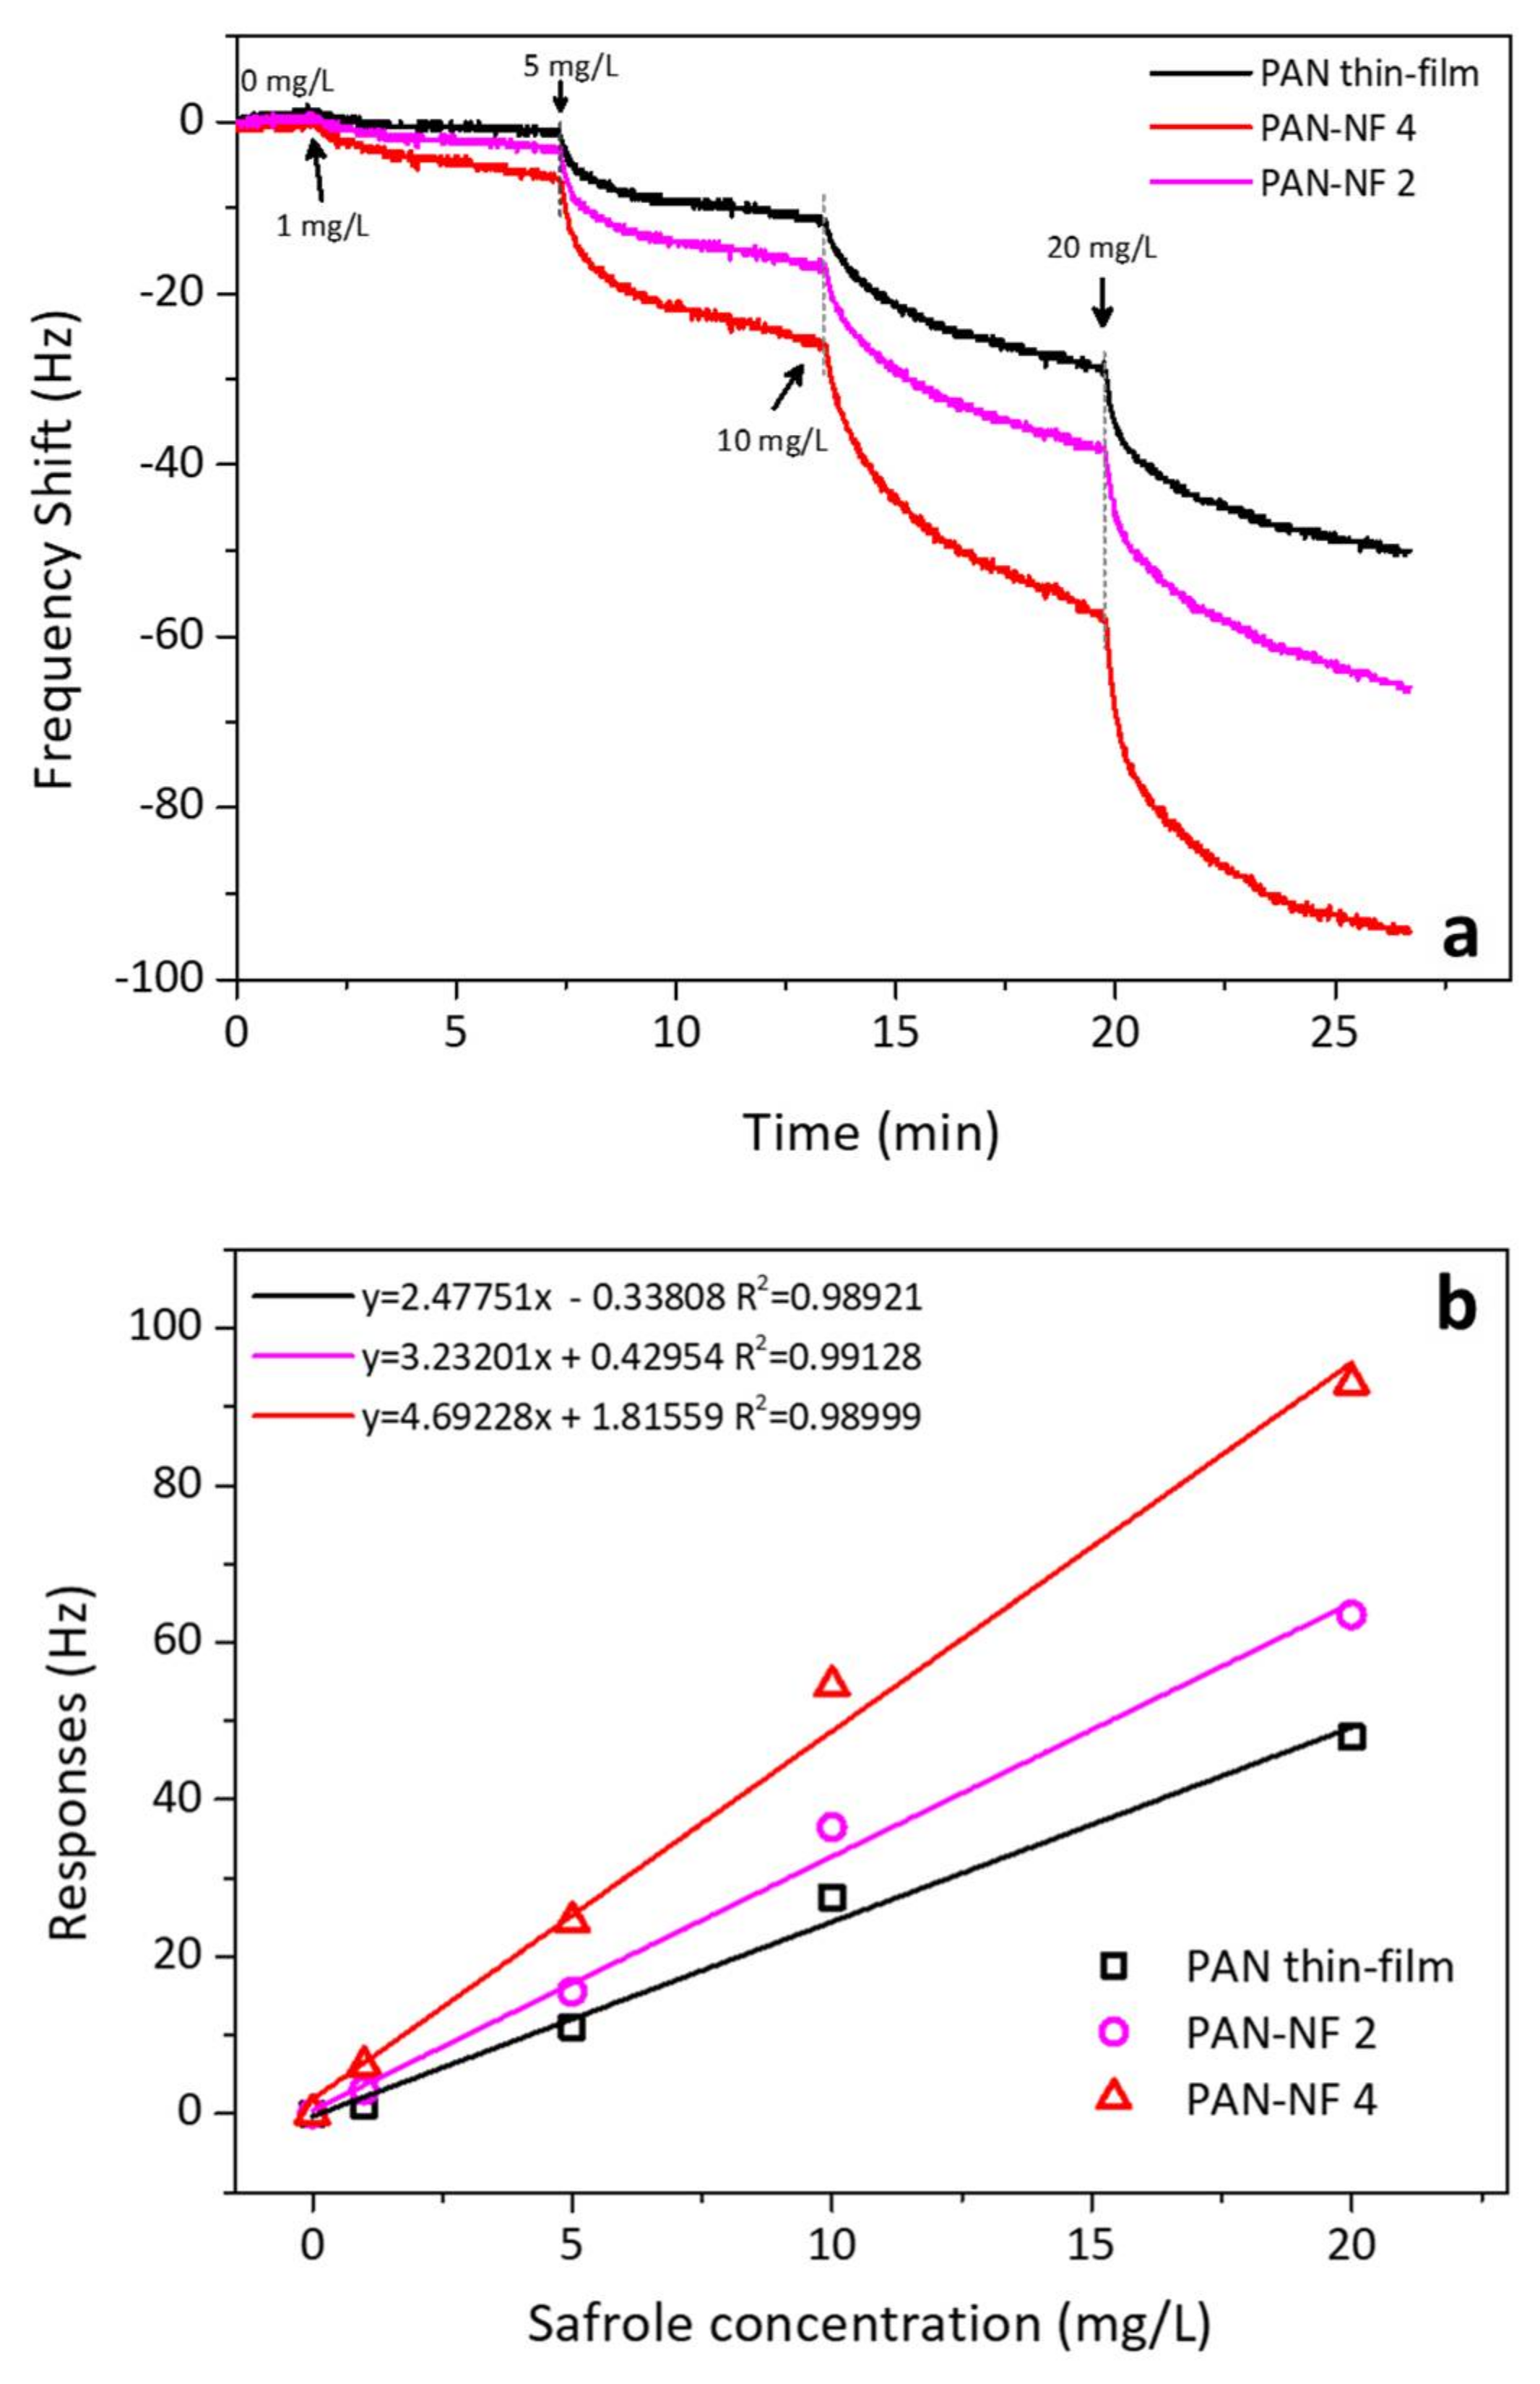
3.2. PAN Nanofiber Gas Sensor Response and Sensitivity

Figure 4 shows the response of QCM to 1 mg/L of safrole vapor, where the PAN nanofibers are prepared at different times of electrospinning. The measurement was carried out at ambient temperature and humidity of ~60% RH. The frequency shift increases with PAN nanofiber loading, and the surface area of the nanofibers increases with mass loading of the PAN, which would improve the contact area between the active layer and analytes. The porous nature of the nanofibers interacts with safrole molecule.
The data also show that the response time is quite slow, as response starts to steady after 7 min. This relatively slow response is probably due to the low vapor pressure of the safrole (0.0706 mm Hg at 25 °C), which makes it difficult to evaporate at room temperature but good enough to be detected with the sensing system.
To ascertain the effect of surface area on the response size, we also coated the QCM substrate with PAN by spin-coating for 30 s at 1000 rpm. The data are depicted in Figure 5. The QCM coated by spin-coating resulted in a mass of 2.2 µg, which is higher than that coated by electrospinning. For reference, uncoated QCM gave a small response to the analyte. On the other hand, the QCM coated with PAN nanofibers via electrospinning interacted strongly with safrole vapor, with a frequency shift of 5 Hz for each 1 mg/L safrole vapor. It produced a mass shift two-fold larger than that produced by the spin-coated QCM. Thus, it is evident that QCM modified with PAN nanofibers via electrospinning has better sensitivity than that modified by spin-coating.
Figure 6a shows the frequency responses for QCM when modified with spin-coating and electrospinning. The concentration of the safrole vapor was predetermined from 1 to 20 mg/L. Upon safrole injection into the sensing chamber, the response was sharp and steady after several minutes. The QCM sensor coated with PAN-NF 4 can detect safrole of 1, 5, 10 and 20 mg/L, corresponding to a frequency shift of 8, 26, 55 and 95 Hz, respectively. At low analyte concentration, we observed that the response of the PAN nanofiber sensor gradually increased with the safrole vapor concentration. However, the high concentration of safrole vapor resulted in less response, which is due to saturation of the polymer surface covered by the analyte.
Figure 6b shows the sensitivity of the QCM to the analyte. The slope increases with the film thickness. The sensitivity shifts from 2.5 to 3.2 and 4.7 Hz·L/mg for the spin-coating films PAN-NF 2 and PAN-NF 4, respectively, while the literature sensitivity was found about 5 L/mg [28]. The correlation constant (χ2) of the analyte concentration and the response is 0.98921 or higher, which is good. The sensitivity of the QCM modified with PAN nanofiber improves with increase in electrospinning time. The increase in the response is believed to be due to improved surface area of the nanofiber, which can be attributed to the high porosity of PAN nanofibers. The specific surface area of nanofiber membranes can improve when the diameters of polymer nanofibers are small [23]. The simulated sample was also analyzed by gas chromatography–mass spectrometry, which had safrole content of 96% to give estimated bias of 4–5%.

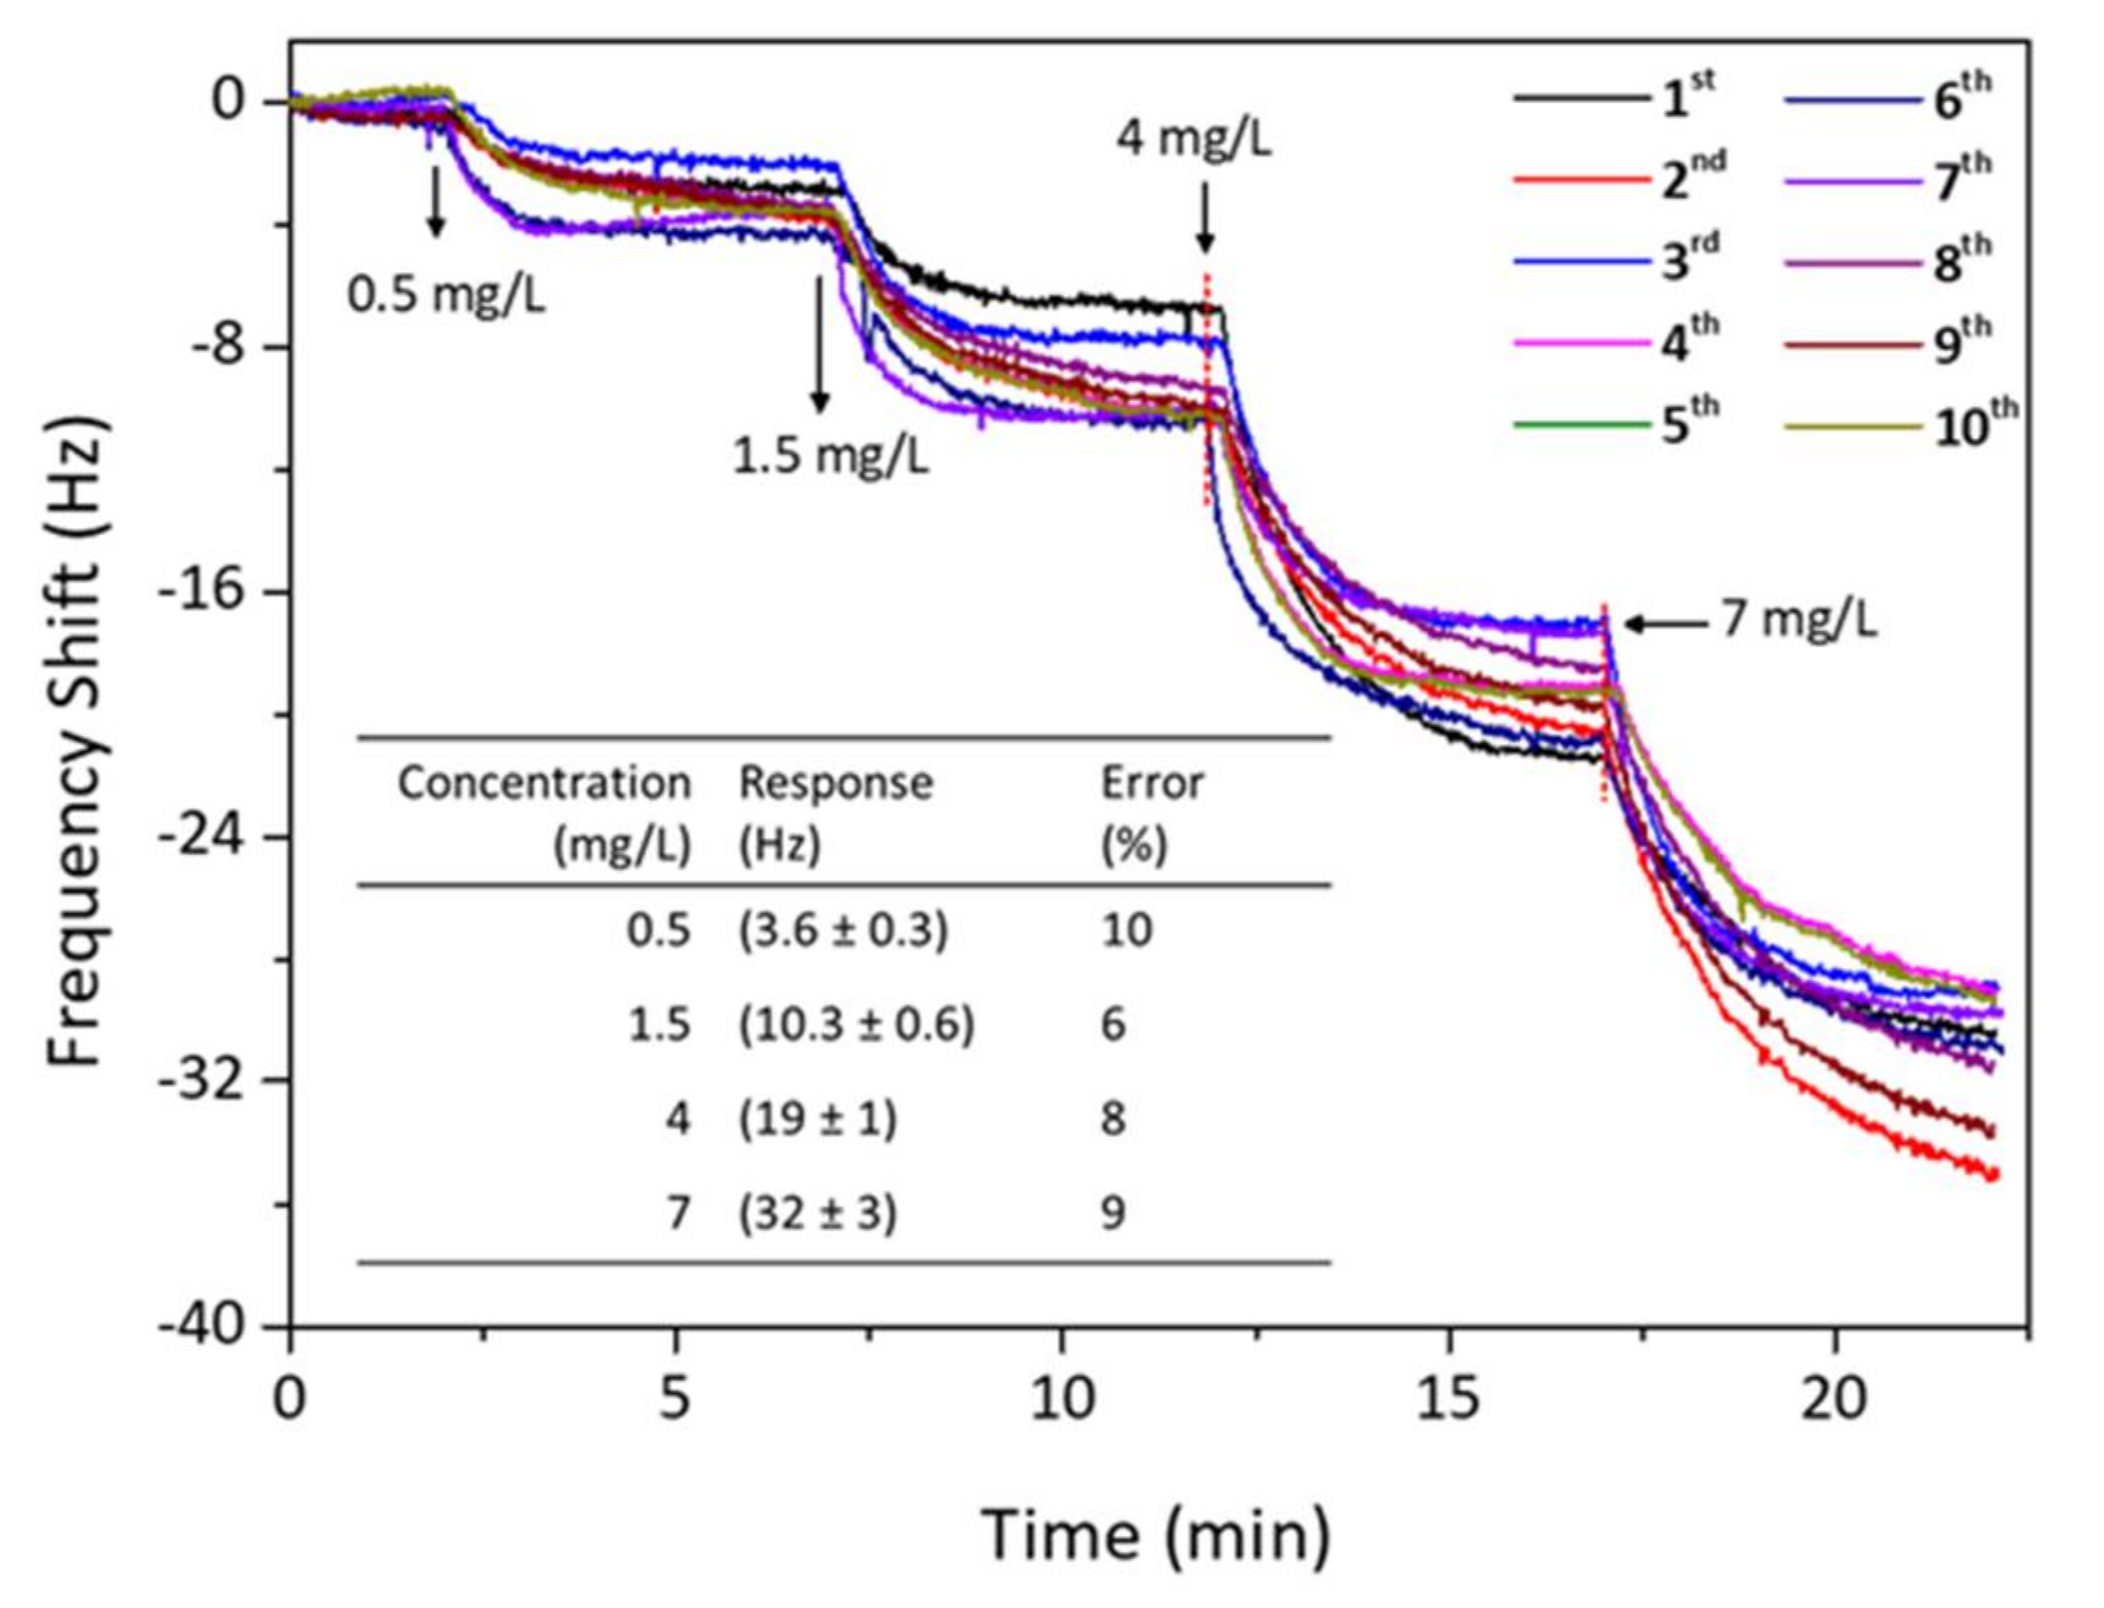
3.3. Reversibility of PAN Nanofiber QCM Sensor

Figure 7 shows the reversibility trial for the QCM sensor of PAN-NF 4 to detect safrole vapor. When the response of the sensor chip reached equilibrium, fresh and dry ambient air was introduced to the detection chamber to flush absorbed safrole until desorption was complete. The sensor was again exposed to the safrole vapor with the same concentration as before. It shows that adsorption–desorption cycles are reproducible after re-exposure to the analyte. The frequency change returns to its original value after purging the sensor chip with dry and fresh air. The sensing response was nearly repeatable and reproducible after ten consecutive sample injections, indicating that the proposed QCM method is reversible in detecting safrole vapor.

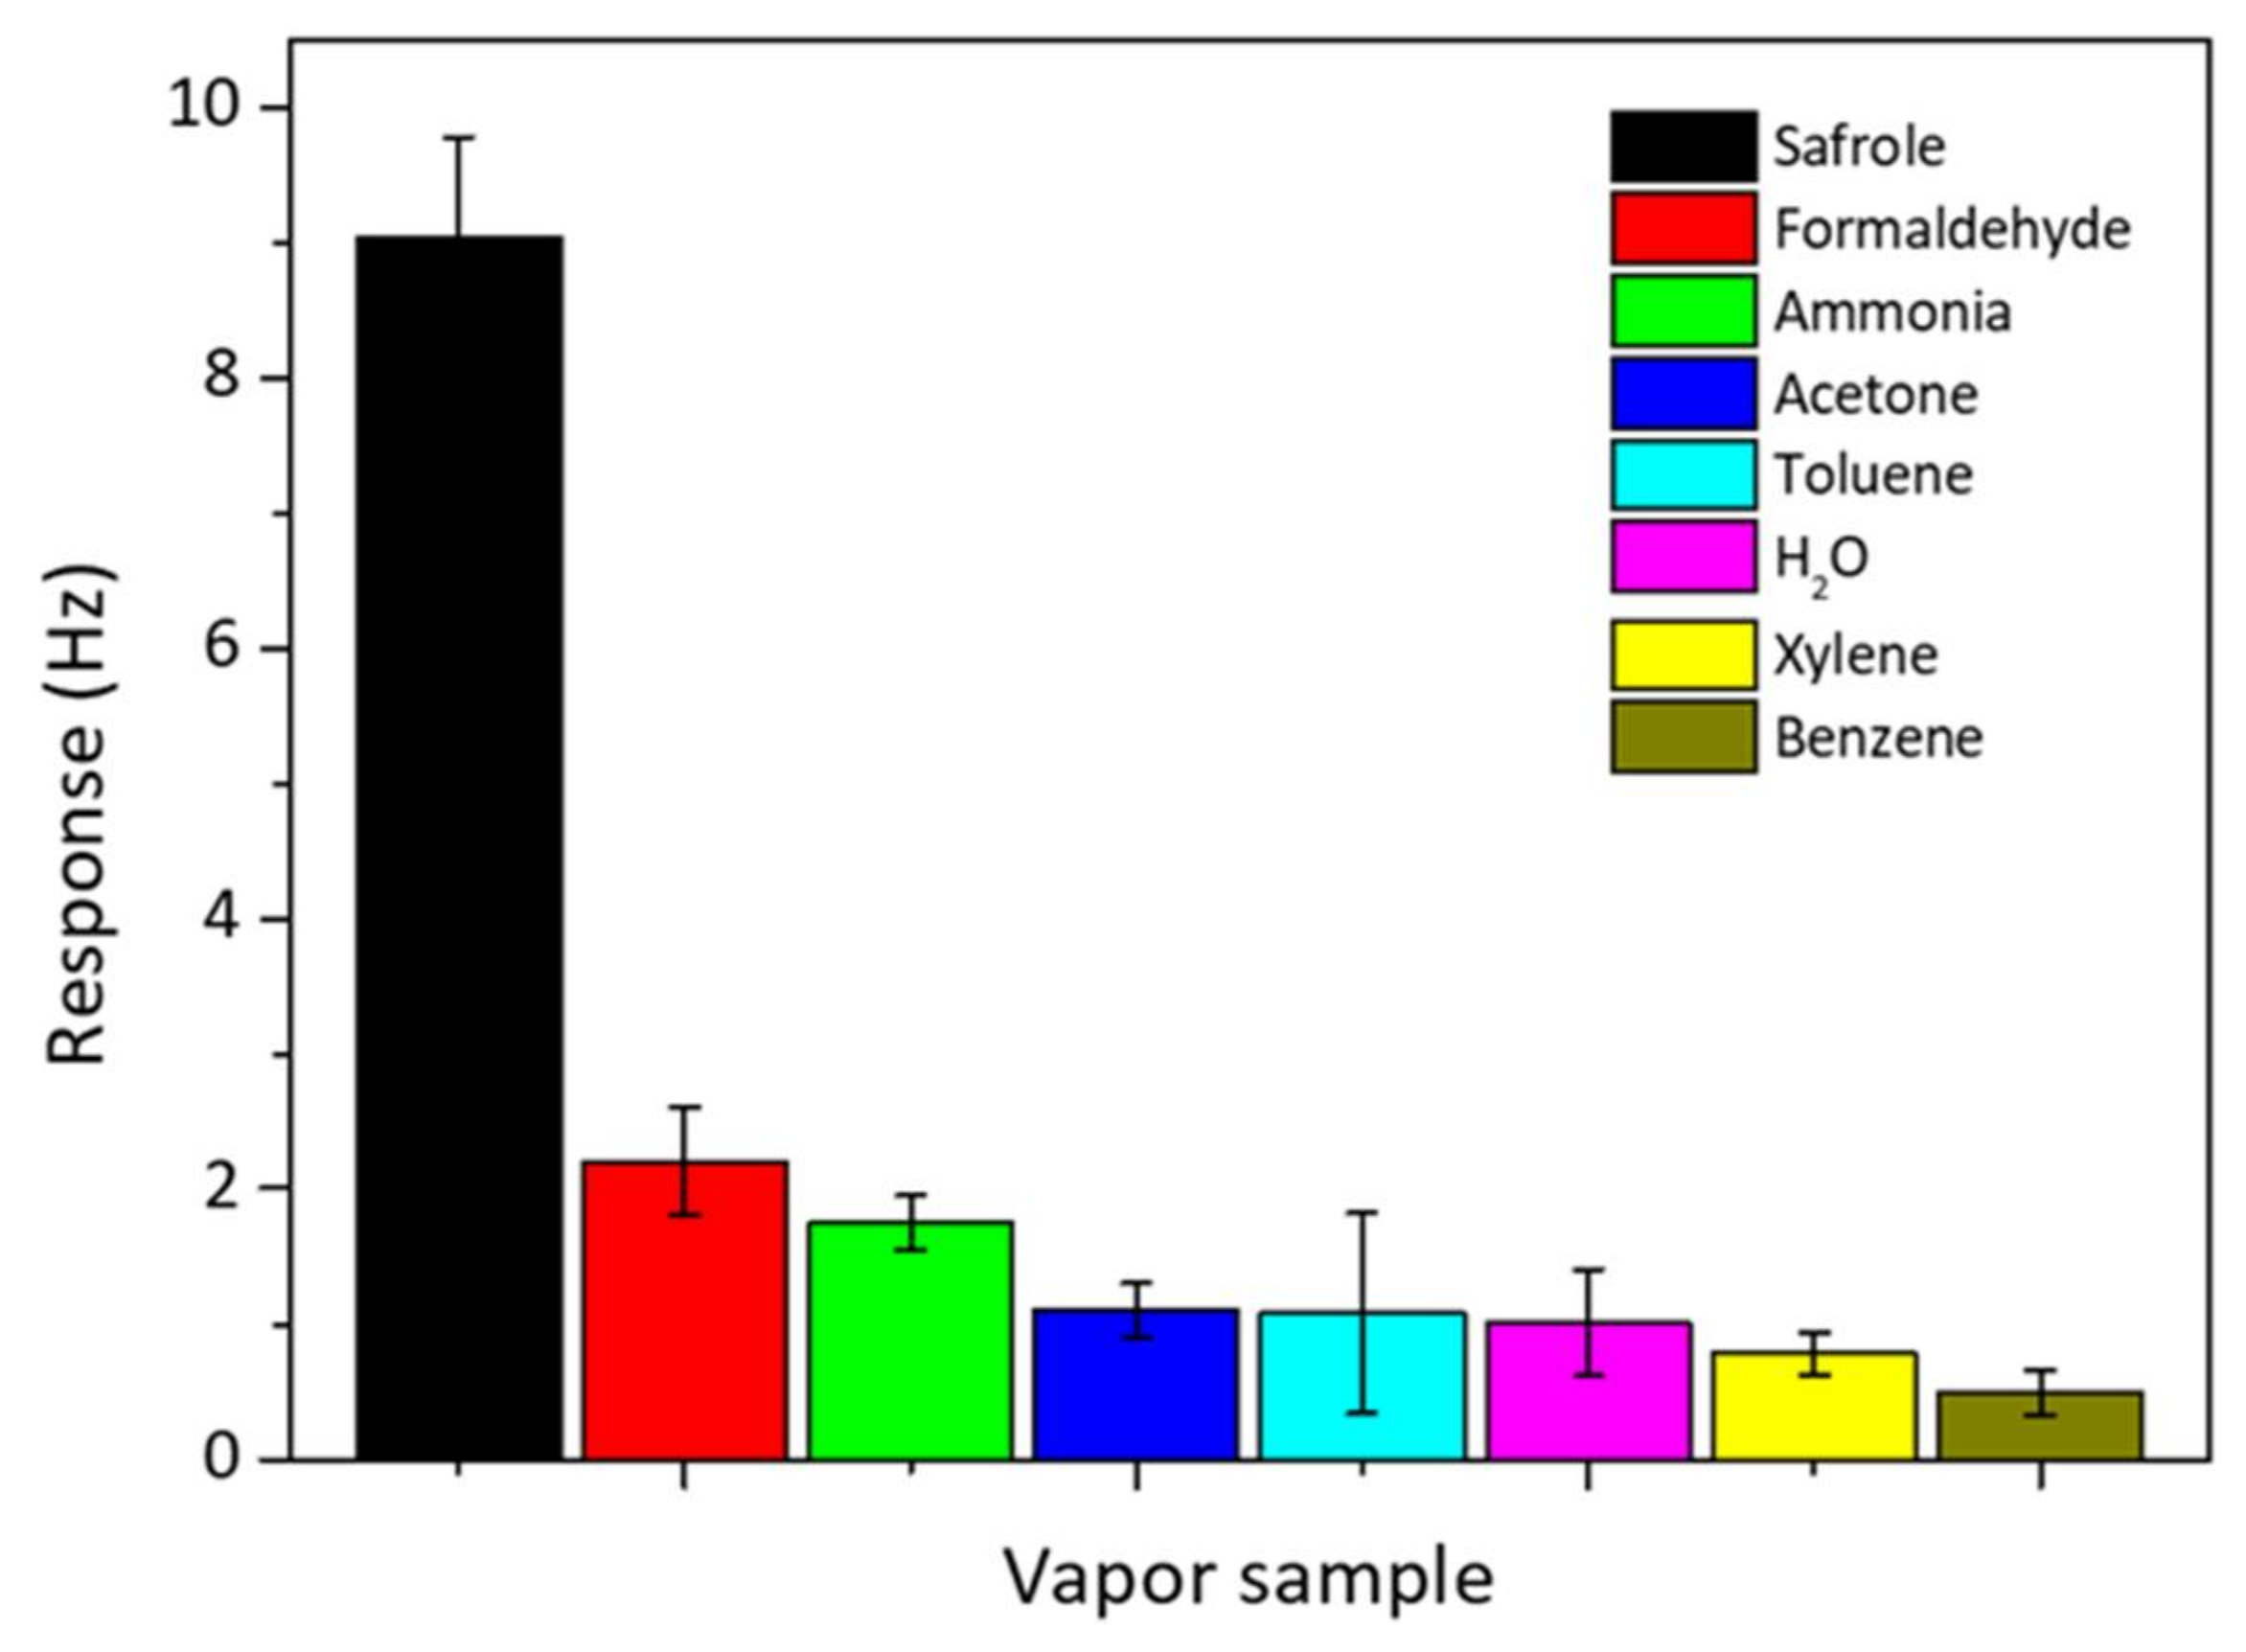
3.4. Selectivity of Safrole Sensing Over Other Gas

The selectivity of the QCM sensor is important for real and practical detection of safrole vapor. The selectivity test was done by exposing the QCM chip modified with PAN nanofibers to various VOCs of 1 mg/L commonly present in the atmosphere, and they include ammonia (25% in aqueous solution), formaldehyde (37% in aqueous solution), acetone, H2O, benzene, toluene, and xylene. The results are shown in Figure 8. The responses for these organic vapors are smaller than that for safrole; since the PAN nanofibers selectively interact with safrole. At concentration 1 mg/L, safrole gives the highest response of frequency shift up to 9 Hz, whereas other VOCs give a response of 2.2 Hz or lower.
The high interaction between the nanofibers and safrole suggests that the sensing surface is more selective toward safrole than the other tested vapors. Previous works show that the high affinity of the QCM active layer toward specific analytes could result in a great response or high selectivity [29,30]. The QCM sensor modified with PAN by electrospinning has a better selectivity to safrole than to the other tested analytes. The developed QCM system for safrole detection could be of significant application in curbing illegal drug production and abuse.

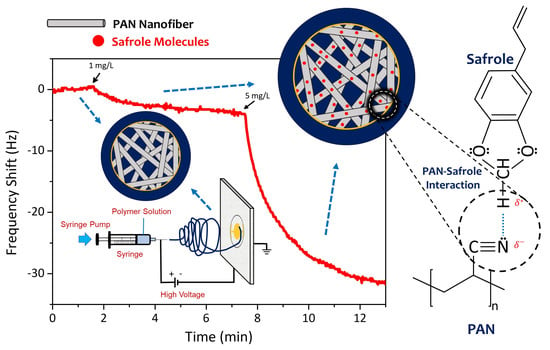
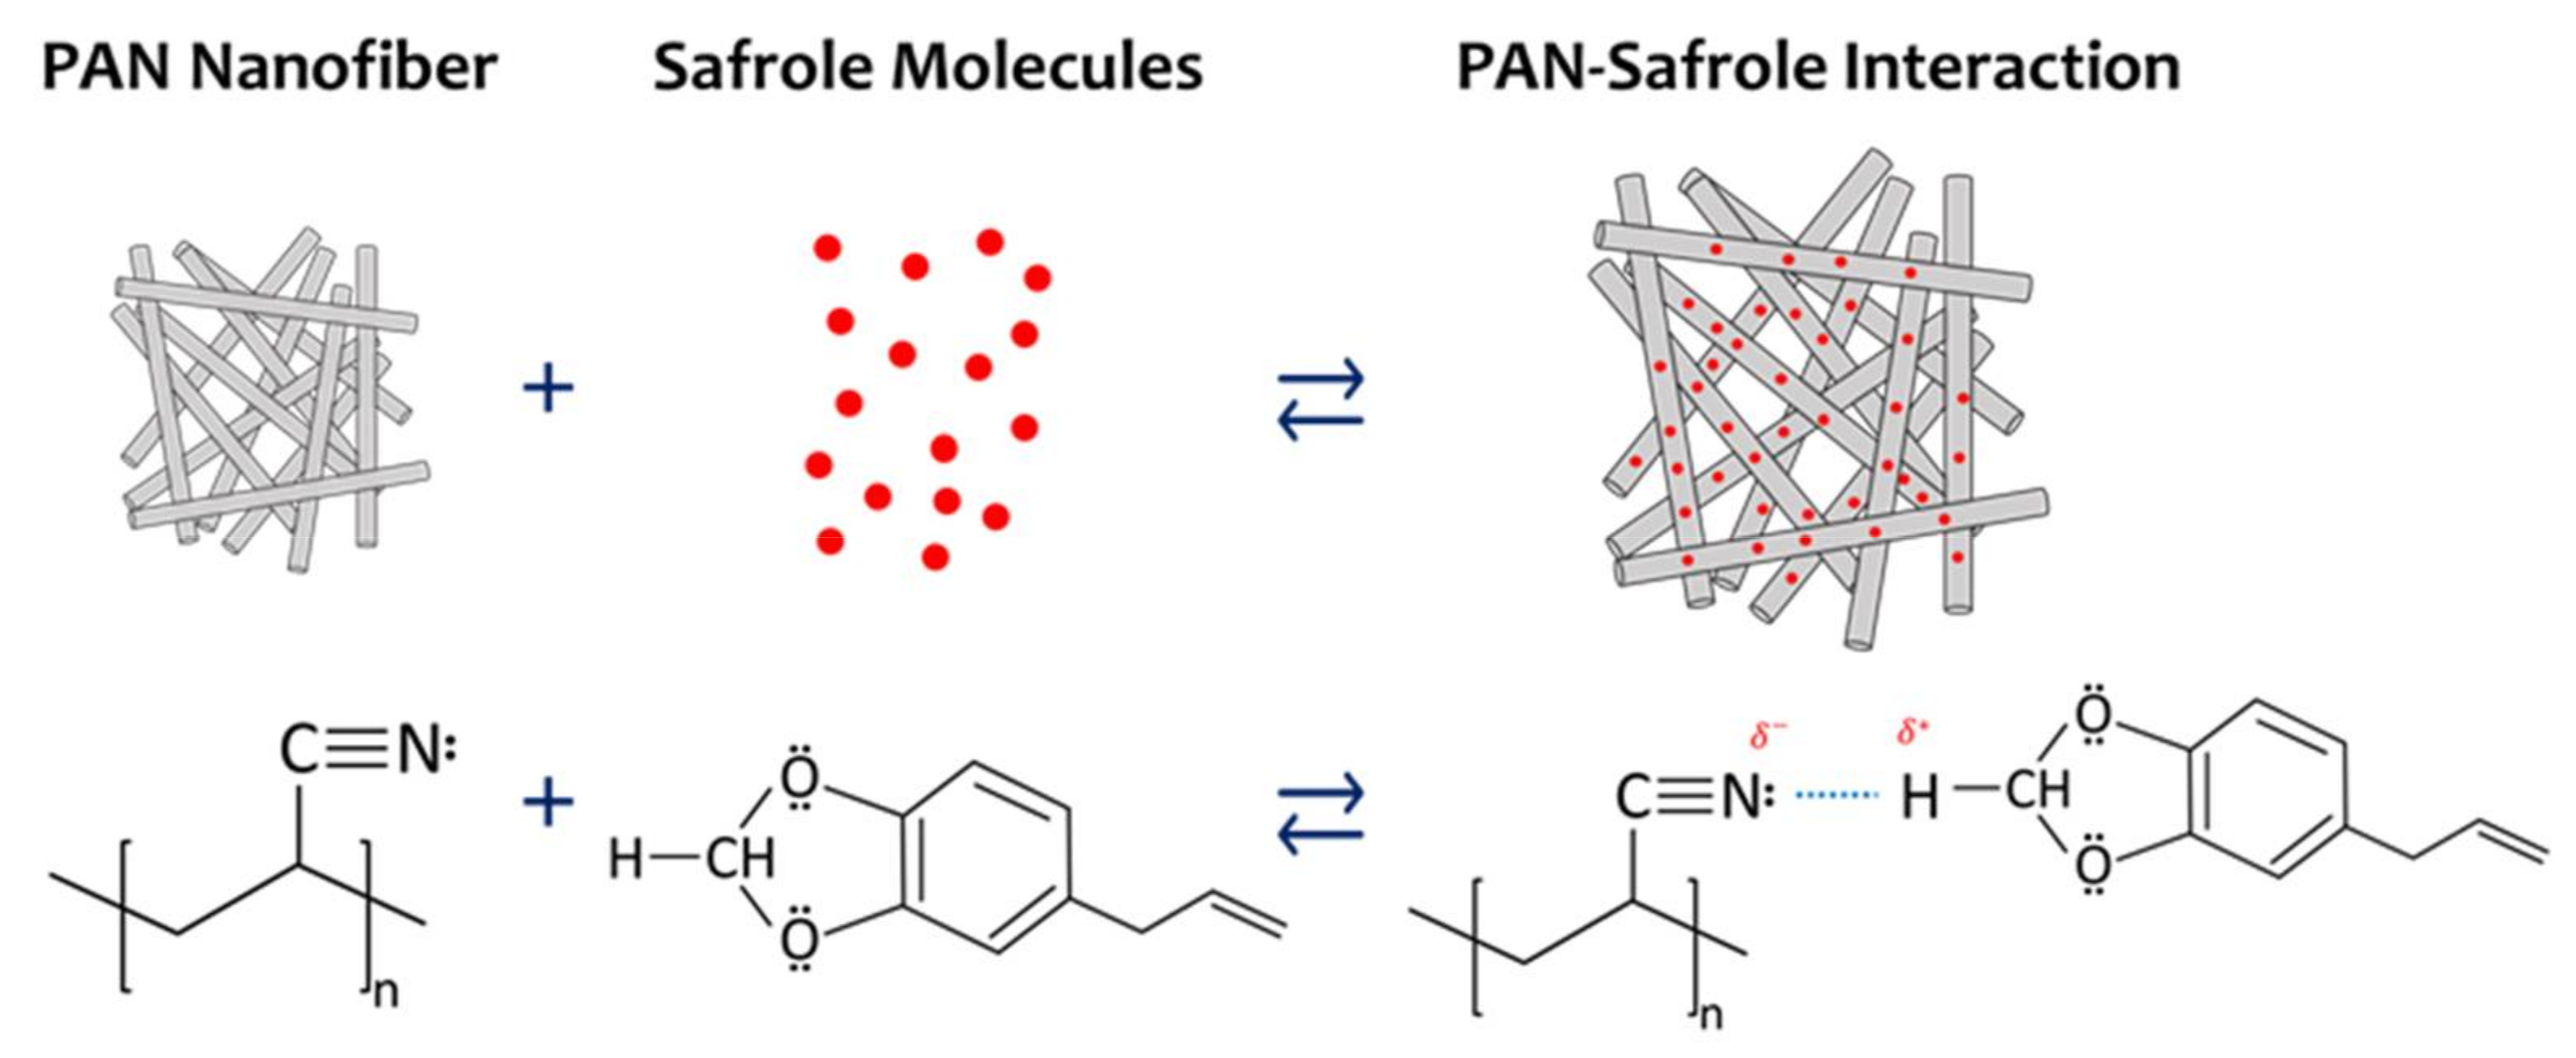
3.5. Sensing Mechanism

Figure 9 illustrates a probable safrole sensing mechanism by the PAN nanofiber QCM-based sensor. Each subunit of PAN has a nitrogen atom that acts as Lewis base. One lone electron pair in each PAN subunit is believed to interact strongly with two protons located between two oxygen atoms of safrole. These two hydrogen atoms are the most electron-deficient ones in the structure that acts as strong Lewis acid. The intermolecular hydrogen bonding between the hydrogen atoms and the nitrogen atom is strong, which leads to the significant frequency shift. Safrole may also have a weak interaction with PAN through other intermolecular interactions such as hydrophobic–hydrophilic, dipole–dipole, and π–π interactions. Moreover, the intermolecular interactions of the other tested VOCs are not as strong as that of safrole.
Many studies have reported that the unique structure of nanofibrous material with high porosity could be advantageous for achieving strong and rapid QCM responses to analytes [31,32]. A large shift in frequency indicates a strong interaction between safrole and PAN nanofibers. The large surface area, high porosity, and hierarchical structure of PAN nanofiber provide high diffusion for the analyte, which results in a big frequency shift. Furthermore, the high surface area of the PAN nanofibers allows safrole molecules to diffuse deep into the film, which helps increase the frequency response. The 3D porous structure alone is not enough to produce both excellent sensitivity and selectivity. In our next study, we will focus on in-depth investigation of the sensing mechanism of a polymer-modified QCM sensor.

4. Conclusions

A new PAN nanofiber-based QCM sensor was successfully fabricated by electrospinning. The PAN nanofibrous structure clearly improved the sensor performance compared to the thin-film PAN because of a larger surface area and higher porosity. The 3D structure of the PAN nanofibrous membranes provided a permeable space supported by a possible dipole–dipole interaction between PAN and safrole, which together imparted the sensor with good sensitivity and stable properties. The proposed system has good reversibility, high selectivity, and excellent sensitivity (4.6 Hz·L/mg with χ2 = 0.99) for detecting safrole. Hence, it could be used for routine detection of safrole. The sensing mechanism, however, may be the subject of further investigation. This work may promote a new strategy for sensing development of drugs, especially MDMA and other ATS derivatives.

Acknowledgments

We thank the Ministry of Research Technology and Higher Education, the Republic of Indonesia, for financial support, under Contract Numbers 1991/UN1-P.III/DIT-LIT/LT/2017 and 7337/UN1.P.III/DIT-LIT/LT/2017. We also thank Budiarto (Pusdokkes POLRI) for providing the safrole samples.

Author Contributions

A.R. performed the experiments, analyzed the data, and wrote the paper. R.R. conceived and designed the experiments, contributed reagent and materials, and wrote the paper. T.J. and S.N.H. designed and developed the frequency measurement system and performed the experiments. A.K. and E.A.S. analyzed the data and contributed reagent/materials. K.T. conceived and designed the experiments, calibrated the frequency measurement system, analyzed the data, and wrote the paper.

Conflicts of Interest

The authors declare no conflict of interest.

References

  1. United Nations Office on Drugs and Crime. Global Overview of Drug Demand and Supply; United Nations Office on Drugs and Crime: Vienna, Austria, 2017. [Google Scholar]
  2. Degenhardt, L.; Whiteford, H.A.; Ferrari, A.J.; Baxter, A.J.; Charlson, F.J.; Hall, W.D.; Freedman, G.; Burstein, R.; Johns, N.; Engell, R.E.; et al. Global burden of disease attributable to illicit drug use and dependence: Findings from the Global Burden of Disease Study 2010. Lancet 2013, 382, 1564–1574. [Google Scholar] [CrossRef]
  3. United Nations Office on Drugs and Crime. Market Analysis of Synthetic Drugs. Amphetamine-Type Stimulants, New Psychoactive Substances; United Nations Office on Drugs and Crime: Vienna, Austria, 2017. [Google Scholar]
  4. Honeychurch, K. Review: The Application of Liquid Chromatography Electrochemical Detection for the Determination of Drugs of Abuse. Separations 2016, 3, 28. [Google Scholar] [CrossRef]
  5. Saito, K.; Saito, R.; Kikuchi, Y.; Iwasaki, Y.; Ito, R.; Nakazawa, H. Analysis of drugs of abuse in biological specimens. J. Health Sci. 2011, 57, 472–487. [Google Scholar] [CrossRef]
  6. Cui, J.; Wang, D.; Xie, T.; Lin, Y. Study on photoelectric gas-sensing property and photogenerated carrier behavior of Ag–ZnO at the room temperature. Sens. Actuators B Chem. 2013, 186, 165–171. [Google Scholar] [CrossRef]
  7. Aba, L.; Yusuf, Y.; Siswanta, D.; Triyana, K. Sensitivity improvement of ammonia gas sensor based on poly(3,4-ethylenedioxythiophene): Poly(strenesulfonate) by employing doping of bromocresol green. J. Nanotechnol. 2014, 2014, 864274. [Google Scholar] [CrossRef]
  8. Wang, J.; He, E.; Liu, X.; Yu, L.; Wang, H.; Zhang, R.; Zhang, H. High performance hydrazine vapor sensor based on redox mechanism of twisted perylene diimide derivative with lower reduction potential. Sens. Actuators B Chem. 2017, 239, 898–905. [Google Scholar] [CrossRef]
  9. Hidayat, S.N.; Triyana, K. Optimized back-propagation combined with radial basic neural network for improving performance of the electronic nose: Case study on the fermentation process of tempeh. AIP Conf. Proc. 2016, 1755, 20001. [Google Scholar]
  10. Evyapan, M.; Kadem, B.; Basova, T.V.; Yushina, I.V.; Hassan, A.K. Study of the sensor response of spun metal phthalocyanine films to volatile organic vapors using surface plasmon resonance. Sens. Actuators B Chem. 2016, 236, 605–613. [Google Scholar] [CrossRef]
  11. He, K.; Wang, X.; Meng, X.; Zheng, H.; Suye, S.I. Amperometric determination of hydroquinone and catechol on gold electrode modified by direct electrodeposition of poly(3,4-ethylenedioxythiophene). Sens. Actuators B Chem. 2014, 193, 212–219. [Google Scholar] [CrossRef]
  12. Wang, N.; Wang, X.; Jia, Y.; Li, X.; Yu, J.; Ding, B. Electrospun nanofibrous chitosan membranes modified with polyethyleneimine for formaldehyde detection. Carbohydr. Polym. 2014, 108, 192–199. [Google Scholar] [CrossRef] [PubMed]
  13. Roto, R.; Yamagishi, A.; Villemure, G. Electrochemical quartz crystal microbalance study of mass transport in thin film of a redox active Ni-Al-Cl layered double hydroxide. J. Electroanal. Chem. 2004, 572, 101–108. [Google Scholar] [CrossRef]
  14. Hidayat, S.N.; Julian, T.; Rianjanu, A.; Kusumaatmadja, A.; Triyana, K. Quartz crystal microbalance coated by PAN nanofibers and PEDOT:PSS for humidity sensor. In Proceedings of the 2017 International Seminar on Sensors, Instrumentation, Measurement and Metrology (ISSIMM), Surabaya, Indonesia, 25–26 August 2017; pp. 119–123. [Google Scholar]
  15. Sun, Y.F.; Liu, S.B.; Meng, F.L.; Liu, J.Y.; Jin, Z.; Kong, L.T.; Liu, J.H. Metal Oxide Nanostructures and Their Gas Sensing Properties: A Review. Sensors 2012, 12, 2610–2631. [Google Scholar] [CrossRef] [PubMed]
  16. Ding, B.; Wang, M.; Wang, X.; Yu, J.; Sun, G. Electrospun nanomaterials for ultrasensitive sensors. Mater. Today 2010, 13, 16–27. [Google Scholar] [CrossRef]
  17. Triyana, K.; Mu’min, M.S.; Faizah, K.; Yusuf, Y.; Kusumaatmaja, A.; Harsojo, S. Electrospun Nanofibers Based on Polyvinyl Alcohol/Chitosan and its Stability in KOH Solution. Mater. Sci. Forum 2015, 827, 321–325. [Google Scholar] [CrossRef]
  18. Rianjanu, A.; Kusumaatmaja, A.; Suyono, E.A.; Triyana, K. Solvent vapor treatment improves mechanical strength of electrospun polyvinyl alcohol nanofibers. Heliyon 2018, 4, e00592. [Google Scholar] [CrossRef]
  19. Rianjanu, A.; Winardianto, B.; Munir, M.; Kartini, I.; Triyana, K. Electrical Conductivity Improvement of Polyvinyl Alcohol Nanofiber by Solvent Vapour Treatment. Int. J. Adv. Sci. Eng. Inf. Technol. 2016, 6, 675–681. [Google Scholar] [CrossRef]
  20. Mahendra, B.; Nugroho, F.; Yusuf, Y. Low-frequency electrohydrodynamic convection patterns in nematic liquid crystal aligned using parallel-oriented nanofiber. Jpn. J. Appl. Phys. 2018, 57, 21701. [Google Scholar] [CrossRef]
  21. Huang, W.; Wang, X.; Jia, Y.; Li, X.; Zhu, Z.; Li, Y.; Si, Y.; Ding, B.; Wang, X.; Yu, J. Highly sensitive formaldehyde sensors based on polyvinylamine modified polyacrylonitrile nanofibers. RSC Adv. 2013, 3, 22994–23000. [Google Scholar] [CrossRef]
  22. Jia, Y.; Yan, C.; Yu, H.; Chen, L.; Dong, F. One-step fabrication of ammonia sensor by electrospinning PS-b-PMA nanofibers on quartz crystal microbalance. Sens. Actuators B Chem. 2014, 203, 459–464. [Google Scholar] [CrossRef]
  23. Jia, Y.; Yu, H.; Cai, J.; Li, Z.; Dong, F. Explore on the quantitative analysis of specific surface area on sensitivity of polyacrylic acid-based QCM ammonia sensor. Sens. Actuators B Chem. 2017, 243, 1042–1045. [Google Scholar] [CrossRef]
  24. Pinalli, R.; Barboza, T.; Bianchi, F.; Massera, C.; Ugozzoli, F.; Dalcanale, E. Detection of amphetamine precursors with quinoxaline-bridged cavitands. Supramol. Chem. 2013, 25, 682–687. [Google Scholar] [CrossRef]
  25. Hackner, A.; Legner, W.; Müller, G.; Biavardi, E.; Dalcanale, E.; Zampolli, S.; Elmi, I.; Cardinali, G.C. Surface ionization detection of amine containing drugs. Sens. Actuators B Chem. 2013, 185, 771–776. [Google Scholar] [CrossRef]
  26. Sauerbrey, G. Verwendung von Schwingquarzen zur Wägung dünner Schichten und zur Mikrowägung. Zeitschrift für Physik 1959, 155, 206–222. [Google Scholar] [CrossRef]
  27. Wang, X.; Zhang, J.; Zhu, Z. Ammonia sensing characteristics of ZnO nanowires studied by quartz crystal microbalance. Appl. Surf. Sci. 2006, 252, 2404–2411. [Google Scholar] [CrossRef]
  28. Zubillaga, M.P.; Maerker, G. Determination of Safrole and Isosafrole in Ham by HPLC with UV Detection. J. Food Sci. 1990, 55, 1194–1195. [Google Scholar] [CrossRef]
  29. Bai, H.; Shi, G. Gas Sensors Based on Conducting Polymers. Sensors 2007, 7, 267–307. [Google Scholar] [CrossRef]
  30. Seekaew, Y.; Lokavee, S.; Phokharatkul, D.; Wisitsoraat, A.; Kerdcharoen, T.; Wongchoosuk, C. Low-cost and flexible printed graphene-PEDOT:PSS gas sensor for ammonia detection. Org. Electron. Phys. Mater. Appl. 2014, 15, 2971–2981. [Google Scholar] [CrossRef]
  31. Jia, Y.; Yu, H.; Zhang, Y.; Dong, F.; Li, Z. Cellulose acetate nanofibers coated layer-by-layer with polyethylenimine and graphene oxide on a quartz crystal microbalance for use as a highly sensitive ammonia sensor. Collid. Surf. B Biointerfaces 2016, 148, 263–269. [Google Scholar] [CrossRef] [PubMed]
  32. Jia, Y.; Chen, L.; Yu, H.; Zhang, Y.; Dong, F. Graphene oxide/polystyrene composite nanofibers on quartz crystal microbalance electrode for the ammonia detection. RSC Adv. 2015, 5, 40620–40627. [Google Scholar] [CrossRef]
Figure 1. (a) Chemical structure of polyacrylonitrile (PAN) and safrole; (b) schematic illustration of electrospinning set-up and nanofiber image deposited on the quartz crystal microbalance (QCM) surface.
Sensors 18 01150 g001
Figure 2. Schematic illustration of safrole QCM gas sensing configuration.
Sensors 18 01150 g002
Figure 3. SEM image of PAN nanofiber on QCM surface; (a) PAN-NF 1; (b) PAN-NF 2; (c) PAN-NF 3; and (d) PAN-NF 4.
Sensors 18 01150 g003
Figure 4. The QCM response to 1 mg/L safrole vapor.
Sensors 18 01150 g004
Figure 5. The QCM response to safrole of bare, modified with PAN by spin-coating and modified with PAN by electrospinning.
Sensors 18 01150 g005
Figure 6. (a) QCM response to the various analyte concentrations; (b) QCM response after 5 min of contact with different analyte concentrations. The slope of the curve indicates the selectivity of the method.
Sensors 18 01150 g006
Figure 7. Reversibility testing for PAN-NF 4 nanofiber QCM sensors upon exposure to increasing the safrole concentrations. (Inset: systematic error of PAN-NF 4 sensor from 10-time measurement; the response is taken at t = 5 min after each injection).
Sensors 18 01150 g007
Figure 8. Selectivity of PAN nanofiber-coated QCM sensor over other analytes. The analyte concentration is predetermined at 1 mg/L.
Sensors 18 01150 g008
Figure 9. Schematic representation of the interaction mechanism between safrole and PAN nanofiber.
Sensors 18 01150 g009
Table 1. Electrospinning parameters and frequency shift after coating with PAN nanofiber.
TrialTime (s)Frequency Shift (Hz)Deposited Mass (µg)
PAN-NF 1101500.2
PAN-NF 2205000.6
PAN-NF 3309001.0
PAN-NF 44015001.7

