Quantifying the Accuracy of Digital Hemispherical Photography for Leaf Area Index Estimates on Broad-Leaved Tree Species

Abstract
:1. Introduction
2. Materials and Methods
3. Results and Discussion
4. Conclusions
Author Contributions
Conflicts of Interest
References
- Duchemin, B.; Hadria, R.; Erraki, S.; Boulet, G.; Maisongrande, P.; Chehbuoni, A.; Escadafal, R.; Ezzahar, J.; Hoedjes, J.C.B.; Kharrou, M.H.; et al. Monitoring wheat phenology and irrigation in Central Morocco: On the use of relationship between evapotranspiration, crops coefficients, leaf area index and remotely-sensed vegetation indices. Agric. Water Manag. 2006, 79, 1–27. [Google Scholar] [CrossRef]
- Cleugh, H.A.; Leuining, R.; Mu, Q.; Running, S.W. Regional evapotranspiration estimates from flux tower and MODIS satellite data. Remote Sens. Environ. 2007, 106, 285–304. [Google Scholar] [CrossRef]
- Leuning, R.; Cleugh, H.A.; Zegelin, S.J.; Hughes, D. Carbon and water fluxes over a temperate Eucalyptus forest and a tropical wet/dry savanna in Australia: Measurements and comparison with MODIS remote sensing estimates. Agric. For. Meteorol. 2005, 129, 151–173. [Google Scholar] [CrossRef]
- Confalonieri, R.; Foi, M.; Casa, R.; Aquaro, S.; Tona, E.; Peterle, M.; Boldini, A.; De Carli, G.; Ferrari, A.; Finotto, G.; et al. Development of an app for estimating leaf area index using a smartphone. Trueness and precision determination and comparison with other indirect methods. Comput. Electron. Agric. 2013, 96, 67–74. [Google Scholar] [CrossRef]
- Asner, G.P.; Scurlock, J.M.O.; Hicke, J.A. Global synthesis of leaf area index observations: Implications for ecological and remote sensing studies. Glob. Ecol. Biogeogr. 2003, 12, 191–205. [Google Scholar] [CrossRef]
- Jonckheere, I.; Fleck, S.; Nackaerts, K.; Muys, B.; Coppin, P.; Weiss, M.; Baret, F. Review of methods for in situ leaf area index determination. Part I. Theories, sensor and hemispherical photography. Agric. For. Meteorol. 2004, 121, 19–35. [Google Scholar] [CrossRef]
- Macfarlane, C.; Hoffman, M.; Eamus, D.; Kerp, N.; Higginson, S.; McMurtrie, R.; Adams, M. Estimation of leaf area index in eucalypt forest using digital photography. Agric. For. Meteorol. 2007, 143, 176–188. [Google Scholar] [CrossRef]
- Khabba, S.; Duchemin, B.; Hadria, R.; Er-Raki, S.; Ezzahar, J.; Chehbouni, A.; Lahrouni, A.; Hanich, L. Evaluation of digital hemispherical photography and plant canopy analyser for measuring vegetation area index of orange orchards. J. Agron. 2009, 8, 67–72. [Google Scholar] [CrossRef]
- Liu, C.; Kang, S.; Li, F.; Li, S.; Du, T. Canopy leaf area index for apple tree using hemispherical photography in arid region. Sci. Hortic. 2013, 164, 610–615. [Google Scholar] [CrossRef]
- Orlando, F.; Movedi, E.; Paleari, L.; Gilardelli, C.; Foi, M.; Dell’Oro, M.; Confalonieri, R. Estimating leaf area index in tree species using the PocketLAI smart app. Appl. Veg. Sci. 2015, 18, 716–723. [Google Scholar] [CrossRef]
- Tang, H.; Dubayah, R.; Swatantran, A.; Hofton, M.; Sheldon, S.; Clark, D.B.; Blair, B. Retrieval of vertical LAI profiles over tropical rain forest using waveform lidar at La Selva, Costa Rica. Remote Sens. Environ. 2012, 124, 242–250. [Google Scholar] [CrossRef]
- Zhao, K.; Popescu, S. Lidar-based mapping of leaf area index and its use for validating GLOBCARBON satellite LAI product in a temperate forest of the southern USA. Remote Sens. Environ. 2009, 113, 1628–1645. [Google Scholar] [CrossRef]
- Rich, P.M.; Clark, D.B.; Clark, D.A.; Oberbauer, S.F. Long-term study of solar radiation regimes in a tropical wet forest using quantum sensors and hemispherical photography. Agric. For. Meteorol. 1993, 65, 107–127. [Google Scholar] [CrossRef]
- Easter, M.J.; Spies, T.A. Using hemispherical photography for estimating photosynthetic photon flux density under canopies and in gaps in Douglas-fir forests of the Pacific Northwest. Can. J. For. Res. 1994, 24, 2050–2058. [Google Scholar] [CrossRef]
- Beaudet, M.; Messier, C. Variation in canopy openness and light transmission following selection cutting in northern hardwood stands: An assessment based on hemispherical photographs. Agric. For. Meteorol. 2002, 110, 217–228. [Google Scholar] [CrossRef]
- Englud, S.R.; O’Brien, J.J.; Clark, D.B. Evaluation of digital and film hemispherical photography and spherical densiometry for measuring forest light environments. Can. J. For. Res. 2000, 30, 1999–2005. [Google Scholar] [CrossRef]
- Zhang, Y.; Chen, J.M.; Miller, J.R. Determining digital hemispherical photograph exposure for leaf area index estimation. Agric. For. Meteorol. 2005, 133, 166–181. [Google Scholar] [CrossRef]
- Leblanc, S.G.; Chen, J.M.; Fernandes, R.; Deering, D.W.; Conley, A. Methodology comparison for canopy structure parameters extraction from digital hemispherical photography in boreal forest. Agric. For. Meteorol. 2005, 129, 187–207. [Google Scholar] [CrossRef]
- Glatthorn, J.; Beckschäfer, P. Standardizing the protocol for hemispherical photographs: Accuracy assessment of binarization algorithms. PLoS ONE 2014, 9, e111924. [Google Scholar] [CrossRef] [PubMed]
- Jonckheere, I.; Nackaerts, K.; Muys, B.; Coppin, P. Assessment of automatic gap fraction estimation of forest from digital hemispherical photography. Agric. For. Meteorol. 2005, 132, 96–114. [Google Scholar] [CrossRef]
- Confalonieri, R.; Francone, C.; Chiodini, M.E.; Cantaluppi, E.; Caravati, L.; Colombi, V.; Fantini, D.; Ghiglieno, I.; Gilardelli, C.; Guffanti, E.; et al. Any chance to evaluate in vivo field methods using standard protocols? Field Crop. Res. 2014, 161, 128–136. [Google Scholar] [CrossRef]
- Song, G.Z.M.; Doley, D.; Yates, D.; Chao, K.J.; Hsieh, C.F. Improving accuracy of canopy hemispherical photography by a constant threshold value derived from an unobscured overcast sky. Can. J. For. Res. 2014, 44, 17–27. [Google Scholar] [CrossRef]
- Chianucci, F. A note on estimating canopy cover from digital cover and hemispherical photography. Silva Fenn. 2016, 50, 1518. [Google Scholar] [CrossRef]
- Orlando, F.; Movedi, E.; Coduto, D.; Parisi, S.; Brancadoro, L.; Pagani, V.; Guarneri, T.; Confalonieri, R. Estimating leaf area index (LAI) in vineyards using the PocketLAI smart-app. Sensors 2016, 16, 2004. [Google Scholar] [CrossRef] [PubMed]
- Weiss, M.; Baret, F.; Smith, G.J.; Jonckheere, I.; Coppin, P. Review of methods for in situ leaf area index (LAI) determination. Part II. Estimation of LAI, errors and sampling. Agric. For. Meteorol. 2004, 121, 37–53. [Google Scholar] [CrossRef]
- International Organization for Standardization (ISO). Accuracy (Trueness and Precision) of Measurements Methods and Results-Part 2: Basic Method for the Determination of Reproducibility of a Standard Measurement Method; ISO 5725/2; International Organization for Standardization: Geneva, Switzerland, 1994. [Google Scholar]
- Cochran, W.G. The distribution of the largest of a set of estimated variances as a fraction of their total. Ann. Hum. Genet. 1941, 11, 47–52. [Google Scholar] [CrossRef]
- Grubbs, F.E. Procedures for detecting outlying observations in samples. Technometrics 1969, 11, 1–21. [Google Scholar] [CrossRef]
- Horwitz, W. Protocol of the design. Conduct and interpretation of method performance studies. Pure Appl. Chem. 1995, 67, 331–343. [Google Scholar] [CrossRef]
- Liu, Z.; Jin, G. Evaluating optical measurements of leaf area index against litter collection in a mixed broadleaved-Korean pine forest in China. Trees 2015, 29, 59–73. [Google Scholar] [CrossRef]
- Liu, Z.; Jin, G.; Zhou, M. Evaluation and correction of optically derived leaf area index in different temperate forest. iForest 2015, 9, 55–62. [Google Scholar] [CrossRef]

| ID Class (As in Orlando et al., 2015) | Canopy Class | Species for Each Quartile within the Class |
|---|---|---|
| 4 | Broad-leaved trees in sparse or continuous canopy, with high scaffold branches | Populus spp. |
| Liriodendron tulipifera L. | ||
| Fagus sylvatica L. | ||
| Magnolia grandiflora L. | ||
| 3 | Broad-leaved trees in plantation row, with low scaffold branches | Populus spp. |
| Robinia pseudoacacia L. | ||
| Populus spp. | ||
| Populus spp. | ||
| 1 | Broad-leaved trees in sparse canopy, with medium scaffold branches | Olea europaea L. |
| Sorbus domestica L. | ||
| Acer platanoides L. | ||
| Fagus sylvatica L. |
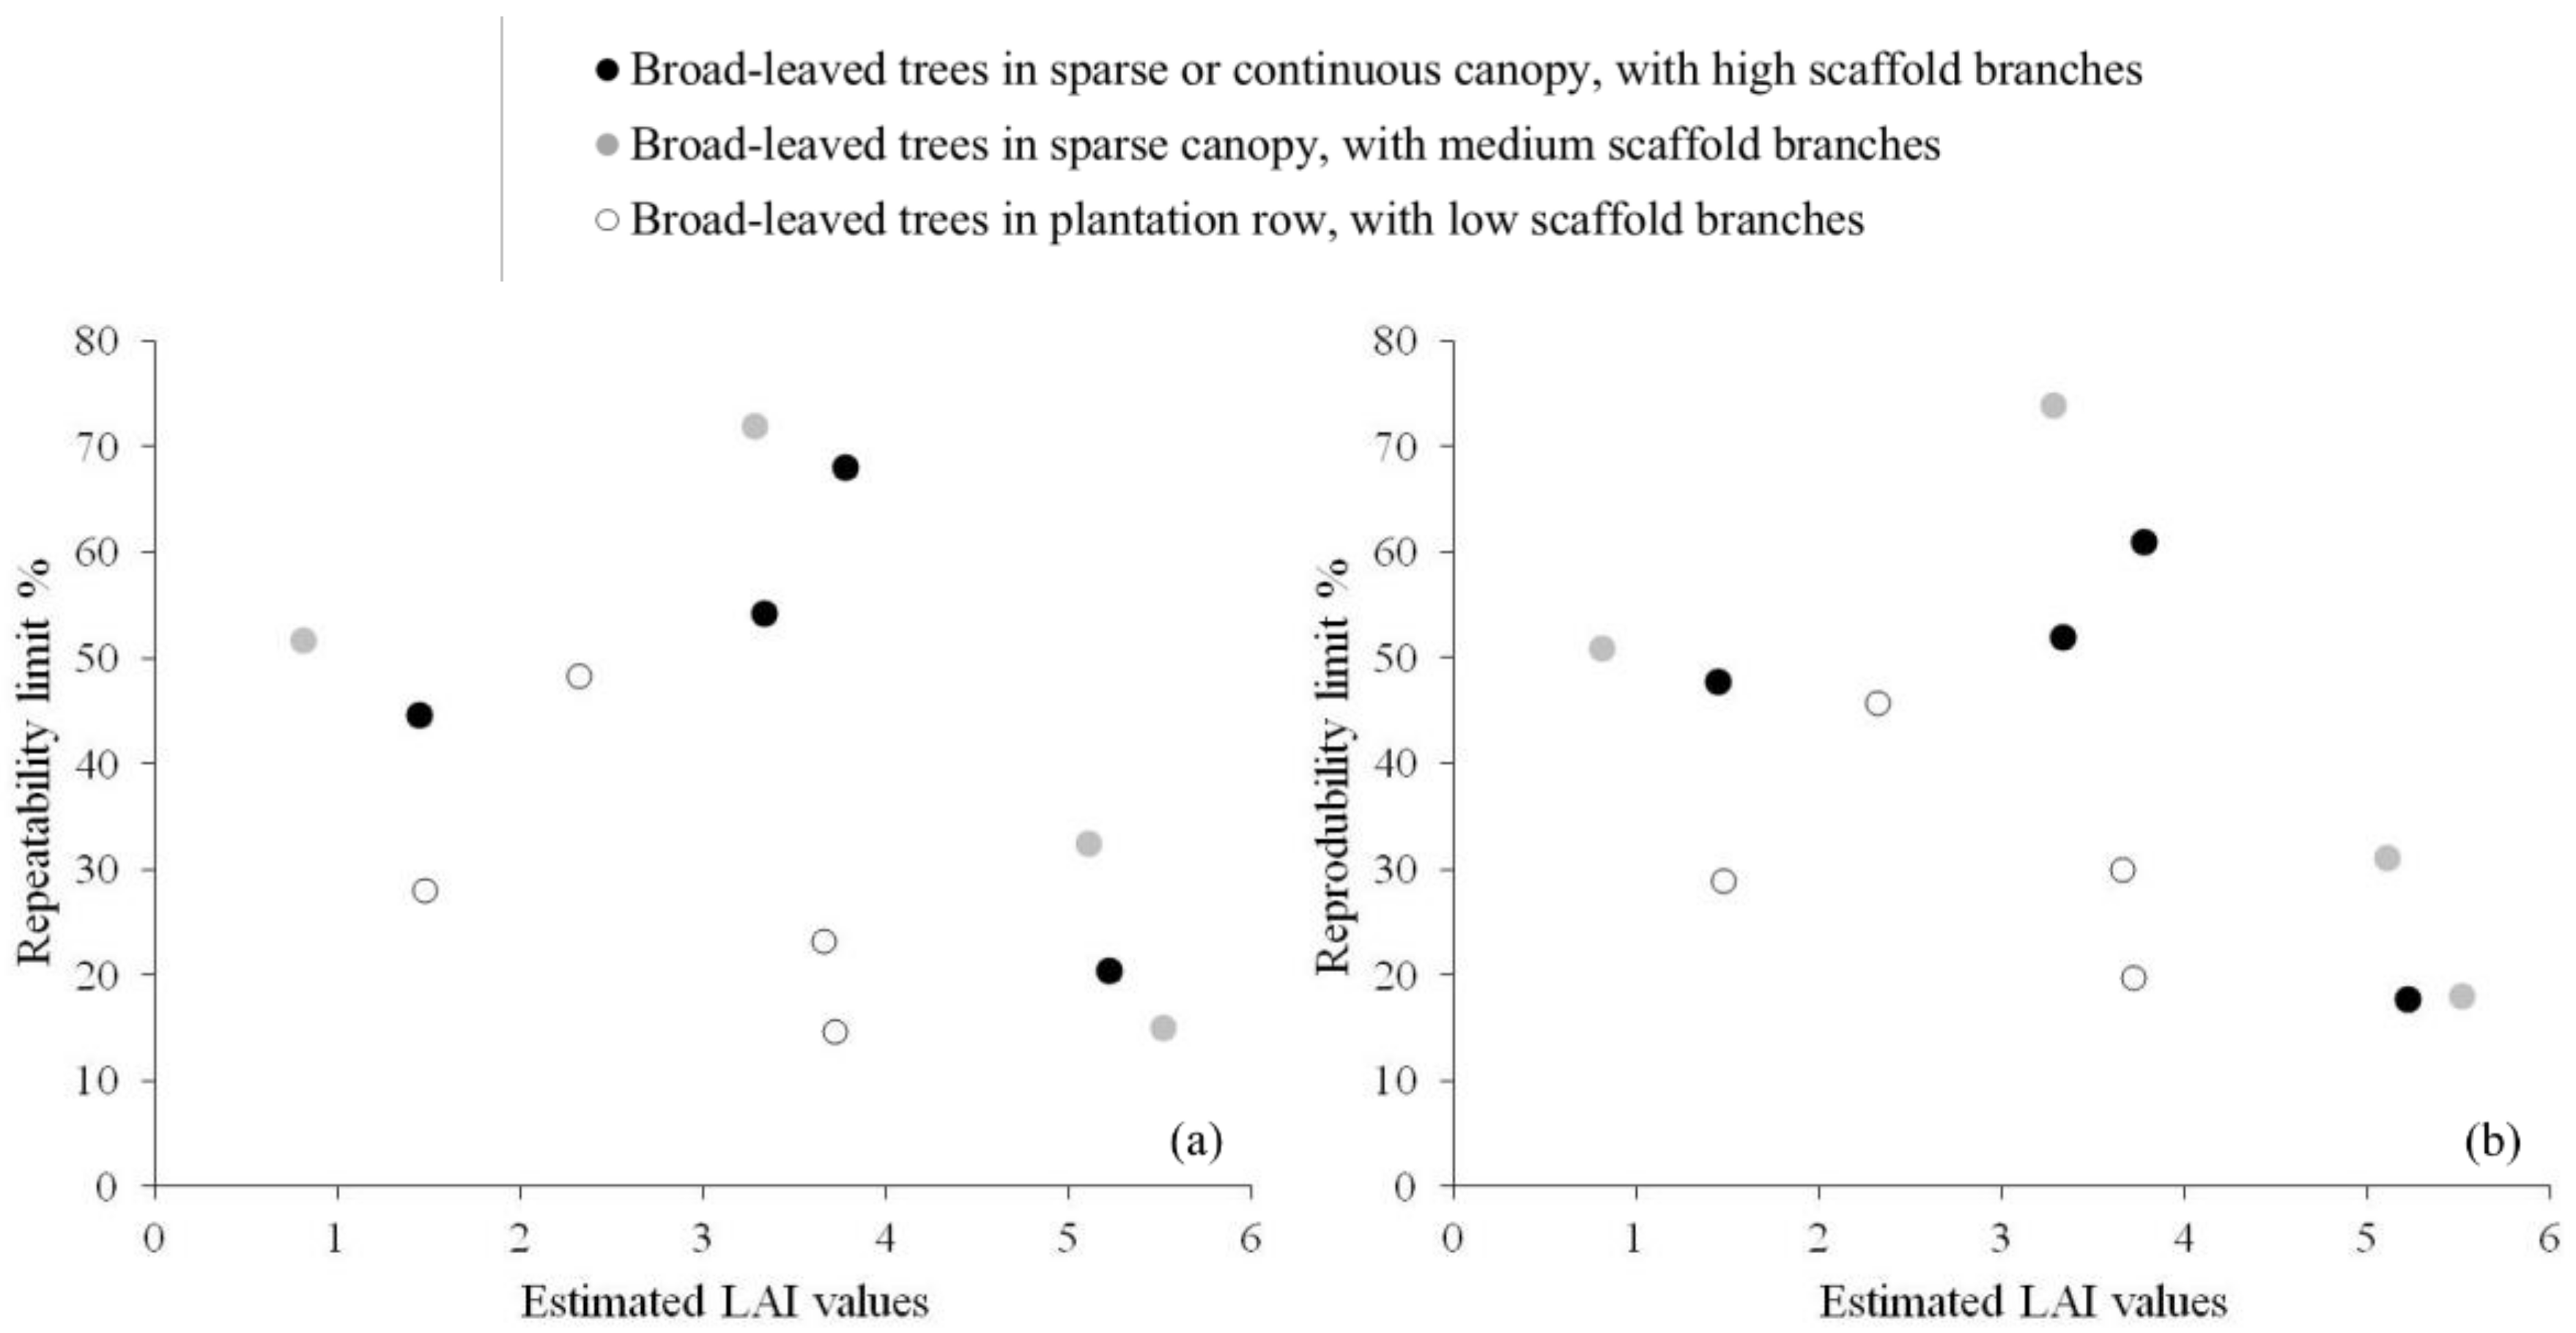
| Canopy Class | Species | Estimated Values | Repeatability | Reproducibility | ||
|---|---|---|---|---|---|---|
| r | RSDr | R | RSDR | |||
| Broad-leaved trees in sparse or continuous canopy, with high scaffold branches | Populus spp. | 1.45 | 0.65 | 15.89 | 0.69 | 17.04 |
| Liriodendron tulipifera L. | 3.78 | 2.57 | 24.26 | 2.57 | 24.26 | |
| Fagus sylvatica L. | 3.33 | 1.81 | 19.35 | 1.81 | 19.35 | |
| Magnolia grandiflora L. | 5.22 a | 1.06 | 7.09 | 1.06 | 7.09 | |
| Broad-leaved trees in plantation row, with low scaffold branches | Populus spp. | 1.48 b | 0.41 | 9.99 | 0.43 | 10.32 |
| Robinia pseudoacacia L. | 2.32 | 1.12 | 17.24 | 1.12 | 17.24 | |
| Populus spp. | 3.66 | 0.85 | 8.27 | 1.09 | 10.69 | |
| Populus spp. | 3.72 | 0.55 | 5.25 | 0.73 | 7.03 | |
| Broad-leaved trees in sparse canopy, with medium scaffold branches | Olea europaea L. | 0.82 c | 0.42 | 18.44 | 0.42 | 18.44 |
| Sorbus domestica L. | 3.29 | 2.36 | 25.68 | 2.43 | 26.35 | |
| Acer platanoides L. | 5.11 | 1.66 | 11.58 | 1.66 | 11.58 | |
| Fagus sylvatica L. | 5.52 | 0.83 | 5.37 | 0.99 | 6.41 | |
© 2018 by the authors. Licensee MDPI, Basel, Switzerland. This article is an open access article distributed under the terms and conditions of the Creative Commons Attribution (CC BY) license (http://creativecommons.org/licenses/by/4.0/).
Share and Cite
Gilardelli, C.; Orlando, F.; Movedi, E.; Confalonieri, R. Quantifying the Accuracy of Digital Hemispherical Photography for Leaf Area Index Estimates on Broad-Leaved Tree Species. Sensors 2018, 18, 1028. https://doi.org/10.3390/s18041028
Gilardelli C, Orlando F, Movedi E, Confalonieri R. Quantifying the Accuracy of Digital Hemispherical Photography for Leaf Area Index Estimates on Broad-Leaved Tree Species. Sensors. 2018; 18(4):1028. https://doi.org/10.3390/s18041028
Chicago/Turabian StyleGilardelli, Carlo, Francesca Orlando, Ermes Movedi, and Roberto Confalonieri. 2018. "Quantifying the Accuracy of Digital Hemispherical Photography for Leaf Area Index Estimates on Broad-Leaved Tree Species" Sensors 18, no. 4: 1028. https://doi.org/10.3390/s18041028
APA StyleGilardelli, C., Orlando, F., Movedi, E., & Confalonieri, R. (2018). Quantifying the Accuracy of Digital Hemispherical Photography for Leaf Area Index Estimates on Broad-Leaved Tree Species. Sensors, 18(4), 1028. https://doi.org/10.3390/s18041028