Estimation of Foot Plantar Center of Pressure Trajectories with Low-Cost Instrumented Insoles Using an Individual-Specific Nonlinear Model


Abstract
1. Introduction
2. Materials and Methods
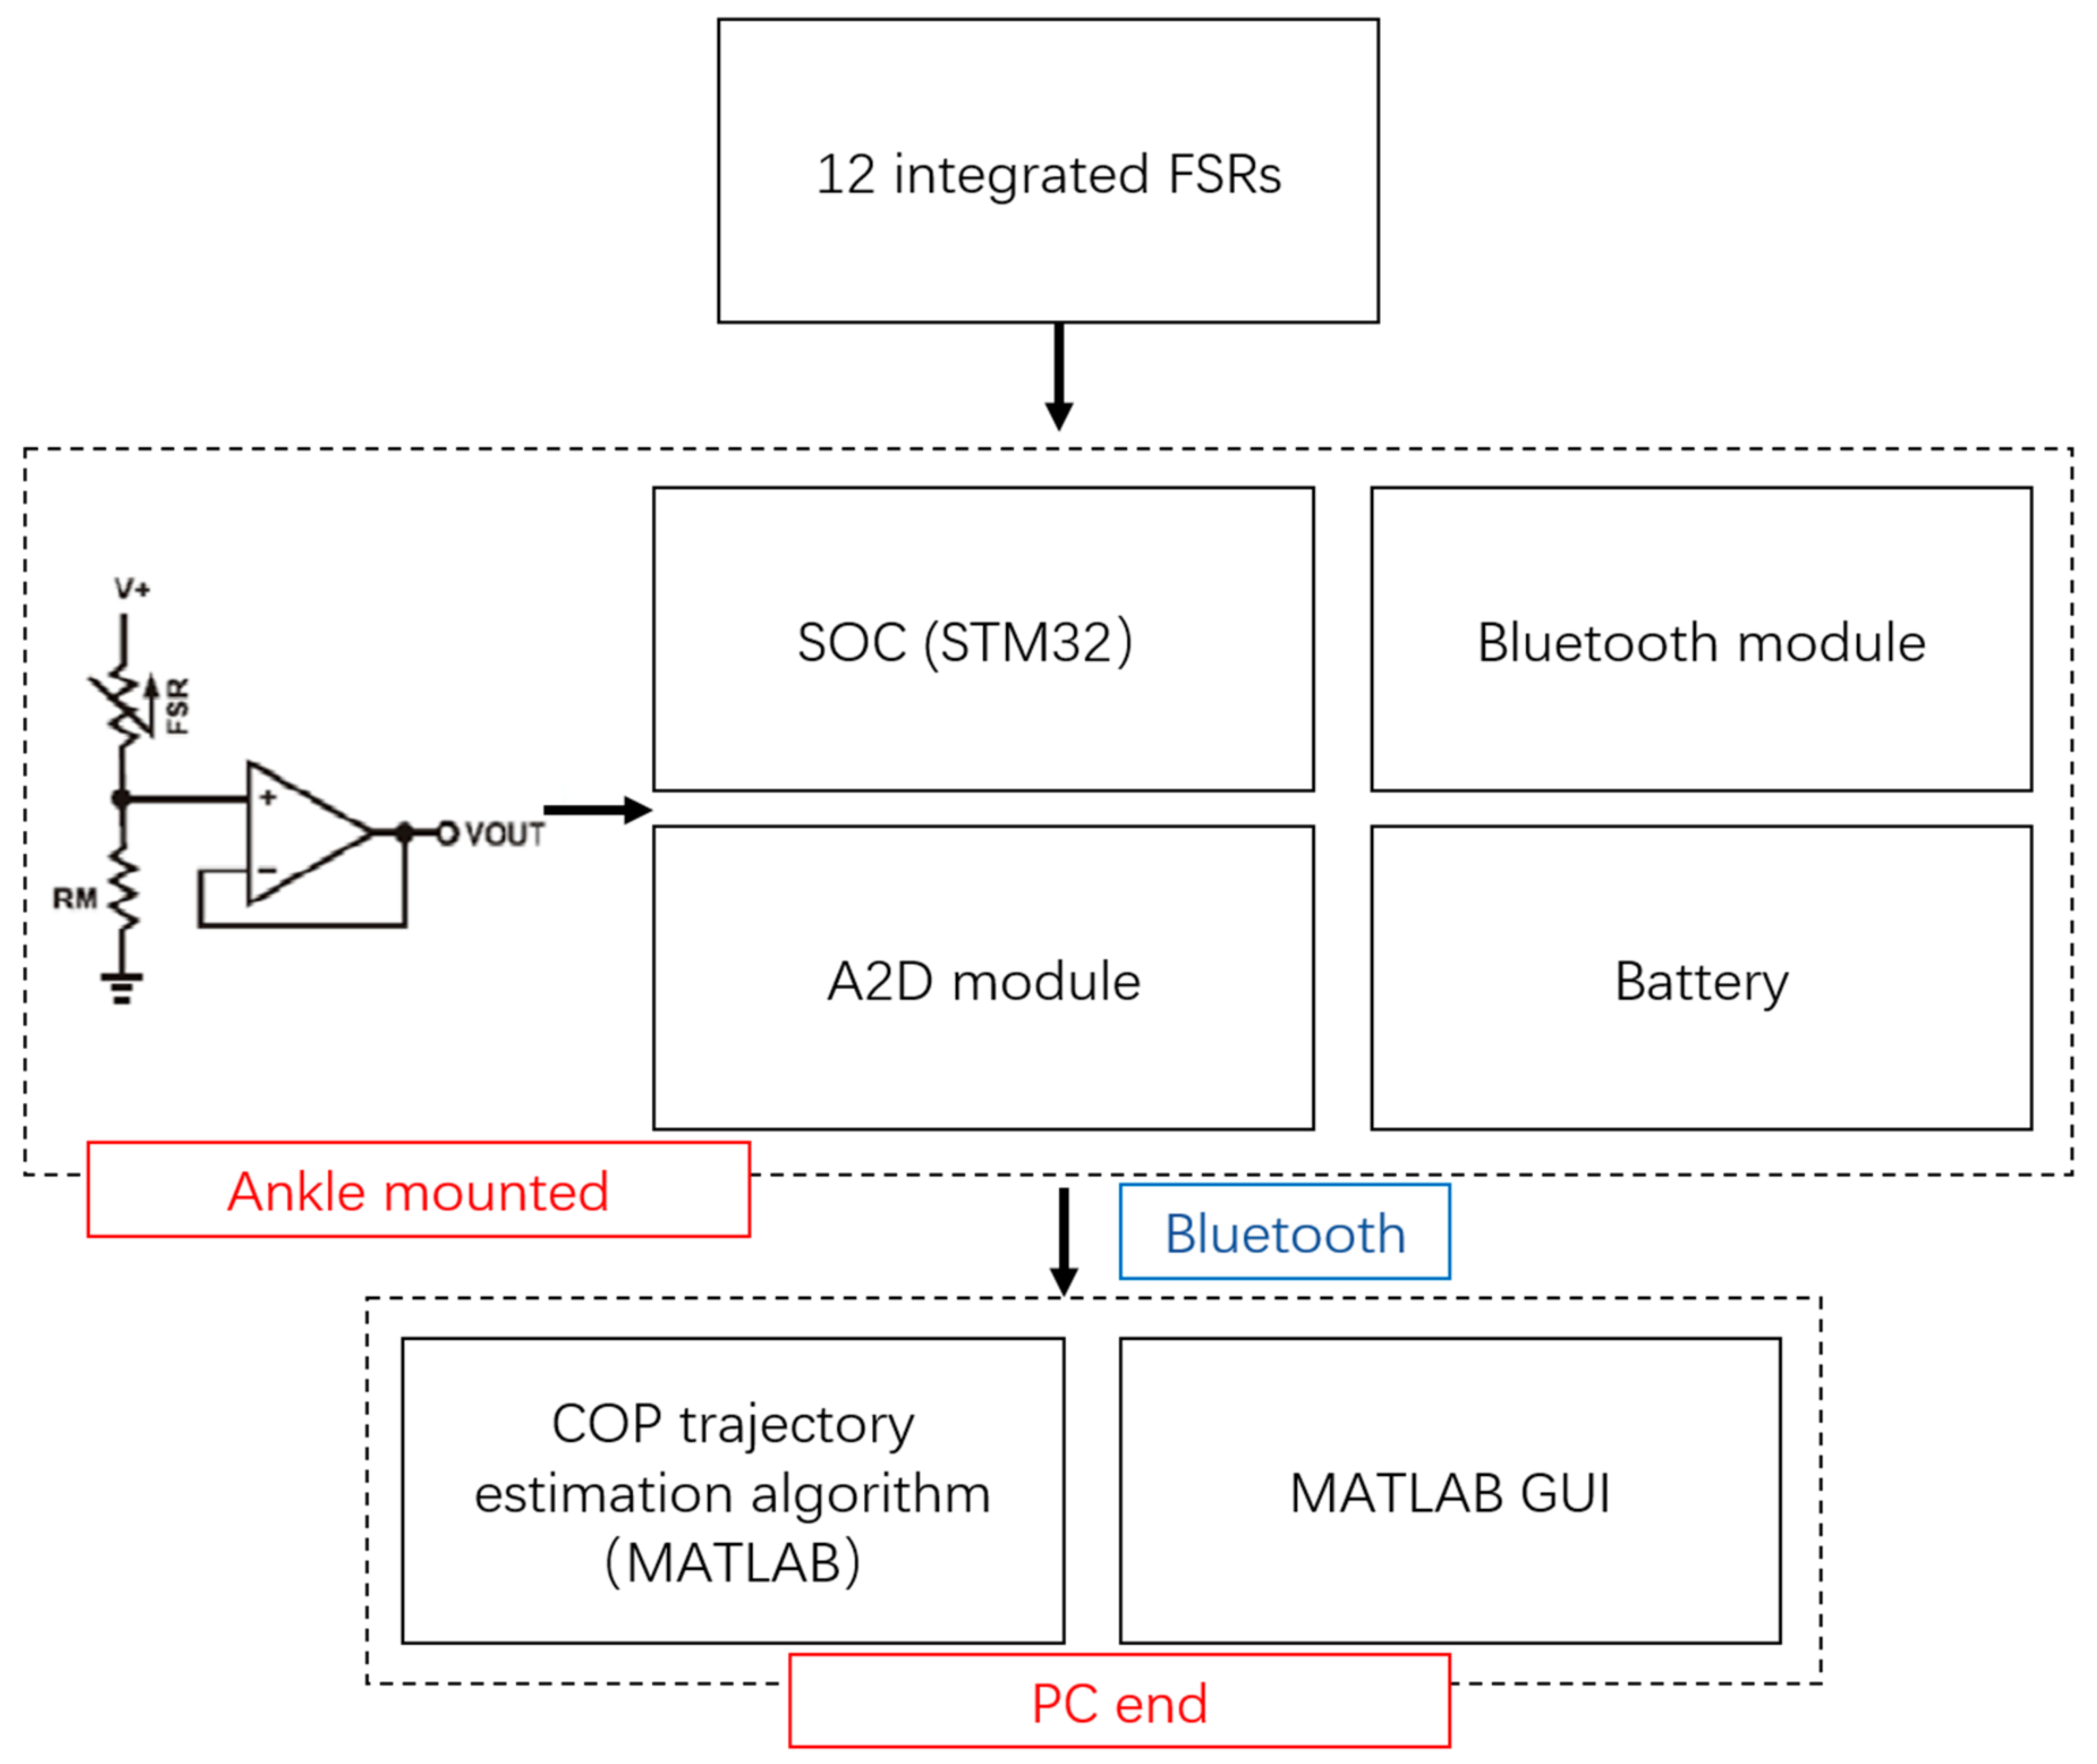
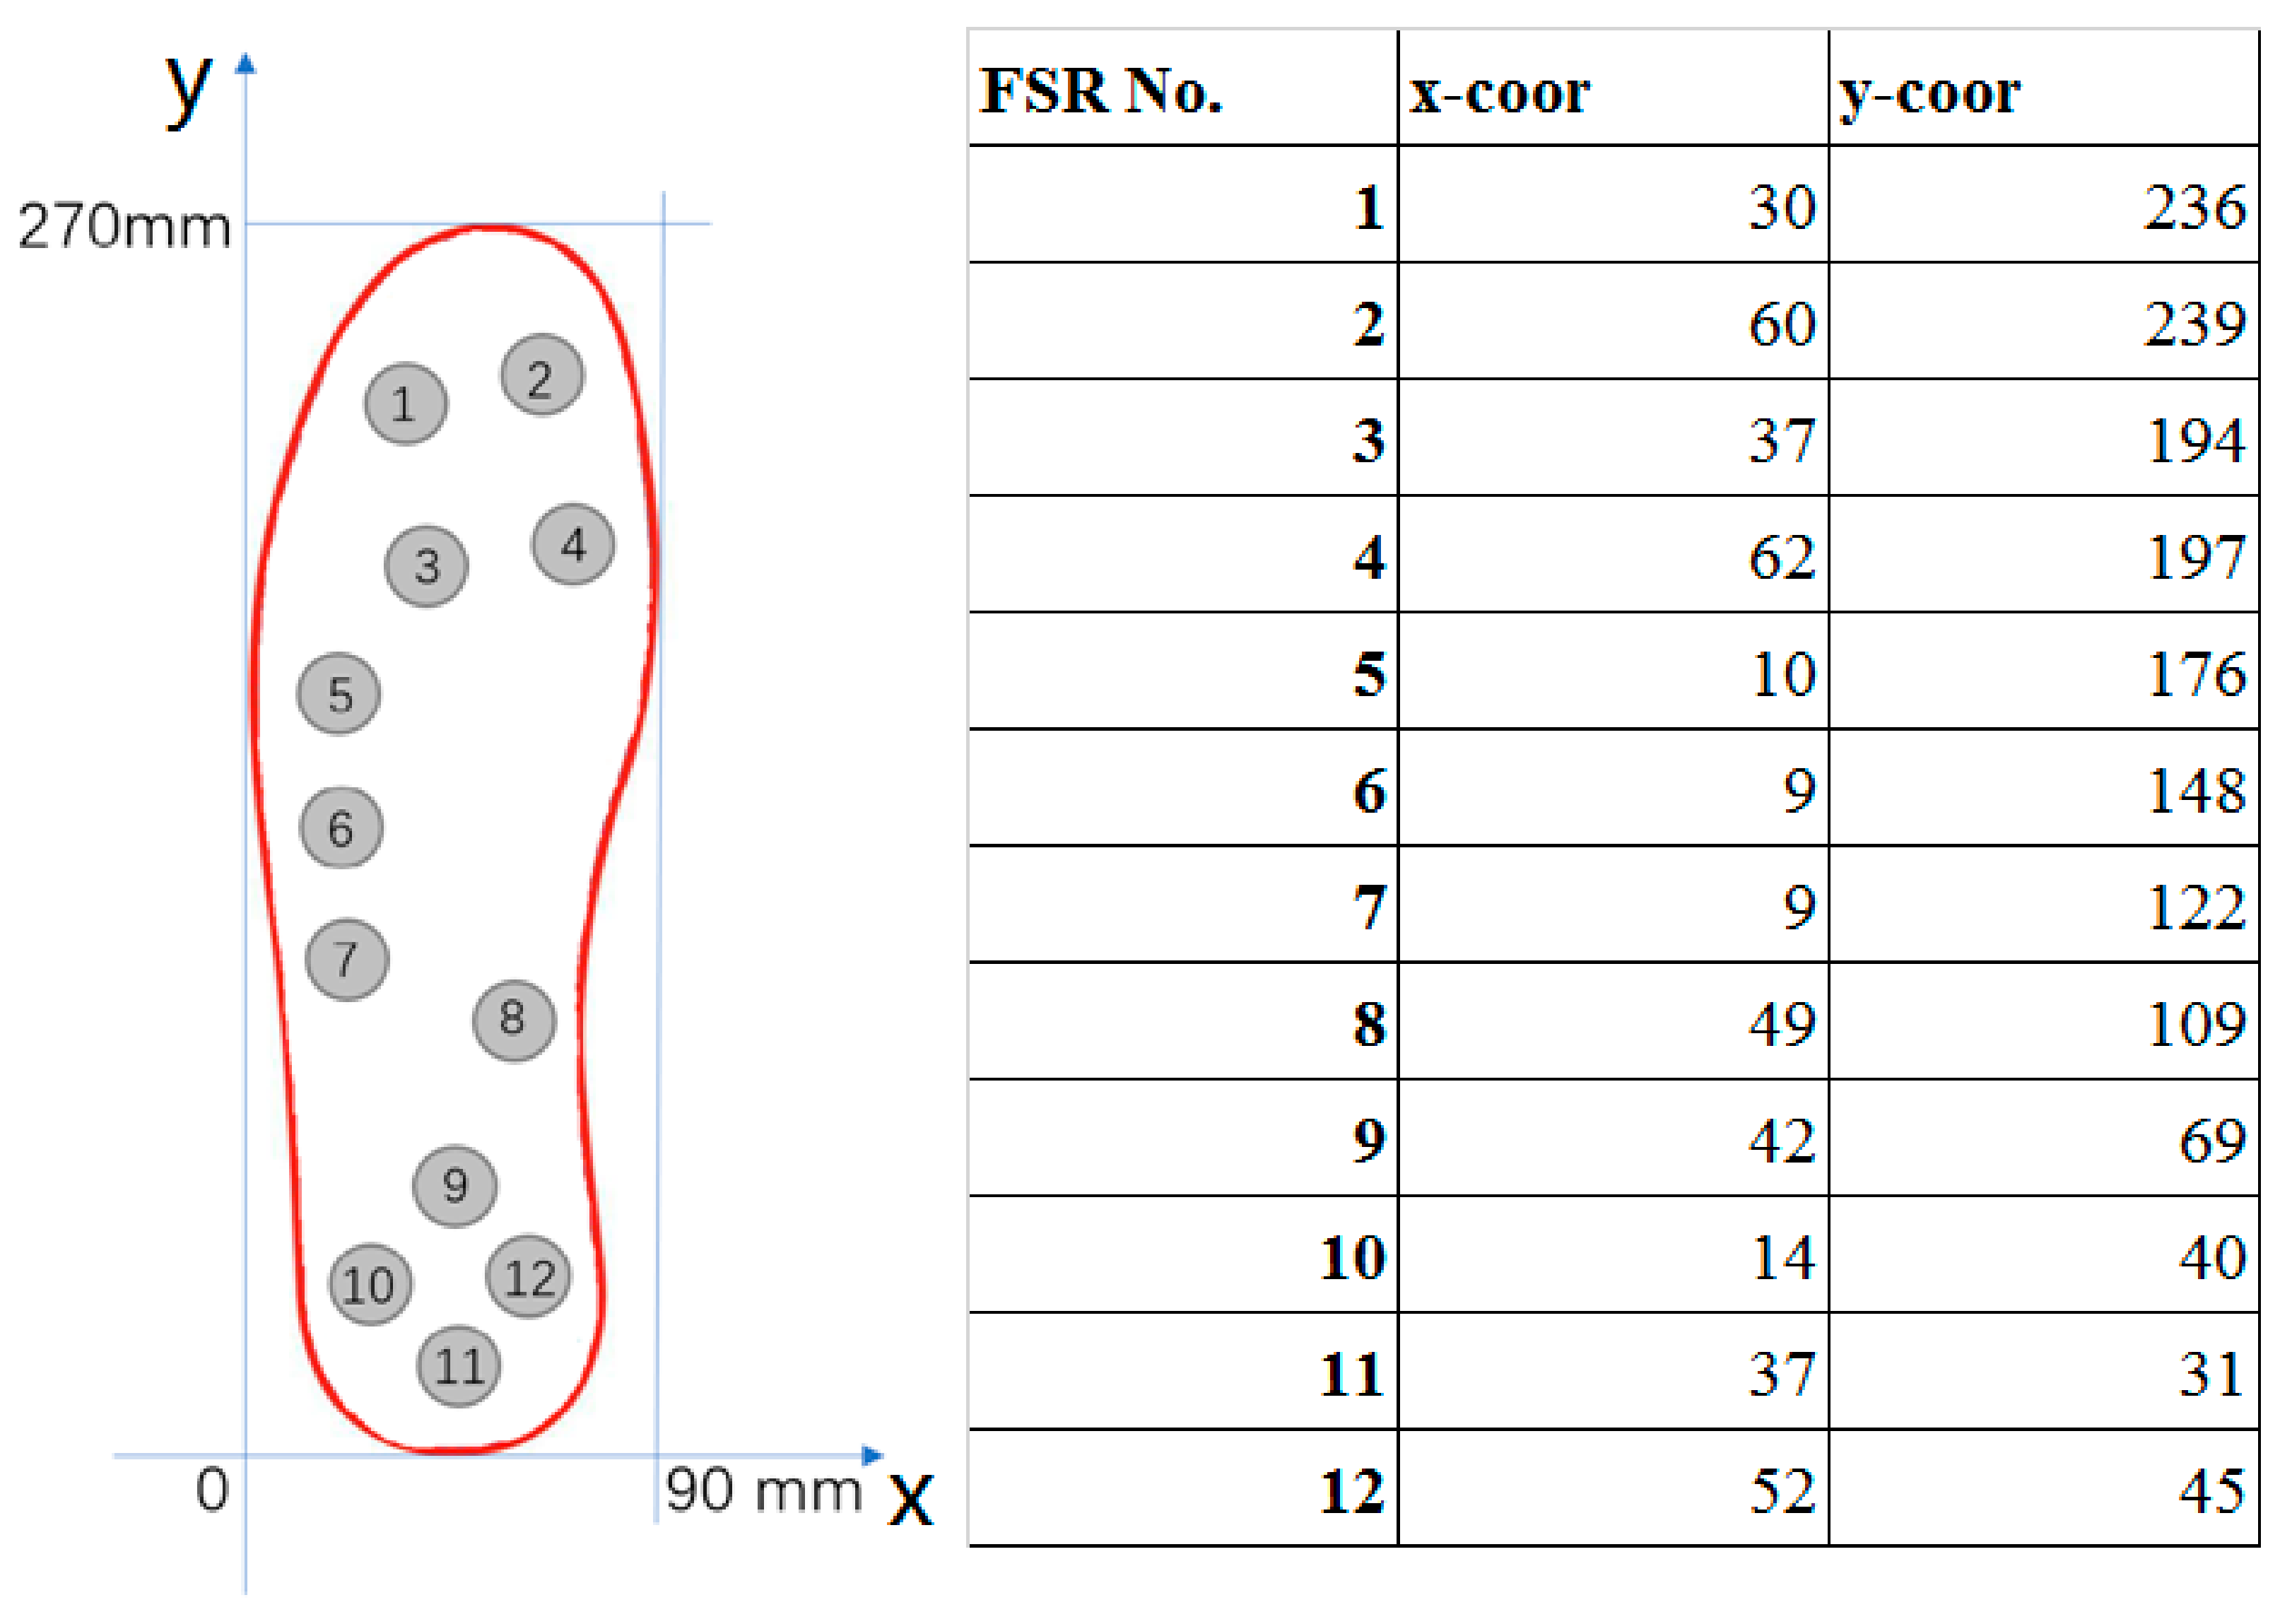
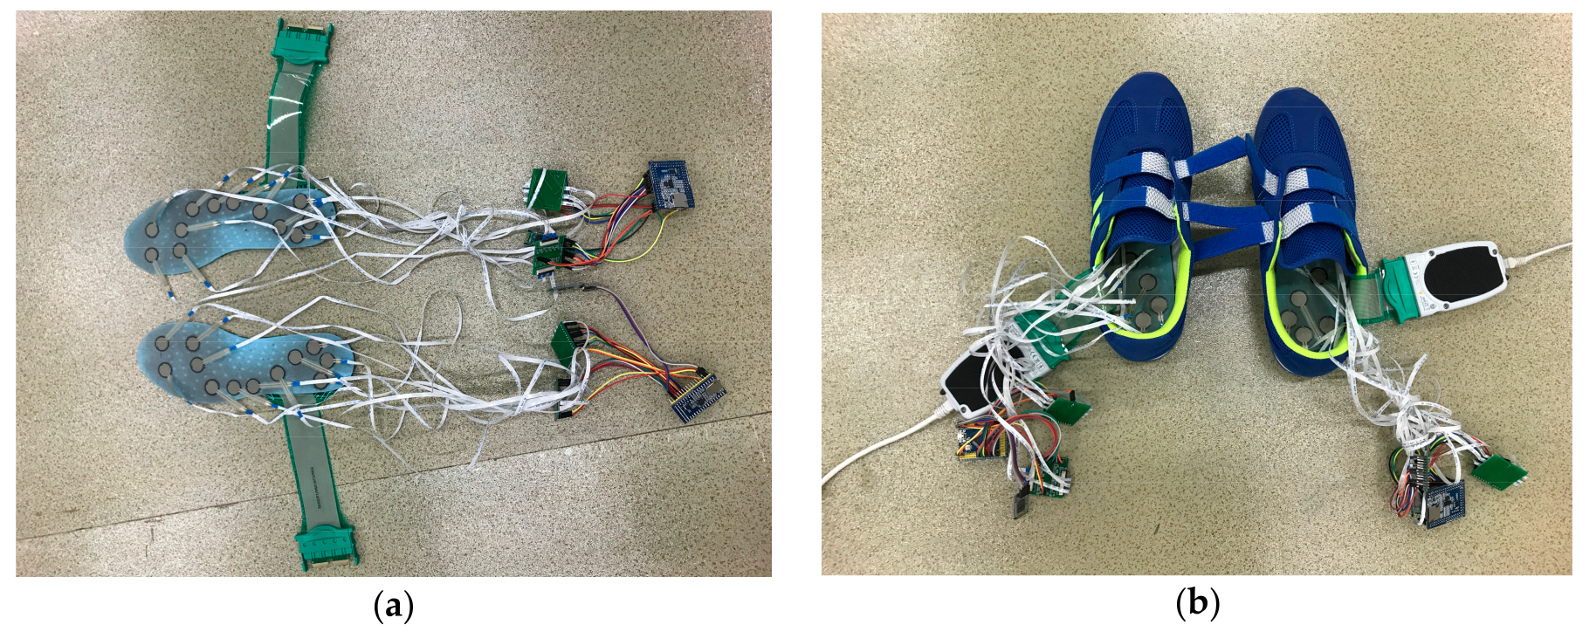
2.1. Hardware Design
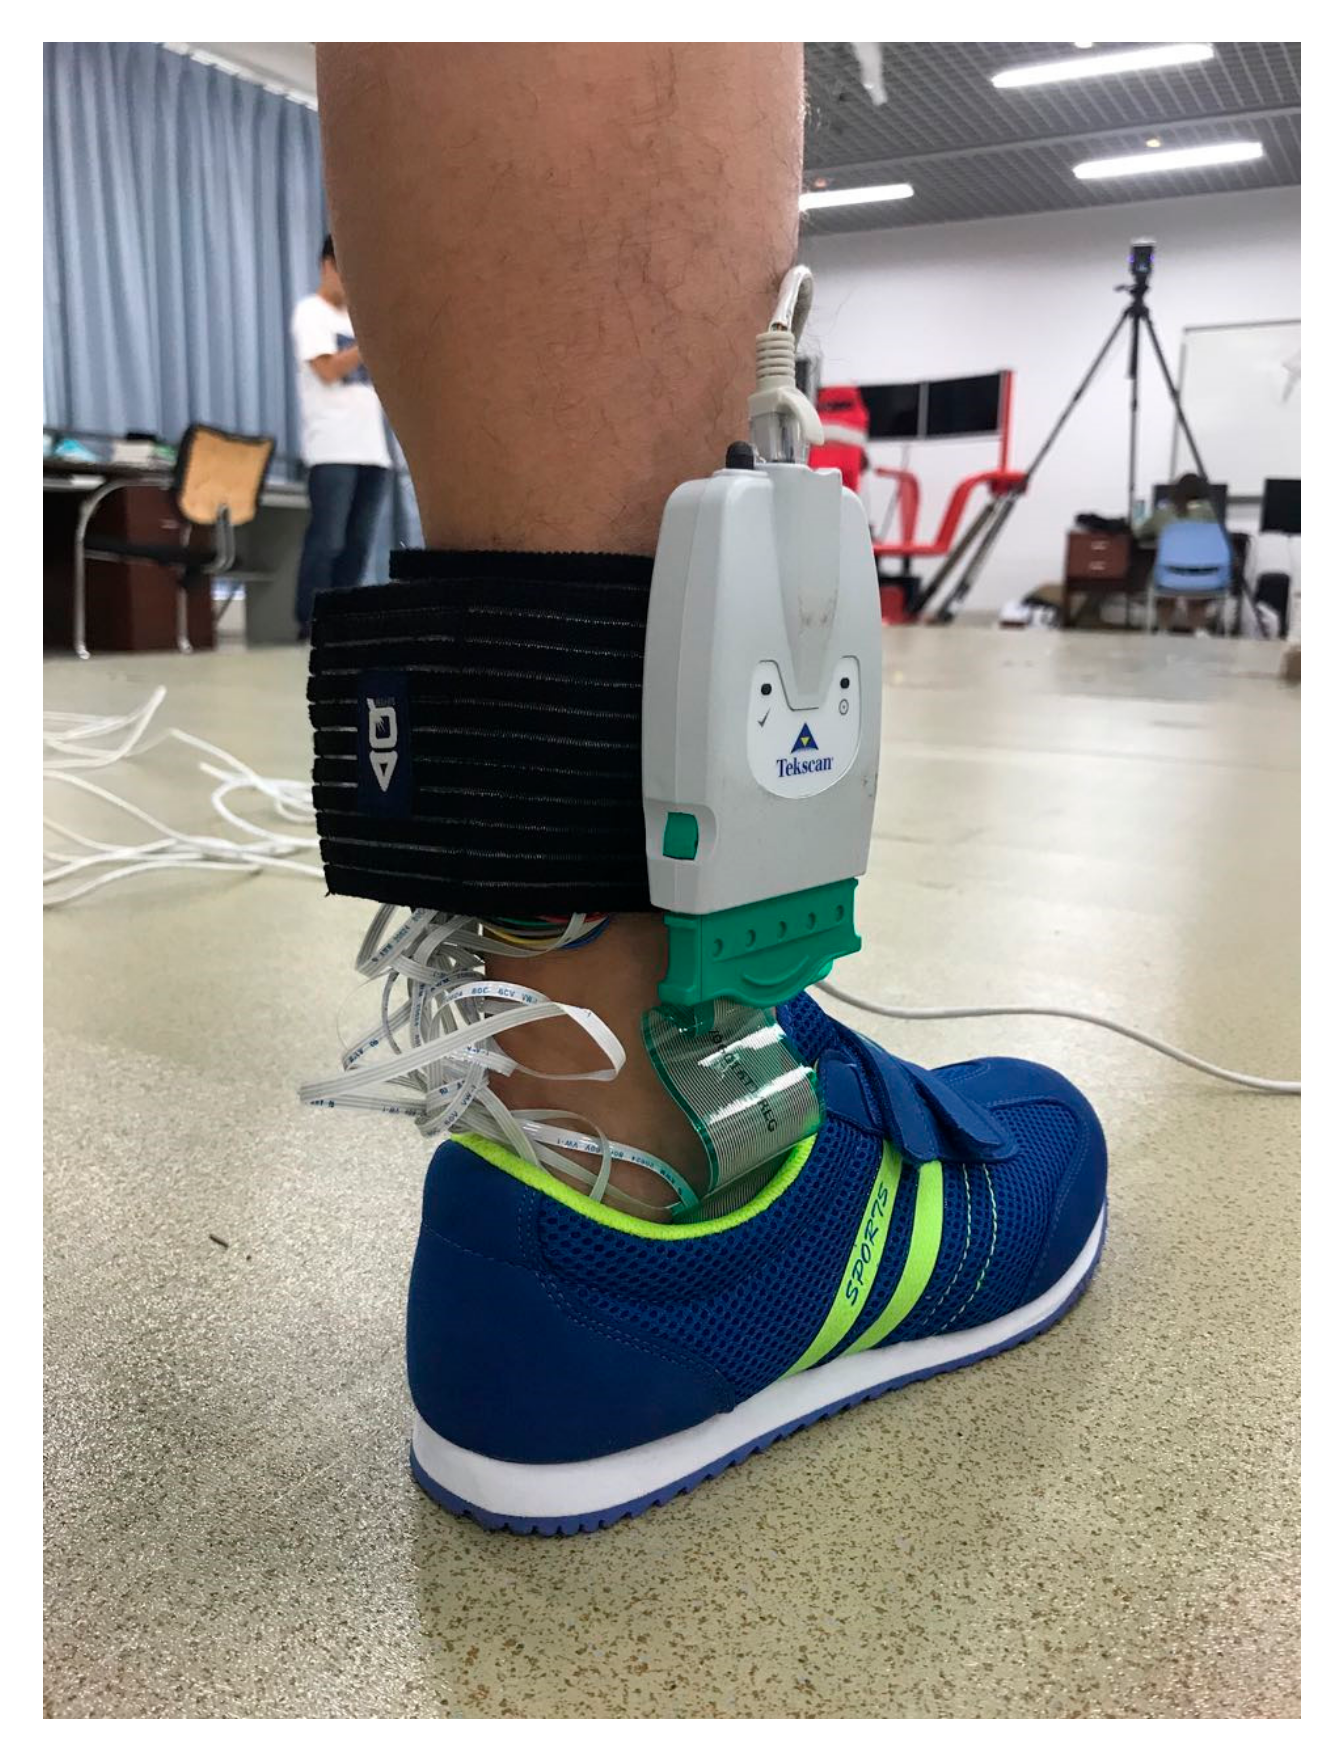
2.2. The Experiment
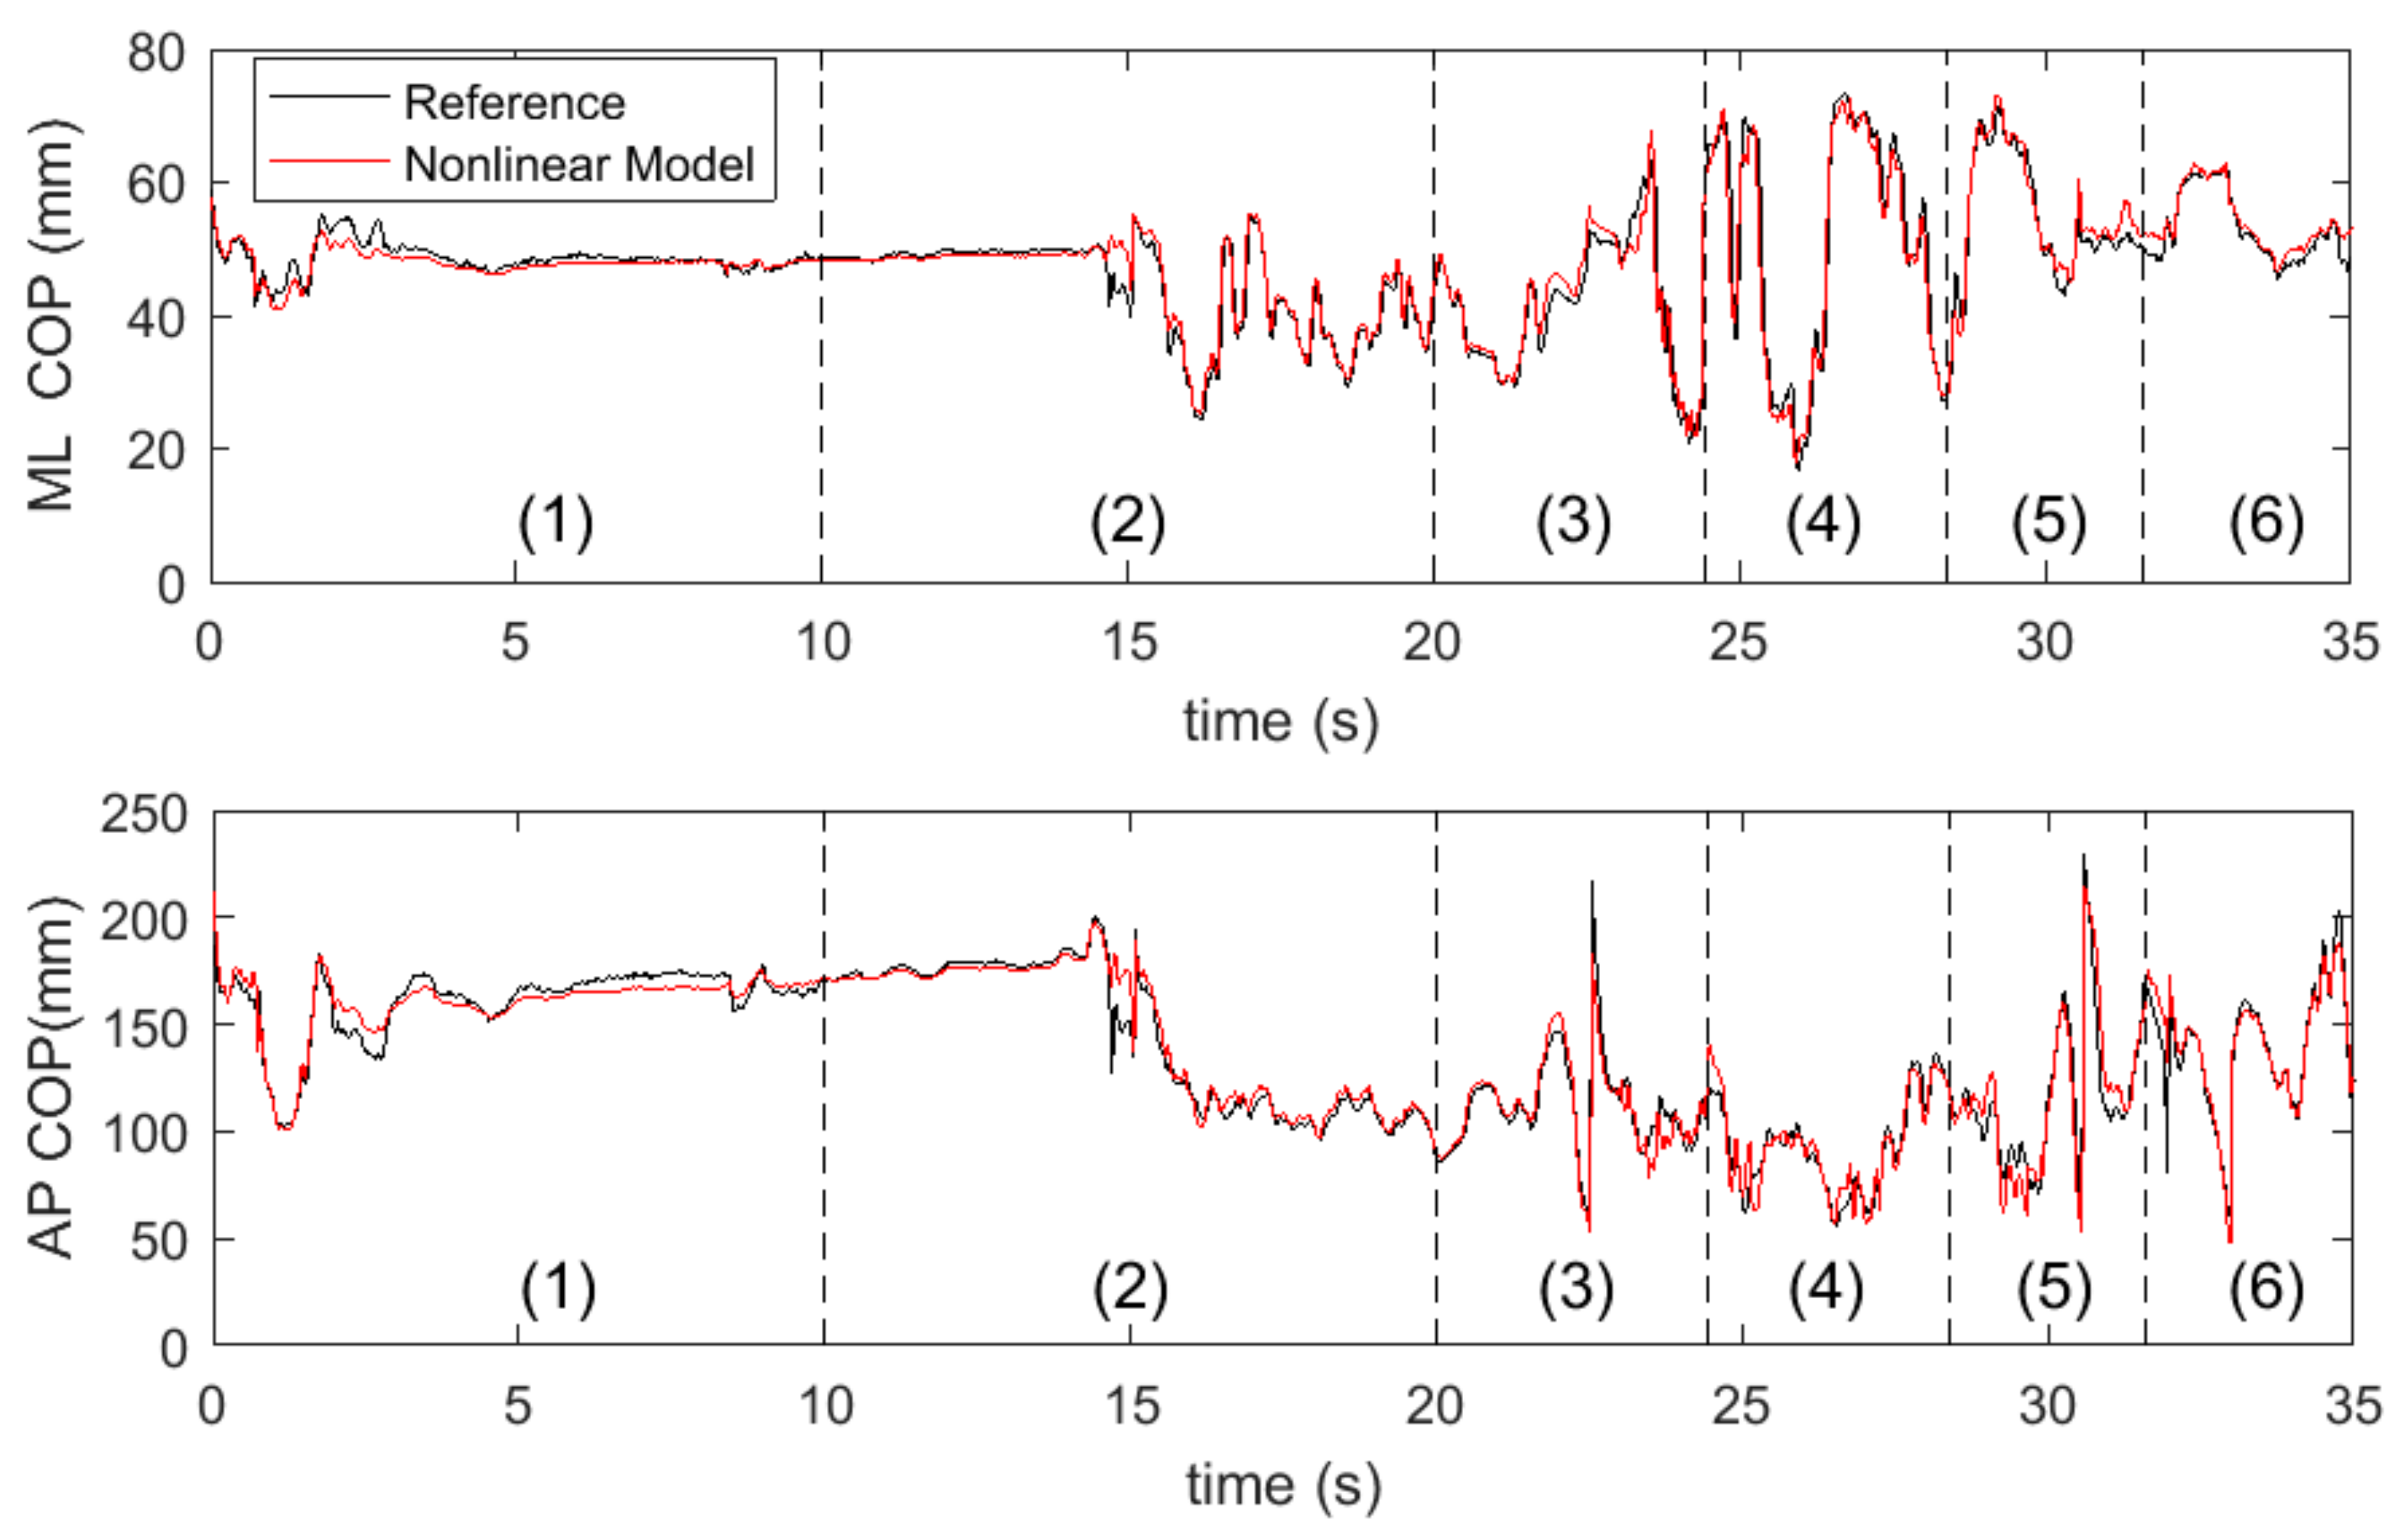
2.3. The Individual-Specific Nonlinear Model for COP Estimation
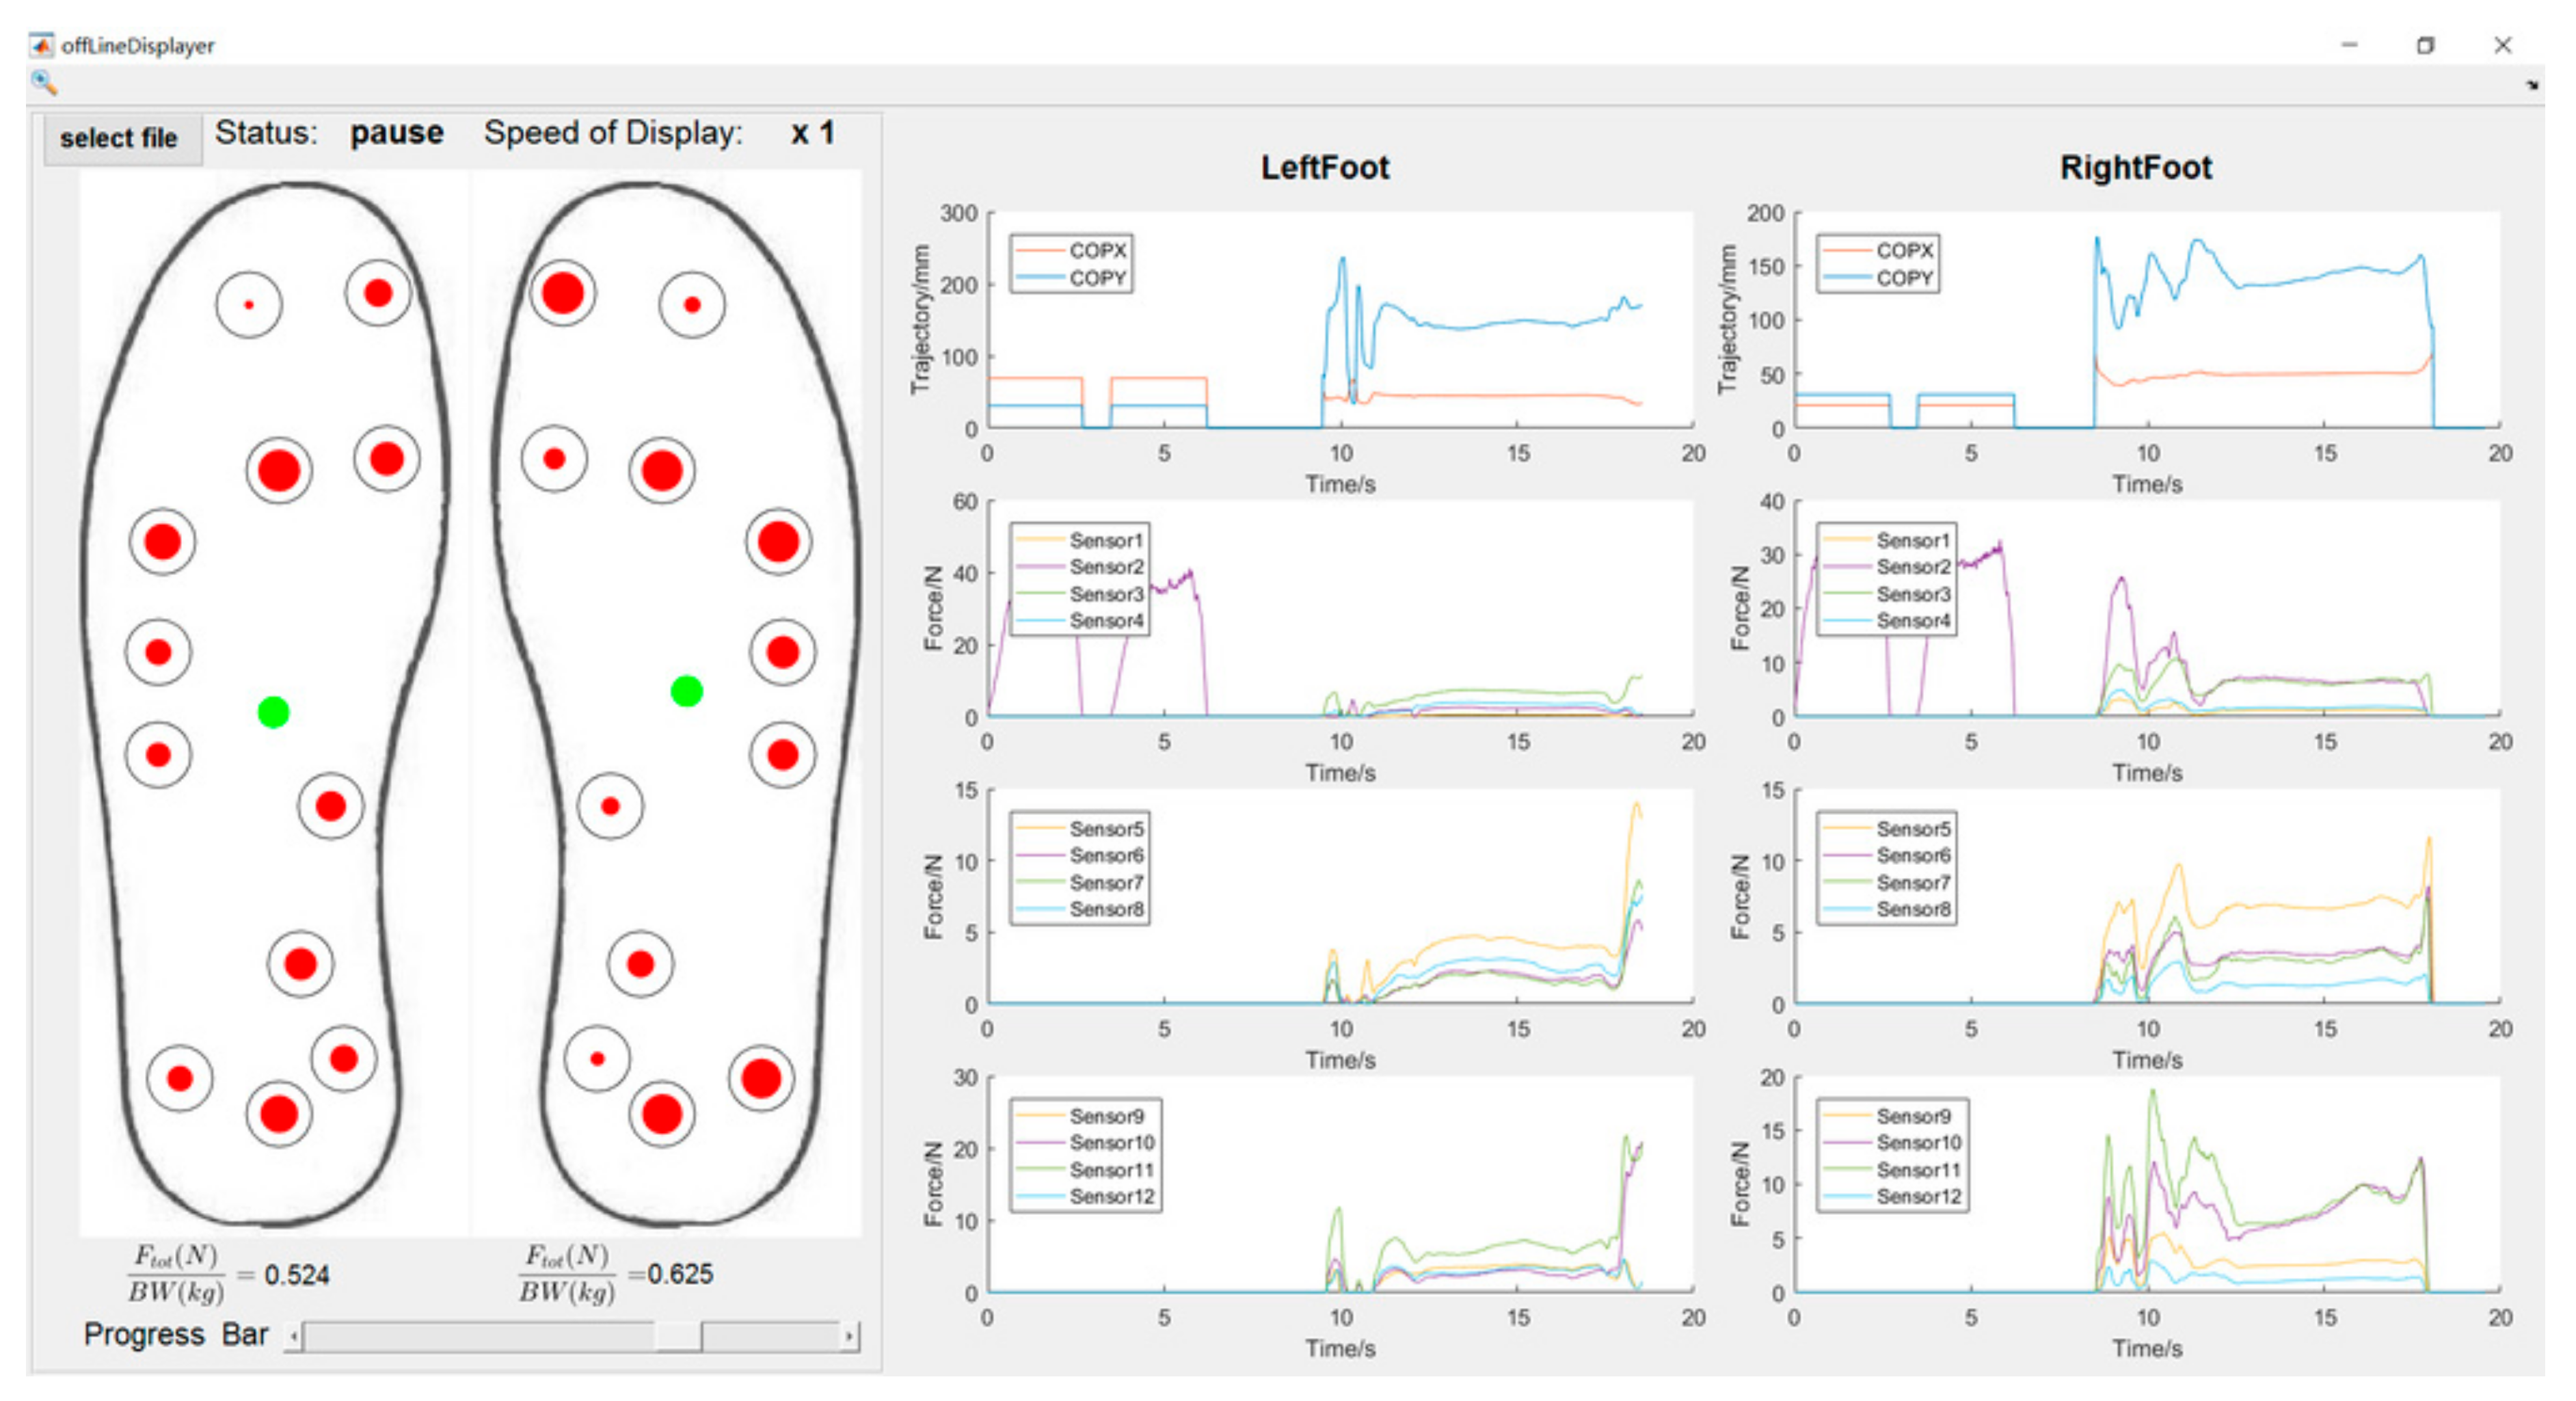
2.4. Graphic User Interface (GUI)
3. Results
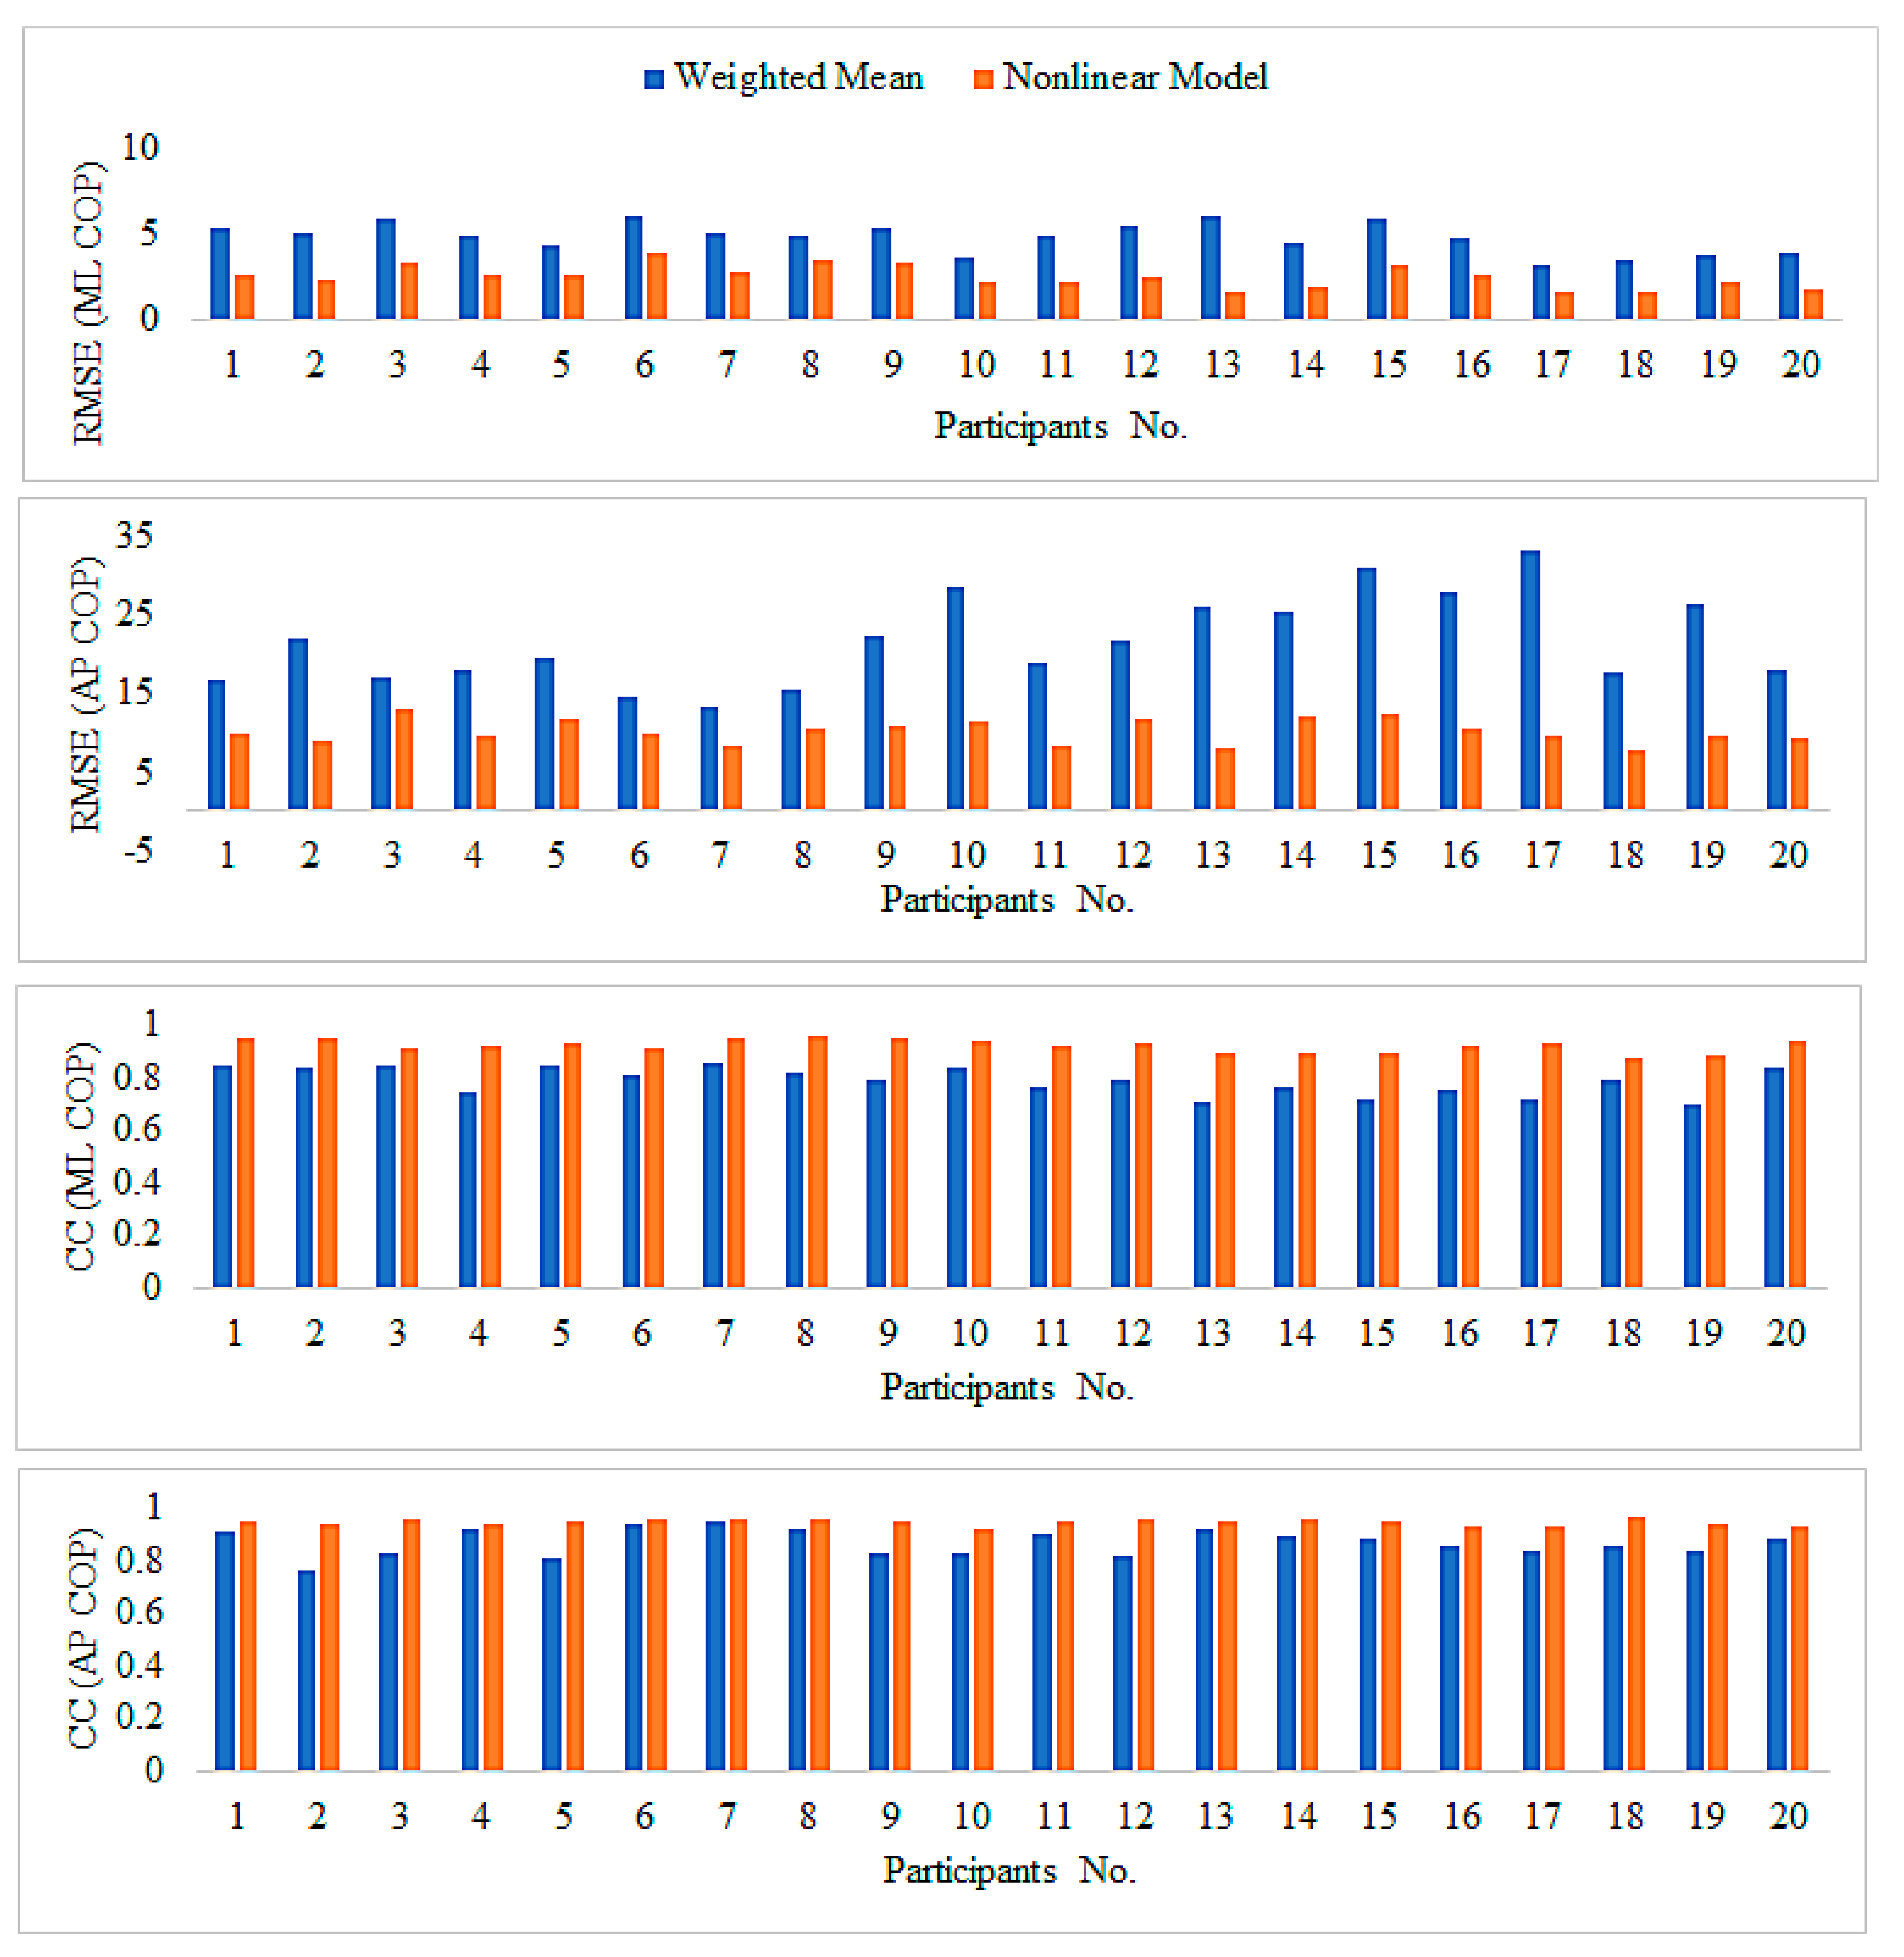
4. Discussion
5. Conclusions
Acknowledgments
Author Contributions
Conflicts of Interest
References
- Horak, F.B. Postural orientation and equilibrium: What do we need to know about neural control of balance to prevent falls? Age Ageing 2006, 35, ii7–ii11. [Google Scholar] [CrossRef] [PubMed]
- Massion, J. Postural control system. Curr. Opin. Neurobiol. 1994, 4, 877–887. [Google Scholar] [CrossRef]
- Tresch, M.C. A balanced view of motor control. Nat. Neurosci. 2007, 10, 1227–1228. [Google Scholar] [CrossRef] [PubMed]
- Lord, S.R.; Sambrook, P.N.; Gilbert, C.; Kelly, P.J.; Nguyen, T.; Webster, I.W.; Eisman, J.A. Postural stability, falls and fractures in the elderly: Results from the Dubbo Osteoporosis Epidemiology Study. Med. J. Aust. 1994, 160, 684–685. [Google Scholar] [CrossRef]
- Melzer, I.; Benjuya, N.; Kaplanski, J. Postural stability in the elderly: A comparison between fallers and non-fallers. Age Ageing 2004, 33, 602–607. [Google Scholar] [CrossRef] [PubMed]
- Nashner, L.M.; Shumway-Cook, A.; Marin, O. Stance posture control in select groups of children with cerebral palsy: Deficits in sensory organization and muscular coordination. Exp. Brain Res. 1983, 49, 393–409. [Google Scholar] [CrossRef] [PubMed]
- Benaim, C.; Pérennou, D.A.; Villy, J. Validation of a standardized assessment of postural control in stroke patients. Stroke 1999, 30, 862–1868. [Google Scholar] [CrossRef]
- Horak, F.B.; Nutt, J.G.; Nashner, L.M. Postural inflexibility in parkinsonian subjects. J. Neurol. Sci. 1992, 111, 46–58. [Google Scholar] [CrossRef]
- Rocchi, L.; Chiari, L.; Cappello, A.; Horak, H.B. Identification of distinct characteristics of postural sway in Parkinson’s disease: A feature selection procedure based on principal component analysis. Neurosci. Lett. 2006, 394, 140–145. [Google Scholar] [CrossRef] [PubMed]
- Liu, J.; Zhang, X.; Lockhart, T.E. Fall risk assessments based on postural and dynamic stability using inertial measurement unit. Saf. Health Work 2012, 3, 192–198. [Google Scholar] [CrossRef] [PubMed]
- Lafond, D.; Corriveau, H.; Hébert, R.; Prince, F. Intrasession reliability of center of pressure measures of postural steadiness in healthy elderly people. Arch. Phys. Med. Rehabil. 2004, 85, 896–901. [Google Scholar] [CrossRef] [PubMed]
- Biswas, A.; Lemaire, E.D.; Kofman, J. Dynamic gait stability index based on plantar pressures and fuzzy logic. J. Biomech. 2008, 41, 1574–1581. [Google Scholar] [CrossRef] [PubMed]
- Van Dijk, M.M.; Meyer, S.; Sandstad, S.; Wiskerke, E.; Thuwis, R.; Vandekerckhove, C.; Myny, C.; Ghosh, N.; Beyens, H.; Dejaeger, E.; et al. A cross-sectional study comparing lateral and diagonal maximum weight shift in people with stroke and healthy controls and the correlation with balance, gait and fear of falling. PLoS ONE 2017, 12, e0183020. [Google Scholar] [CrossRef] [PubMed]
- Sawacha, Z.; Carraro, E.; Contessa, P.; Guiotto, A.; Masiero, S.; Cobelli, C. Relationship between clinical and instrumental balance assessments in chronic post-stroke hemiparesis subjects. J. Neuroeng. Rehabil. 2013, 10, 95. [Google Scholar] [CrossRef] [PubMed]
- Sawacha, Z.; Carraro, E.; Din, S.D.; Guiotto, A.; Bonaldo, L.; Punzi, L.; Cobelli, C.; Masiero, S. Biomechanical assessment of balance and posture in subjects with ankylosing spondylitis. J. Neuroeng. Rehabil. 2012, 9, 63. [Google Scholar] [CrossRef] [PubMed]
- Johansson, J.; Nordstrom, A.; Gustafson, Y.; Westling, G.; Nordstrom, P. Increased postural sway during quiet stance as a risk factor for prospective falls in community-dwelling elderly individuals. Age Aging 2017, 46, 946–970. [Google Scholar] [CrossRef] [PubMed]
- Robertson, G.; Caldwell, G.; Hamill, J.; Kamen, G.; Whittlesey, S. Research Methods in Biomechanics, 2nd ed.; Human Kinetics: Champaign, IL, USA, 2013. [Google Scholar]
- Klenk, J.; Schwickert, L.; Palmerini, L.; Mellone, S.; Bourke, A.; Ihlen, E.A.F.; Kerse, N.; Hauer, K.; Pijnappels, M.; Synofzik, M.; et al. The FARSEEING real-world fall repository: A large-scale collaborative database to collect and share sensor signals from real-world falls. Eur. Rev. Aging Phys. Act. 2016, 13, 8. [Google Scholar] [CrossRef] [PubMed]
- Bagala, F.; Klenk, J.; Cappello, A.; Chiari, L.; Becker, C.; Lindemann, U. Quantitative description of the lie-to-sit-to-stand-to-walk transfer by a single body-fixed sensor. IEEE Trans. Neural Syst. Rehabil. Eng. 2013, 21, 624–633. [Google Scholar] [CrossRef] [PubMed]
- Klenk, J.; Becker, C.; Lieken, F.; Nicolai, S.; Maetzler, W.; Alt, W.; Zijlstra, W.; Hausdorff, J.M.; van Lummel, R.C.; Chiari, L.; et al. Comparison of acceleration signals of simulated and real-world backward falls. Med. Eng. Phys. 2011, 33, 368–373. [Google Scholar] [CrossRef] [PubMed]
- Becker, C.; Schwickert, L.; Mellone, S.; Bagala, F.; Chiari, L.; Helbostad, J.L.; Zijlstra, W.; Aminian, K.; Bourke, A.; Todd, C.; et al. Proposal for a multiphase fall model based on real-world fall recordings with body-fixed sensors. Z. Gerontol. Geriatr. 2012, 45, 707–715. [Google Scholar] [CrossRef] [PubMed]
- Bagala, F.; Becker, C.; Cappello, A.; Chiari, L.; Aminian, K.; Hausdorff, J.M.; Zijlstra, W.; Klenk, J. Evaluation of accelerometer-based fall detection algorithms on real-world falls. PLoS ONE 2012, 7, e37062. [Google Scholar] [CrossRef] [PubMed]
- Mellone, S.; Tacconi, C.; Schwickert, L.; Klenk, J.; Becker, C.; Chiari, L. Smartphone-based solutions for fall detection and prevention: The FARSEEING approach. Z. Gerontol. Geriatr. 2012, 45, 722–727. [Google Scholar] [CrossRef] [PubMed]
- Chesnin, K.J.; Selby-Silverstein, L.; Besser, M.P. Comparison of an in-shoe pressure measurement device to a force plate: Concurrent validity of center of pressure measurements. Gait Posture 2000, 12, 128–133. [Google Scholar] [CrossRef]
- Forner-Cordero, A.; Koopman, H.J.F.M.; van der Helm, F.C.T. Use of pressure insoles to calculate the complete ground reaction forces. J. Biomech. 2004, 37, 1427–1432. [Google Scholar] [CrossRef] [PubMed]
- Forner-Cordero, A.; Koopman, H.J.F.M.; van der Helm, F.C.T. Inverse dynamics calculations during gait with restricted ground reaction force information from pressure insoles. Gait Posture 2006, 23, 189–199. [Google Scholar] [CrossRef] [PubMed]
- Liedtke, C.; Fokkenrood, W.; Menger, T.; van der Kooij, H.; Veltink, H. Evaluation of instrumented shoes for ambulatory assessment of ground reaction forces. Gait Posture 2007, 26, 39–47. [Google Scholar] [CrossRef] [PubMed]
- Shu, L.; Hua, T.; Wang, Y.; Li, Q.; Feng, D.D.; Tao, X. In-shoe plantar pressure measurement and analysis system based on fabric pressure sensing array. IEEE Trans. Inf. Technol. Biomed. 2010, 14, 767–775. [Google Scholar] [PubMed]
- Dyer, P.S.; Bamberg, S.J.M. Instrumented insole vs. force plate: A comparison of center of plantar pressure. In Proceedings of the 2011 IEEE Annual International Conference of Engineering in Medicine and Biology Society, Boston, MA, USA, 30 August–3 September 2011; pp. 6805–6809. [Google Scholar]
- Crea, S.; Donati, M.; De Rossi, S.M.M.; Oddo, C.M.; Vitiello, N. A wireless flexible sensorized insole for gait analysis. Sensors 2014, 14, 1073–1093. [Google Scholar] [CrossRef] [PubMed]
- Ayena, J.C.; Otis, M.J.; Menelas, B.A. An efficient home-based risk of falling assessment test based on Smartphone and instrumented insole. In Proceedings of the IEEE International Symposium on Medical Measurements and Applications (MeMeA), Turin, Italy, 7–9 May 2015; pp. 416–421. [Google Scholar]
- Lin, F.; Wang, A.; Zhuang, Y.; Tomita, M.R.; Xu, W. Smart Insole: A wearable sensor device for unobtrusive gait monitoring in daily life. IEEE Trans. Ind. Inform. 2016, 12, 2281–2291. [Google Scholar] [CrossRef]
- Claverie, L.; Ille, A.; Moretto, P. Discrete sensors distribution for accurate plantar pressure analyses. Med. Eng. Phys. 2016, 38, 1489–1494. [Google Scholar] [CrossRef] [PubMed]
- Howell, A.M.; Kobayashi, T.; Hayes, H.A.; Foreman, K.B.; Bamberg, S.J.M. Kinetic gait analysis using a low-cost insole. IEEE Trans. Biomed. Eng. 2013, 60, 3284–3290. [Google Scholar] [CrossRef] [PubMed]
- Hall, R.S.; Desmoulin, G.T.; Milner, T.E. A technique for conditioning and calibrating force-sensing resistors for repeatable and reliable measurement of compressive force. J. Biomech. 2008, 41, 3492–3495. [Google Scholar] [CrossRef] [PubMed]
- Interlink. Available online: https://www.interlinkelectronics.com/datasheets/Datasheet_FSR.pdf (assessed on 10 August 2017).
- Chen, B.; Bates, B.T. Comparison of F-Scan in-sole and AMTI forceplate system in measuring vertical ground reaction force during gait. Physiother. Theory Pract. 2000, 16, 43–53. [Google Scholar] [CrossRef]
- Cavanagh, P.R.; Ae, M. A technique for the display of pressure distributions beneath the foot. J. Biomech. 1980, 13, 69–75. [Google Scholar] [CrossRef]
- Bickel, P.J.; Doksum, K.A. Mathematical Statistics: Basic Ideas and Selected Topics; Prentice Hall: Upper Saddle River, NJ, USA, 1977. [Google Scholar]
- Ma, C.Z.H.; Wong, D.W.C.; Lam, W.K.; Wan, A.H.P.; Lee, W.C.C. Balance improvement effects of biofeedback systems with state-of-the-art wearable sensors: A systematic review. Sensors 2016, 16, 434. [Google Scholar] [CrossRef] [PubMed]
- Prudham, D.; Evans, J. Factors associated with falls in the elderly: A community study. Age Ageing 1981, 10, 141–146. [Google Scholar] [CrossRef] [PubMed]
- Tinetti, M.; Speechley, M.; Cinter, S. Risk factors for falls among elderly persons living in the community. N. Engl. J. Med. 1988, 319, 1701–1707. [Google Scholar] [CrossRef] [PubMed]
- Palumbo, P.; Klenk, J.; Cattelani, L.; Bandinelli, S.; Ferrucci, L.; Rapp, K.; Chiari, L.; Rothenbacher, D. Predictive performance of a fall risk assessment tool for community-dwelling older people(FRAT-up) in 4 European cohorts. J. Am. Med. Dir. Assoc. 2016, 17, 1106–1113. [Google Scholar] [CrossRef] [PubMed]
- Palumbo, P.; Palmerini, L.; Bandinelli, S.; Chiari, L. Fall risk assessment tools for elderly living in the community: Can we do better? PLoS ONE 2015, 10, e0146247. [Google Scholar] [CrossRef] [PubMed]
- Cattelani, L.; Palumbo, P.; Palmerini, L.; Bandinelli, S.; Becker, C.; Chesani, F.; Chiari, L. FRAT-up, a web-based fall-risk assessment tool for elderly people living in the community. J. Med. Internet Res. 2015, 17, e41. [Google Scholar] [CrossRef] [PubMed]
- Palumbo, P.; Palmerini, L.; Chiari, L. A probabilistic model to investigate the properties of prognostic tools for fall. Methods Inf. Med. 2015, 54, 189–197. [Google Scholar] [CrossRef] [PubMed]


| Medial-Lateral (ML) COP | Anterior-Posterior (AP) COP | ||||||
|---|---|---|---|---|---|---|---|
| Overlapping | No Overlapping | p-Value | Overlapping | No Overlapping | p-Value | ||
| Task 1 | COP range (mm) | 2.5 ± 0.3 | 3.5 ± 0.2 | 0.83 | 6.9 ± 2.5 | 5.4 ± 2.1 | 0.54 |
| Mean COP (mm) | 42.4 ± 1.4 | 46.3 ± 3.2 | 0.19 | 189.8 ± 2.6 | 192.3 ± 2.3 | 0.73 | |
| Task 2 | COP range (mm) | 8.7 ± 1.2 | 7.7 ± 1.3 | 0.55 | 16.4 ± 3.0 | 13.0 ± 3.5 | 0.55 |
| Mean COP (mm) | 45.2 ± 7.2 | 47.9 ± 6.4 | 0.18 | 193.9 ± 1.6 | 196.7 ± 2.4 | 0.18 | |
| Task 3 | COP range (mm) | 15.4 ± 1.7 | 12.5 ± 1.9 | 0.89 | 67.0 ± 18.3 | 68.6 ± 22.1 | 0.81 |
| Mean COP (mm) | 45.7 ± 0.7 | 50.1 ± 1.5 | 0.30 | 187.3 ± 18.8 | 186.9 ± 14.3 | 0.91 | |
| Task 4 | COP range (mm) | 16.3 ± 1.9 | 14.5 ± 2.2 | 0.74 | 70.4 ± 15.3 | 74.6 ± 19.2 | 0.66 |
| Mean COP (mm) | 48.4 ± 3.5 | 49.0 ± 4.7 | 0.25 | 186.9 ± 13.8 | 183.7 ± 15.5 | 0.96 | |
| Task 5 | COP range (mm) | 13.4 ± 3.3 | 14.9 ± 4.5 | 0.12 | 73.2 ± 11.5 | 70.0 ± 14.7 | 0.81 |
| Mean COP (mm) | 45.1 ± 5.7 | 48.7 ± 3.1 | 0.06 | 208.7 ± 29.2 | 200.7 ± 22.1 | 0.78 | |
| Task 6 | COP range (mm) | 12.8 ± 1.5 | 15.1 ± 2.0 | 0.83 | 70.6 ± 10.9 | 74.3 ± 11.8 | 0.86 |
| Mean COP (mm) | 47.5 ± 0.8 | 43.9 ± 0.9 | 0.13 | 204.8 ± 9.5 | 213.2 ± 9.8 | 0.62 | |
| Participants | RMSE (mm) | CC | MaxE (mm) | MinE (mm) | ||||||||||||
|---|---|---|---|---|---|---|---|---|---|---|---|---|---|---|---|---|
| Left AP | Left ML | Right AP | Right ML | Left AP | Left ML | Right AP | Right ML | Left AP | Left ML | Right AP | Right ML | Left AP | Left ML | Right AP | Right ML | |
| 1 | 5.9 | 2.4 | 4.7 | 2.8 | 0.93 | 0.97 | 0.76 | 0.93 | 15.8 | 6.7 | 16.1 | 11.4 | 0.0 | 0.1 | 0.0 | 0.0 |
| 2 | 6.0 | 1.7 | 4.0 | 3.0 | 0.82 | 0.93 | 0.85 | 0.97 | 15.4 | 8.8 | 15.6 | 7.7 | 0.0 | 0.1 | 0.0 | 0.0 |
| 3 | 4.9 | 3.0 | 6.9 | 3.5 | 0.85 | 0.92 | 0.83 | 0.91 | 18.5 | 6.7 | 24.0 | 13.8 | 0.1 | 0.0 | 0.1 | 0.1 |
| 4 | 6.2 | 2.6 | 3.6 | 2.6 | 0.64 | 0.91 | 0.85 | 0.93 | 16.4 | 6.0 | 20.3 | 11.7 | 0.1 | 0.1 | 0.1 | 0.0 |
| 5 | 3.8 | 2.7 | 4.6 | 2.6 | 0.76 | 0.90 | 0.93 | 0.96 | 15.8 | 10.3 | 14.8 | 12.5 | 0.0 | 0.0 | 0.0 | 0.1 |
| 6 | 4.4 | 4.0 | 7.6 | 3.8 | 0.71 | 0.86 | 0.91 | 0.95 | 21.1 | 12.5 | 21.7 | 12.6 | 0.0 | 0.0 | 0.0 | 0.1 |
| 7 | 3.8 | 2.2 | 6.1 | 3.2 | 0.96 | 0.97 | 0.75 | 0.93 | 14.8 | 9.8 | 18.1 | 11.9 | 0.0 | 0.0 | 0.0 | 0.1 |
| 8 | 3.9 | 2.2 | 5.8 | 4.6 | 0.90 | 0.98 | 0.74 | 0.93 | 14.7 | 7.8 | 23.5 | 7.7 | 0.0 | 0.1 | 0.1 | 0.0 |
| 9 | 4.0 | 2.5 | 6.5 | 4.2 | 0.91 | 0.97 | 0.67 | 0.93 | 13.0 | 8.3 | 22.6 | 6.4 | 0.1 | 0.0 | 0.0 | 0.0 |
| 10 | 3.7 | 2.0 | 3.4 | 2.3 | 0.77 | 0.94 | 0.91 | 0.93 | 11.1 | 4.3 | 16.2 | 10.4 | 0.1 | 0.1 | 0.1 | 0.0 |
| 11 | 4.5 | 2.4 | 5.1 | 1.8 | 0.77 | 0.90 | 0.74 | 0.93 | 13.1 | 4.6 | 10.9 | 3.9 | 0.0 | 0.0 | 0.1 | 0.1 |
| 12 | 5.0 | 2.7 | 5.7 | 2.1 | 0.77 | 0.93 | 0.81 | 0.93 | 16.3 | 7.8 | 19.8 | 8.5 | 0.0 | 0.1 | 0.0 | 0.1 |
| 13 | 5.8 | 1.6 | 6.2 | 1.4 | 0.84 | 0.87 | 0.58 | 0.91 | 15.8 | 8.4 | 16.0 | 3.5 | 0.0 | 0.1 | 0.0 | 0.1 |
| 14 | 4.2 | 1.6 | 4.6 | 2.2 | 0.78 | 0.84 | 0.74 | 0.95 | 13.8 | 6.2 | 16.8 | 13.7 | 0.1 | 0.0 | 0.0 | 0.0 |
| 15 | 4.5 | 2.7 | 7.3 | 3.5 | 0.70 | 0.84 | 0.74 | 0.95 | 13.0 | 8.2 | 25.3 | 13.7 | 0.0 | 0.1 | 0.0 | 0.1 |
| 16 | 3.3 | 2.3 | 6.3 | 2.7 | 0.86 | 0.88 | 0.65 | 0.96 | 26.1 | 11.1 | 20.0 | 12.0 | 0.0 | 0.1 | 0.0 | 0.0 |
| 17 | 2.0 | 1.0 | 4.4 | 2.3 | 0.78 | 0.94 | 0.64 | 0.91 | 8.1 | 3.2 | 19.7 | 17.5 | 0.0 | 0.0 | 0.1 | 0.0 |
| 18 | 2.4 | 1.5 | 4.4 | 1.6 | 0.78 | 0.81 | 0.80 | 0.93 | 11.0 | 3.5 | 12.9 | 7.8 | 0.0 | 0.0 | 0.0 | 0.0 |
| 19 | 3.5 | 2.0 | 3.9 | 2.2 | 0.73 | 0.87 | 0.66 | 0.90 | 15.1 | 5.7 | 13.2 | 6.2 | 0.0 | 0.1 | 0.0 | 0.0 |
| 20 | 4.5 | 1.6 | 3.4 | 2.0 | 0.86 | 0.96 | 0.81 | 0.93 | 13.6 | 2.6 | 15.8 | 10.8 | 0.0 | 0.0 | 0.1 | 0.0 |
| Mean | 4.3 | 2.2 | 5.2 | 2.7 | 0.81 | 0.91 | 0.77 | 0.93 | 15.1 | 7.1 | 18.2 | 10.2 | 0.0 | 0.0 | 0.0 | 0.0 |
| Std. | 1.1 | 0.6 | 1.3 | 0.8 | 0.08 | 0.05 | 0.09 | 0.02 | 3.7 | 2.6 | 3.9 | 3.5 | 0.0 | 0.0 | 0.0 | 0.0 |
© 2018 by the authors. Licensee MDPI, Basel, Switzerland. This article is an open access article distributed under the terms and conditions of the Creative Commons Attribution (CC BY) license (http://creativecommons.org/licenses/by/4.0/).
Share and Cite
Hu, X.; Zhao, J.; Peng, D.; Sun, Z.; Qu, X. Estimation of Foot Plantar Center of Pressure Trajectories with Low-Cost Instrumented Insoles Using an Individual-Specific Nonlinear Model. Sensors 2018, 18, 421. https://doi.org/10.3390/s18020421
Hu X, Zhao J, Peng D, Sun Z, Qu X. Estimation of Foot Plantar Center of Pressure Trajectories with Low-Cost Instrumented Insoles Using an Individual-Specific Nonlinear Model. Sensors. 2018; 18(2):421. https://doi.org/10.3390/s18020421
Chicago/Turabian StyleHu, Xinyao, Jun Zhao, Dongsheng Peng, Zhenglong Sun, and Xingda Qu. 2018. "Estimation of Foot Plantar Center of Pressure Trajectories with Low-Cost Instrumented Insoles Using an Individual-Specific Nonlinear Model" Sensors 18, no. 2: 421. https://doi.org/10.3390/s18020421
APA StyleHu, X., Zhao, J., Peng, D., Sun, Z., & Qu, X. (2018). Estimation of Foot Plantar Center of Pressure Trajectories with Low-Cost Instrumented Insoles Using an Individual-Specific Nonlinear Model. Sensors, 18(2), 421. https://doi.org/10.3390/s18020421