1. Introduction
With the increase of large-scale social activities such as sporting events, religious gatherings, and music concerts in recent years, the issue of crowd safety has been gaining considerable attention, since there is a significant potential for injuries and even death. Even with incomplete statistics, 100 accidents with crushes or stampedes occurred between 2006 and 2016, in which 4011 people were killed and more than 6346 people were injured [
1]. These disasters have significant social impacts, although there is a relatively low probability that they occur. Crowd crushing and trampling are crucial problems that require understanding and hopefully mitigation.
Generally, there are two main reasons reported for deaths and injuries in a stampede:
- (1)
Compressional asphyxia due to excessive crushing of the lungs of some victims;
- (2)
An individual falls down, is trampled by other people, and is unable to stand up again.
Fruin [
2] explained, however, that virtually all crowd deaths are the result of compressive asphyxia and not “trampling” that is often reported in the media. As a result, it is very important to investigate the physical characteristics of a crowd when crushing happens.
There are several approaches to exploring crowd disasters: some try to predict the crowd pressures when crushing occurs; some try to model crowd motions at high and extremely high densities where trampling and crushing occur. Relatively little effort has been placed upon the relationship between local crowd density and the physical factors leading to static crowd compression.
In this paper, we present a physics-based approach to simulating the process of crowd compression leading to dangerous crushing densities. According to Fruin [
3], people in a crowd may be passively propelled three meters or more when motion shock waves are generated by other crowd behaviors. We model an experimental virtual environment as three rigid, immovable walls and a fourth movable wall. This fourth wall behaves as a piston with respect to the other three. The crowd is dispersed uniformly with a preliminary dense but safe packing within the four-sided environment. By moving the piston wall, we can impose a desired force on the occupants. The agents are subject to physics-based simulation, and we compute the local density experienced by each agent under these circumstances. High computed densities are likely to signal consequent crushing injuries. Populations of 200, 300, and 400 agents are studied to determine the scalability of our approach to new situations. We compare our results with crowd crushing disasters reported in the media to verify that local crowd density is a crucial factor that should be taken into account to help prevent crowd tragedies.
There are two key contributions of this work:
- (1)
Developing a physics-based approach to simulate the process of crowd compression;
- (2)
Verification that local crowd density is a critical factor that predicts when crushing, and thus injuries, are likely to occur.
The remainder of this paper is organized as follows: In the next section, we review related work in crowd crushing and examine the role of crowd density in crowd simulation.
Section 3 describes the model we used to simulate crowd compression situations. In
Section 4, we do experiments to simulate static crowds with 200, 300, and 400 agents when increasingly compressed by the movable piston wall.
Section 5 gives the results and analysis of our experiments. Finally, we provide comparisons and discussion in
Section 6.
2. Related Work
Crowd simulation research covers many tangible aspects of human locomotive behavior such as the realism of the walking motion itself, collision avoidance, navigation, and local interactions between agents. To produce behaviorally interesting agents, crowd simulation takes one of two approaches: microscopic or macroscopic. Microscopic approaches focus on the realism of individual behavior by simulating the perception, memory, planning and emotion of every agent. Some of these features may be minimized or sacrificed to achieve real-time behaviors. Macroscopic approaches, on the other hand, aim to simulate very large crowds, often with fluid-like motion models; thus the behavior of each individual is not as important as long as the overall crowd movement produces realistic emergent behavior.
2.1. Research on Crowd Crushing and Stampedes
All crowd simulation systems, either microscopic or macroscopic, lack the specific consideration of simulating compression, crushing, and trampling that may occur in a crowd. Although the social force model can simulate individual agents’ behaviors in a crowd, such as collision avoidance, it fails to adequately describe the causes behind crushing and trampling; these are situations where collision avoidance is an inappropriate model for actual consequences.
Lee and Hughes [
4] studied crowd stampedes and developed a rational model for anticipating the motion of human crowds and increasing their safety. In their model, the crowd motion at both high and very high densities of pedestrians, as described by Hughes [
5], is based on kinematic wave theory [
6]. Wave theory explains many of the observed features of traffic flow and is generalized to pedestrian crowd flows. Furthermore, general rules of crowd behavior are established according to empirical data obtained from official reports produced by the police, coroners, and royal commissions.
Helbing developed the social force model as an analog to the physics of crowd movement. The social force model solves Newton’s equation for each individual agent and maps the interaction between people and obstacles into repulsive interaction, friction forces, dissipation, and fluctuations [
7,
8]. By simulating the resulting forces, agents demonstrate realistic collision avoidance, pushing behavior, and variable flow rates.
Heigeas [
9] believes that there are two kinds of collective phenomena: interpersonal interactions (small group discussion and negotiation, etc.); and global collective phenomena, such as flowing and jamming. Their research focused on the second type of collective human phenomena, called non-deliberative emergent crowd phenomena. They proposed a physically-based particle model to reproduce emergent crowd behaviors. Individuals are modeled as simple disc-like particles on a two-dimensional ground and immovable objects are modeled as sets of fixed particles represented by rectangles. Interactions between individuals are represented by physically-based forces exerted between pairs of particles. In their model, crowd phenomena are viewed as typical cases of collective self-organization, which is one major cause of crowd stampedes.
Henein and White [
10] present a swarm force model based on Kirchner’s field-based model [
11], in which the space is represented by a discrete grid, and a static field (unchanged) as well as a dynamic field (updated every time step) are adopted to decide which neighboring cell the agent will go to next. They believe that crowd force should be considered to reflect the characteristics of a crowd and, therefore, they integrate a physical force to simulate the effects of injuries and their influence on other nearby agents. In their model, they adopt four general principles for force modelling (i.e., force is directed, propagated, purposeful, and carries consequences) and found that agents who experience excessive force become injured and can no longer move within the model. Although their model takes the interaction forces among the agents into account, the discrete grid limits packing density to one agent per cell. This is an unrealistic constraint when crowd densities become very high.
Teknomo [
12] studied the repulsive forces among agents based on the social force model and presented a microscopic pedestrian simulation model. In his model, two kinds of repulsive forces are considered: one pushes the agent away from the closest agent, the other repels all other surrounding agents. The proposed model is verified by comparing simulation results obtained from the microscopic model with real data collected through videos of pedestrian motions. It only considers the relationship between flow, speed, and density, so it does not consider static crowd behaviors.
2.2. Research on Crowd Density
Crowd density is an important factor to consider when simulating crowds. Some researchers [
13,
14] computed the speed of agents according to crowd density. Narain et al. [
15] integrated a unilateral incompressibility constraint (UIC) to reflect the relationship between crowd density and preferred velocity. Some researchers [
16] use crowd density information to guide a large number of agents along a wide variety of routes instead of the shortest paths. Others [
17,
18] navigate agents along short routes to the goal based on the principle of least effort, or according to the minimization of actual energy expenditure while simultaneously avoiding congestion (as local density increases, speed decreases), reducing the amount of movement and maintaining the preferred speed for each agent. Best et al. [
19] present an approach that combines physiological and psychological principles and effectively generates pedestrian trajectories that adhere to the fundamental diagram of pedestrian movement. Kang and Han [
20] also validate their proposed pedestrian model according to the density–speed relation obtained from the fundamental diagram. The fundamental diagram is constructed from observations of real situations and illustrates the inverse relationship between travel speed and density. As a result, realistic crowd behaviors governed by crowd density can be modeled and claim to show better space utilization.
In summary, there is very little work which considers the relationship between static crowd density and crowd crushing. Therefore, we create a model for simulating dense crowd consequences under compressive forces. In this model, we ignore the movement of agents in the crowd and simulate static crowds only.
2.3. Research on Multi-Agent Coalition Formation
Cooperation and coordination is one of the fundamental research issues in multi-agent systems, since a single agent is unable to complete some complex tasks. Coalition formation is a proposed approach to solve this problem and has a wide application in distributed artificial intelligence, public safety networks [
21] and resource allocation in machine-to-machine communication [
22]. Similar to the idea of coalition formation, groups composed of diverse individuals are analyzed and modeled to simulate realistic crowd behaviors. Thalmann [
23] proposed a hierarchical model to simulate virtual human crowds in real time, in which groups are the most complex structure that can be controlled with different degrees of autonomy: guided, programmed and autonomous. Guided behaviors are controlled by external users, programmed behaviors are controlled by scripts, and autonomous behaviors are determined by the virtual agent according to its knowledge, belief and intent. Bayazit [
24] integrated roadmap-based path planning techniques with flocking techniques and proposes new approaches to simulate four distinct group behaviors: homing, goal searching, traversing narrow areas and shepherding. Collins et al. [
25,
26,
27] have been working on examining how individuals and groups interact with one another and capturing group behaviors in pedestrian evacuation models and simulation. However, none of these approaches is applicable to the consequences of the dominant compressive forces on a large static crowd: goal-directed movement or group coalitions may be powerless to overcome the presence and density of surrounding agents.
3. The Compression Model for Crushing Situations
3.1. Agent Model
To model an individual human agent, we adopt a three-dimensional cylinder with an ellipse as its cross section for simplicity. According to statistical analysis of measured human body data, including main thickness, main dimension, main width and height of the subjects from Wang [
28], the geometric parameters for each represented agent are set and shown in
Table 1.
Furthermore, we integrate physical features for each agent so that they can react to the interaction forces between agents, such as pushing and repulsion, which are shown in
Table 2. Agents can respond in physically appropriate ways when compressed. This information is used by the “Rigidbody” simulation in Unity3D which considers gravity and rigid collisions to avoid penetration among agents and the walls.
3.2. Environment Model
According to Helbing [
7], the physical interactions in a packed crowd add up and cause dangerous pressures up to 4450 N·m
−1. We modeled the environment where the static crowd is situated in a restricted region with four walls. We made three walls immovable and applied the corresponding force based on the estimated pressure of 4450 N·m
−1 to one movable wall, acting as a piston, to create crowd compression through area reduction. All space within the walls is packed with agents as densely and as uniformly as possible; a hexagonal closest packing on the representative ellipses models this situation. Thus, agents have no space nor exits for escape when the area compression occurs.
4. Experiments
4.1. Repulsive Force Computation
Each agent would like to keep as equidistant from nearby agents as possible, even when crowd density is very high. We adopt a repulsive force to model this phenomenon. For agent
i, we first locate every agent
j whose distance to agent
i is less than some threshold
D, then we add the repulsive force whose direction is opposite to the vector subtracting the position of agent
i from the position of agent
j, and finally we obtain the total repulsive force
Fr for agent
i, which is given by
where
pi is the position of agent
i,
pj is the position of agent
j,
C is the constant force,
wij is proportional to the distance between agent
i and agent
j, and
Ni includes all neighboring agents close to agent
i.
4.2. Local Crowd Density
We define local crowd density as the number of people per square meter. Inspired by the approaches in [
29,
30], we computed local crowd density through an image processing algorithm:
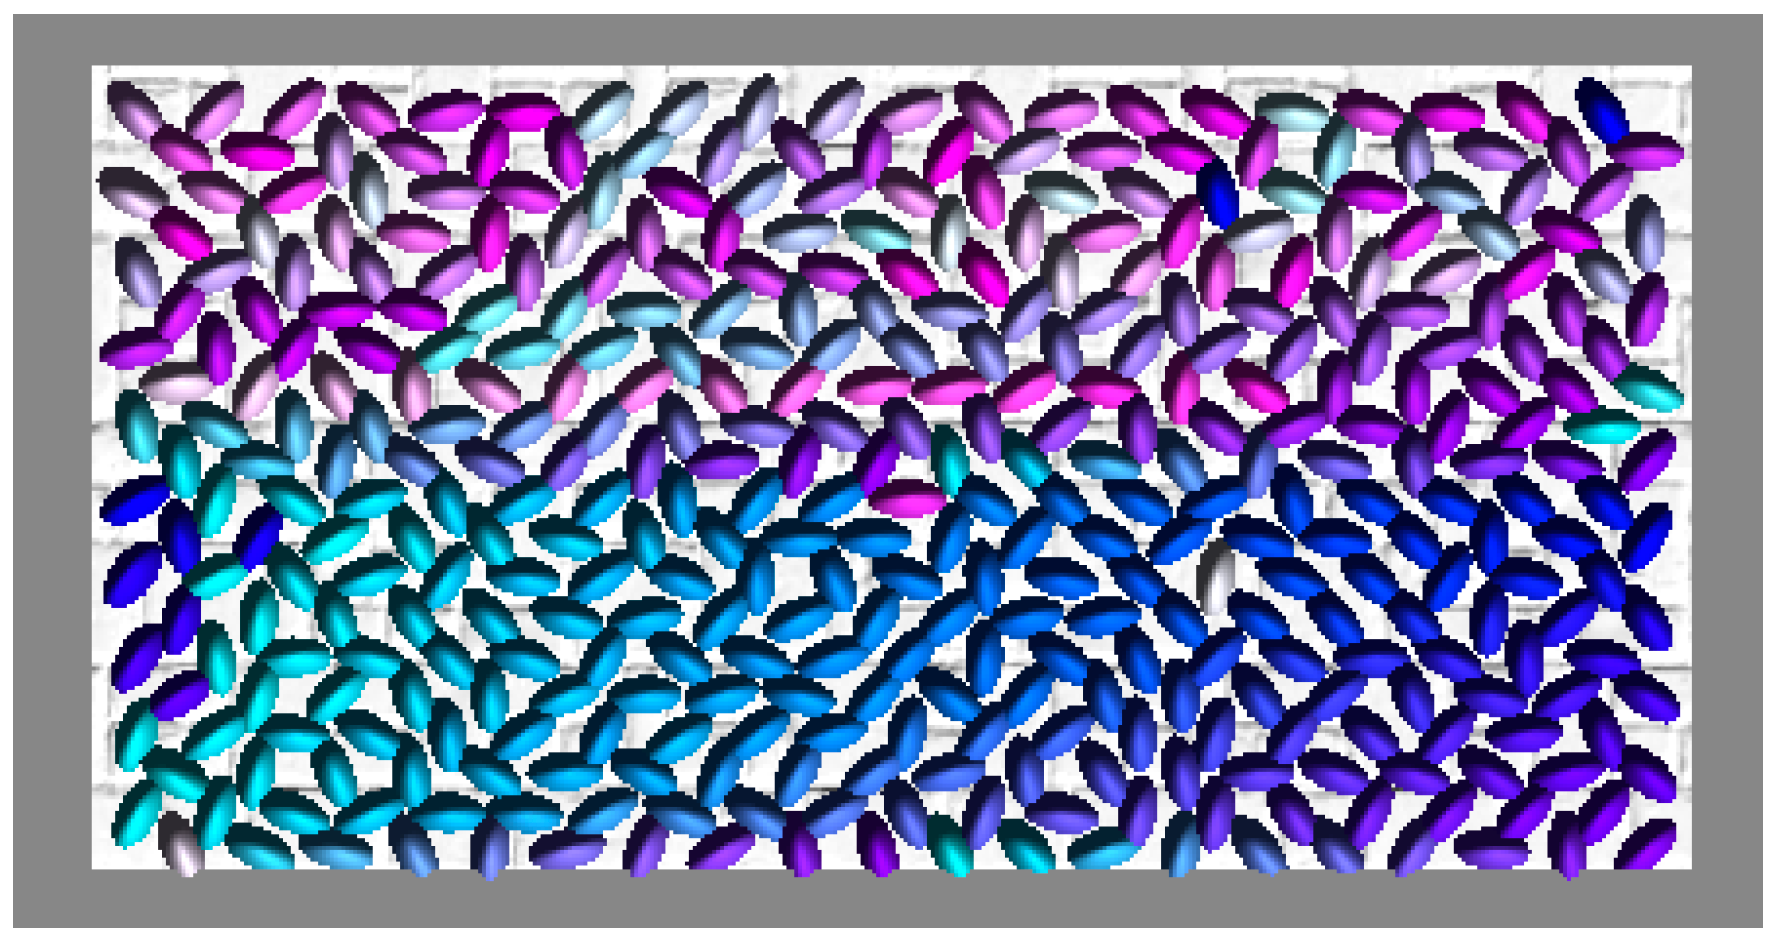
- (1)
We represent each agent’s cylinder with a randomly assigned unique color, which is shown in
Figure 1.
- (2)
The movable wall is translated inward a certain distance to compress the occupied area. During wall movement, Unity3D physics moves the occupants within the space. This step is described in more detail below.
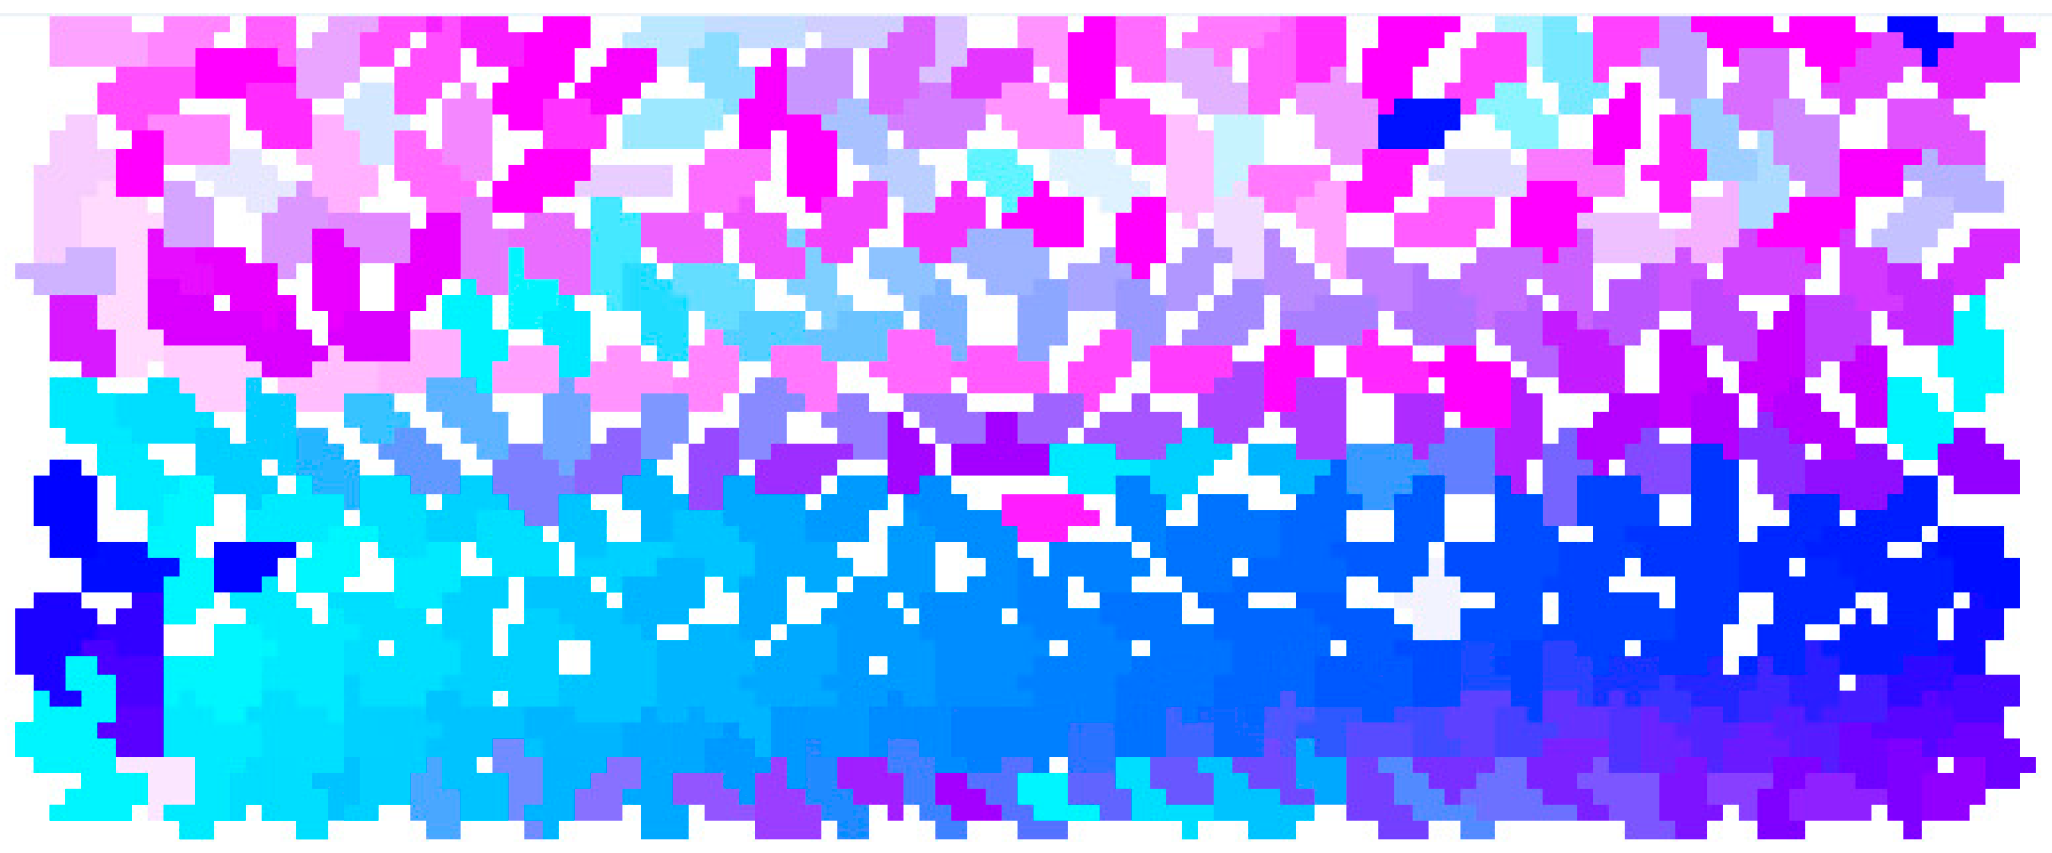
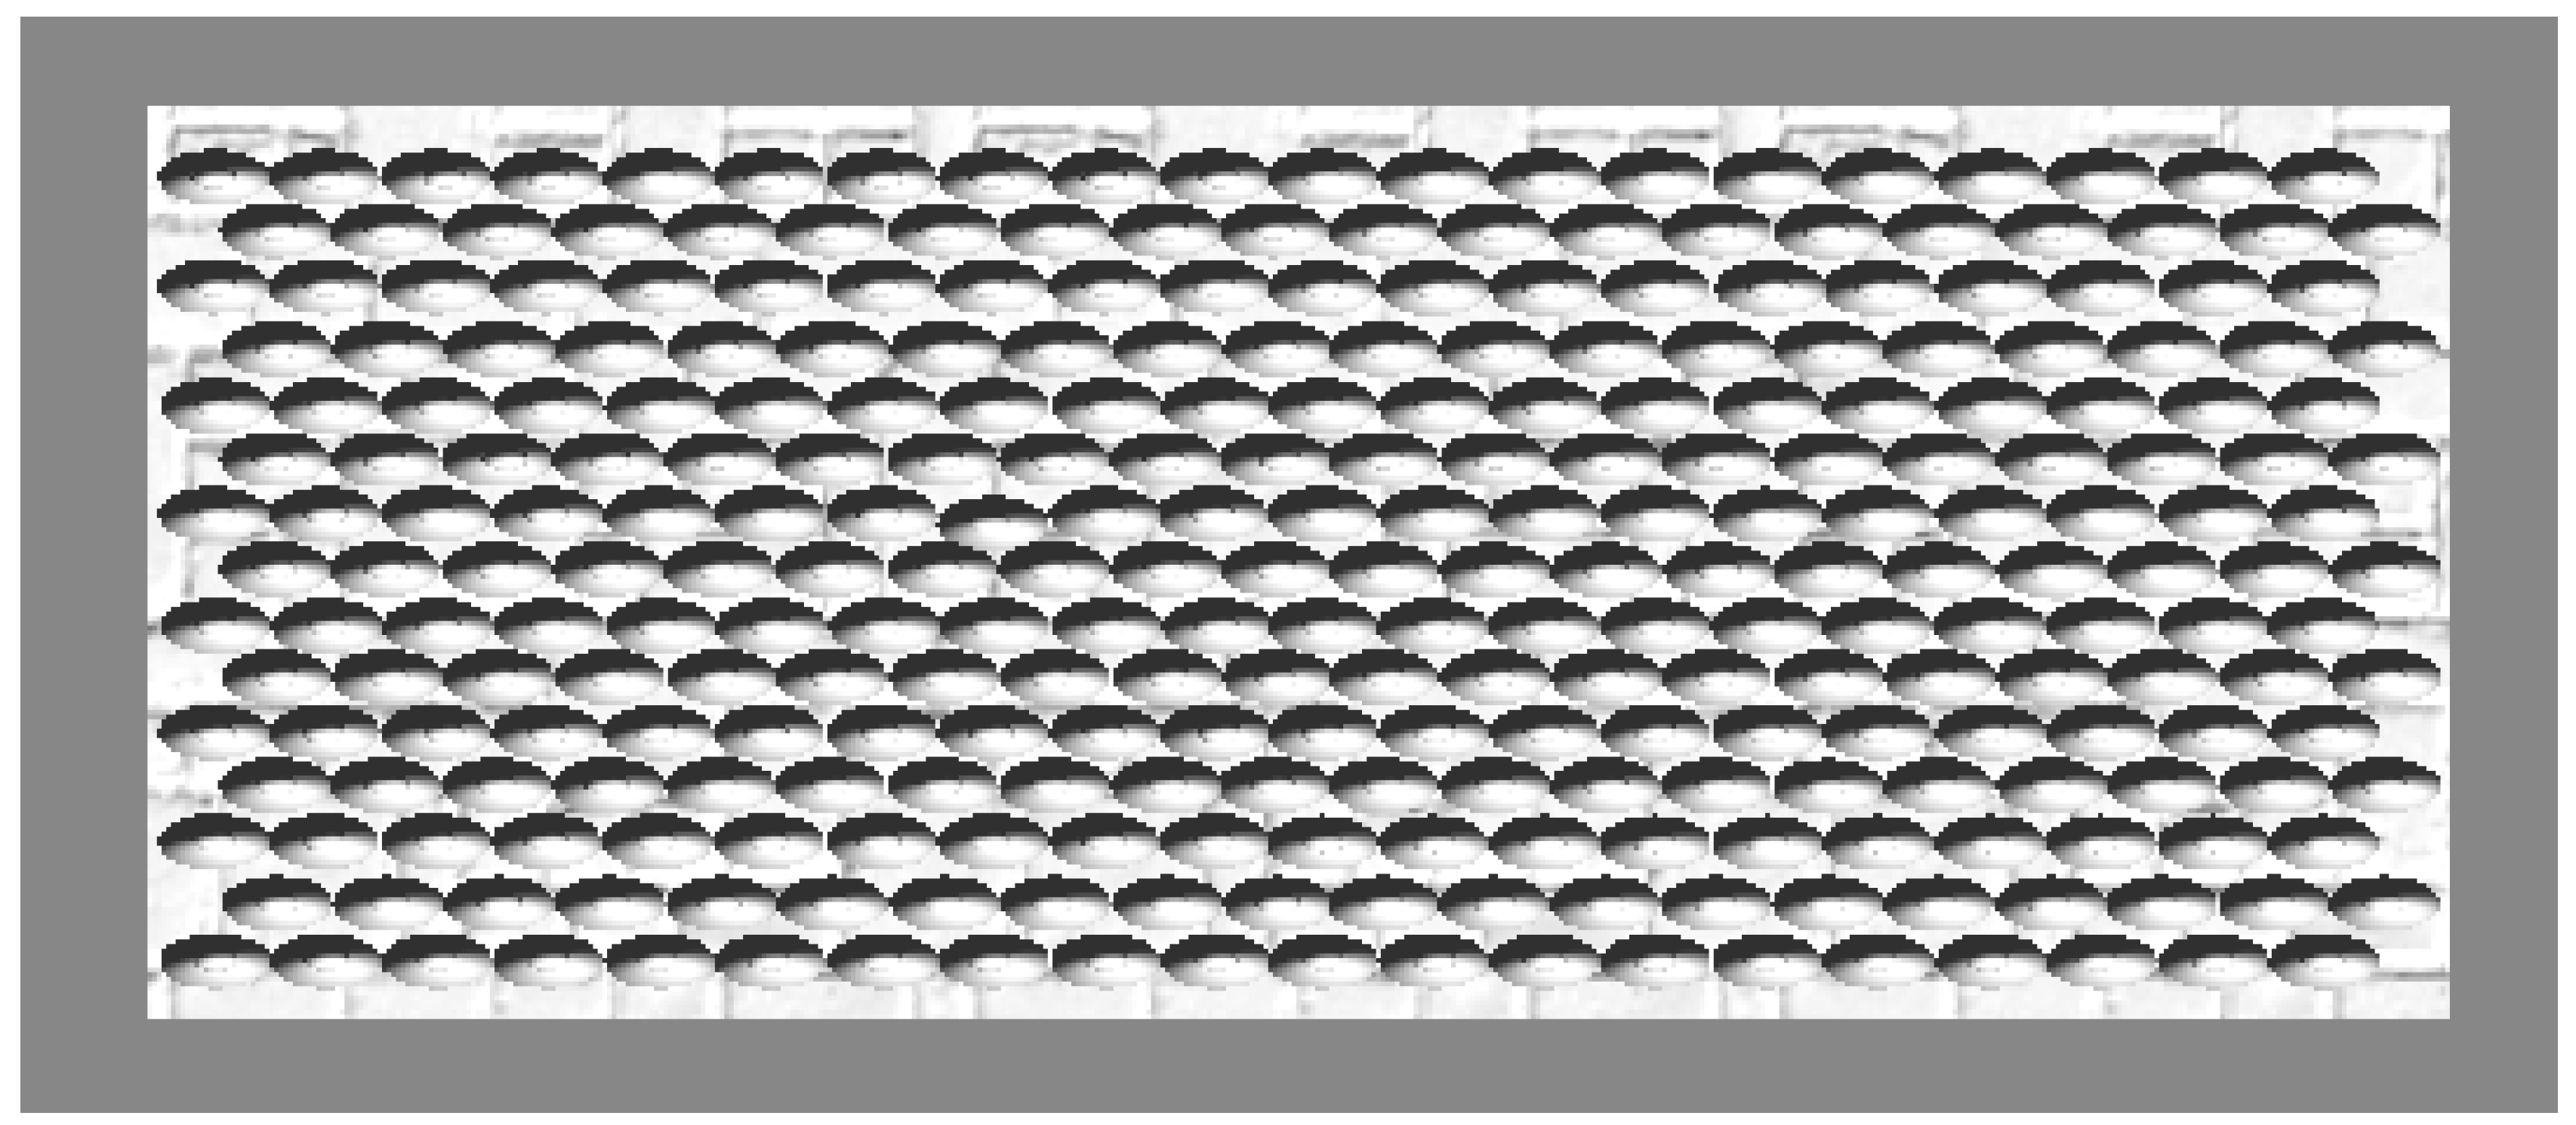
- (3)
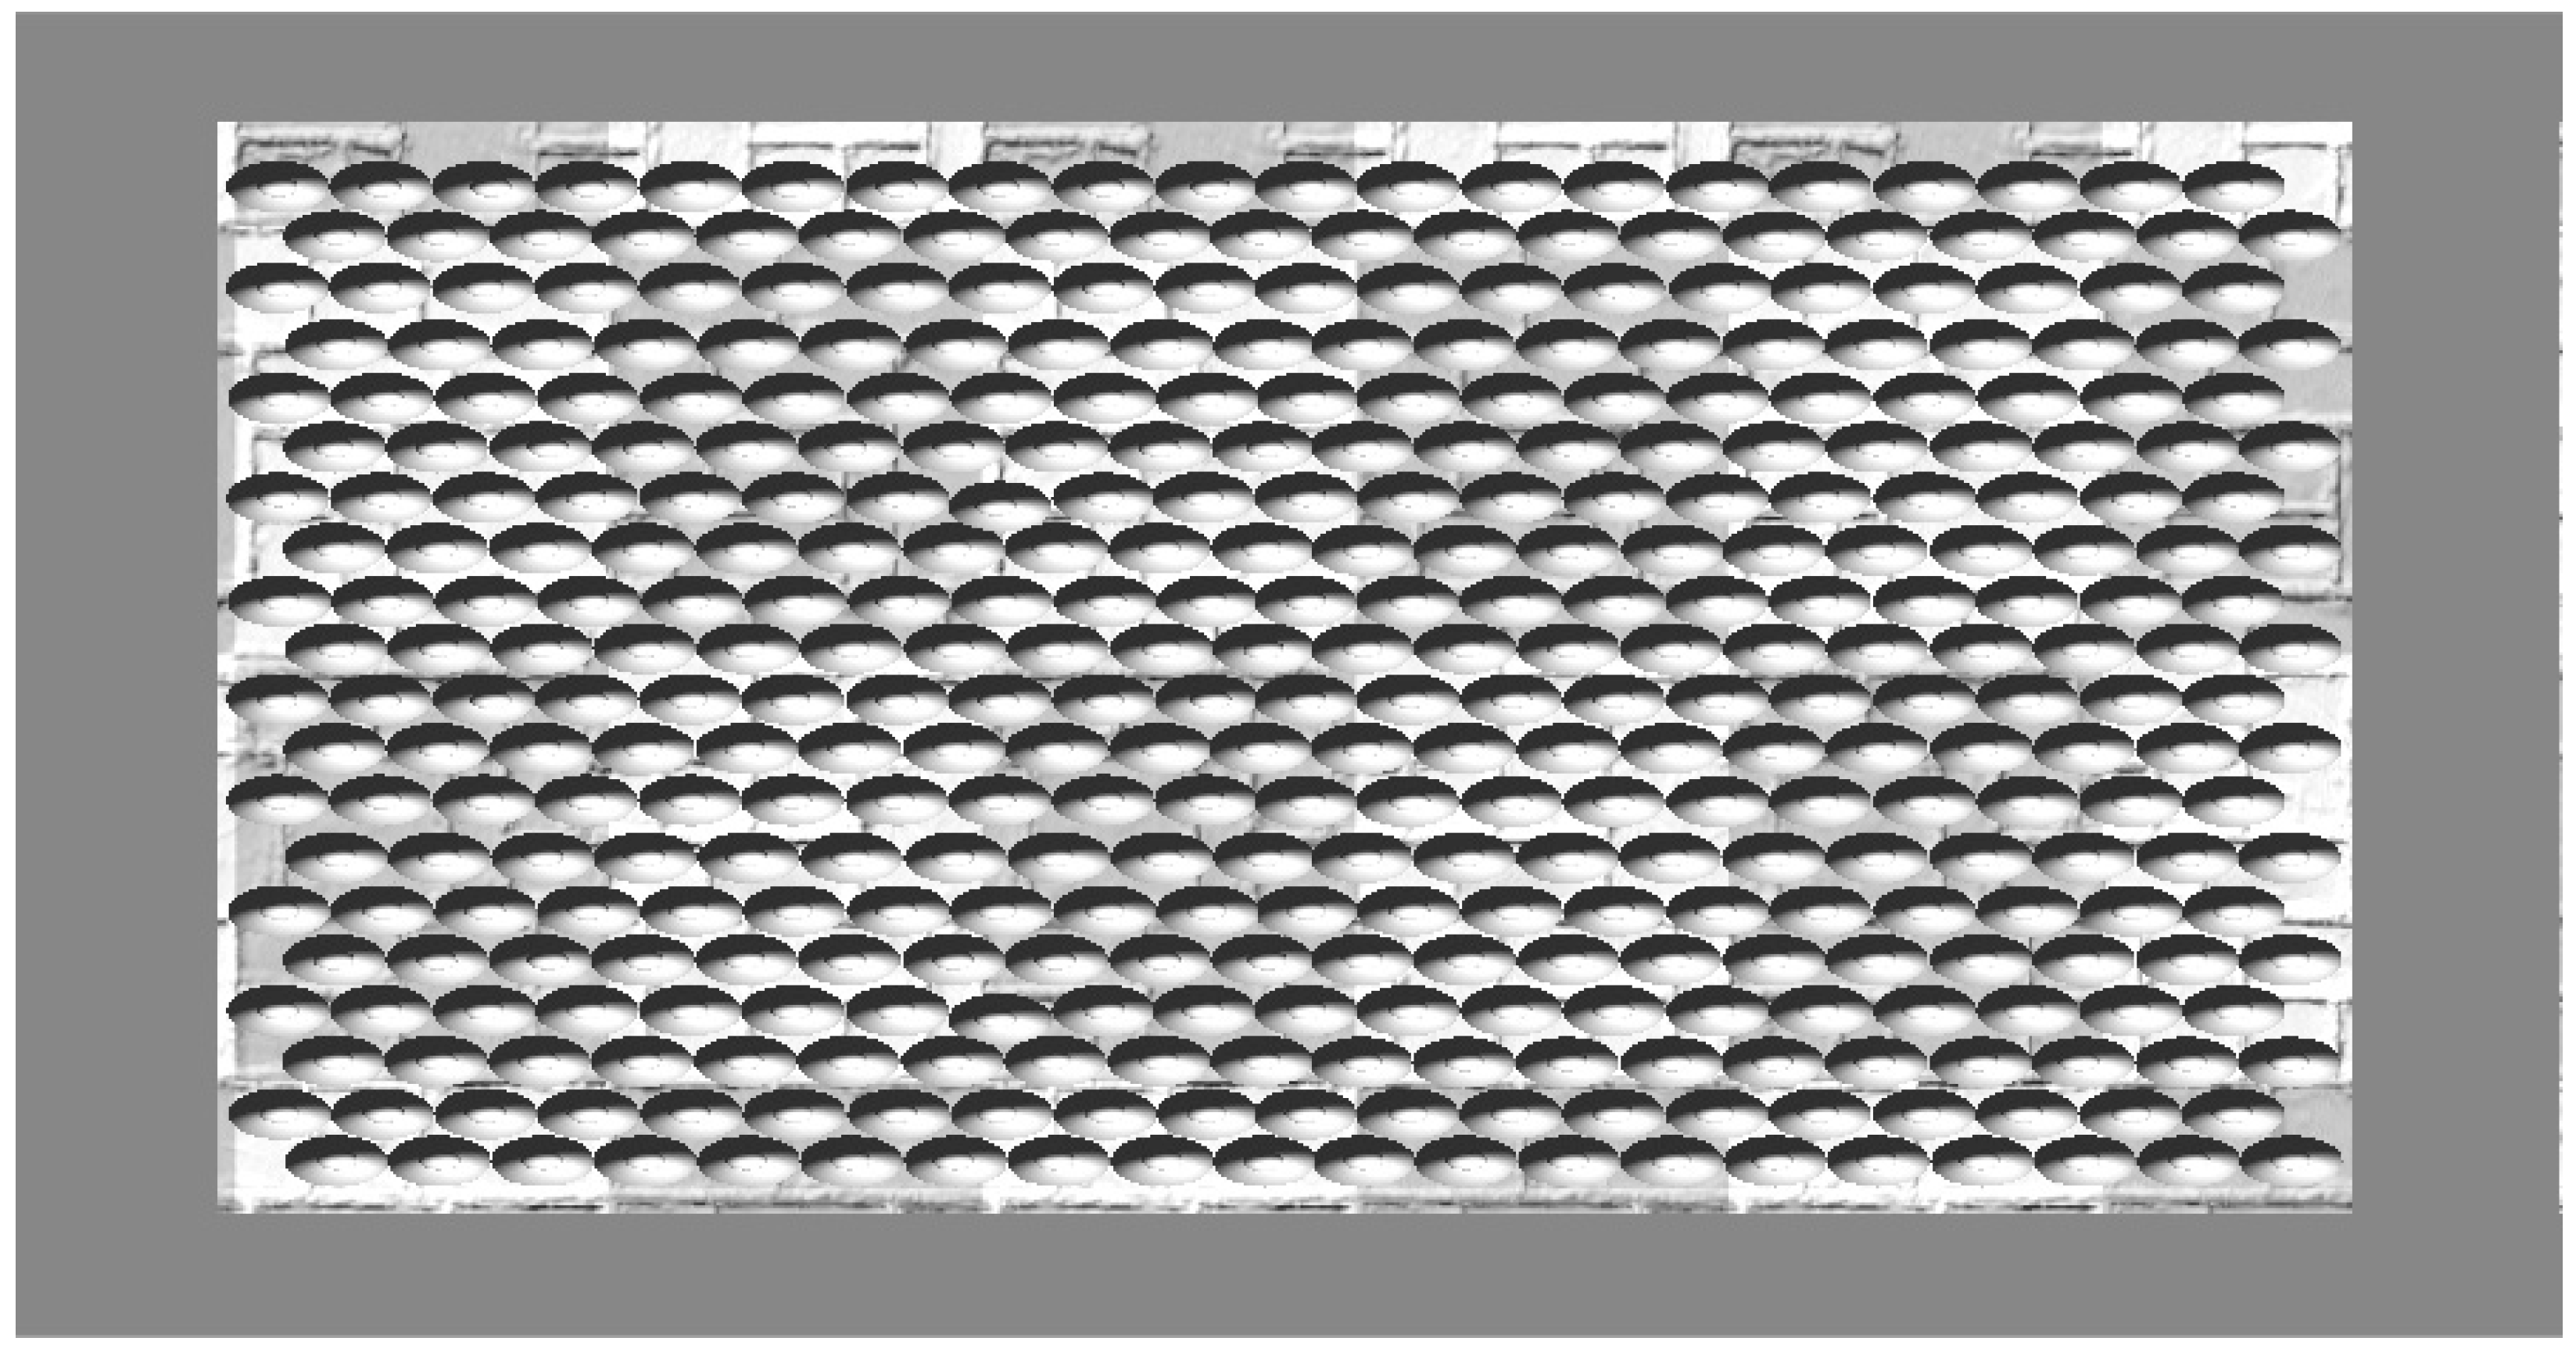
When the wall stops moving, we take a top view image of all agents in the environment, which is shown in
Figure 2.
- (4)
According to the top view image of one red cube whose length and width are both 1 m, we compute the number of pixels which represent one square meter Ns, and correspondingly, we compute the number of pixels which represent one agent Na.
- (5)
For each one square meter
S, we compute the number of pixels
Nc for color
c. Then, the number of agents represented by color
c is given by
where
Qa is the number of agents
a in
S. Thus, local crowd density
ρs in
S is given by
where CA is composed of all agents represented in random colors in S.
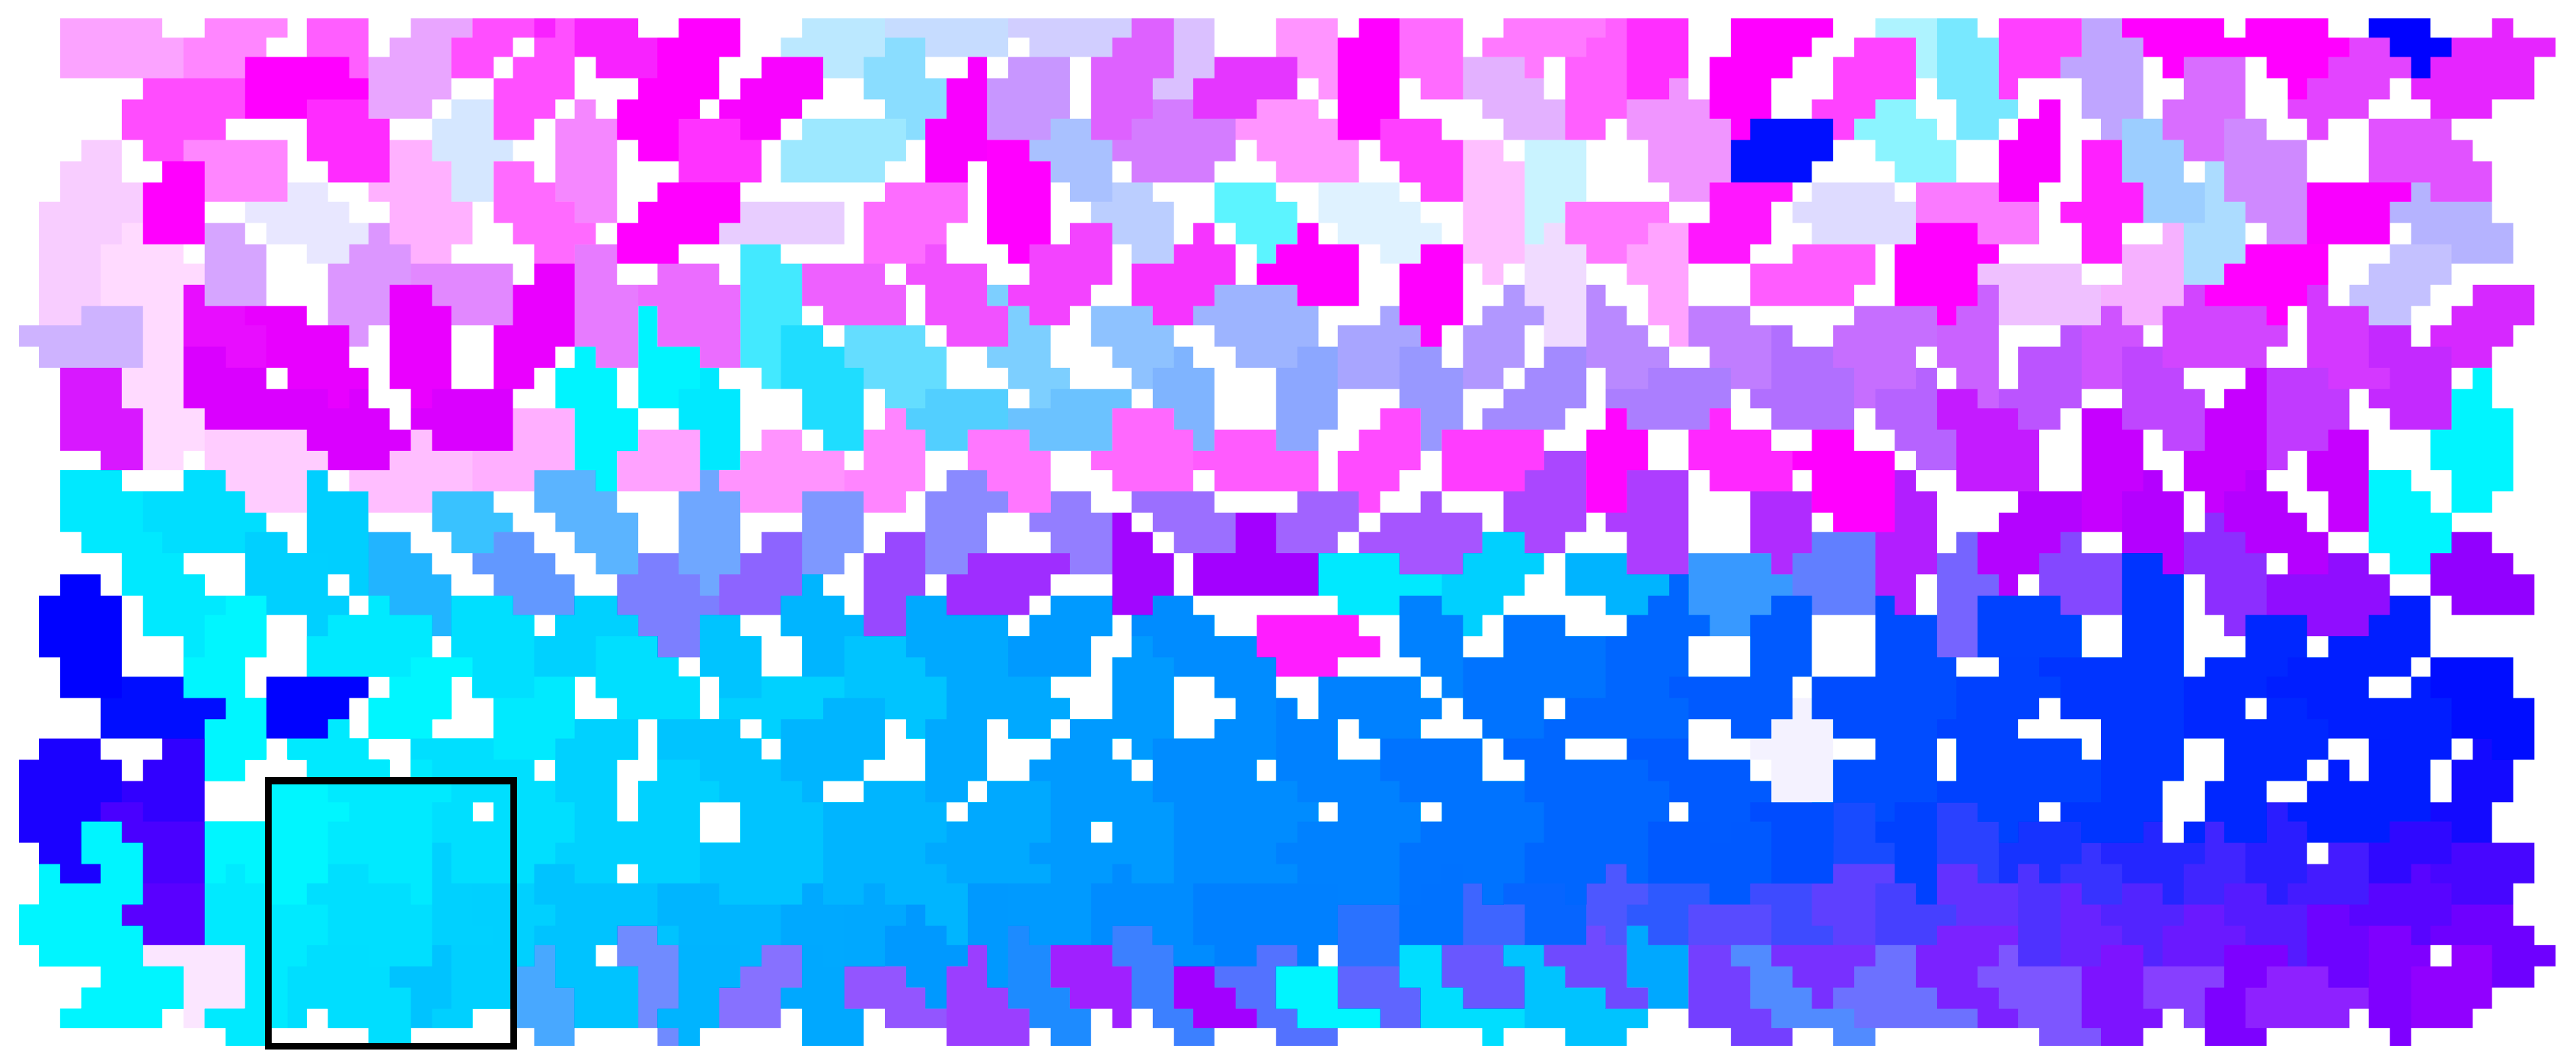
Figure 3 shows the computation of local crowd density. Note that one square meter starts from the left-bottom corner and then advances 1 m from left to right in sequence until it arrives at the max
X, then it starts 1 m from the bottom to top and does the same computation until it arrives at the max
Y. The bottom-left corner is determined by the vertex (min
X, min
Y) in which min
X is the minimum X occupied by some agent while max
X is the maximum X occupied by some agent, and min
Y is the minimum Y occupied by a certain agent while max
Y is the maximum Y occupied by a certain agent.
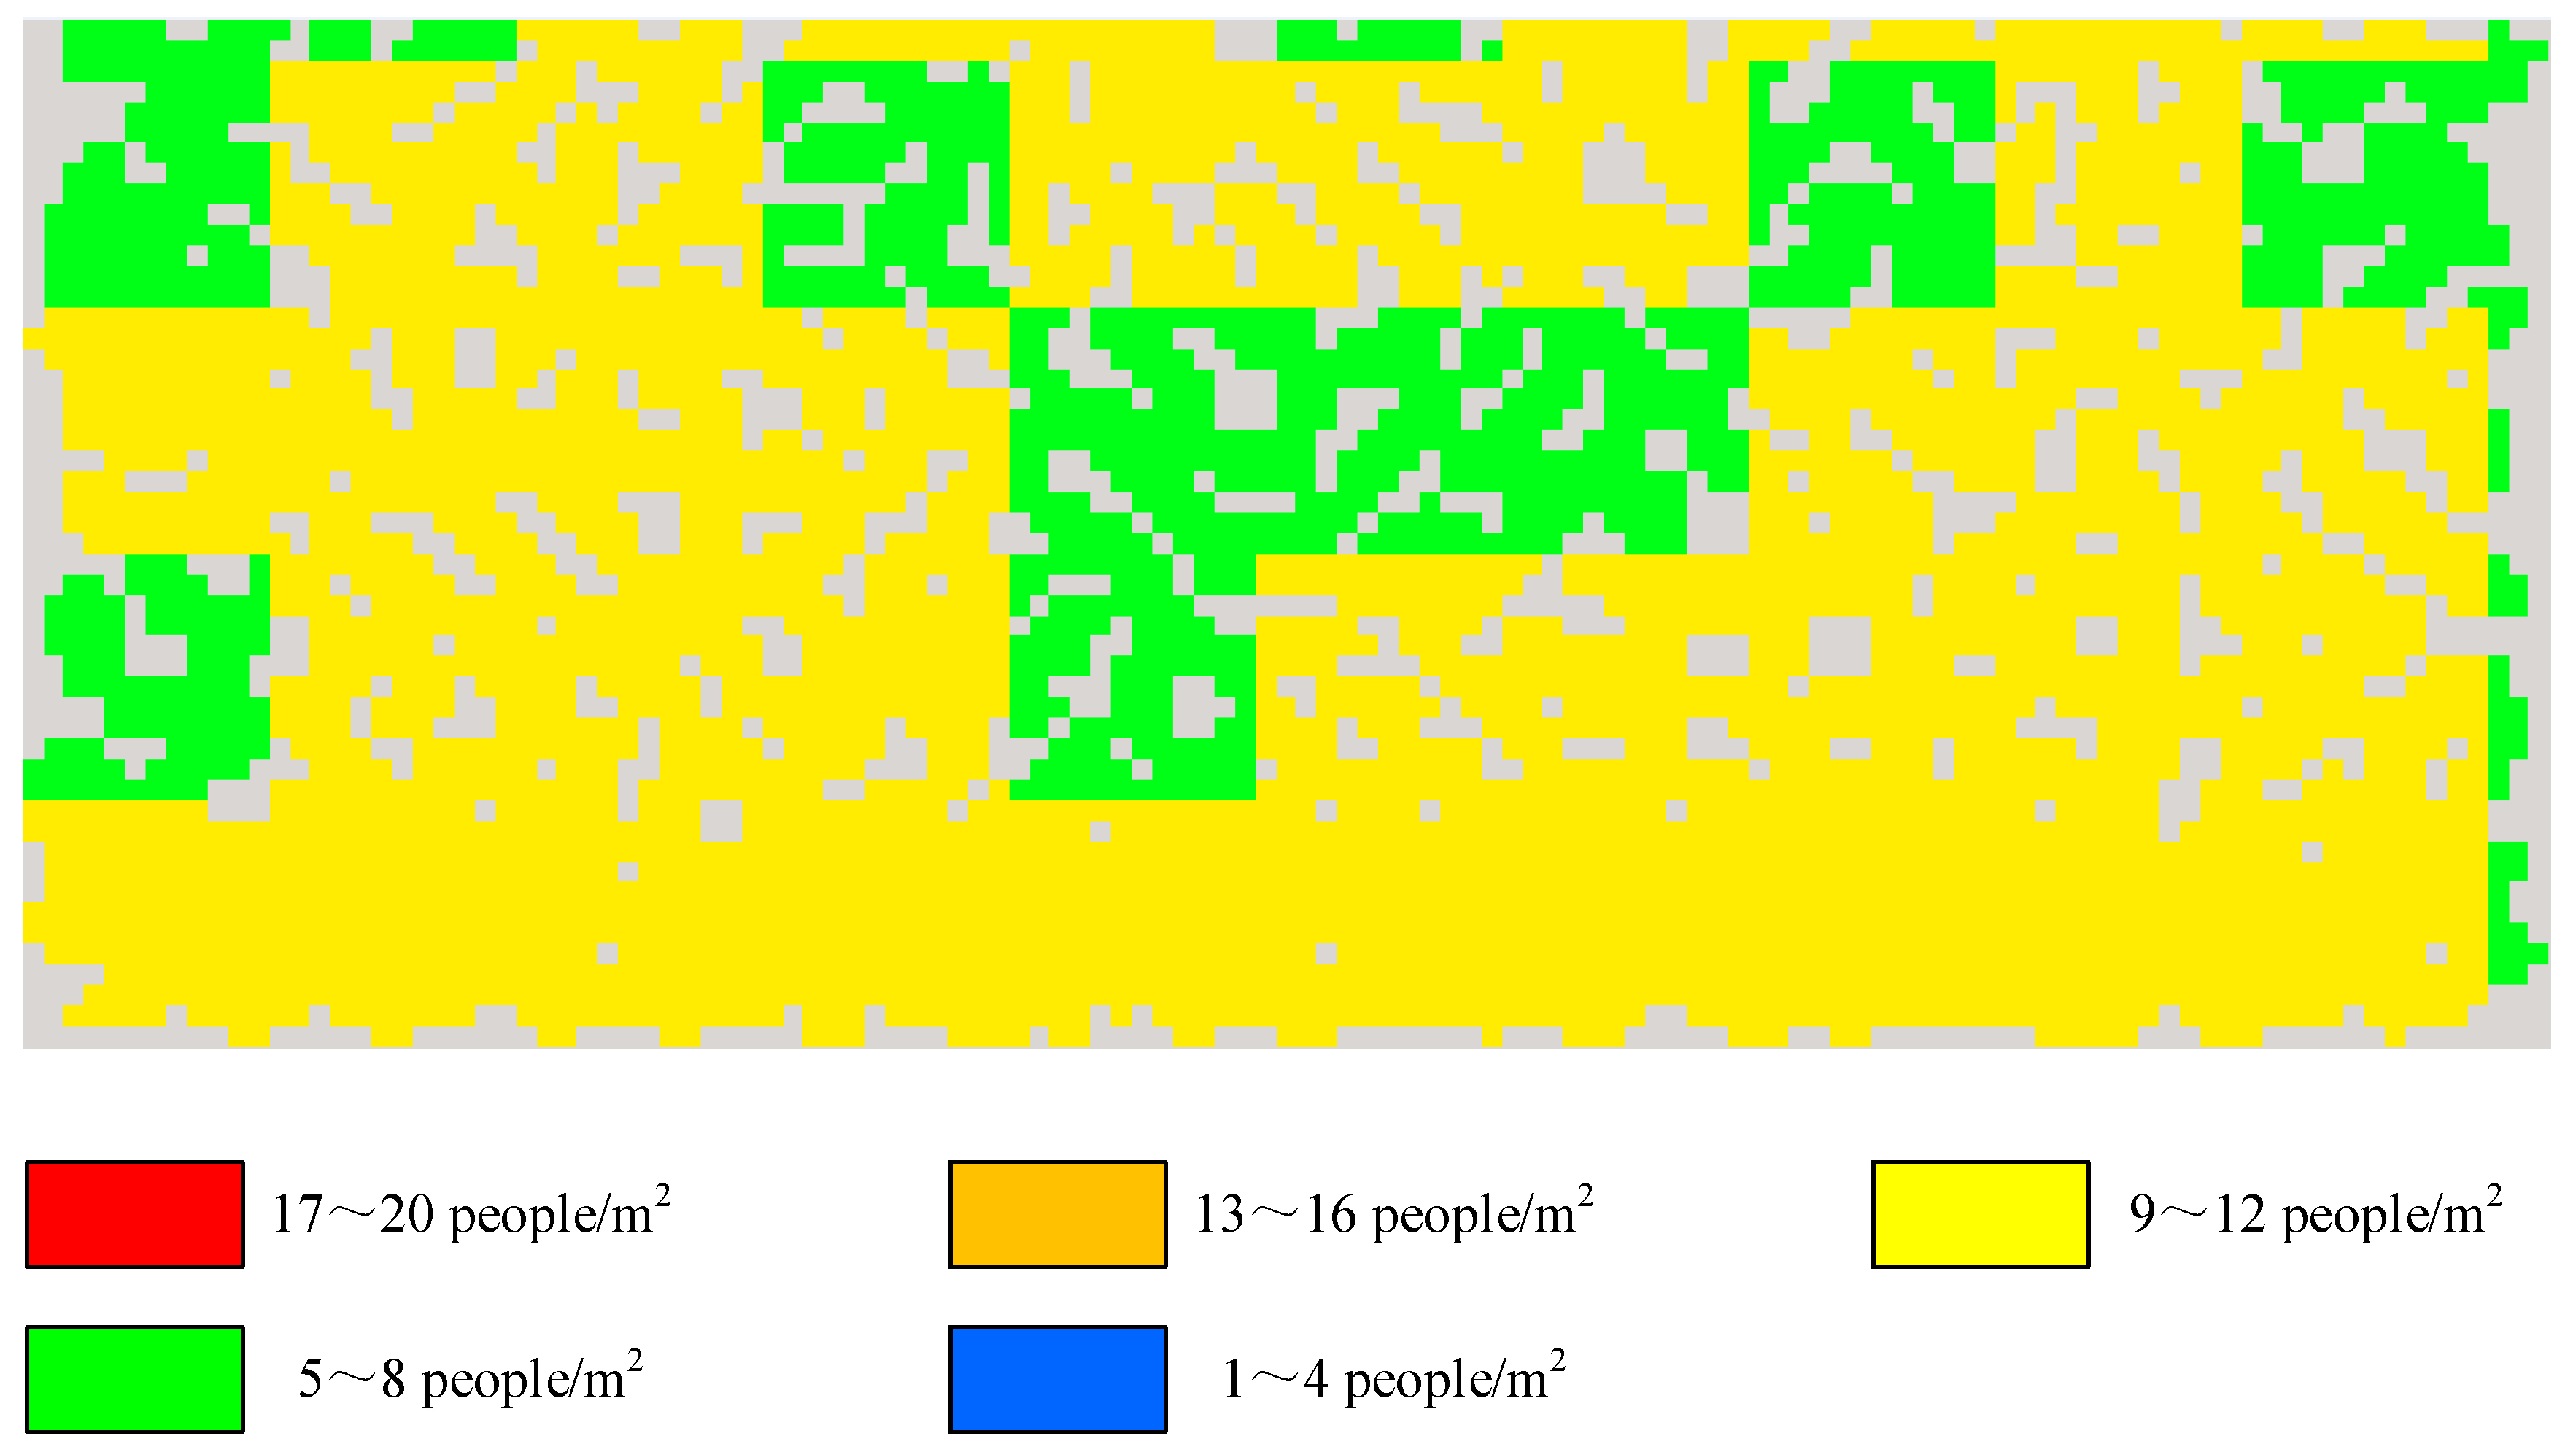
- (6)
Finally, we map the local crowd density to a color scale, given in
Table 3, and the result is shown in
Figure 4.
4.3. Static Crowds with 200, 300, and 400 Agents
We seek to discover the relationship between area compression and local crowd density. We conducted three simulations using the Unity3D engine to achieve this goal, based on densely packed populations for 200, 300, and 400 agents. The steps involved are as follows:
- (1)
We packed 200 agents hexagonally in a rectangular region with length 10.27 m and width 2.76 m; 300 agents hexagonally in a rectangular region with length 10.27 m and width 4.01 m; and 400 agents hexagonally in a rectangular region with length 10.27 m and width 5.28 m. These areas were chosen to maintain a consistent width to the space, and an identical starting density for hexagonal agent packing.
- (2)
We exerted a force to the one moveable wall to compress the occupied space. The magnitude of the force is determined according to the estimated pressure 4450 N·m
−1. We made that wall move various distances to reproduce the scenario that “the people in a crowd may be propelled three meters or more when motion shock waves pass through” [
3].
- (3)
We computed local crowd density when the wall moved to each specified distance. For the simulation of the static crowd with 200 agents, we made the wall move inward 0.5 m, 1 m, 1.5 m, and 2 m. For the simulation of the static crowd with 300 agents, we made the wall move inward 0.5 m, 1 m, 1.5 m, 2 m, and 2.5 m. For the simulation of the static crowd with 400 agents, we made the wall move inward 0.5 m, 1 m, 1.5 m, 2 m, 2.5 m, 3 m, and 3.5 m. Computed area compression factors were noted in the following graphs.
5. Results
All experiments were run on a laptop with a NVIDIA GeForce GT 730M graphics card and an Intel Core 4 i7-4600U CPU (2.1GHZ) with 8GB memory. Our simulation scenes are constructed using Unity3D version 4.0.0f7.
5.1. Simulation Results for a Static Crowd with 200 Agents
In this scenario, 200 agents are packed hexagonally with 20 agents in each row, which is shown in
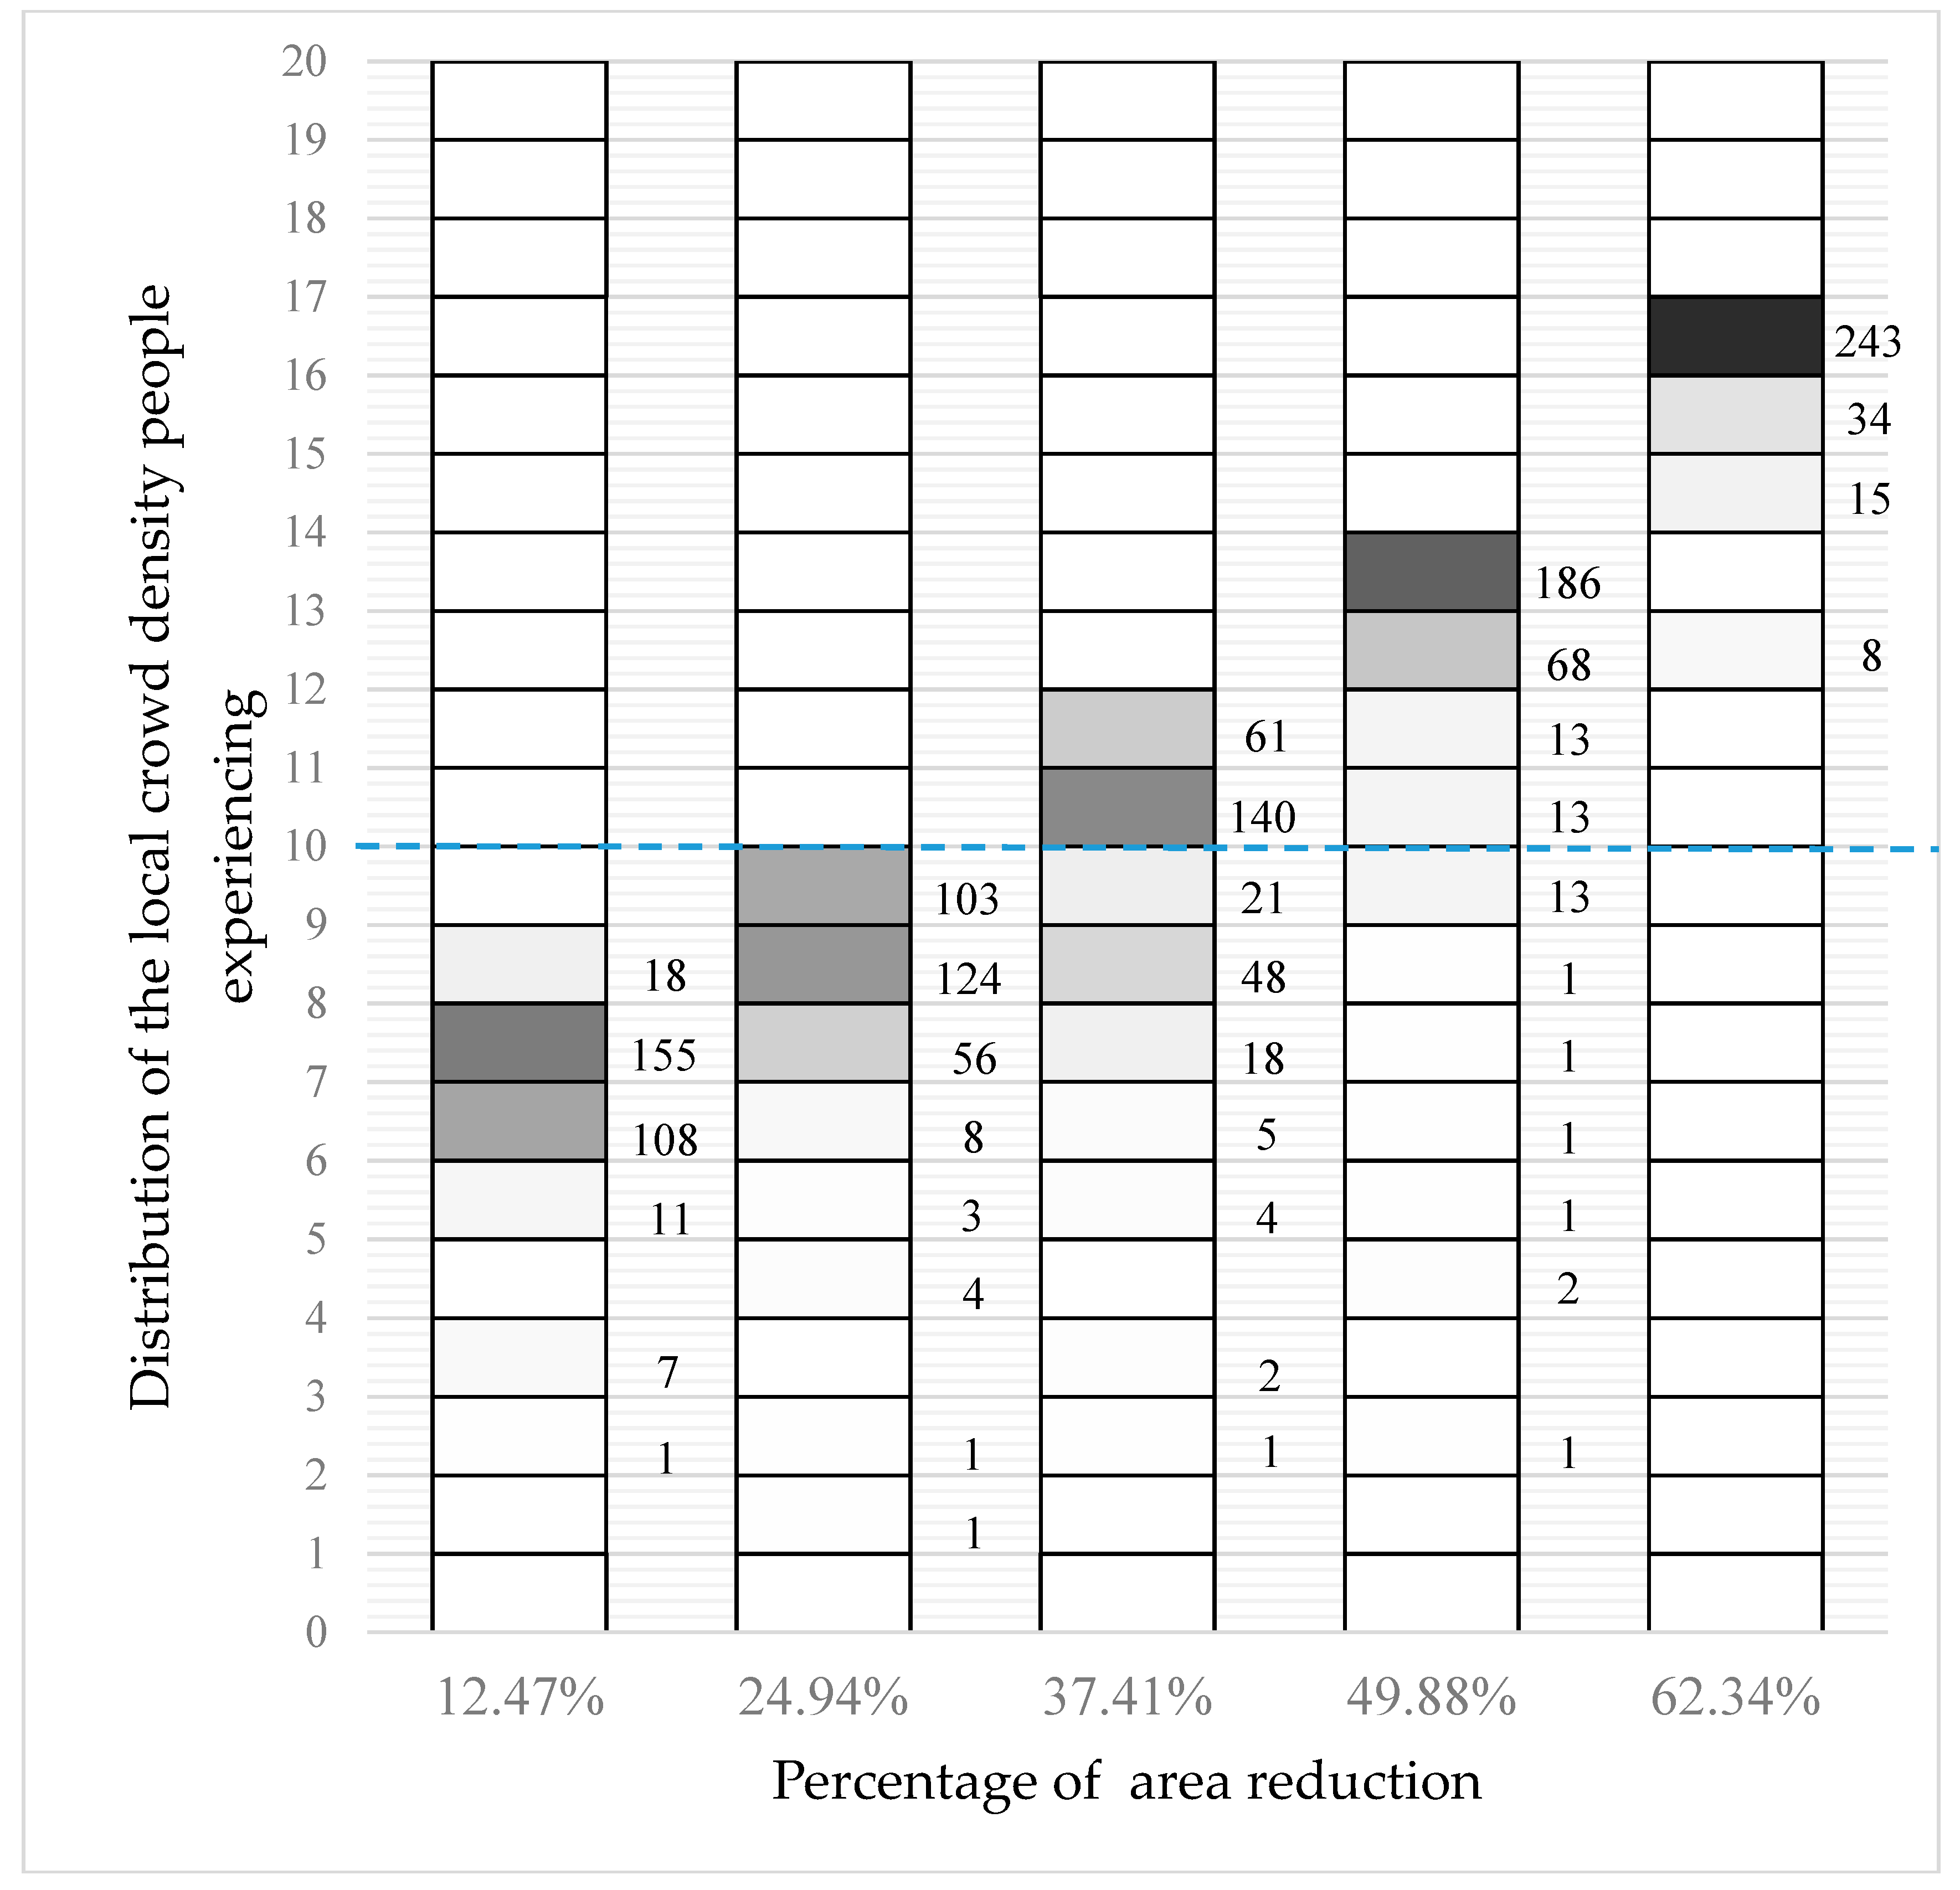
Figure 5. When the wall at the bottom moves forward 0.5 m, 1.0 m, 1.5 m, and 2.0 m, respectively, the distribution of the local crowd density is shown in
Figure 6. Colors encode the number of agents experiencing the indicated density range: white indicates zero or a small number of agents while black indicates a large number of agents. The actual number in each non-zero density range is given to the right of the column. It is apparent that the local crowd density increases continually and faster than linearly when the occupied area shrinks. Ultimately, all agents experience a local crowd density of more than 15 people/m
2 and, notably, 88% of agents experience a local crowd density of more than 20 people/m
2. As an approximate guide to a level of injurious density, the blue line shows the 10 people/m
2 threshold. We can see that more and more people experience a local crowd density above this threshold as the occupied space shrinks.
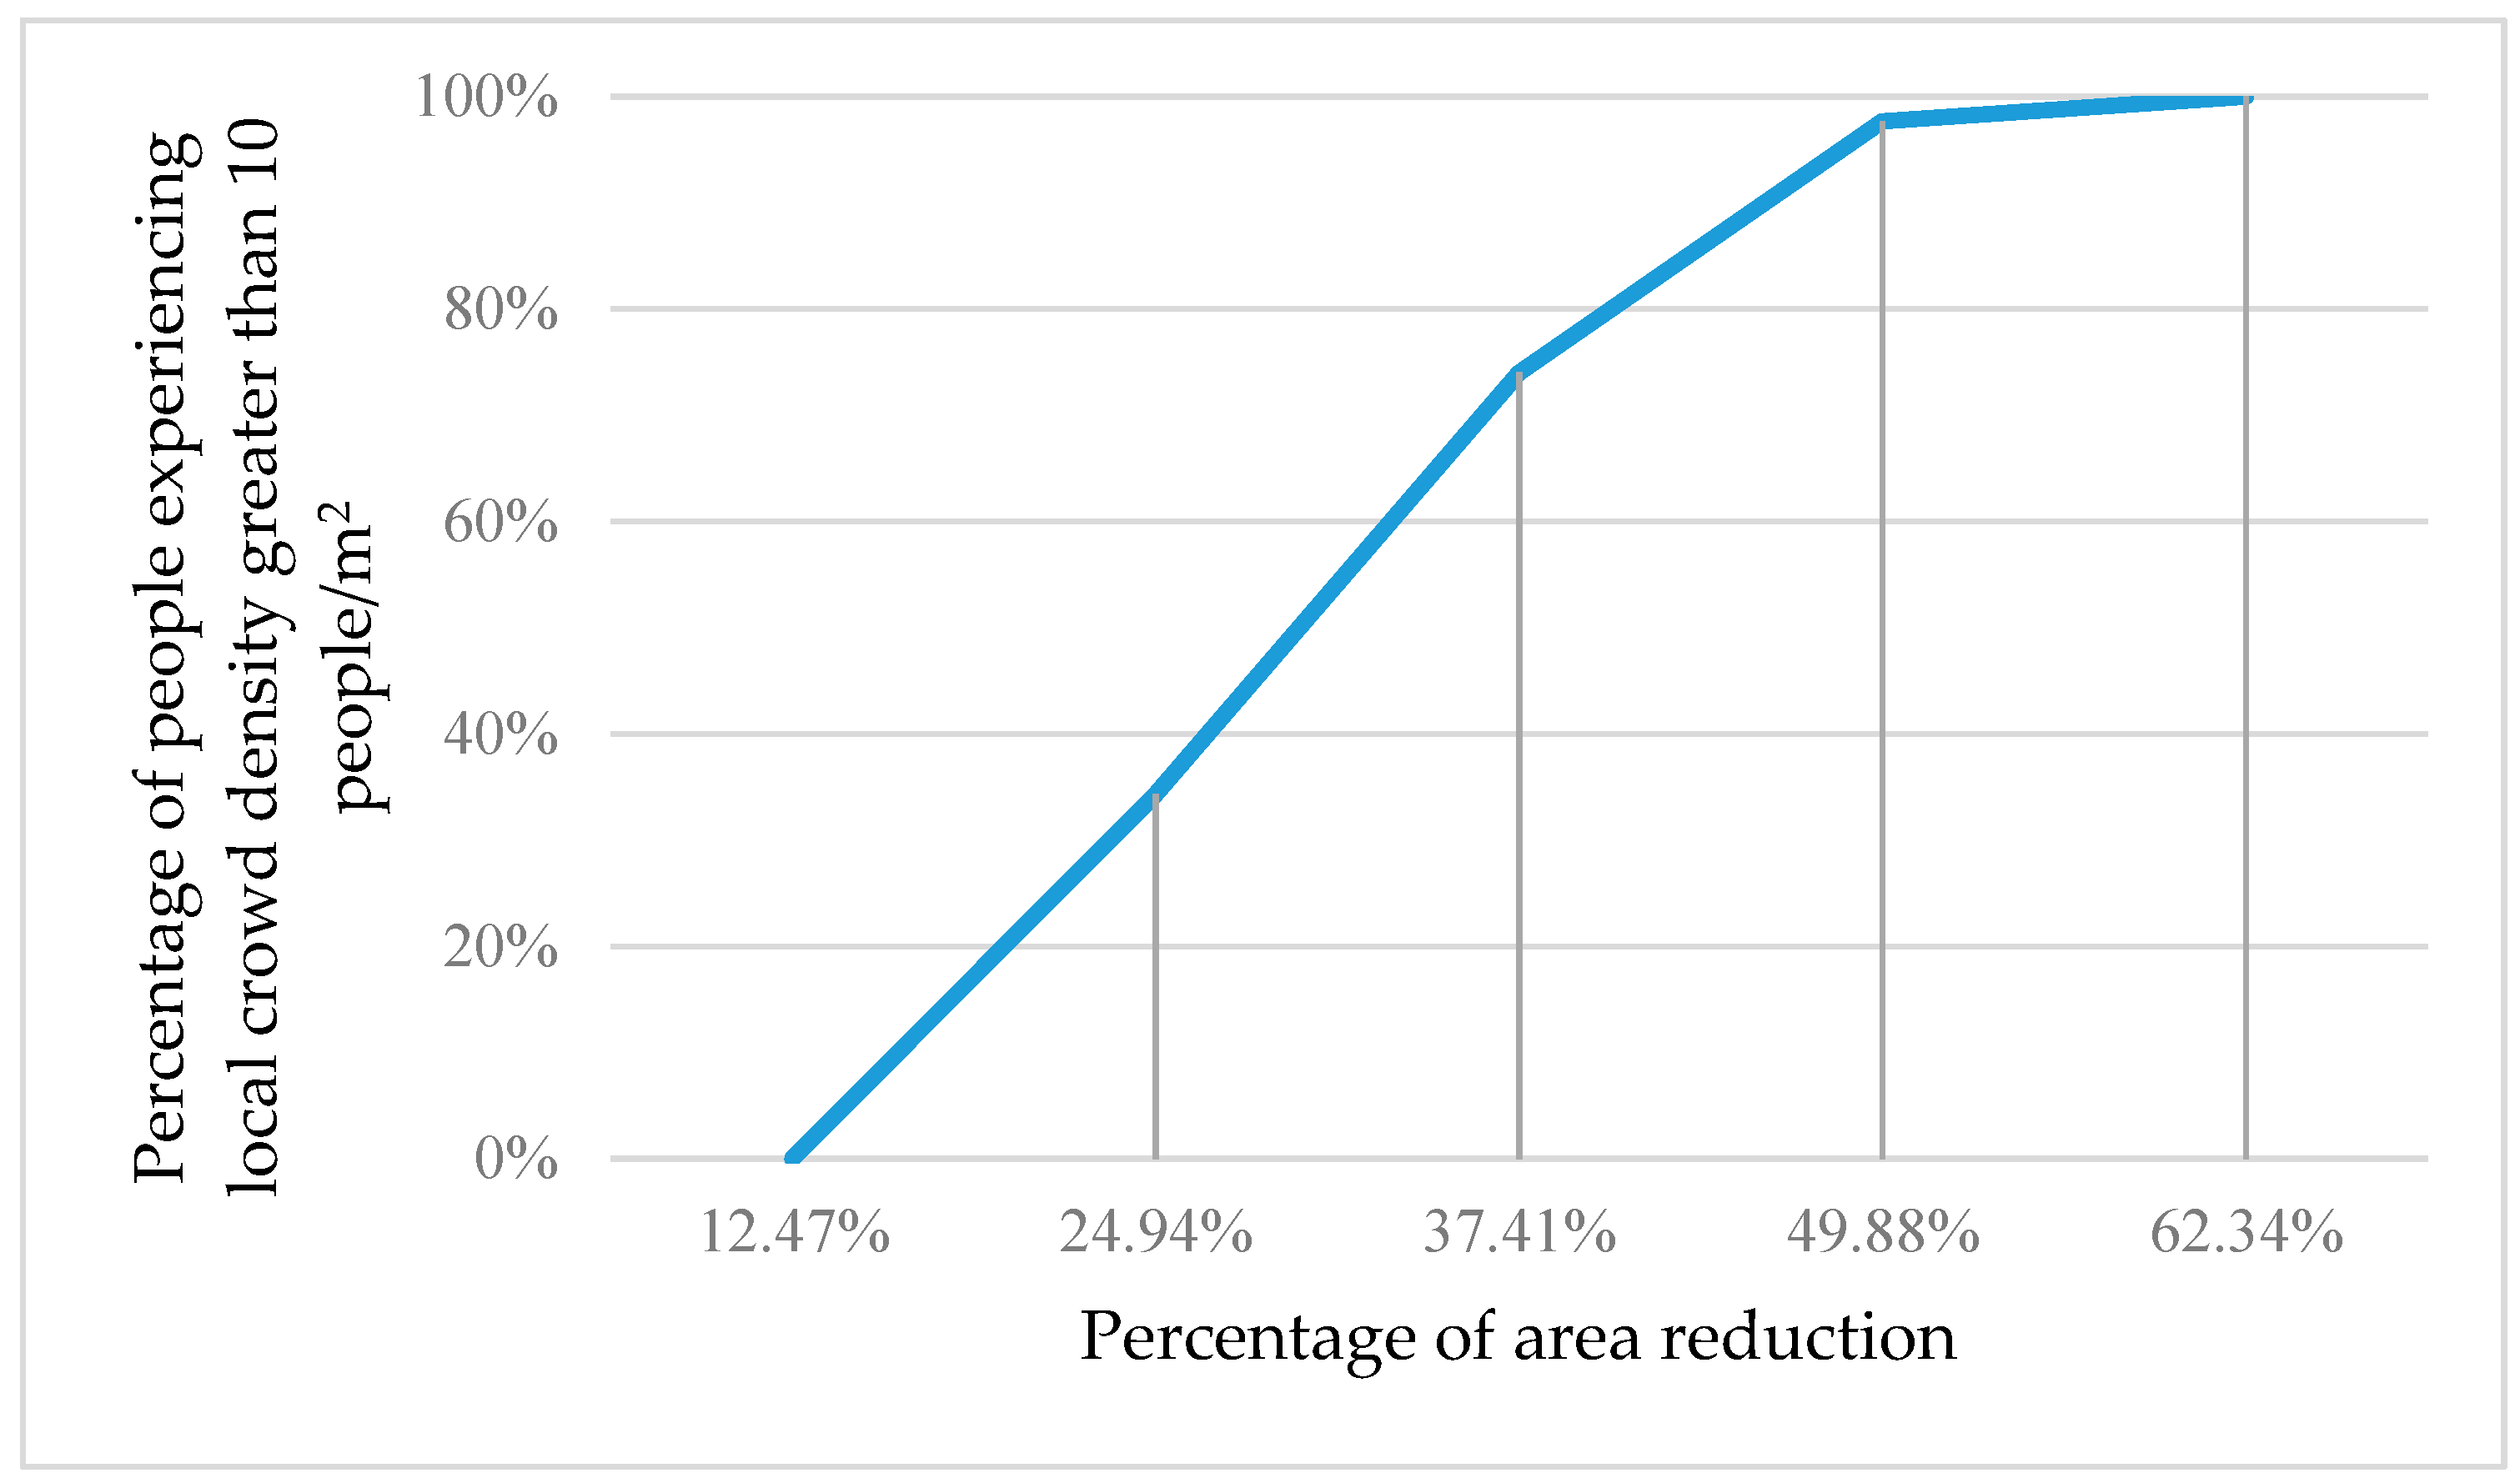
Figure 7 shows the percentage of people experiencing local crowd density greater than 10 people/m
2 as the occupied area shrinks.
5.2. Simulation Results for Static Crowd with 300 Agents
In this scenario, 300 agents are packed hexagonally with 20 agents in each row, which is shown in
Figure 8. When the wall at the bottom moves forward at 0.5 m, 1.0 m, 1.5 m, 2.0 m, and 2.5 m, respectively, the distribution of the local crowd density is shown in
Figure 9, with the same format and interpretation as above. It can be seen that the local crowd density increases continually when the occupied area shrinks and, finally, all agents experience a local crowd density of more than 13 people/m
2, while 97.3% of agents experience a local crowd density of more than 15 people/m
2.
Figure 10 shows the percentage of people experiencing a local crowd density greater than 10 people/m
2 as the occupied area shrinks.
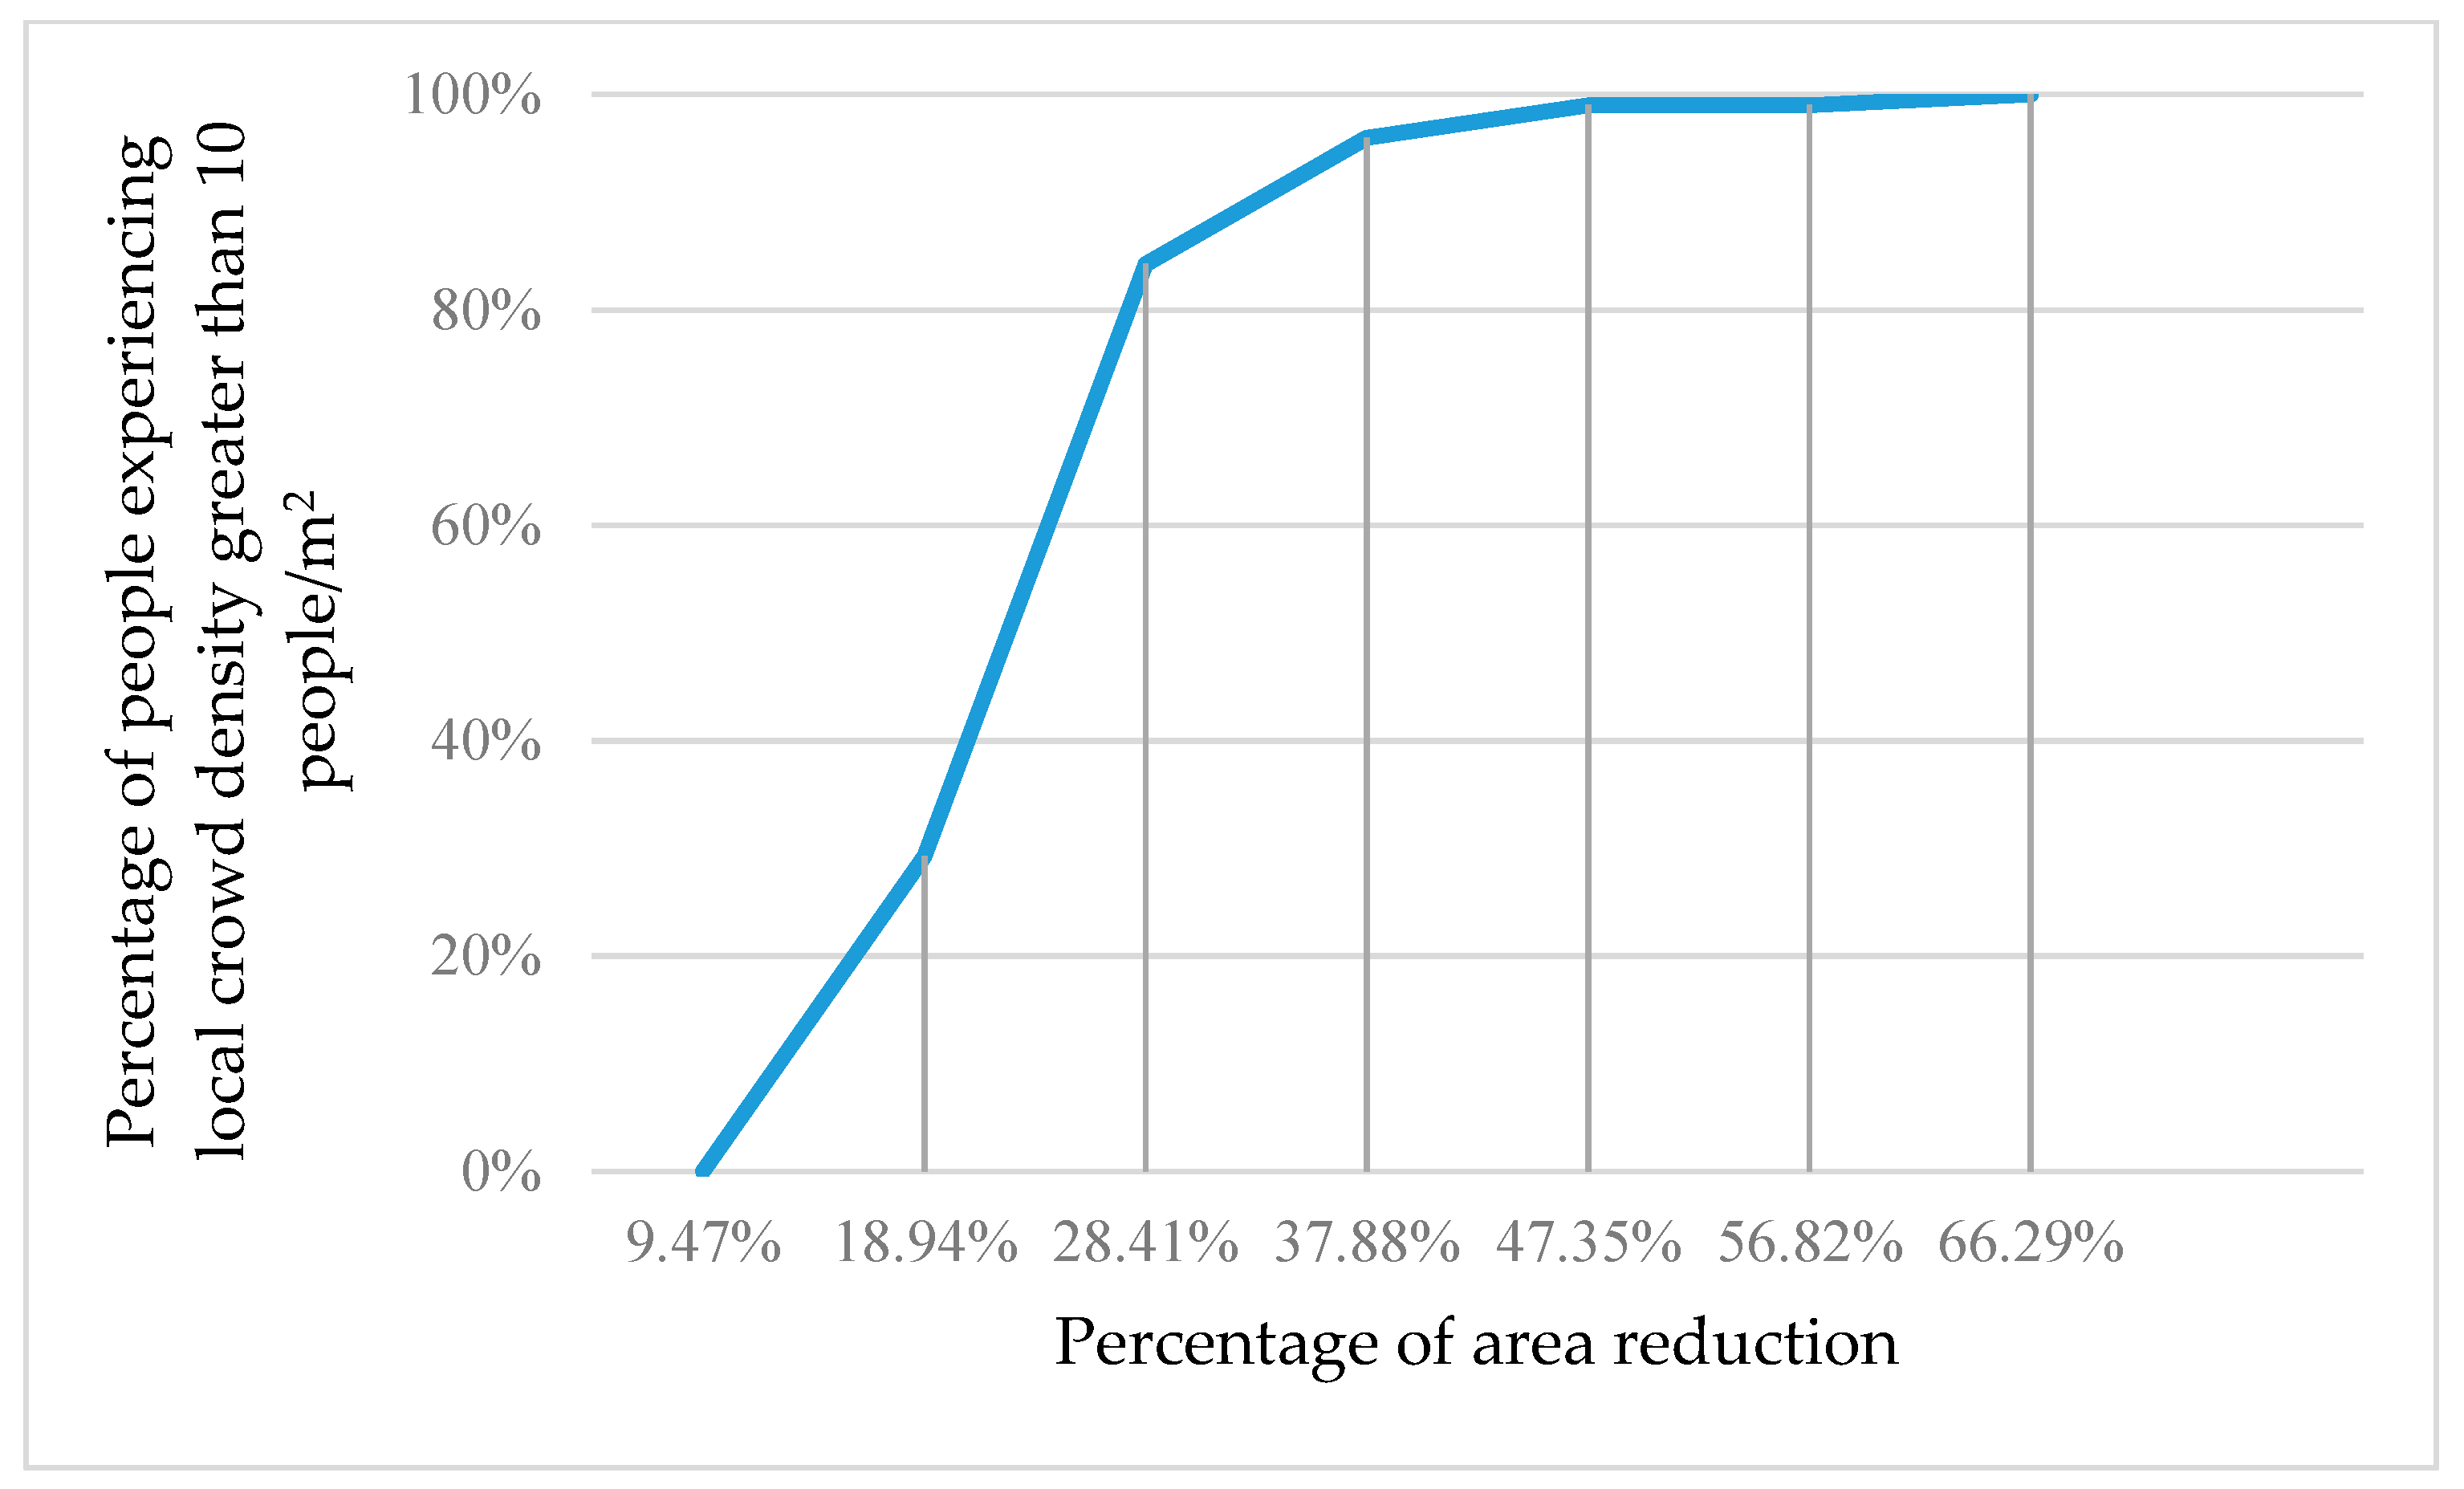
5.3. Simulation Results for Static Crowd with 400 Agents
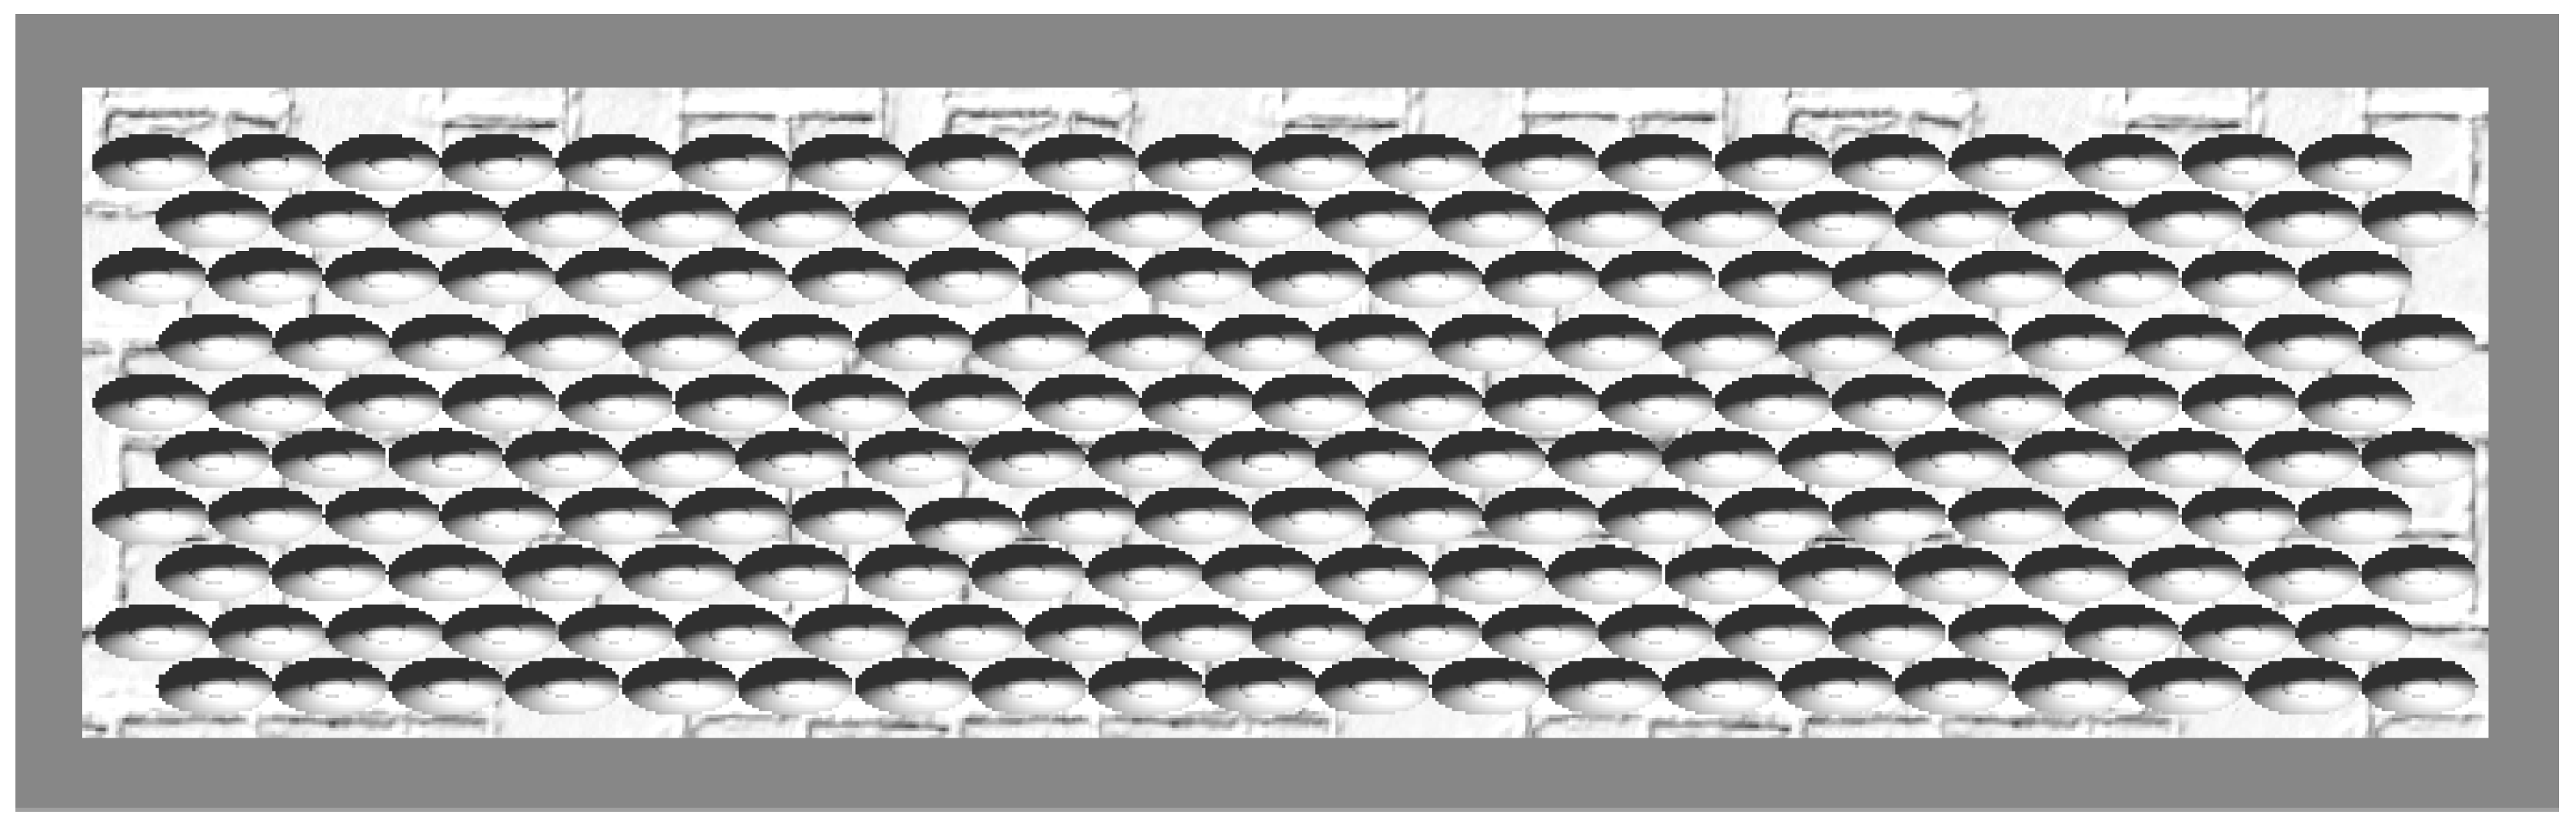
In this scenario, 400 agents are packed hexagonally with 20 agents in each row, which is shown in
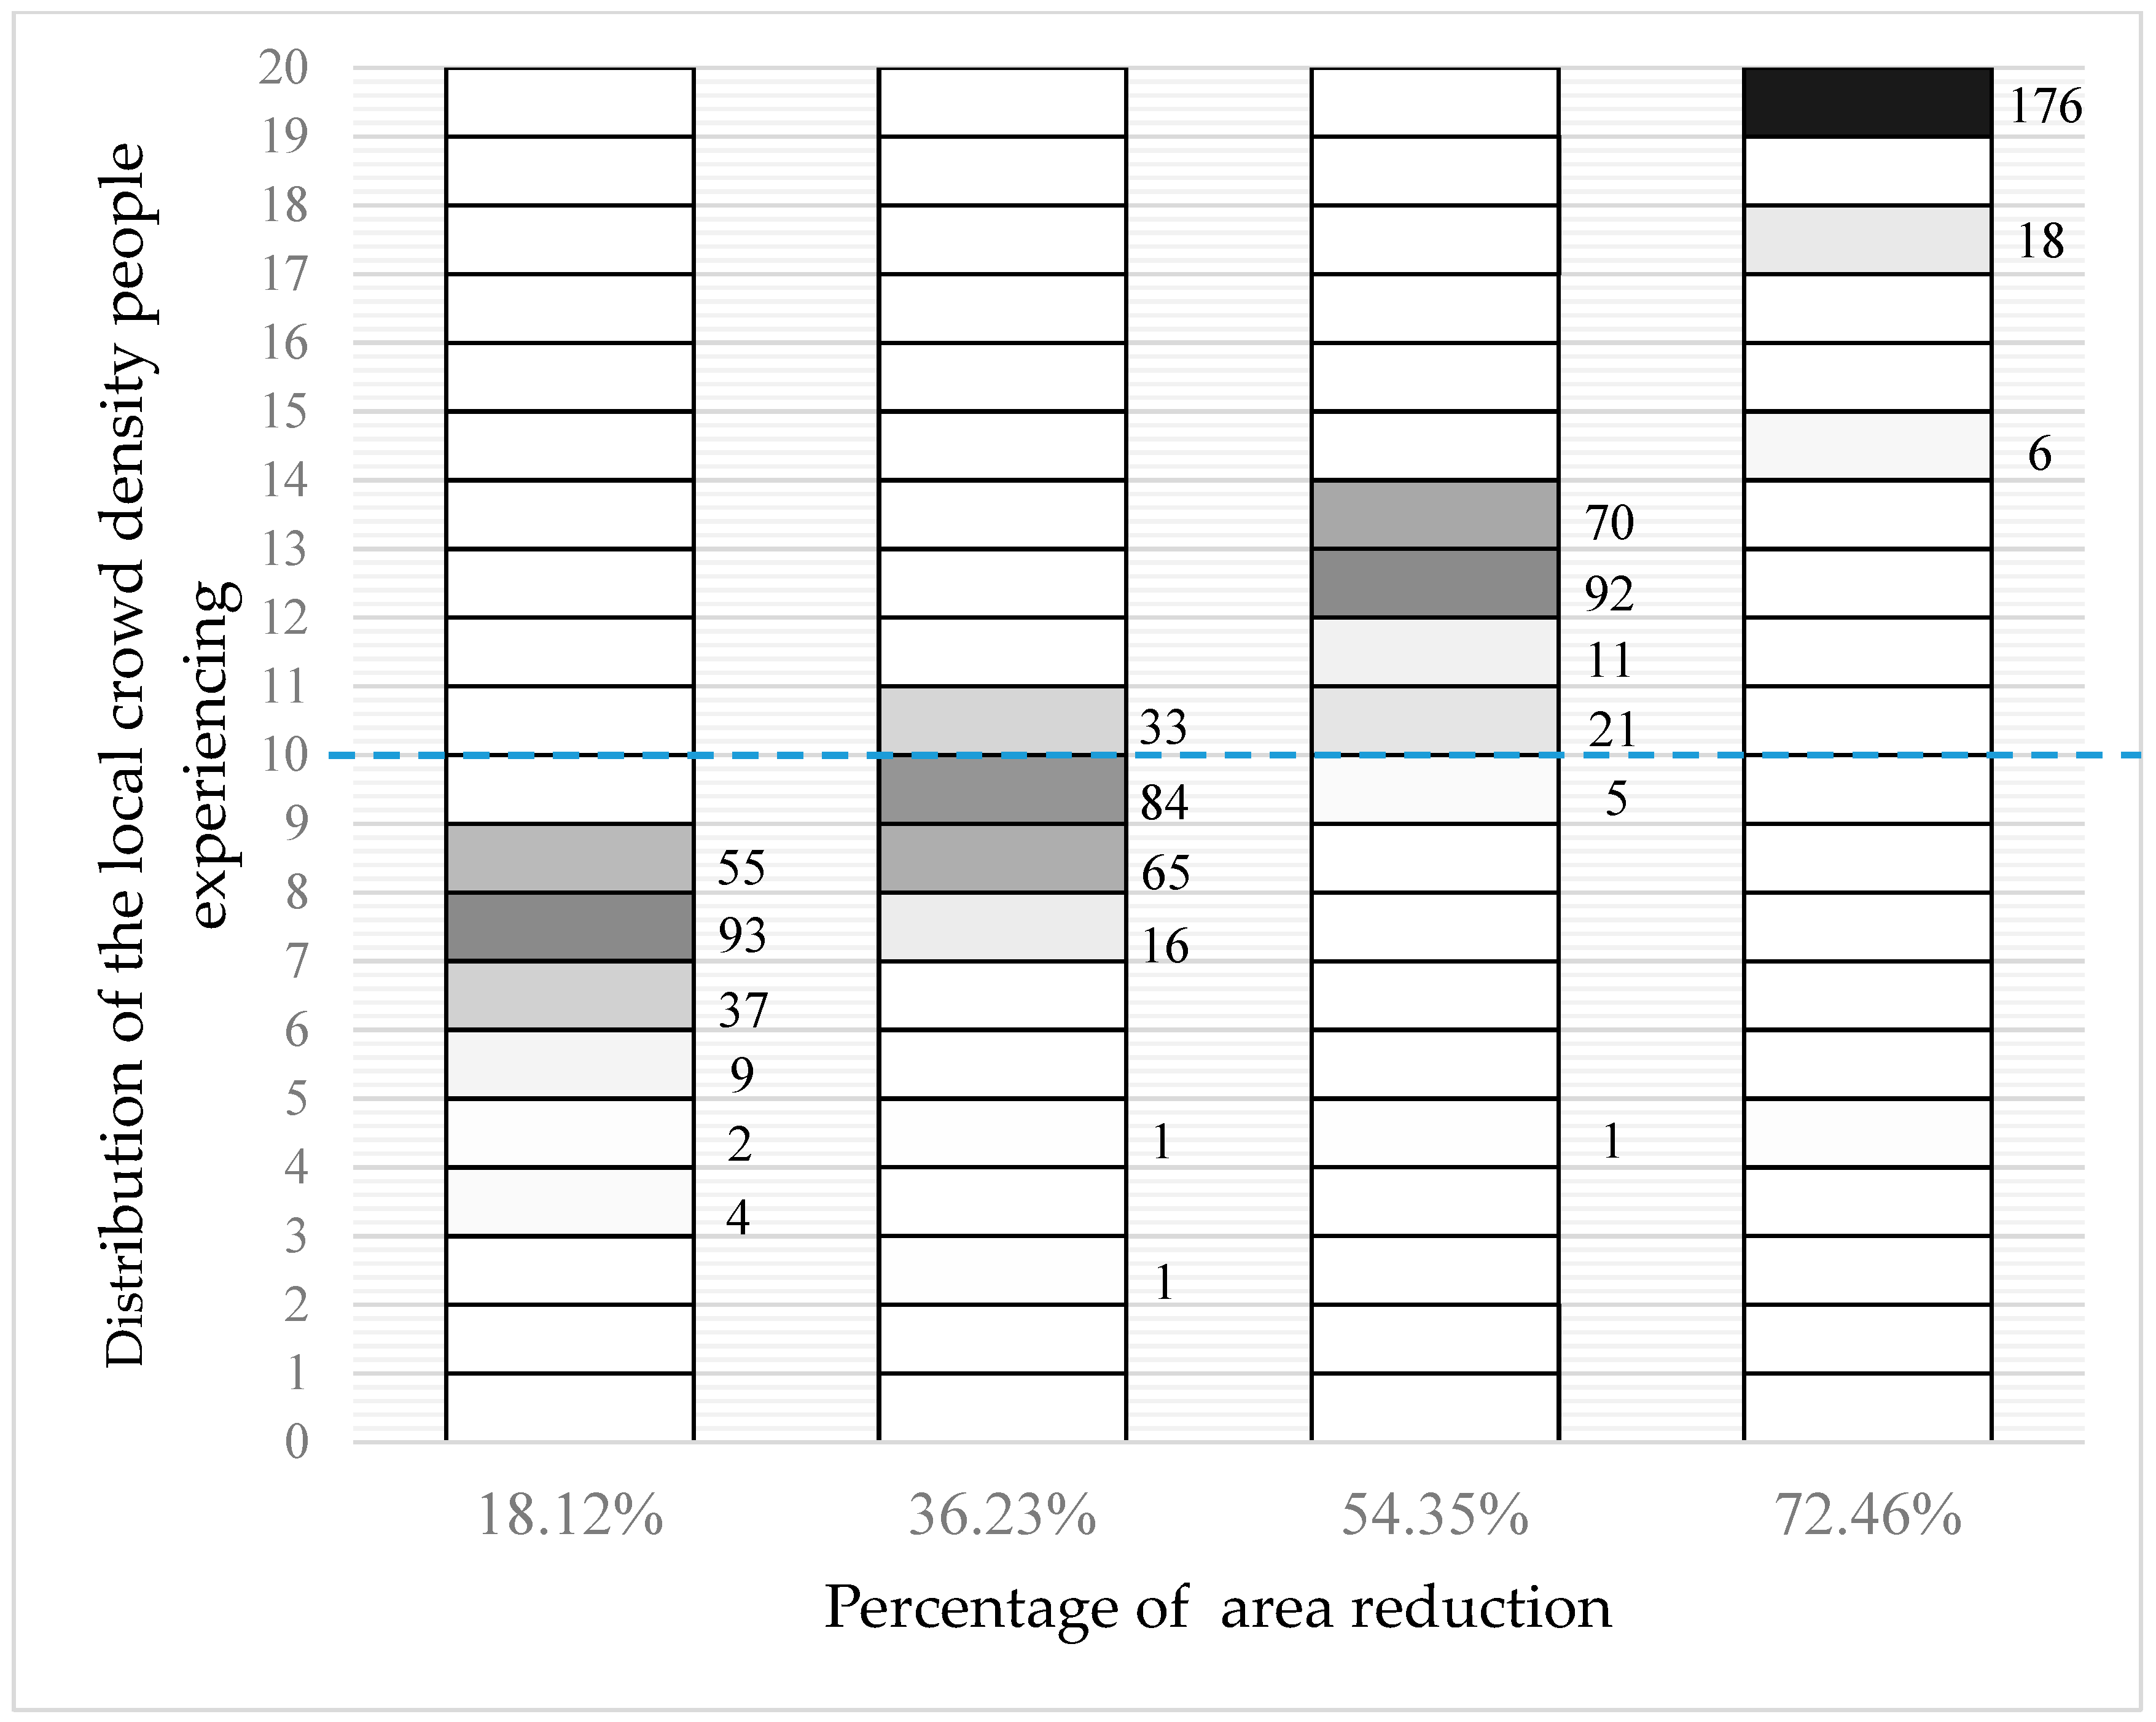
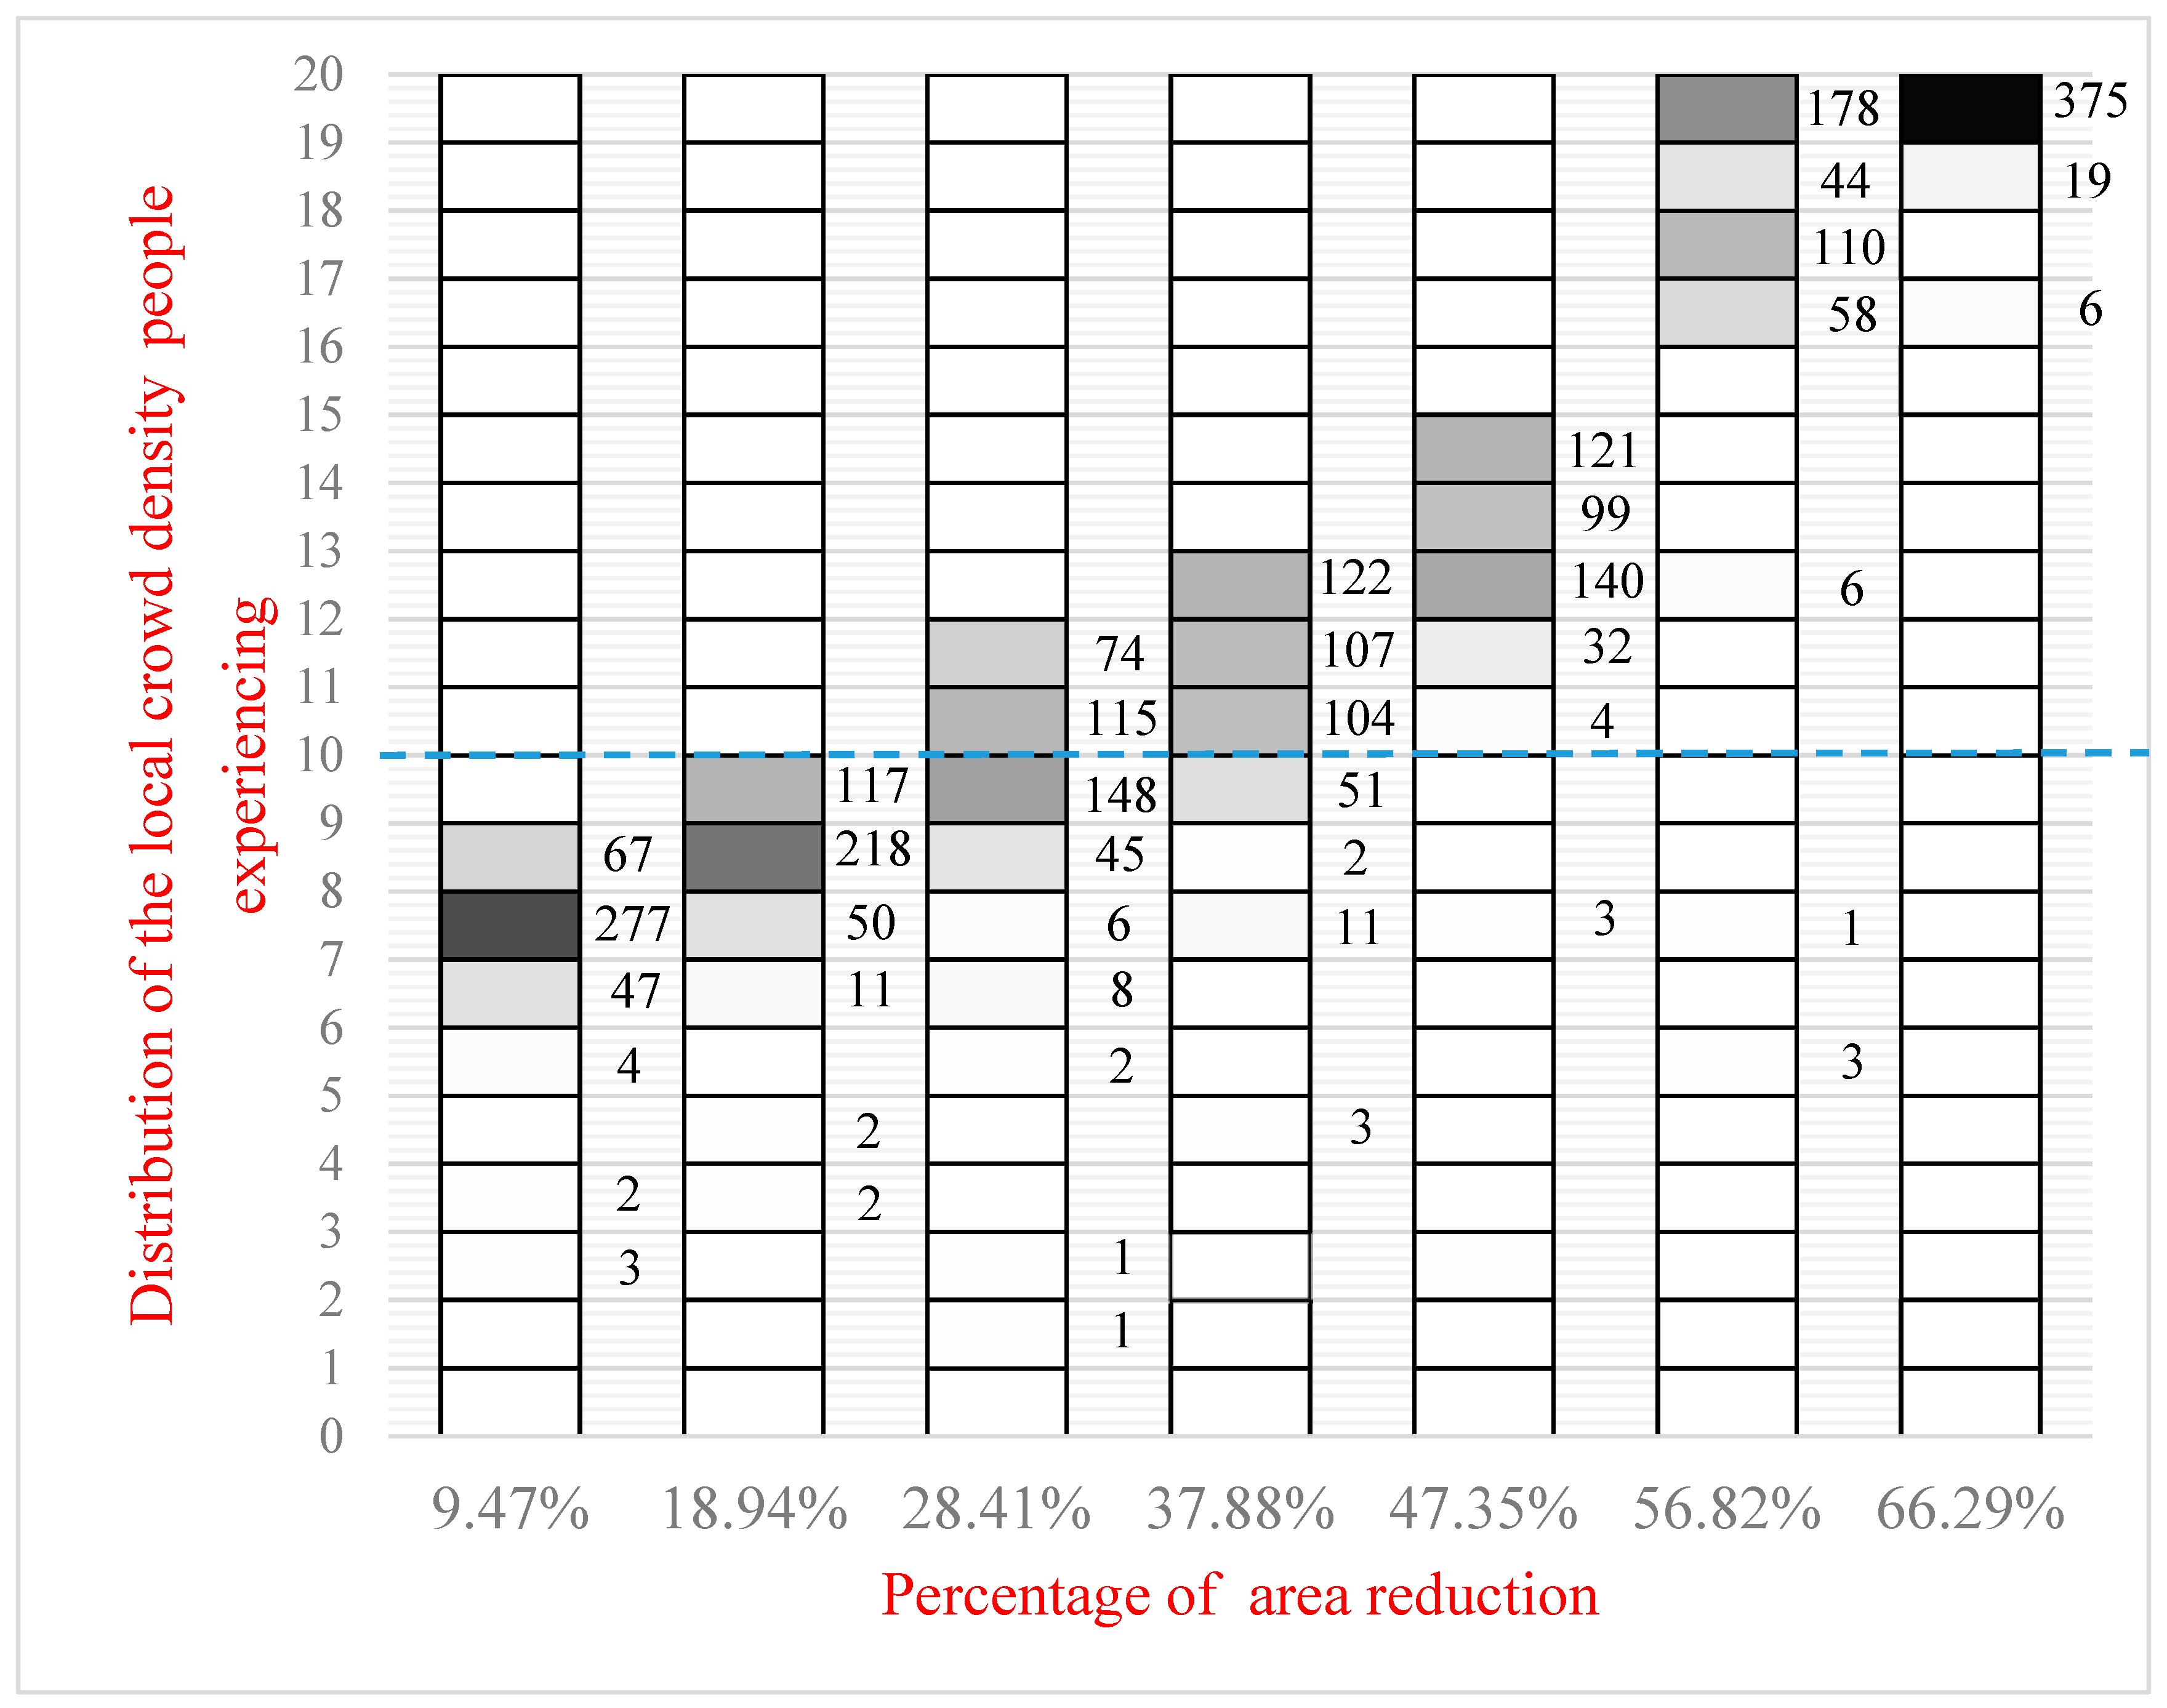
Figure 11. When the walls moves forward at 0.5 m, 1.0 m, 1.5 m, 2.0 m, 2.5 m, 3.0 m, and 3.5 m, respectively, the distribution of the local crowd density is shown in
Figure 12, with the same format and interpretation as above. It can be seen that local crowd density increases continually when the occupied area shrinks and finally, all agents experience a local crowd density of more than 17 people/m
2, while 93.75% of agents experience a local crowd density more than 20 people/m
2.
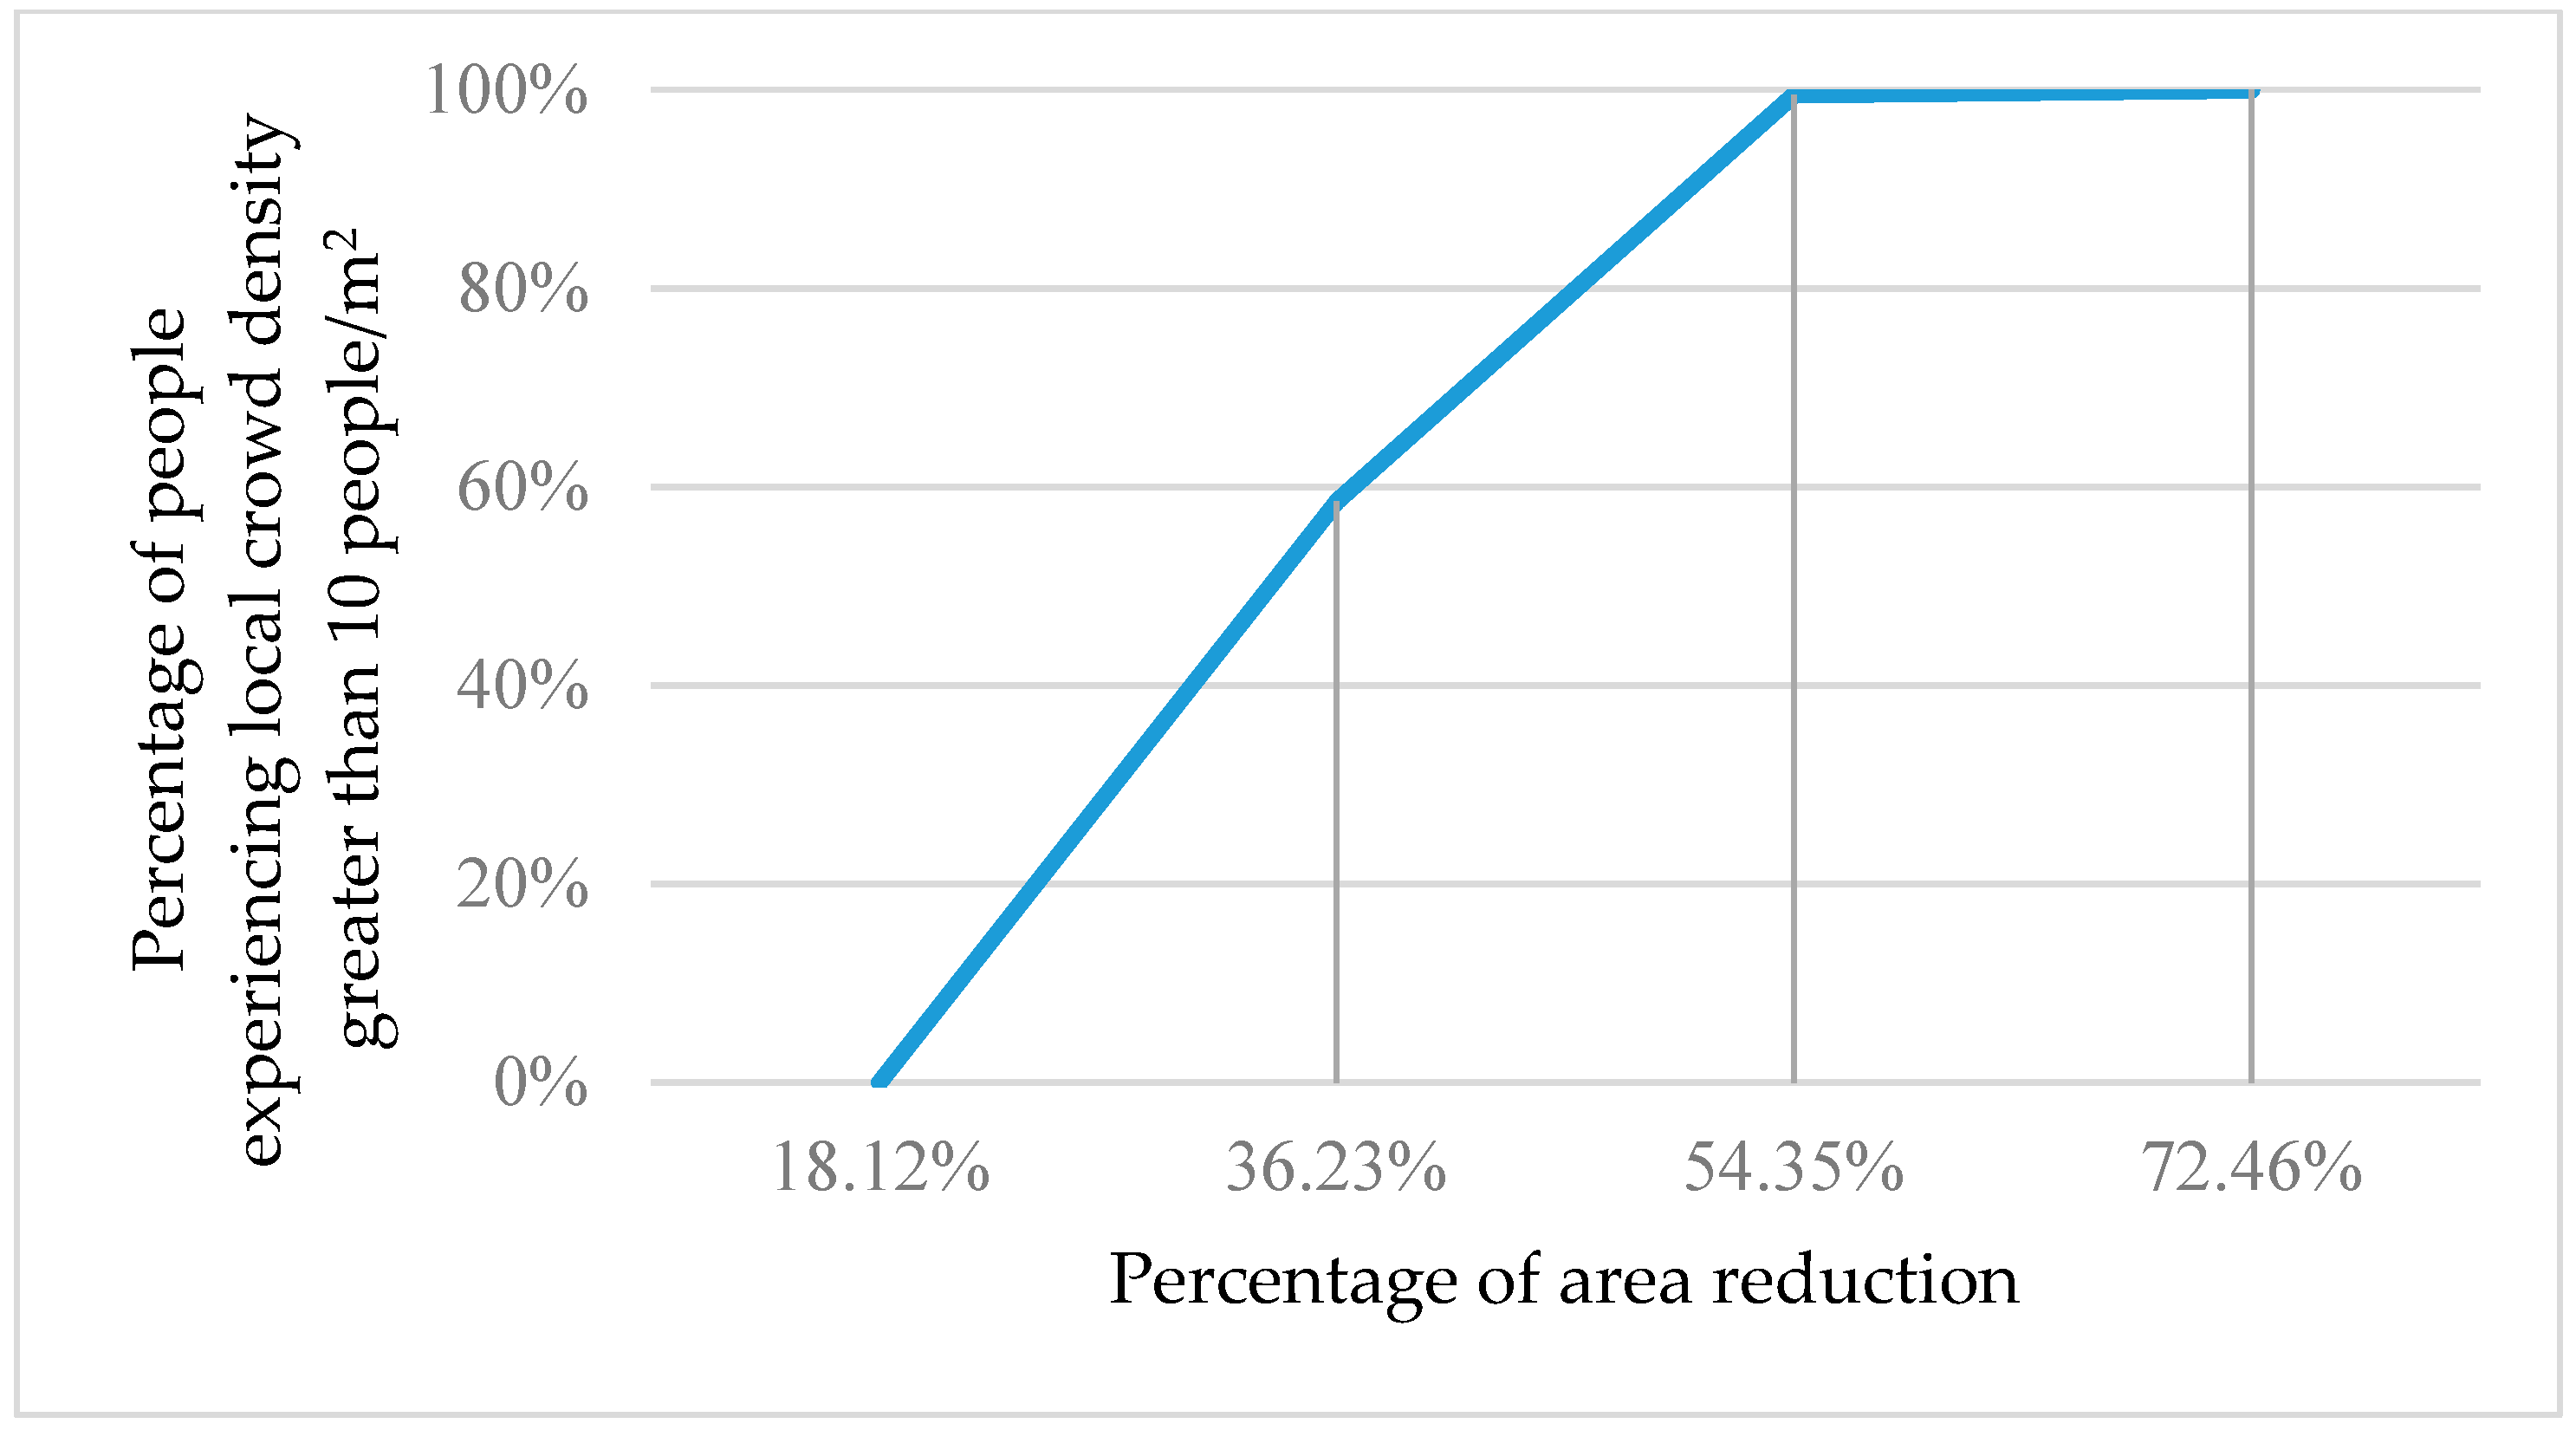
Figure 13 shows the percentage of people experiencing a local crowd density greater than 10 people/m
2 as the occupied area shrinks.
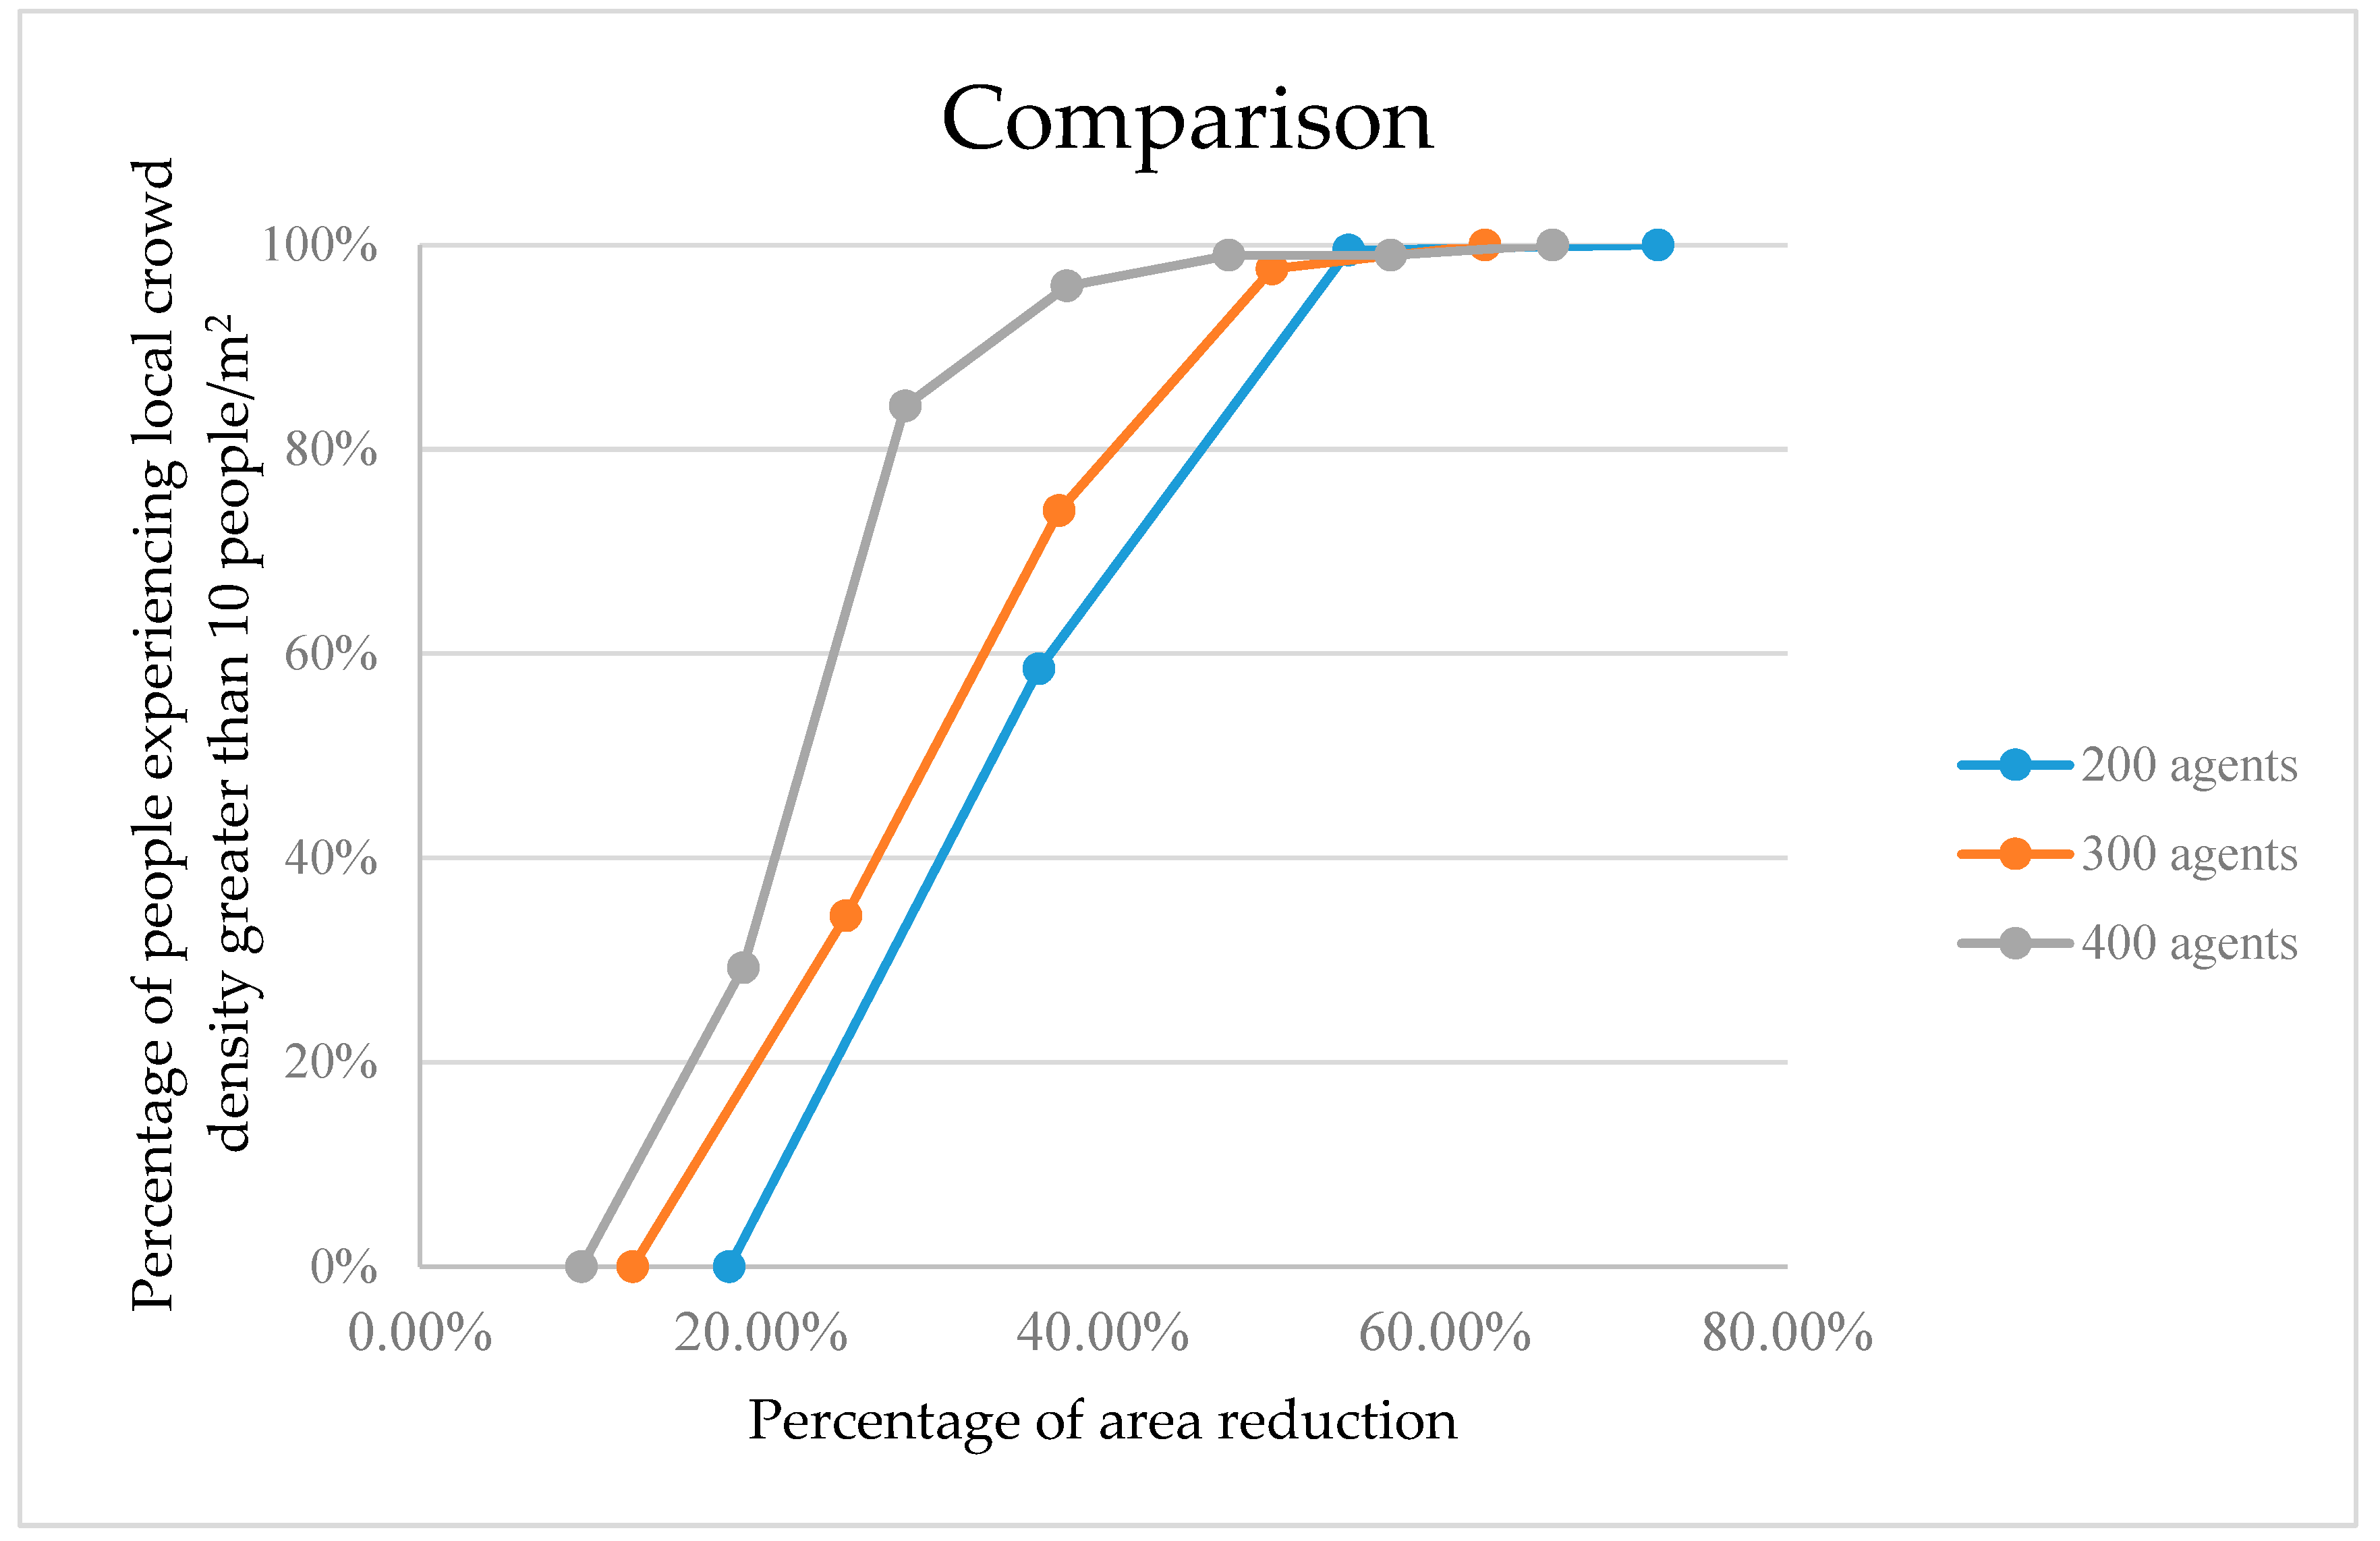
Figure 14 compares the percentage of people experiencing a local crowd density greater than 10 people/m
2 across all three simulation cases. It can be seen that when the occupied area containing a static crowd with 400 agents shrinks by about 20%, the percentage of people experiencing a local crowd density greater than 10 people/m
2 increases to almost 60%.
From
Figure 14, it appears that as crowd size increases, the percentage of individuals experiencing unsafe high densities increases, even at just a 25% reduction in occupied area. With a 50% area reduction, virtually all crowd individuals are fully compromised. Our physics-based approach to computing compression stress on densely packed crowds thus appears consistent and scalable to larger crowds, and may provide another predictive tool to evaluate potential dangers in obstructive environments.
6. Comparison and Discussion
We use physics-based simulations to understand the processes and consequences of compressive forces on high density static crowds consisting of up to 400 agents in a restricted space characterized by barriers to free movement. We computed the local density experienced by each individual and showed that human injury may occur with as little as a 20% reduction in area, and that densities become dangerously high for crowds of 200 to 400 people when the occupied area shrinks by 25%. Compared with social force models [
7], which allow for realistic pushing behavior and variable flow rates, our approach is physics-based and focuses on local crowd density within a rigid barrier geometric model. We used an elliptical cross-section human body surrogate that allowed us to begin the simulation with a reasonably dense crowd packing, but one that was still within the safe range. We opted to use cylinders without movable arms, as the principal danger in crowd crushes is torso compression and the consequent inability to breathe. The ellipsoid models the presence of the shoulder within the torso cross-section and this shape yields denser, less uniform packing at low compression, but quickly offers no “wiggle room” as compression increases. Furthermore, social force models are unsuitable for high density crowd simulation, since there is expected space between individuals from the repulsive force and it is thus difficult to deal with crowd densities greater than 4 people/m
2 [
31]. Cellular automata models [
32] are defined as mathematical idealizations of physical systems in which space and time are discrete, and physical quantities take a finite set of discrete values. The cellular grid defines the closest possible agent packing. Rule-based models [
23,
33] describe human movement with a set of rules and achieve more realistic human movement for low and medium density crowds, but cannot handle contact between individuals and therefore fail to simulate pushing and crushing behaviors. In
Table 4, we summarize how these models cannot deal with the simulation of high density crowd and how our approach can simulate high density crowds with local agent densities greater than 10 people/m
2.
By using the physics simulation in Unity3D, we achieved real-time simulations. The evolution of the crowd crush situation can be observed directly while the piston-like wall compresses the crowd. Other physics-based simulators in other animation platforms can be readily substituted. To build a valid physical simulation we used data we found reported in the media. Our results illustrate that local crowd density is a crucial factor to be considered for the prevention of crowd crush disasters.
Author Contributions
L.S. and N.I.B. conceived and designed the experiments; L.S. performed the experiments, analyzed results and wrote the paper; N.I.B. reviewed and edited the paper.
Funding
This work was supported by the National Science Foundation of China under Grant No. 61300101, National Science and Technology Major Project of the Ministry of Science and Technology of China under Grant No. 2014ZX07405002 and Key R&D Program of Jiangsu Province under Grant No. BE2017035.
Conflicts of Interest
The authors declare no conflict of interest.
References
- Cai, M. The Research and Application of The Crowd Density Analysis and Risk Early Warning of Stampedes Occurred in Open Public Places. Master’s Thesis, Jinan University, Guangzhou, China, 2017. [Google Scholar]
- Fruin, J. 2010. Available online: http://www.crowddynamics.com (accessed on 22 November 2018).
- Fruin, J. The causes and preventions of crowd disasters. In Proceedings of the First International Conference on Engineering for Crowd Safety, London, UK, 17–18 March 1993. [Google Scholar]
- Lee, R.C.; Hughes, R.L. Exploring trampling and crushing in a crowd. J. Transp. Eng. 2005, 131, 575–582. [Google Scholar] [CrossRef]
- Hughes, R.L. A continuum theory for the flow of pedestrians. Transp. Res. Part B Methodol. 2002, 36, 507–535. [Google Scholar] [CrossRef]
- Lighthill, M.J.; Whitham, G.B. On kinematic waves. I: Flood movement in long rivers; II: Theory of traffic flow on long crowded roads. Proc. R. Soc. Lond. Ser. A. 1955, 229, 281–345. [Google Scholar] [CrossRef]
- Helbing, D.; Farkas, I.; Vicsek, T. Simulating Dynamical Features of Escape Panic. Nature 2000, 407, 487–490. [Google Scholar] [CrossRef] [PubMed]
- Pelechano, N.; Allbeck, J.M.; Badler, N.I. Controlling Individual Agents in High-Density Crowd Simulation. In Proceedings of the ACM SIGGRAPH/Eurographics Symposium on Computer Animation (SCA), San Diego, CA, USA, 3–4 August 2007; pp. 99–108. [Google Scholar]
- Heigeas, L.; Luciani, A.; Thollot, J. A physically-based particle model of emergent crowd behaviors. In Proceedings of the International Conference on Computer Graphics and Vision, Moscow, Russia, 5–10 September 2003. [Google Scholar]
- Henein, C.M.; White, T. Macroscopic effects of microscopic forces between agents in crowd models. Phys. A Stat. Mech. Its Appl. 2007, 373, 694–712. [Google Scholar] [CrossRef]
- Kirchner, A.; Schadschneider, A. Simulation of evacuation processes using a bionics-inspired cellular automaton model for pedestrian dynamics. Phys. A Stat. Mech. Its Appl. 2002, 312, 260–276. [Google Scholar] [CrossRef]
- Teknomo, K. Microscopic Pedestrian Flow Characteristics: Development of an Image Processing Data Collection and Simulation Model. Ph.D. Thesis, Tohoku University, Sendaim, Japan, 2002. [Google Scholar]
- Pelechano, N.; Allbeck, J.; Badler, N. Virtual Crowds, Methods, Simulation and Control. In Synthesis Lectures on Computer Graphics and Animation; Morgan & Claypool Publishers: Williston, VT, USA, 2008. [Google Scholar]
- Seyfried, A.; Steffen, B.; Klingsch, W.; Boltes, M. The fundamental diagram of pedestrian movement revisited. J. Stat Mech. 2005, 10. [Google Scholar] [CrossRef]
- Narain, R.; Golas, A.; Curtis, S.; Lin, M.C. Aggregate dynamics for dense crowd simulation. ACM Trans. Graph. 2009, 28, 122. [Google Scholar] [CrossRef]
- van Toll Wouter, G.; Cook, A.F., IV; Geraerts, R. Real-time Density-based Crowd Simulation. Comput. Anim. Virtual Worlds 2012, 23, 59–69. [Google Scholar] [CrossRef]
- Guy, S.J.; Chhugani, J.; Curtis, S.; Lin, M.C.; Manocha, D. Pledestrians: A least-effort approach to crowd simulation. In Proceedings of the ACM SIGGRAPH/Eurographics Symposium on Computer Animation, Madrid, Spain, 2–4 July 2010; pp. 119–128. [Google Scholar]
- Mousas, C.; Newbury, P.; Anagnostopoulos, C.N. The minimum energy expenditure shortest path method. J. Graph. Tools 2013, 17, 31–44. [Google Scholar] [CrossRef]
- Best, A.P.; Narang, S.; Curtis, S.; Manocha, D. DenseSense: Interactive Crowd Simulation using Density-Dependent Filters. In Proceedings of the ACM SIGGRAPH/Eurographics Symposium on Computer Animation, Zurich, Switzerland, 11–13 July 2016; pp. 97–102. [Google Scholar]
- Kang, W.; Han, Y. A Simple and Realistic Pedestrian Model for Crowd Simulation and Application. arXiv, 2017; arXiv:1708.03080. [Google Scholar]
- Tsiropoulou, E.E.; Koukas, K.; Papavassiliou, S. A Socio-Physical and Mobility—Aware Coalition Formation Mechanism in Public Safety Networks. EAI Endorsed Trans. Future Internet 2018, 4, 154176. [Google Scholar]
- Tsiropoulou, E.E.; Paruchuri, S.T.; Baras, J.S. Interest, energy and physical-aware coalition formation and resource allocation in smart IoT applications. In Proceedings of the IEEE 51st Annual Conference on Information Sciences and Systems (CISS), Baltimore, MD, USA, 22–24 March 2017; pp. 1–6. [Google Scholar]
- Thalmann, D.; Musse, S.R. A hierarchical model for real time simulation of virtual human crowds. IEEE Trans. Vis. Comput. Graph. 2001, 7, 152–164. [Google Scholar]
- Bayazit, O.B.; Line, J.M.; Amato, N.M. Better group behaviors in complex environments with global roadmaps. In Proceedings of the Eighth International Conference on Artificial Life, Sydney, Australia, 9–13 December 2002; pp. 362–370. [Google Scholar]
- Collins, A.J.; Frydenlund, E. Strategic group formation in agent-based simulation. Simulation 2018, 94, 179–193. [Google Scholar] [CrossRef]
- Elzie, T.; Frydenlund, E.; Collins, A.J.; Robinson, R.M. Conceptualizing intragroup and intergroup dynamics within a controlled crowd evacuation. J. Emerg. Manag. 2015, 13, 109–120. [Google Scholar] [CrossRef] [PubMed]
- Collins, A.; Elzie, T.; Frydenlund, E.; Robinson, R.M. Do groups matter? An agent-based modeling approach to pedestrian egress. Transp. Res. Procedia 2014, 2, 430–435. [Google Scholar] [CrossRef]
- Wang, X. Research on Collection and Analysis of Human Body Data and Application in Garment Industry-Research on The Body Thickness of Young Females Residing at Northeastern Area. Master’s Thesis, Dalian Polytechnic University, Dalian, China, 2012. [Google Scholar]
- Xu, Y.J.; Han, Y.H.; Hong, R.C.; Tian, Q. Sequential Video VLAD: Training the Aggregation Locally and Temporally. IEEE Trans. Image Process. 2018, 27, 4933–4944. [Google Scholar] [CrossRef] [PubMed]
- Zhang, S.J.; Feng, W.; Wan, L.; Jiang, J.M. Scalable image co-segmentation using color and covariance Features. In Proceedings of the 21st International Conference on Pattern Recognition (ICPR2012), Tsukuba, Japan, 11–15 November 2012; pp. 3708–3711. [Google Scholar]
- Jia, W.Z.; Feng, C.; Heng, S.Z. Agent-Based Realization of Social Force Model and Simulation of Pedestrians in Subway Passageway. J. South China Univ. Technol. Nat. Ed. 2013, 41, 90–95. [Google Scholar]
- Chenney, S. Flow tiles. In Proceedings of the ACM SIGGRAPH/Eurographics Symposium on Computer Animation, Grenoble, France, 27–29 August 2004; pp. 233–242. [Google Scholar]
- Reynolds, C. Flocks, herds and schools: A distributed behavioral model. ACM Comput. Graph. 1987, 21, 25–34. [Google Scholar] [CrossRef]
Figure 1.
A total of 400 agents are represented with different colors. During simulation the bottom wall moves towards the top wall.
Figure 1.
A total of 400 agents are represented with different colors. During simulation the bottom wall moves towards the top wall.
Figure 2.
The top view of 400 agents with randomly assigned colors when the bottom wall moves toward the top wall by 1 m.
Figure 2.
The top view of 400 agents with randomly assigned colors when the bottom wall moves toward the top wall by 1 m.
Figure 3.
Local crowd density computation. Local crowd density is 10.49 people/m2 in the 1 m2 area enclosed by the black lines.
Figure 3.
Local crowd density computation. Local crowd density is 10.49 people/m2 in the 1 m2 area enclosed by the black lines.
Figure 4.
Local crowd density represented by the color scale in
Table 3.
Figure 4.
Local crowd density represented by the color scale in
Table 3.
Figure 5.
A total of 200 agents are packed hexagonally with three fixed walls, while the wall at the bottom moves upwards in the simulation.
Figure 5.
A total of 200 agents are packed hexagonally with three fixed walls, while the wall at the bottom moves upwards in the simulation.
Figure 6.
The distribution of local density that the 200 agents experience when the lower wall moves by 0.5 m, 1.0 m, 1.5 m, and 2.0 m to compress the occupied space.
Figure 6.
The distribution of local density that the 200 agents experience when the lower wall moves by 0.5 m, 1.0 m, 1.5 m, and 2.0 m to compress the occupied space.
Figure 7.
The percentage of 200 people experiencing local crowd density greater than 10 people/m2 as the occupied area shrinks.
Figure 7.
The percentage of 200 people experiencing local crowd density greater than 10 people/m2 as the occupied area shrinks.
Figure 8.
A total of 300 agents are packed hexagonally with three fixed walls, while the wall at the bottom moves upwards in the simulation.
Figure 8.
A total of 300 agents are packed hexagonally with three fixed walls, while the wall at the bottom moves upwards in the simulation.
Figure 9.
The distribution of local density that 300 agents experience when the lower wall moves by 0.5 m, 1.0 m, 1.5 m, 2.0 m, and 2.5 m to compress the occupied space.
Figure 9.
The distribution of local density that 300 agents experience when the lower wall moves by 0.5 m, 1.0 m, 1.5 m, 2.0 m, and 2.5 m to compress the occupied space.
Figure 10.
The percentage of people experiencing local crowd density greater than 10 people/m2 as the occupied area shrinks.
Figure 10.
The percentage of people experiencing local crowd density greater than 10 people/m2 as the occupied area shrinks.
Figure 11.
A total of 400 agents are packed hexagonally with three fixed walls, while the wall at the bottom moves upward in the simulation.
Figure 11.
A total of 400 agents are packed hexagonally with three fixed walls, while the wall at the bottom moves upward in the simulation.
Figure 12.
The distribution of local density that 400 agents experience when the lower wall moves by 0.5 m, 1.0 m, 1.5 m, 2.0 m, 2.5 m, 3.0 m, and 3.5 m to compress the occupied space.
Figure 12.
The distribution of local density that 400 agents experience when the lower wall moves by 0.5 m, 1.0 m, 1.5 m, 2.0 m, 2.5 m, 3.0 m, and 3.5 m to compress the occupied space.
Figure 13.
The percentage of people experiencing local crowd density greater than 10 people/m2 as the occupied area shrinks.
Figure 13.
The percentage of people experiencing local crowd density greater than 10 people/m2 as the occupied area shrinks.
Figure 14.
The percentage of people experiencing local crowd density greater than 10 people/m2 as the occupied area shrinks for the three population sizes.
Figure 14.
The percentage of people experiencing local crowd density greater than 10 people/m2 as the occupied area shrinks for the three population sizes.
Table 1.
Agent parameters.
Table 1.
Agent parameters.
| Attributes | Value |
|---|
| Height | 1.7 m |
| Horizontal width | 0.5 m |
| Vertical width | 0.25 m |
| Orientation | Random |
| Packing pattern | Hexagonal |
Table 2.
Physical Parameters of Agents.
Table 2.
Physical Parameters of Agents.
| Attributes | Value |
|---|
| Mass | 50 kg |
| Drag | 0 |
| Angular Drag | 0.05 |
| Use gravity | Yes |
| Collider | Capsule Collider |
Table 3.
Mapping of local crowd density and color scale.
Table 3.
Mapping of local crowd density and color scale.
| Local crowd density | Color scale |
|---|
| 1~4 | blue |
| 5~8 | green |
| 9~12 | yellow |
| 13~16 | orange |
| 17~20 | red |
Table 4.
Comparisons with classical crowd simulation models.
Table 4.
Comparisons with classical crowd simulation models.
| | Space | Physics-Based | Crowd Density |
|---|
| Social force model | continuous | No | Difficult to handle crowd with crowd density greater than 4 people/m2 |
| Cellular automata model | discrete | No | Low; limited by grid resolution |
| Rule-based model | continuous | No | Low or medium |
| Our approach | continuous | Yes | Can handle crowd with crowd density greater than 10 people/m2 |
© 2018 by the authors. Licensee MDPI, Basel, Switzerland. This article is an open access article distributed under the terms and conditions of the Creative Commons Attribution (CC BY) license (http://creativecommons.org/licenses/by/4.0/).


