Rapid Separation of Enantiomeric Impurities in Chiral Molecules by a Self-Referential Weak Measurement System

Abstract
1. Introduction
2. Theory
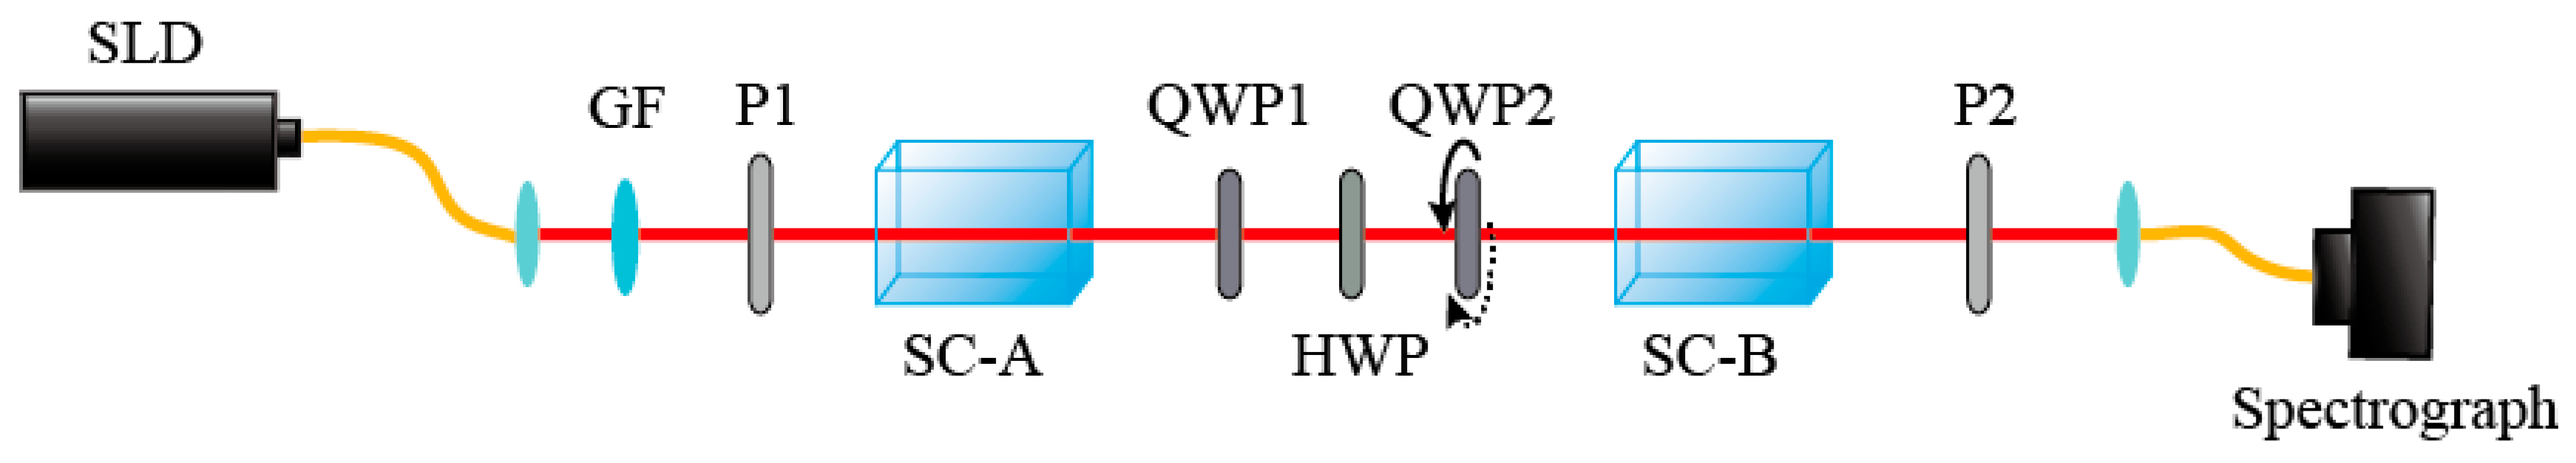
3. Experiment
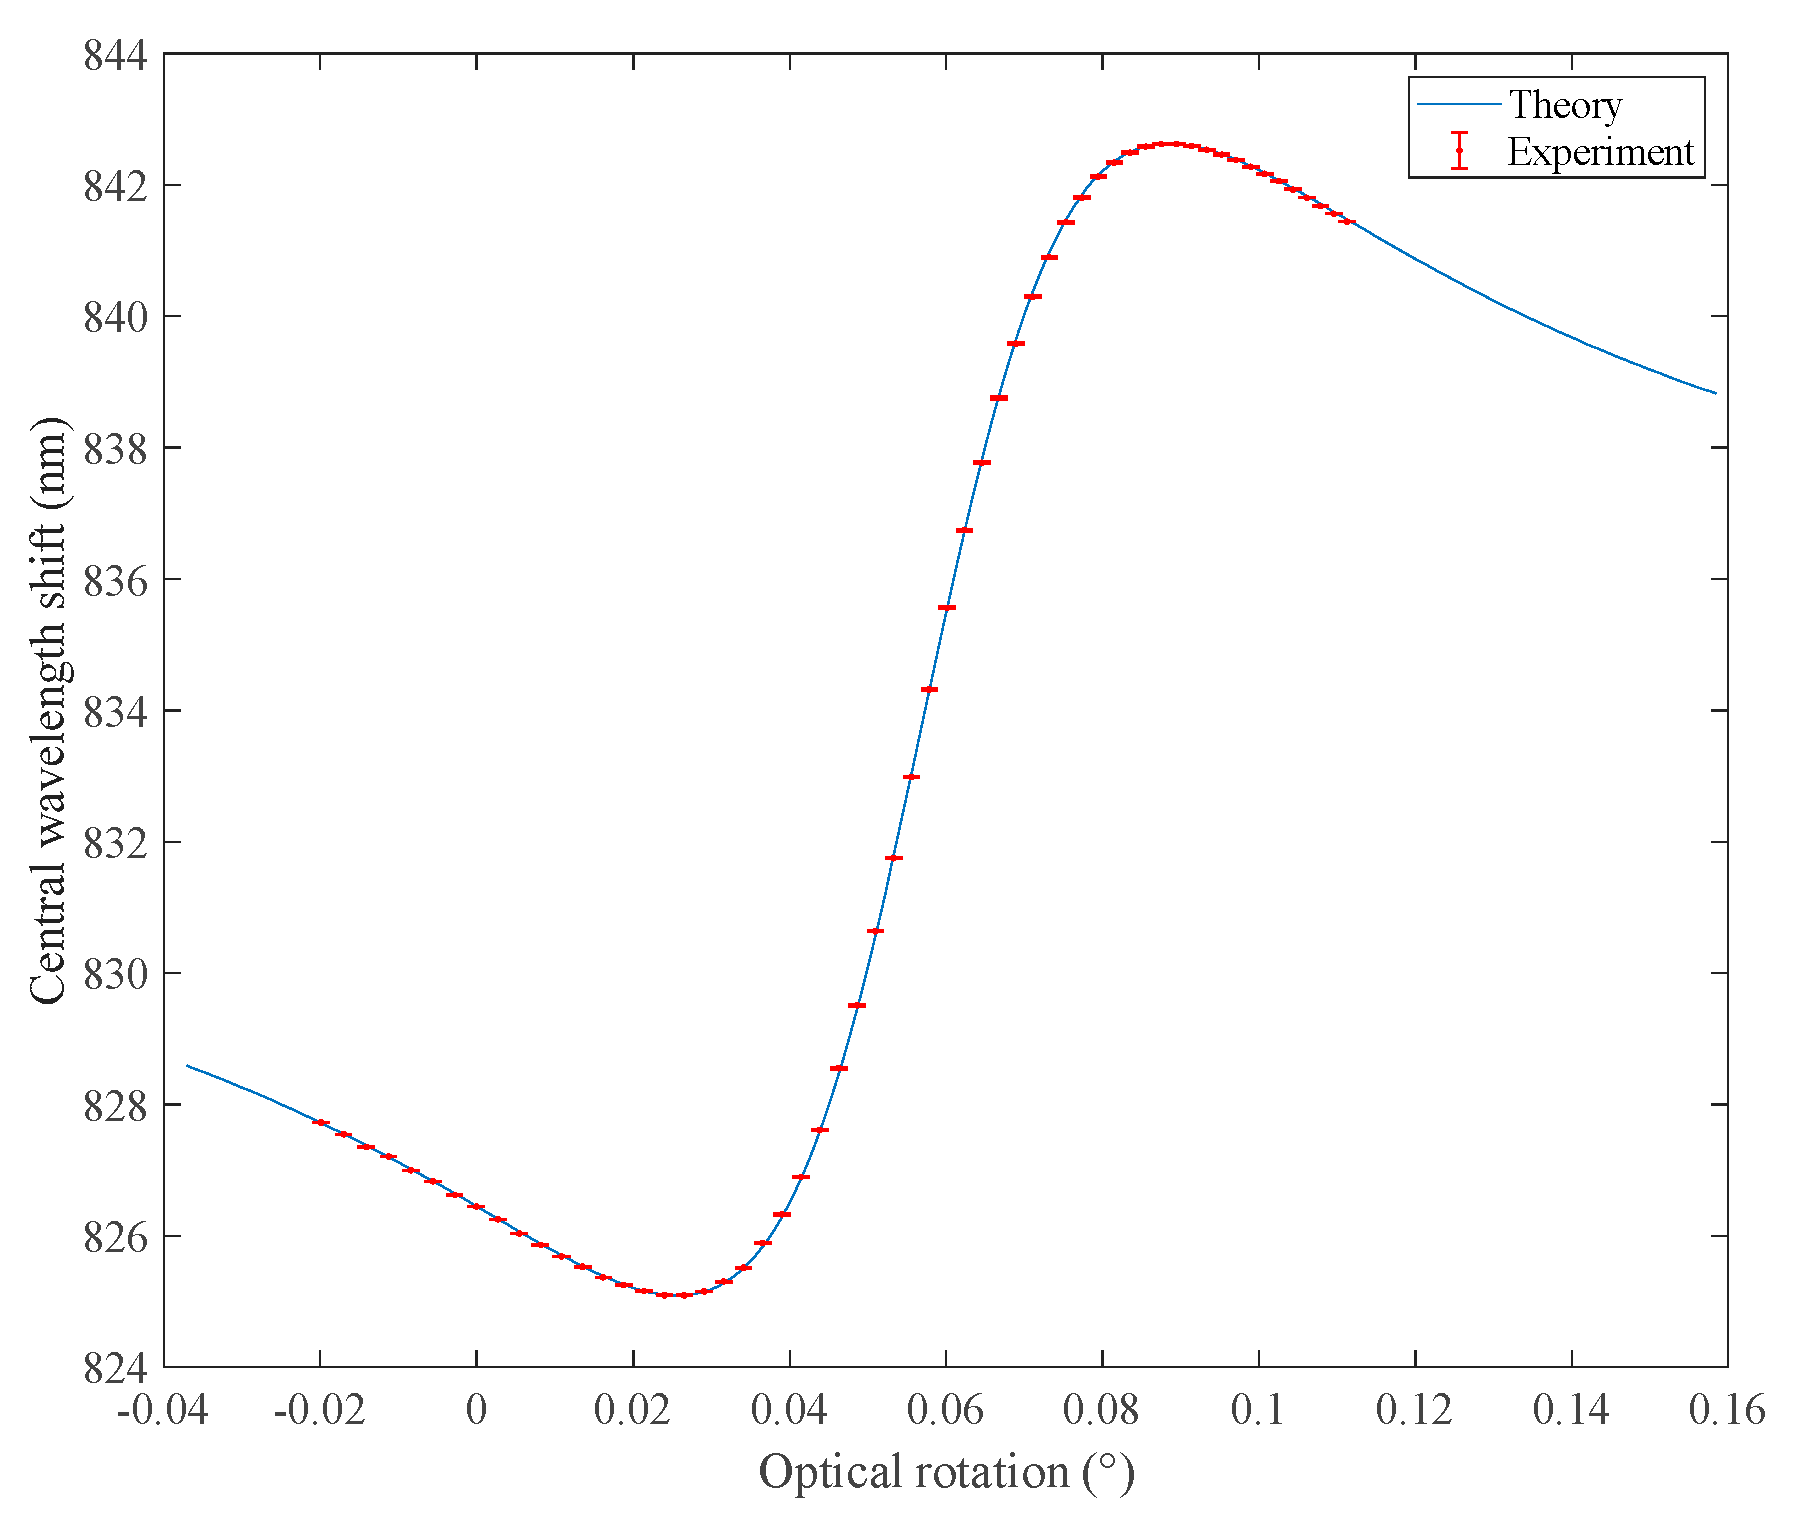
3.1. Determination of High Sensitivity Detection Area of OR in the System
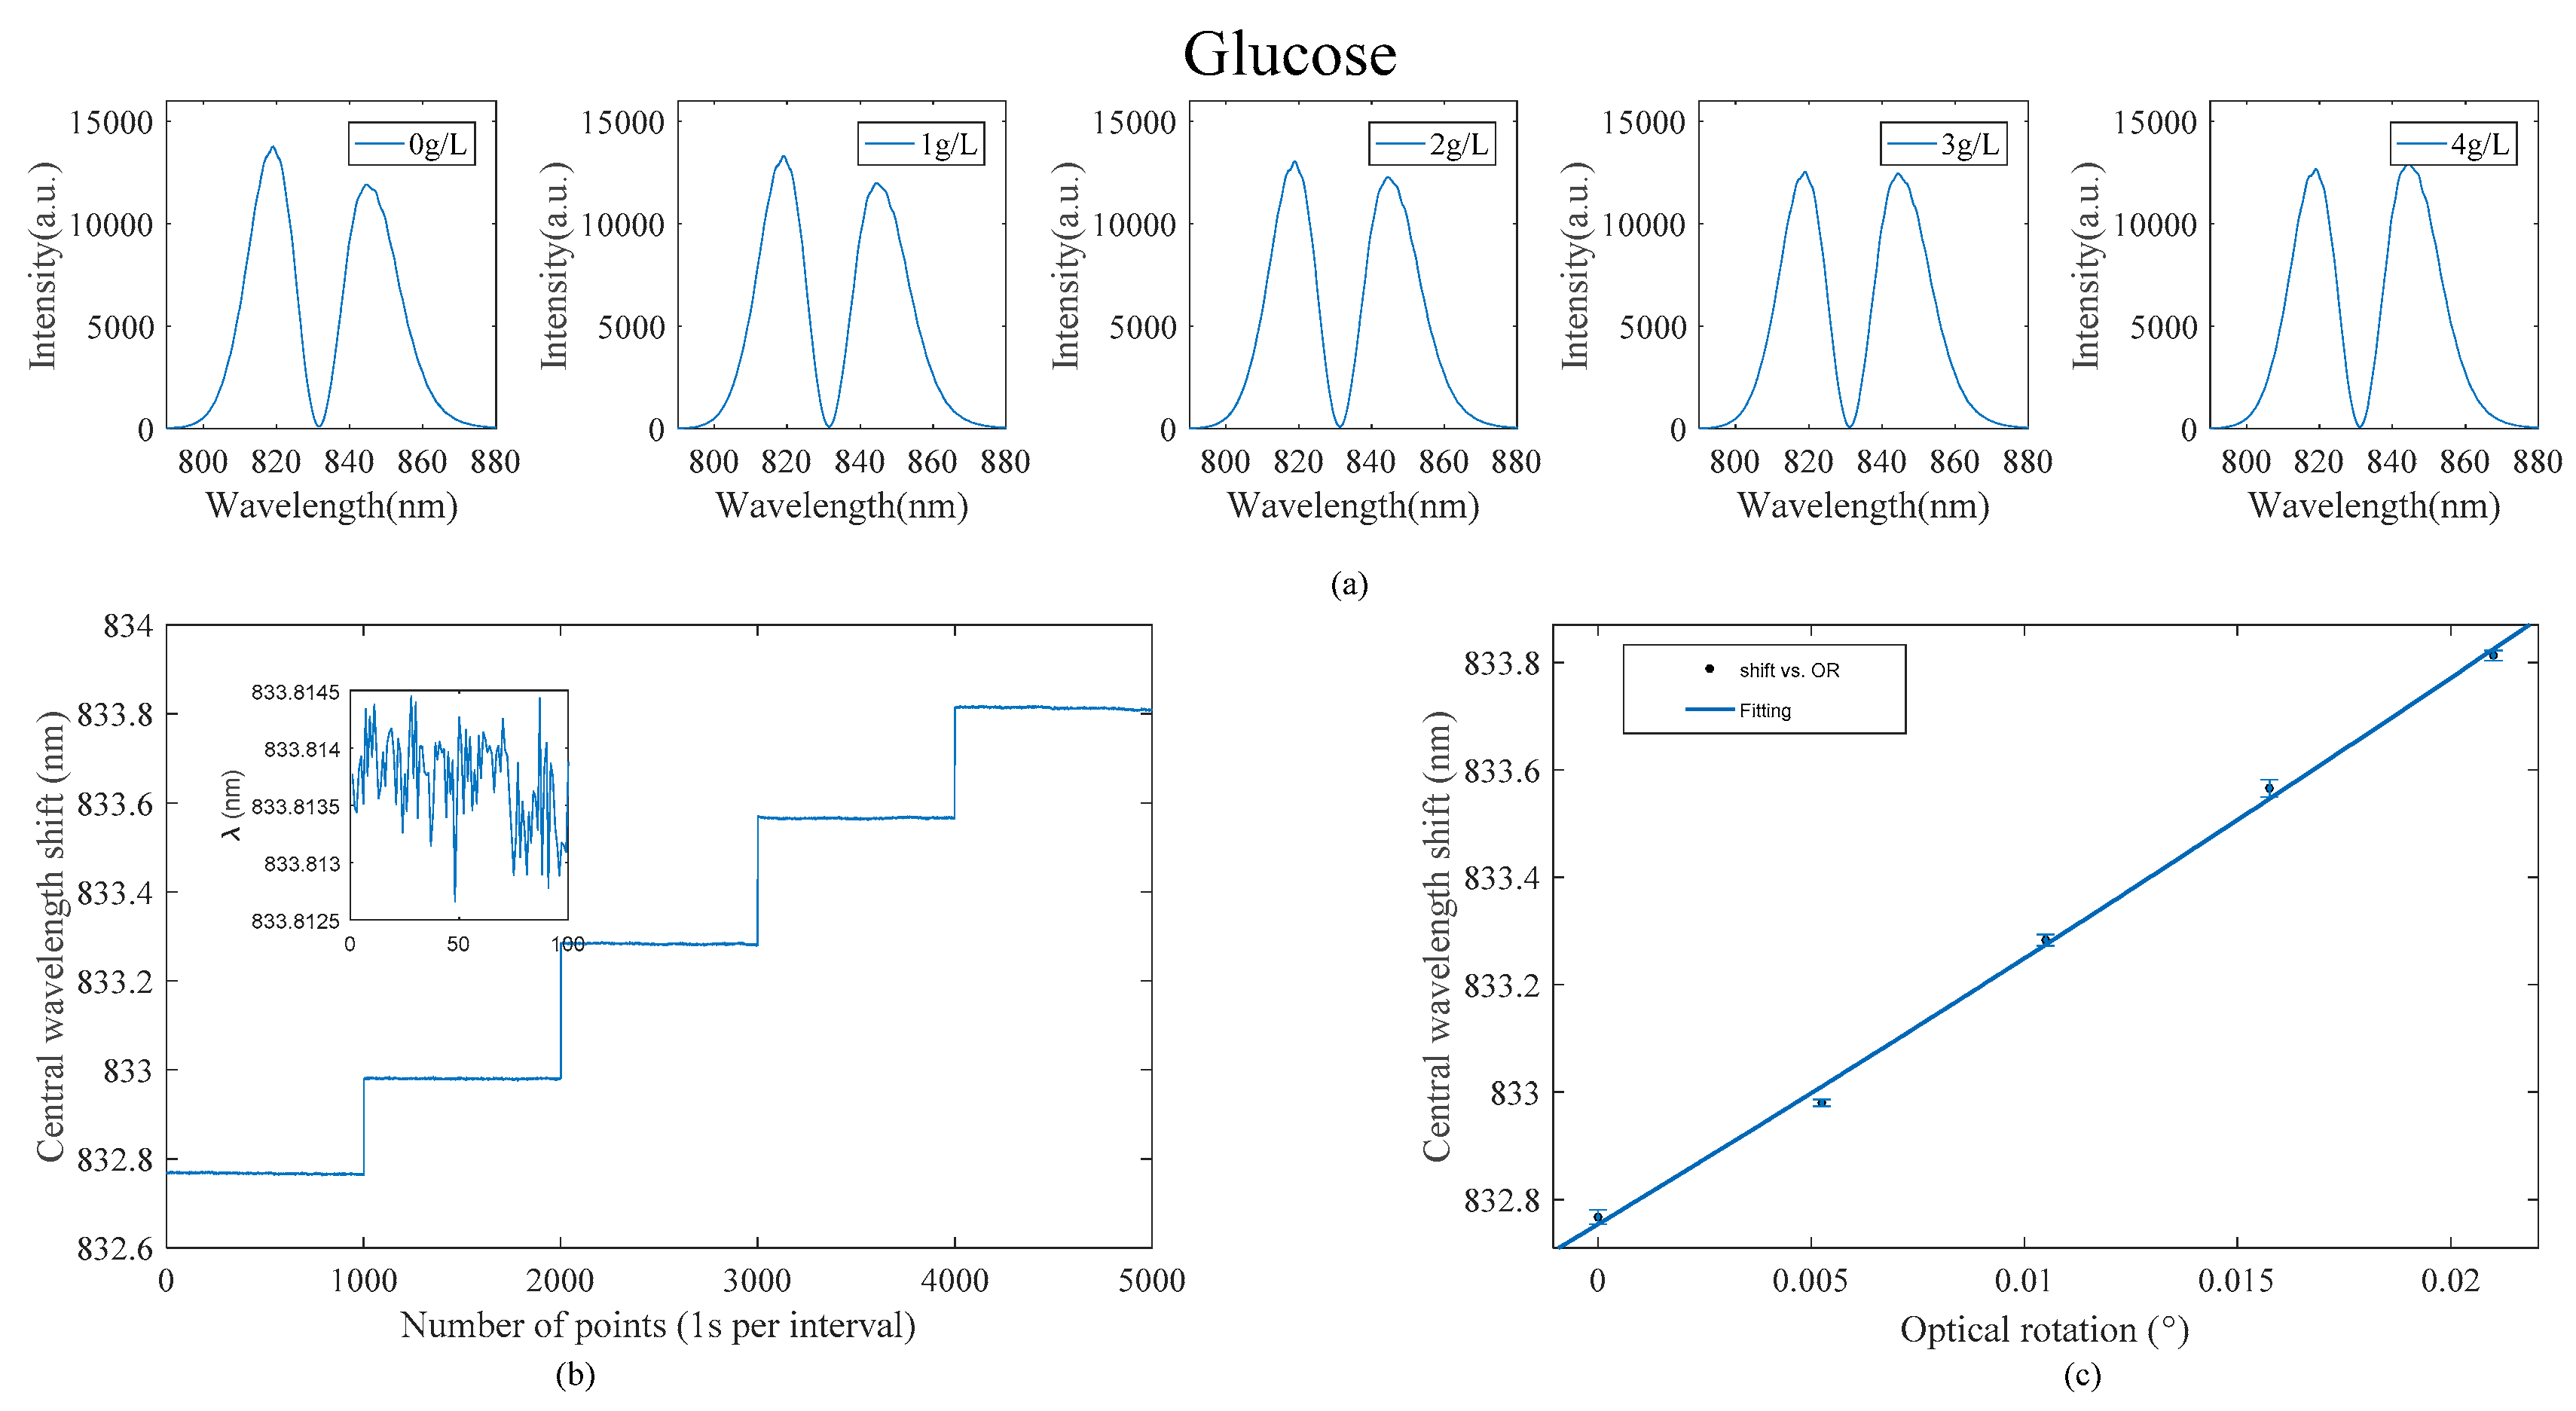
3.2. System OR Angle Detection Resolution
3.3. Feasibility Analysis of the Sum and Difference of the Optical Rotation between the Sample and the Standard Product
3.3.1. Response of the System to the Optical Activity of the Back Sample Cell at Different QWP Angles
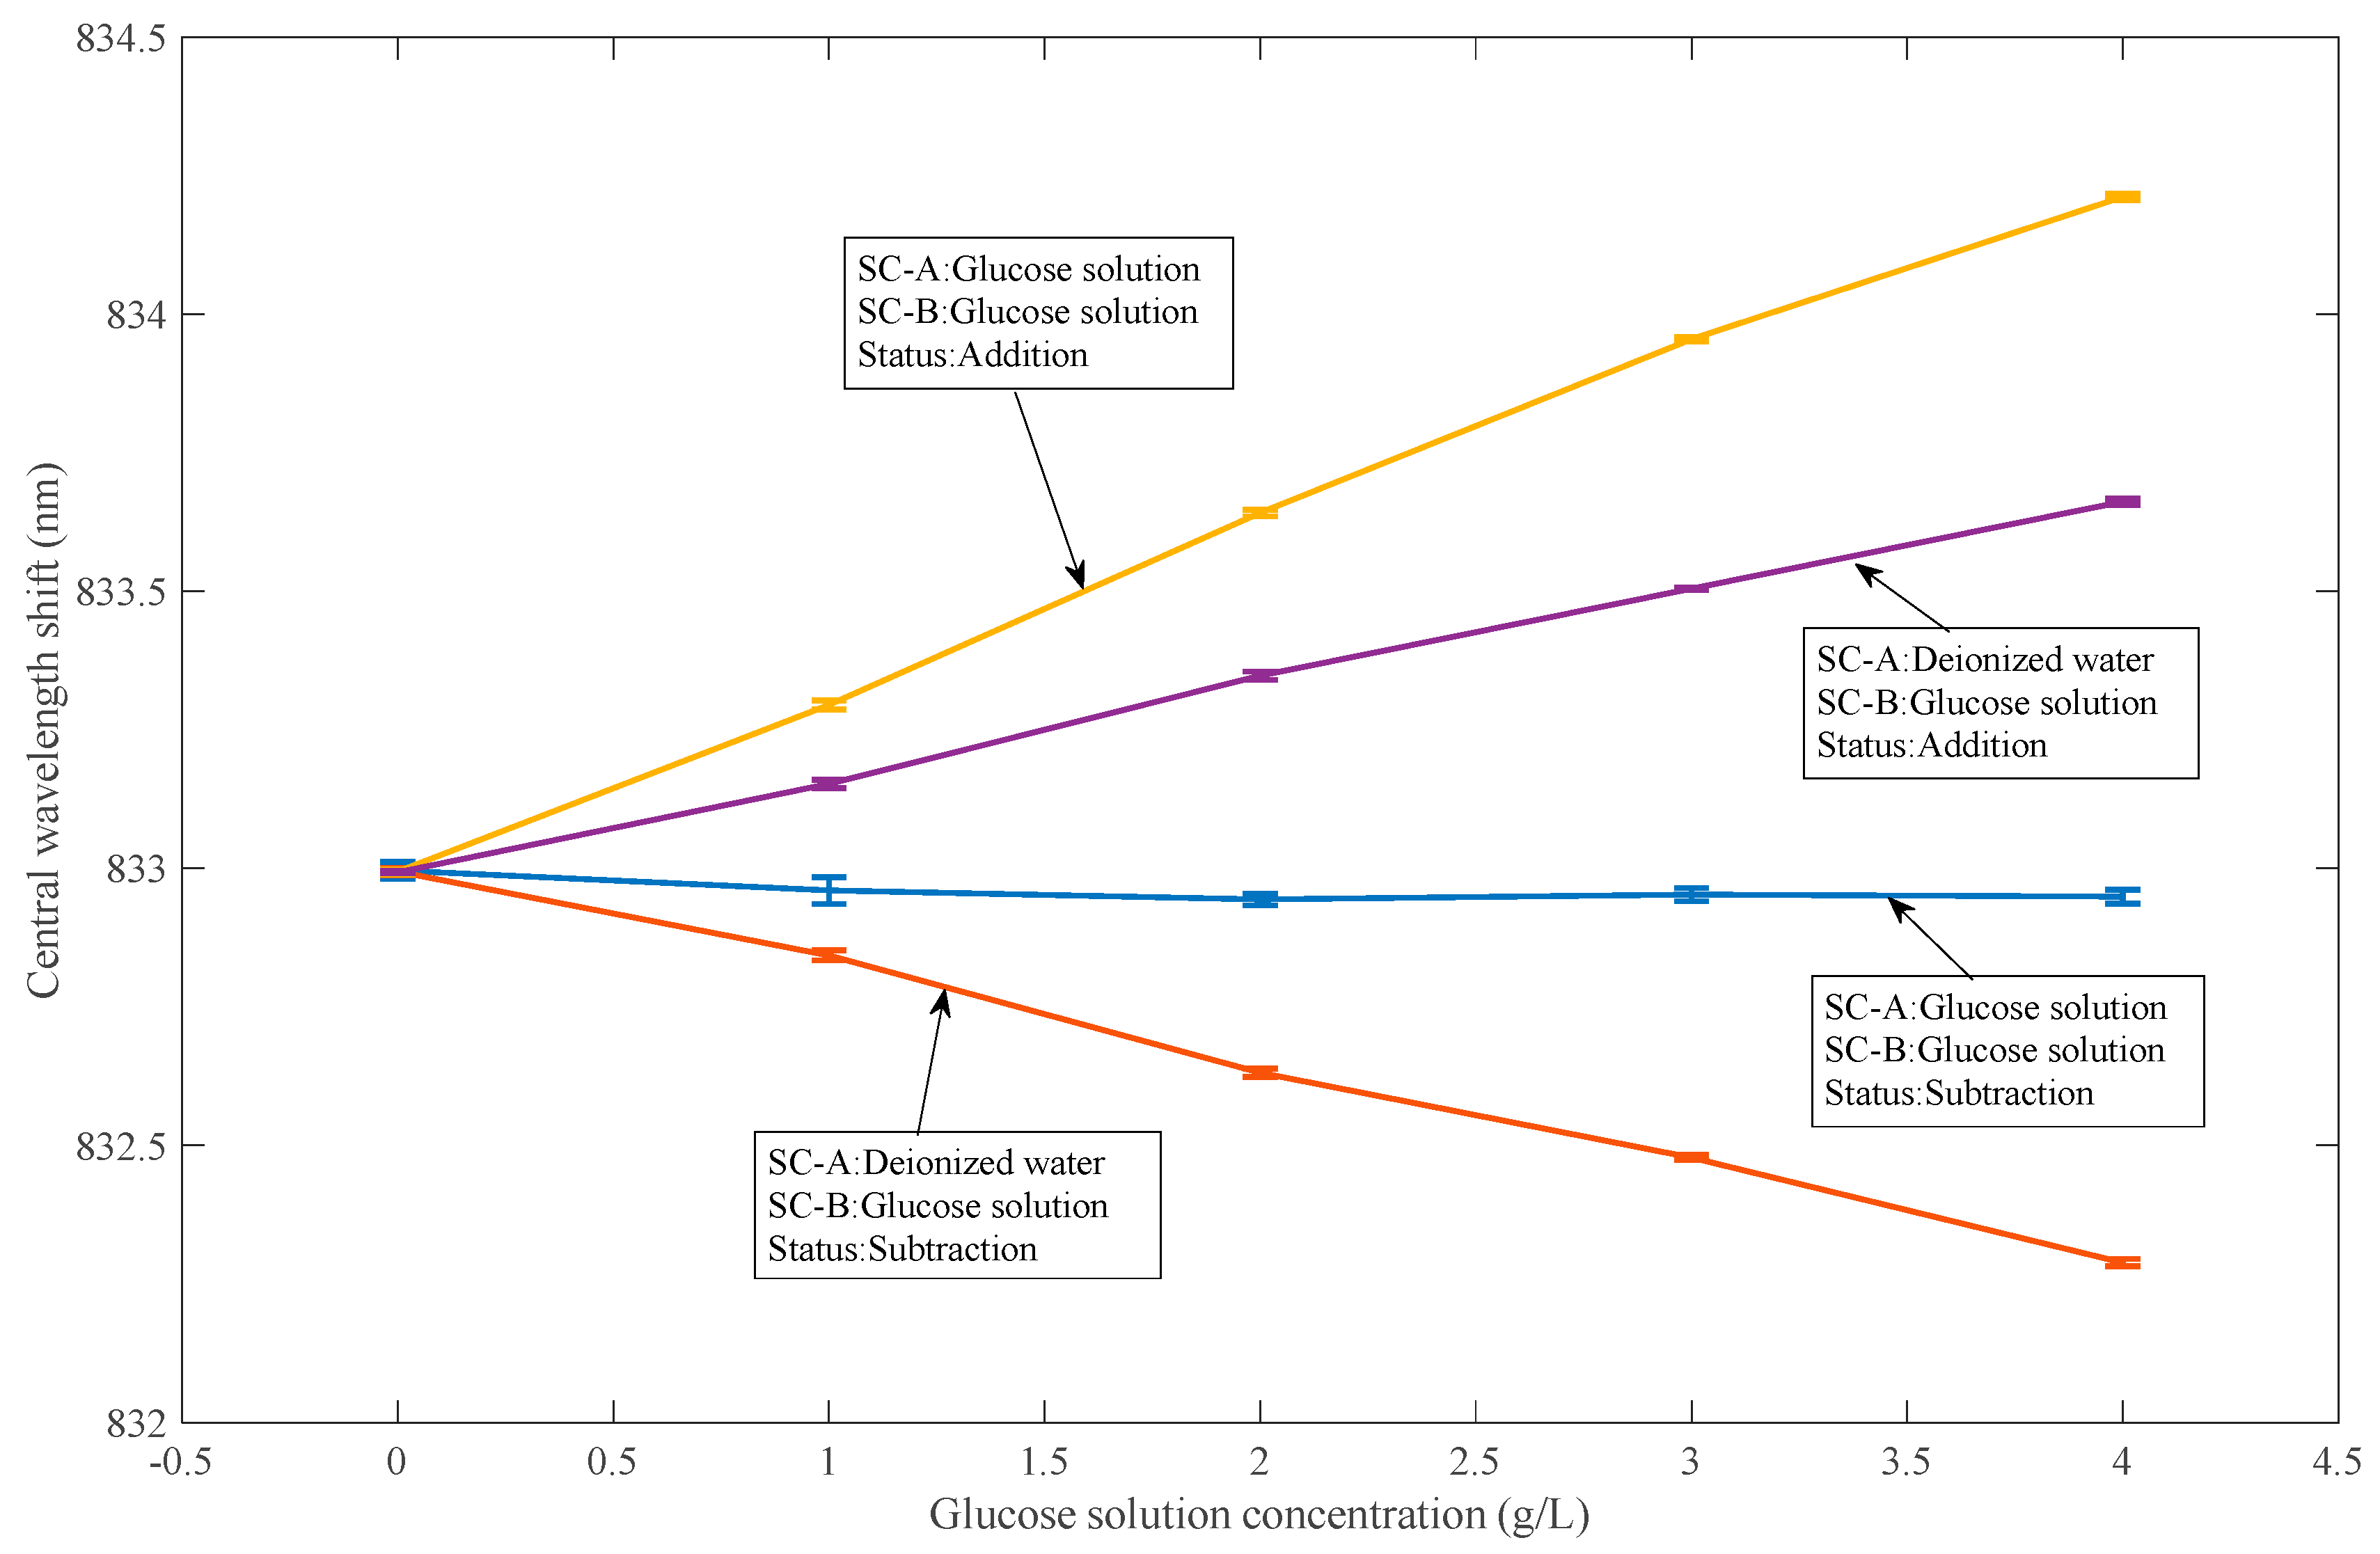
3.3.2. The Optical Rotation and Difference of Samples in the Sample Cell before and after the System are Obtained by Adjusting QWP
4. Determination of Enantiomer Content in Chiral Molecules
4.1. Ways to Detect the Ratio of Chiral Molecules to Enantiomeric Impurities
4.2. Detecting the Ratio of Enantiomer Impurity of L-Proline in Chiral Molecule D-Valine
4.3. System Detection Limit
5. Discussion
6. Conclusions
Author Contributions
Funding
Conflicts of Interest
References
- Corradini, R.; Sforza, S.; Tedeschi, T.; Marchelli, R. Chirality as a tool in nucleic acid recognition: Principles and relevance in biotechnology and in medicinal chemistry. Chirality 2007, 19, 269–294. [Google Scholar] [CrossRef] [PubMed]
- Hutt, A.J.; Tan, S.C. Drug chirality and its clinical significance. Drugs 1996, 52, 1–12. [Google Scholar] [CrossRef] [PubMed]
- Stephens, P.J.; Devlin, F.J.; Cheeseman, J.R.; Frisch, M.J.; Bortolini, O.; Besse, P. Determination of absolute configuration using ab initio calculation of optical rotation. Chirality 2003, 15, S57–S64. [Google Scholar] [CrossRef] [PubMed]
- Stephens, P.J.; Mccann, D.M.; Cheeseman, J.R.; Frisch, M.J. Determination of absolute configurations of chiral molecules using ab initio time-dependent density functional theory calculations of optical rotation: How reliable are absolute configurations obtained for molecules with small rotations? Chirality 2005, 17, S52–S64. [Google Scholar] [CrossRef] [PubMed]
- Ghosh, A.; Fischer, P. Chiral molecules split light: Reflection and refraction in a chiral liquid. Phys. Rev. Lett. 2006, 97, 173002. [Google Scholar] [CrossRef] [PubMed]
- Aharonov, Y.; Albert, D.Z.; Vaidman, L. How the Result of a Measurement of a Component of the Spin of a Spin-1/2 Particle Can Turn out to Be 100. Phys. Rev. Lett. 1988, 60, 1351–1354. [Google Scholar] [CrossRef] [PubMed]
- Ritchie, N.W.M.; Story, J.G.; Hulet, R.G. Realization of a measurement of a weak value. Phys. Rev. Lett. 1991, 66, 1107–1110. [Google Scholar] [CrossRef] [PubMed]
- Zhou, X.X.; Ling, X.H.; Zhang, Z.Y.; Luo, H.L.; Wen, S.C. Observation of spin hall effect in photon tunneling via weak measurements. Sci. Rep. 2014, 4, 7388. [Google Scholar] [CrossRef] [PubMed]
- Dixon, P.B.; Starling, D.J.; Jordan, A.N.; Howell, J.C. Ultrasensitive beam deflection measurement via interferometric weak value amplification. Phys. Rev. Lett. 2009, 102, 173601. [Google Scholar] [CrossRef] [PubMed]
- Jordan, A.N.; Martinez-Rincon, J.; Howell, J.C. Technical advantages for weak-value amplification: When less is more. Phys. Rev. X 2014, 4, 011031. [Google Scholar] [CrossRef]
- Li, C.F.; Xu, X.Y.; Tang, J.S.; Xu, J.S.; Guo, G.C. Ultrasensitive phase estimation with white light. Phys. Rev. A 2011, 83, 044102. [Google Scholar] [CrossRef]
- Viza, G.I.; Martinez-Rincon, J.; Howland, G.A.; Frostig, H.; Shomroni, I.; Dayan, B.; Howell, J.C. Weak-values technique for velocity measurements. Opt. Lett. 2013, 38, 2949–2952. [Google Scholar] [CrossRef] [PubMed]
- Tamir, B.; Cohen, E.; Priel, A. On the power of weak measurements in separating quantum states. Quantum Stud. Math. Found. 2015, 2, 37–49. [Google Scholar] [CrossRef]
- Viza, G.I.; Martinez-Rincon, J.; Alves, G.B.; Jordan, A.N.; Howell, J.C. Experimentally quantifying the advantages of weak-value-based metrology. Phys. Rev. A 2015, 92, 032127. [Google Scholar] [CrossRef]
- Brunner, N.; Simon, C. Measuring small longitudinal phase shifts: Weak measurements or standard interferometry? Phys. Rev. Lett. 2010, 105, 010405. [Google Scholar] [CrossRef] [PubMed]
- Li, D.M.; Shen, Z.Y.; He, Y.H.; Zhang, Y.L.; Chen, Z.L.; Ma, H. Application of quantum weak measurement for glucose concentration detection. Appl. Opt. 2016, 55, 1697–1702. [Google Scholar] [CrossRef] [PubMed]
- Zhang, Y.L.; Li, D.M.; He, Y.H.; Shen, Z.Y.; He, Q.H. Optical weak measurement system with common path implementation for label-free biomolecule sensing. Opt. Lett. 2016, 41, 5409–5412. [Google Scholar] [CrossRef] [PubMed]
- Li, D.M.; He, Q.H.; He, Y.H.; Xin, M.G.; Zhang, Y.L.; Shen, Z.Y. Molecular imprinting sensor based on quantum weak measurement. Biosens. Bioelectron. 2017, 94, 328–334. [Google Scholar] [CrossRef] [PubMed]
- Xu, Y.; Shi, L.X.; Guan, T.; Guo, C.X.; Li, D.M.; Yang, Y.X.; Wang, X.N.; Xie, L.Y.; He, Y.H.; Xie, W.Y. Optimization of a quantum weak measurement system with its working areas. Opt. Express 2018, 26, 21119–21131. [Google Scholar] [CrossRef] [PubMed]
- Xie, L.G.; Qiu, X.D.; Luo, L.; Liu, X.; Li, Z.X.; Zhang, Z.Y.; Du, J.L.; Wang, D.Q. Quantitative detection of the respective concentrations of chiral compounds with weak measurements. Appl. Phys. Lett. 2017, 111, 191106. [Google Scholar] [CrossRef]
- Li, D.M.; Guan, T.; He, Y.H.; Liu, F.; Yang, A.P.; He, Q.H.; Shen, Z.Y.; Xin, M.G. A chiral sensor based on weak measurement for the determination of Proline enantiomers in diverse measuring circumstances. Biosens. Bioelectron. 2018, 110, 103–109. [Google Scholar] [CrossRef] [PubMed]
- Li, D.M.; Guan, T.; Liu, F.; Yang, A.P.; He, Y.H.; He, Q.H.; Shen, Z.Y.; Xin, M.G. Optical rotation based chirality detection of enantiomers via weak measurement in frequency domain. Appl. Phys. Lett. 2018, 112, 213701. [Google Scholar] [CrossRef]
- Mi, C.Q.; Chen, S.Z.; Zhou, X.X.; Tian, K.; Luo, H.L.; Wen, S.C. Observation of tiny polarization rotation rate in total internal reflection via weak measurements. Photonics Res. 2017, 5, 92–96. [Google Scholar] [CrossRef]
- Chen, S.Z.; Zhou, X.X.; Mi, C.Q.; Luo, H.L.; Wen, S.C. Modified weak measurements for the detection of the photonic spin Hall effect. Phys. Rev. A 2015, 91, 062105. [Google Scholar] [CrossRef]
- Ferrie, C.; Combes, J. Weak Value Amplification is Suboptimal for Estimation and Detection. Phys. Rev. Lett. 2014, 112, 040406. [Google Scholar] [CrossRef] [PubMed]
- Knee, G.C.; Gauger, E.M. When Amplification with Weak Values Fails to Suppress Technical Noise. Phys. Rev. X 2014, 4, 011032. [Google Scholar] [CrossRef]
- Vaidman, L. Weak value controversy. Philos. Trans. R. Soc. A 2017, 375, 20160395. [Google Scholar] [CrossRef] [PubMed]


| Setting Ratio (D-Proline:L-Proline) | Initial State (nm) (SC-A:Water SC-B:Water) | Difference State M (nm) | Summation State N (nm) | Test Results |M/N| |
|---|---|---|---|---|
| Pure D-proline | 0 | −1.0095 | 0.01 | ≈Pure D-proline |
| 3:1 | 0 | −0.7515 | 0.2468 | ≈3:1 |
| 2:2 | 0 | −0.4919 | 0.5052 | ≈1:1 |
| 1:3 | 0 | −0.255 | 0.7529 | ≈1:3 |
| Pure L-proline | 0 | −0.0105 | 1.0242 | ≈Pure L-proline |
© 2018 by the authors. Licensee MDPI, Basel, Switzerland. This article is an open access article distributed under the terms and conditions of the Creative Commons Attribution (CC BY) license (http://creativecommons.org/licenses/by/4.0/).
Share and Cite
Xu, Y.; Shi, L.; Guan, T.; Zhong, S.; Zhou, X.; Li, D.; Guo, C.; Yang, Y.; Wang, X.; Li, Z.; et al. Rapid Separation of Enantiomeric Impurities in Chiral Molecules by a Self-Referential Weak Measurement System. Sensors 2018, 18, 3788. https://doi.org/10.3390/s18113788
Xu Y, Shi L, Guan T, Zhong S, Zhou X, Li D, Guo C, Yang Y, Wang X, Li Z, et al. Rapid Separation of Enantiomeric Impurities in Chiral Molecules by a Self-Referential Weak Measurement System. Sensors. 2018; 18(11):3788. https://doi.org/10.3390/s18113788
Chicago/Turabian StyleXu, Yang, Lixuan Shi, Tian Guan, Suyi Zhong, Xuesi Zhou, Dongmei Li, Cuixia Guo, Yuxuan Yang, Xiangnan Wang, Zhangyan Li, and et al. 2018. "Rapid Separation of Enantiomeric Impurities in Chiral Molecules by a Self-Referential Weak Measurement System" Sensors 18, no. 11: 3788. https://doi.org/10.3390/s18113788
APA StyleXu, Y., Shi, L., Guan, T., Zhong, S., Zhou, X., Li, D., Guo, C., Yang, Y., Wang, X., Li, Z., He, Y., Xie, L., & Gan, Z. (2018). Rapid Separation of Enantiomeric Impurities in Chiral Molecules by a Self-Referential Weak Measurement System. Sensors, 18(11), 3788. https://doi.org/10.3390/s18113788