1. Introduction
Walking is the basic capability of human being to move from one gait cycle to another which allows people to carry out their daily lives [
1]. One complete gait cycle in human walking consists of two main gait patterns, such as stance phase and swing phase. Specifically, stance phase is defined when the foot is in contact with the ground, while swing phase is defined when the foot totally leaves the ground [
2]. Gait analysis is a useful means to quantify the state of the gait patterns, which can be accomplished by a great number of sensor platforms, including force sensors [
3,
4], inertial sensors [
5,
6,
7,
8], air pressure sensors [
1], inclinometer sensors [
9], foot switches [
10] and electromyography (EMG) sensors [
11,
12].
Among all the sensor platforms, force sensor platforms, such as force sensitive resistors (FSRs), can represent the gold standard method for gait analysis [
13]. FSRs can be mounted in shoe soles to measure the ground contact forces (GCFs). The electrical resistance change of an FSR is proportional to the GCF induced by human foot. As reported in Reference [
1], each gait pattern has a unique GCF pattern such that the measuring value changes of FSRs can be directly correlated to the gait patterns.
Generally, the division of gait patterns in force sensor platform is based on the threshold method which sets a threshold to divide the GCF into on-ground and off-ground statuses. As described by Smith et al. [
14], 80% of the detection errors using FSRs was due to the setting of threshold value such that many researchers presented their approaches to compute an appropriate threshold. Mariani et al. [
4] defined the threshold as 5% body weight with the result that the weight of each subject should be measured before the experiments. Lopez-Meyer et al. [
15] and Catalfamo et al. [
16] took use of the maximum and minimum GCFs of gait cycles to calculate the threshold, which meant that the GCF should be post-processed after data acquisition. However, Lie Yu et al. [
17] and Jing Tang et al. [
18] declared that the methods in Reference [
4,
15,
16] were not adaptable to different people and different walking speeds. On one hand, for Mariani method [
4], different subjects were usually with different body weights such that different thresholds should be computed for different subjects. Meanwhile, no matter at what speed the subject walked, one constant threshold was set for the same subject in all experiments. On the other hand, the Lopez-Meyer method [
15] and Catalfamo method [
16] could not be used for real-time gait pattern detection because the maximum and minimum GCFs were obtained in data post-processing. Therefore, Lie Yu et al. proposed the proportional method (PM) which calculated the sums and proportions of GCFs for gait pattern detection. Two proportional factors were used for all subjects in all experiments and this PM achieved high average reliability. Jing Tang et al. [
18] presented the self-tuning triple-threshold algorithm (STTTA) which could search out the maximum and minimum GCFs in real time. Three initial threshold values were set for all subjects in all experiments and the three thresholds would be adjusted to adapt the human walking. However, there existed an obvious drawback for PM that one parameter in Reference [
17] was determined by the attachment between the shoe and the foot, which would cut down the detection accuracy of the whole system. Additionally, the proposed STTTA in Reference [
18] used three thresholds to calculate a new threshold for the future walking gait cycle. Nevertheless, the calculation formulas were extremely simple which only relied on the maximum and minimum GCFs in the current walking gait cycle.
In this paper, the constant false alarm rate (CFAR) is utilized to analyze the characteristic of the GCF signals. Specifically, a sliding window detector is built to record the lasting time of the curvature of the GCF signals and one complete gait cycle could be divided into three areas, such as continuous ascending area, continuous descending area and unstable area. Then, the GCF values in the unstable area are used to compute a threshold through the CFAR. Finally, the new gait pattern detection rules are proposed which include the results of the sliding window detector and the division results through the computed threshold. In order to test the detection reliability of the proposed method, five previous approaches [
4,
15,
16,
17,
18] in the literature were chosen as reference methods to obtain comparative results.
The aim of this study is to develop a real-time method to detect the gait patterns adaptively. Specifically, this proposed method is irrelevant to subjects’ body weights and walking speeds. To evaluate the availability and reliability of the proposed method, five published method are introduced as references. The detection results of the proposed method are compared with the reference methods.
2. Method
2.1. Subjects
This study included twelve males and ten females of average age 23.1 ± 3.2 years and average mass 68.2 ± 7.6 kg with no history of foot diseases or limitations. Before the experiment, the subjects gave their written informed consent for participation in this study as the purpose was explained in detail to each of them and their safeties could be ensured. These subjects were selected from the postgraduate students of Wuhan University of Technology, which approved our research.
2.2. Measurement Principle of FSR Sensors
To validate our research, we designed a gait phase detection system as shown in
Figure 1. Two sets of FSRs (LOSON LSH-10, LOSON Instrumentation, Nankin, China) were severally embedded into the insole of the ball and heel of each shoe. The FSRs signal were digitalized by a high resolution of 16 bits AD converters at a sample frequency of 1000 Hz. Each FSR possesses a wide measuring range of 0–200 kg with a high accuracy (including linearity and repeatability) of ± 0.5% full scale (FS). As the FSR sensor outputs a weak micro-voltage-level signal, the output signal should be amplified to a voltage-level signal. Meanwhile, a pressure tester (TLS-S1000W, Jinan Zhongchuang Industry Test System Co., Ltd., Jinan, China) is used to calibrate the FSRs such that the amplified output signal within a range of 0–5 V correlates with the measured mass of 0–200 kg.
After data collection, the acquired FSR signals were filtered by Butterworth low pass filter with a cut-off frequency of 200 Hz to eliminate the unnecessary high frequency noise.
2.3. Description of Walking Experiments
After sensor calibrations, the experiments were implemented to test the reliability of CFAR for gait pattern detection. Then, each subject was asked to perform 5 trials to wear the designed shoes to walk. The five trials were performed on treadmill for 30 s per trial at a designated constant speed of 2 km/h, 3 km/h, 4 km/h, 5 km/h and 6 km/h in turn.
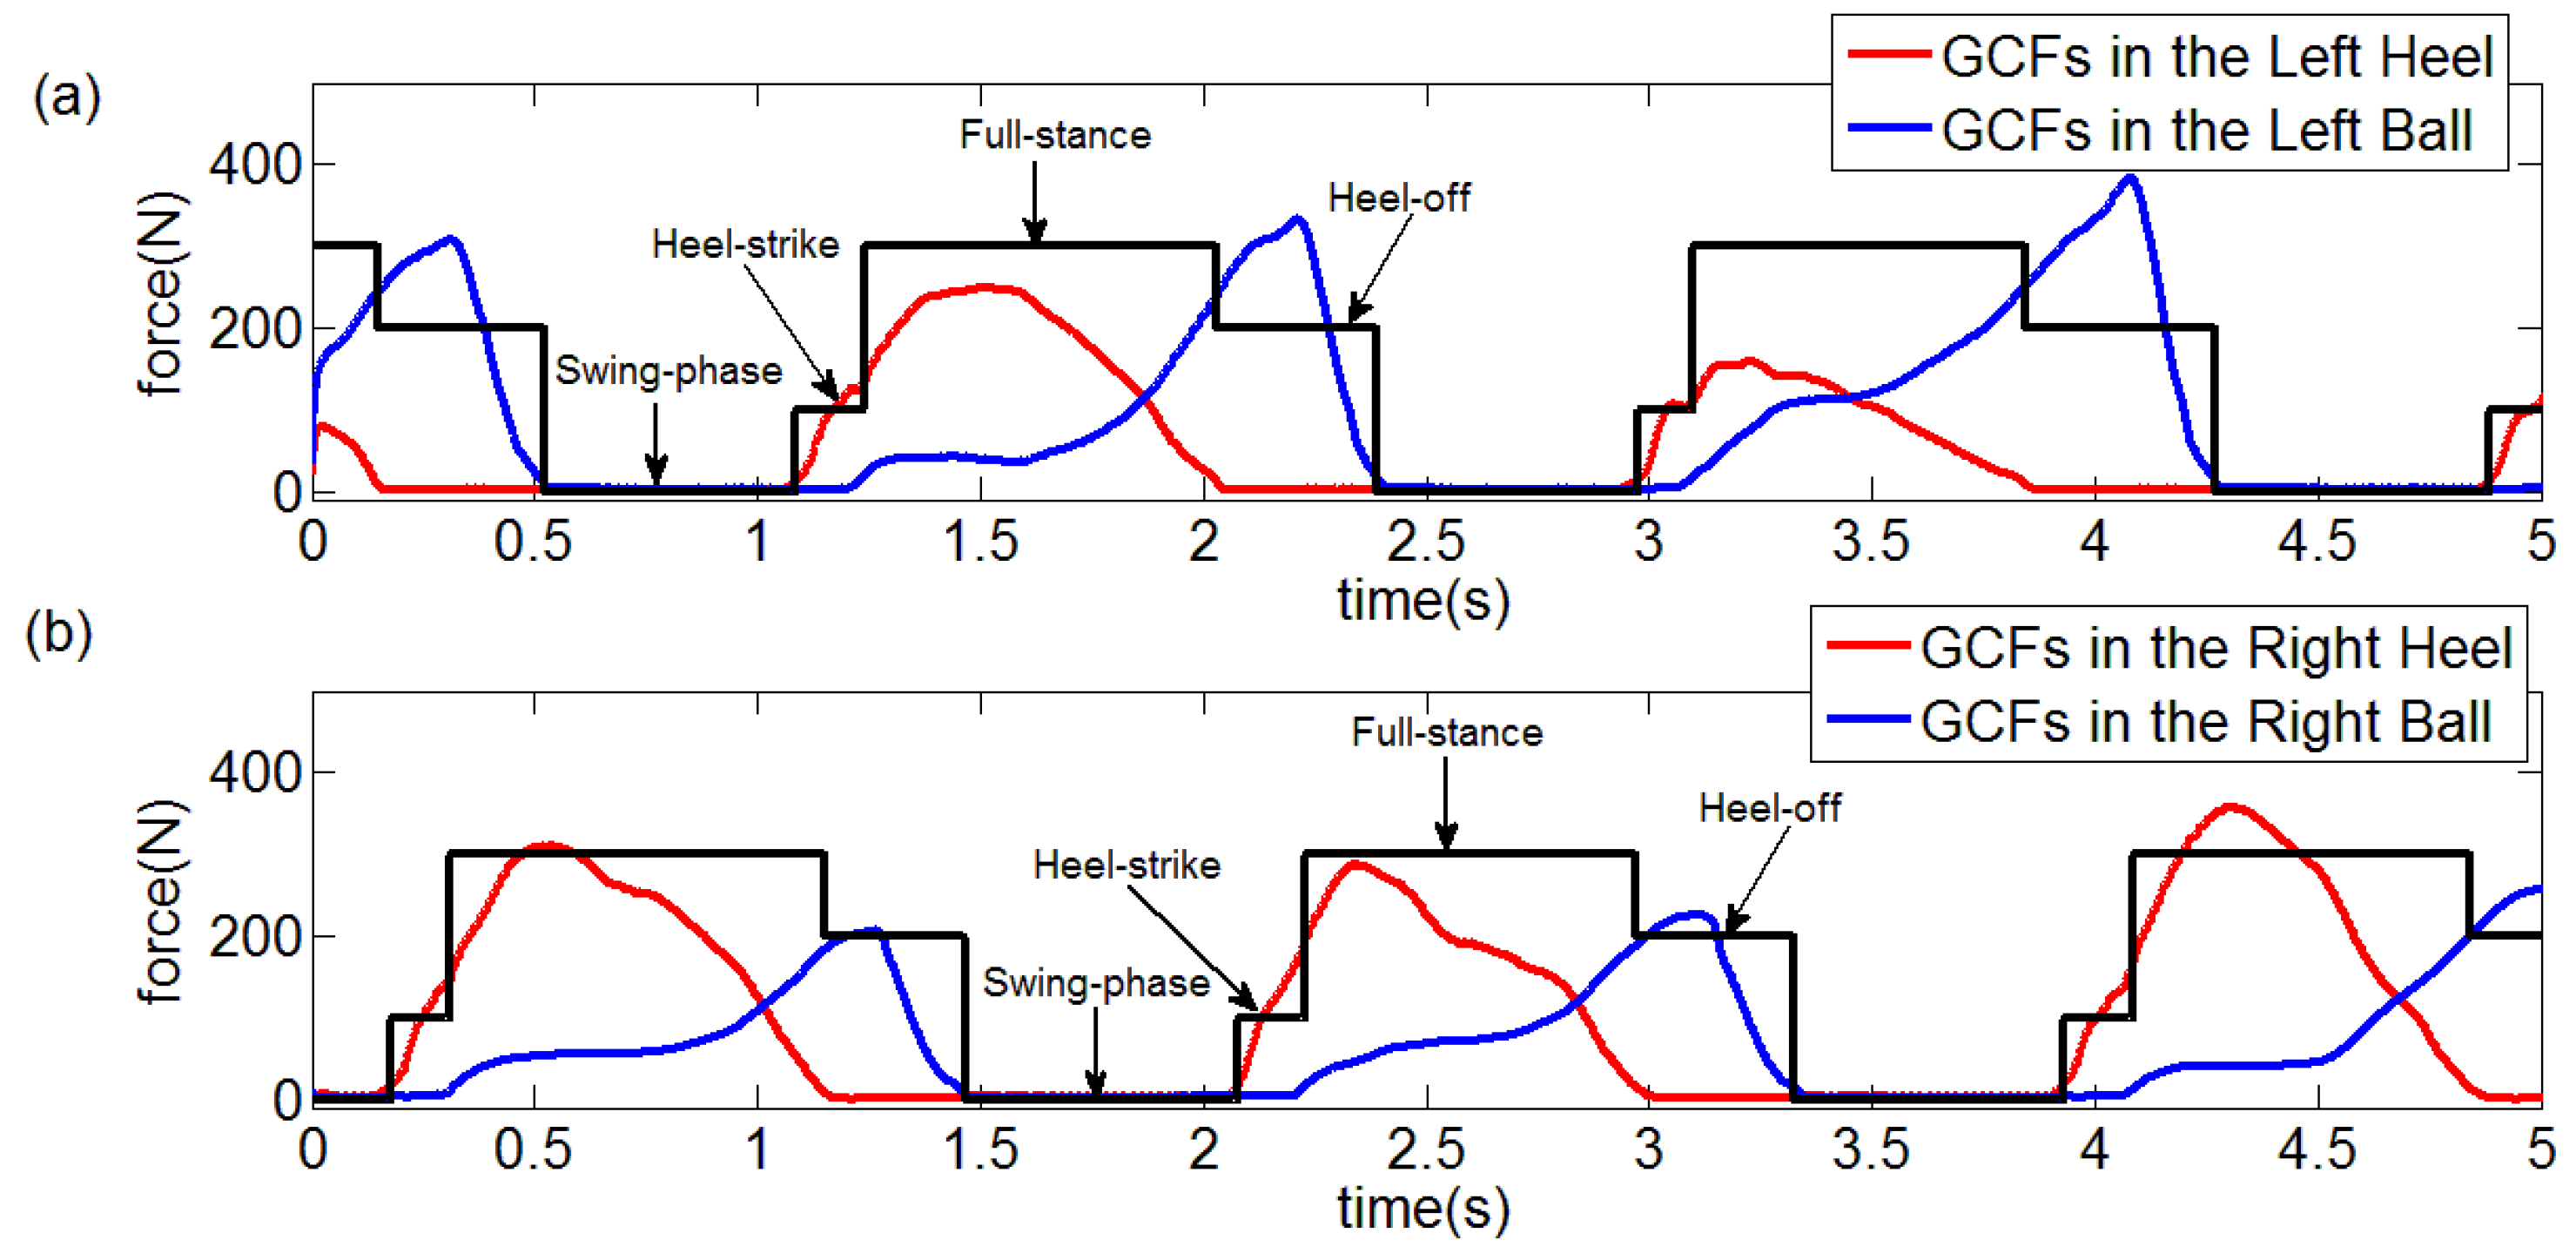
2.4. Gait Pattern Detection Algorithm
For human walking, a complete gait cycle could be divided into two main phases such as stance-phase and swing-phase. Stance-phase means that the foot is in contact with the ground, while swing-phase means that the foot is off the ground. As two FSR sensors are mounted severally inside the heel and ball of shoe, it would result in that only one point (i.e., the ball or the heel) is contacting the ground and the other point is off the ground. As a result, single point contact could lead to the transition detection between the two phases. To be specific, the transition from swing-phase to stance-phase is Heel-Strike, while the transition from stance-phase to swing-phase is Heel-Off. To differ from the two transitions, stance-phase is renamed as Full-Stance (i.e., two points are in contact). To distinguish these gait patterns, the proposed algorithm is presented in the following.
2.4.1. Statistical Characteristic Analysis
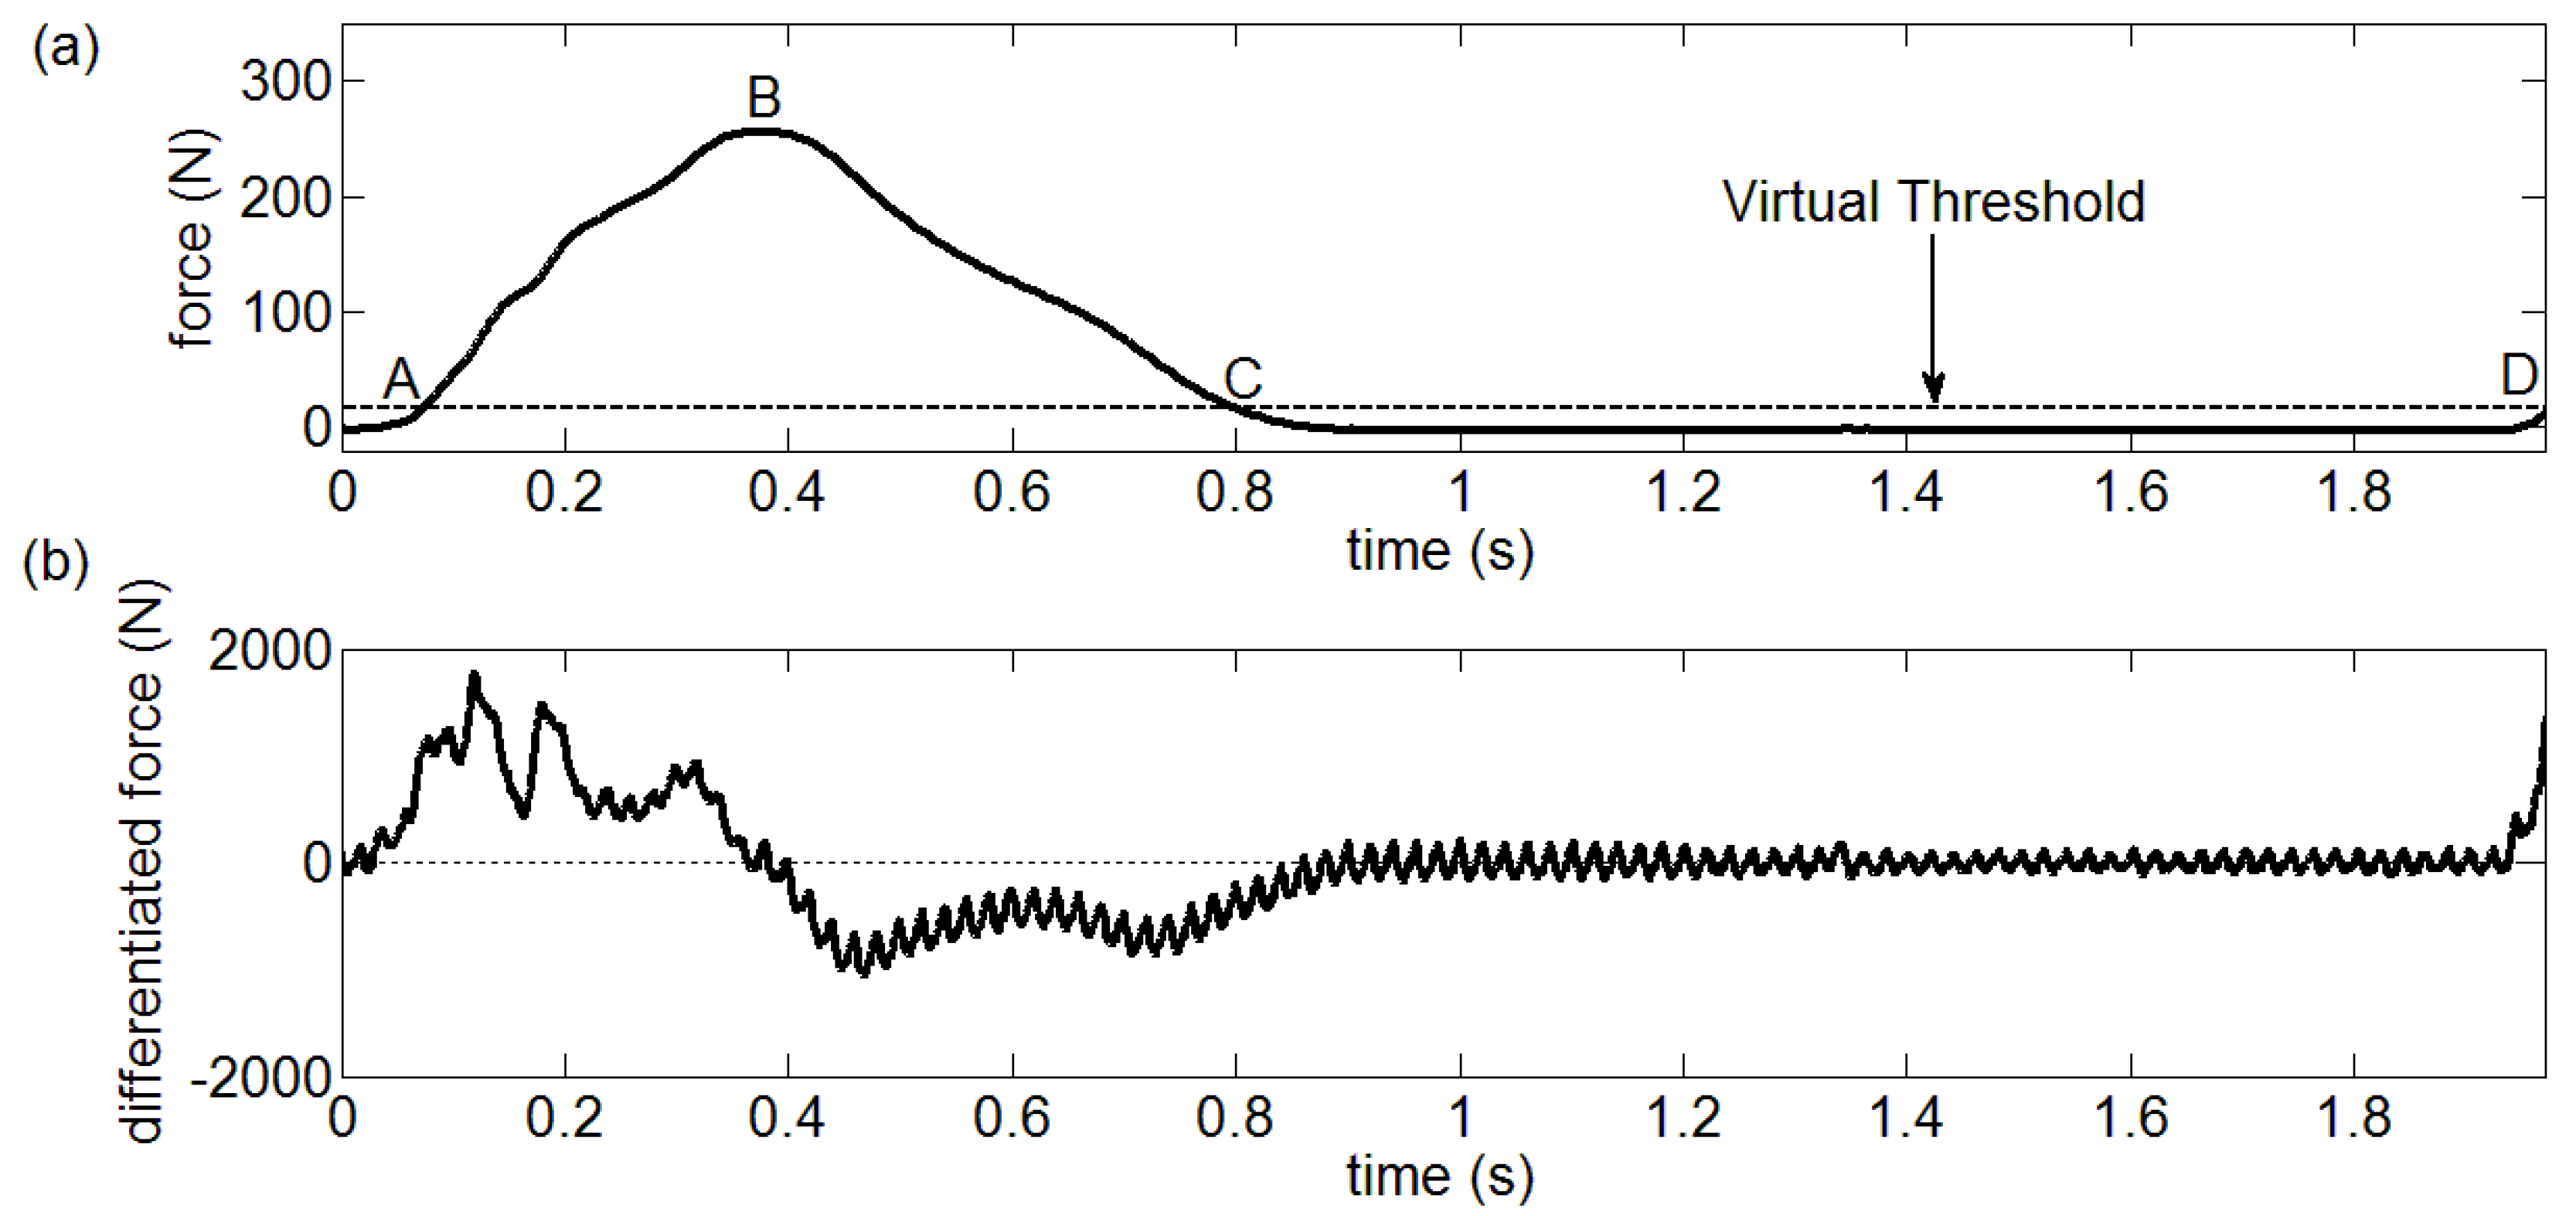
The gait pattern detection mainly focuses on the division of on-ground and off-ground statuses through setting a threshold. As a result, this paper carries out the characteristic analysis of the two statuses. Firstly, a virtual threshold is set to divide the GCFs into on-ground and off-ground statuses.
Figure 2a demonstrates the division made by the virtual threshold in a complete gait cycle. The maximum value in this complete cycle divides the GCFs distinguished as on-ground status into two intervals, including [A B] and [B C] as shown in
Figure 2a.
Figure 2b depicts the difference of GCFs. The curvature in Reference [A B] interval is basically positive, which lasts a long time. Meanwhile, the curvature in Reference [B C] interval is mainly negative, which also lasts a long time. However, the curvature polarity (i.e., positive or negative) in Reference [C D] interval is unstable and the determined curvature polarity would change when lasting a short time.
Based on these reasons, a sliding window detector could be built to record the lasting time of the curvature of the GCF signals. Given two types of sliding windows, such as ascending window and descending window, which can be described as
where
Aw is the ascending window function and
NA is the size of
AW. Meanwhile,
DW is the descending window function and
ND is the size of
DW.
When the present point (i.e., noted as
F) of GCF signals comes, its derivative is computed and noted as
dF. When the
dF value is positive, the ascending window would be sliding but the descending window remains unchanged, which could be written as
On the other hand, when the dF value is negative, the descending window would be sliding but the ascending window remains unchanged.
Then, the numbers of “1” in the two window are counted, which are separately noted as CA and CD. CA is the number of “1” in the ascending window, while CD is for descending window.
Finally, count limits
LA and
LD are set for
CA and
CD, respectively. When
CA (or
CD) is larger than
LA (or
LD), it can be considered that the curvature lasts a long time. Additionally, when the
CA is smaller than
LA and the
CD is smaller than
LD, it can be considered that the curvature lasts a short time. When proper values are chosen for these parameters, the GCFs signals can be processed in the
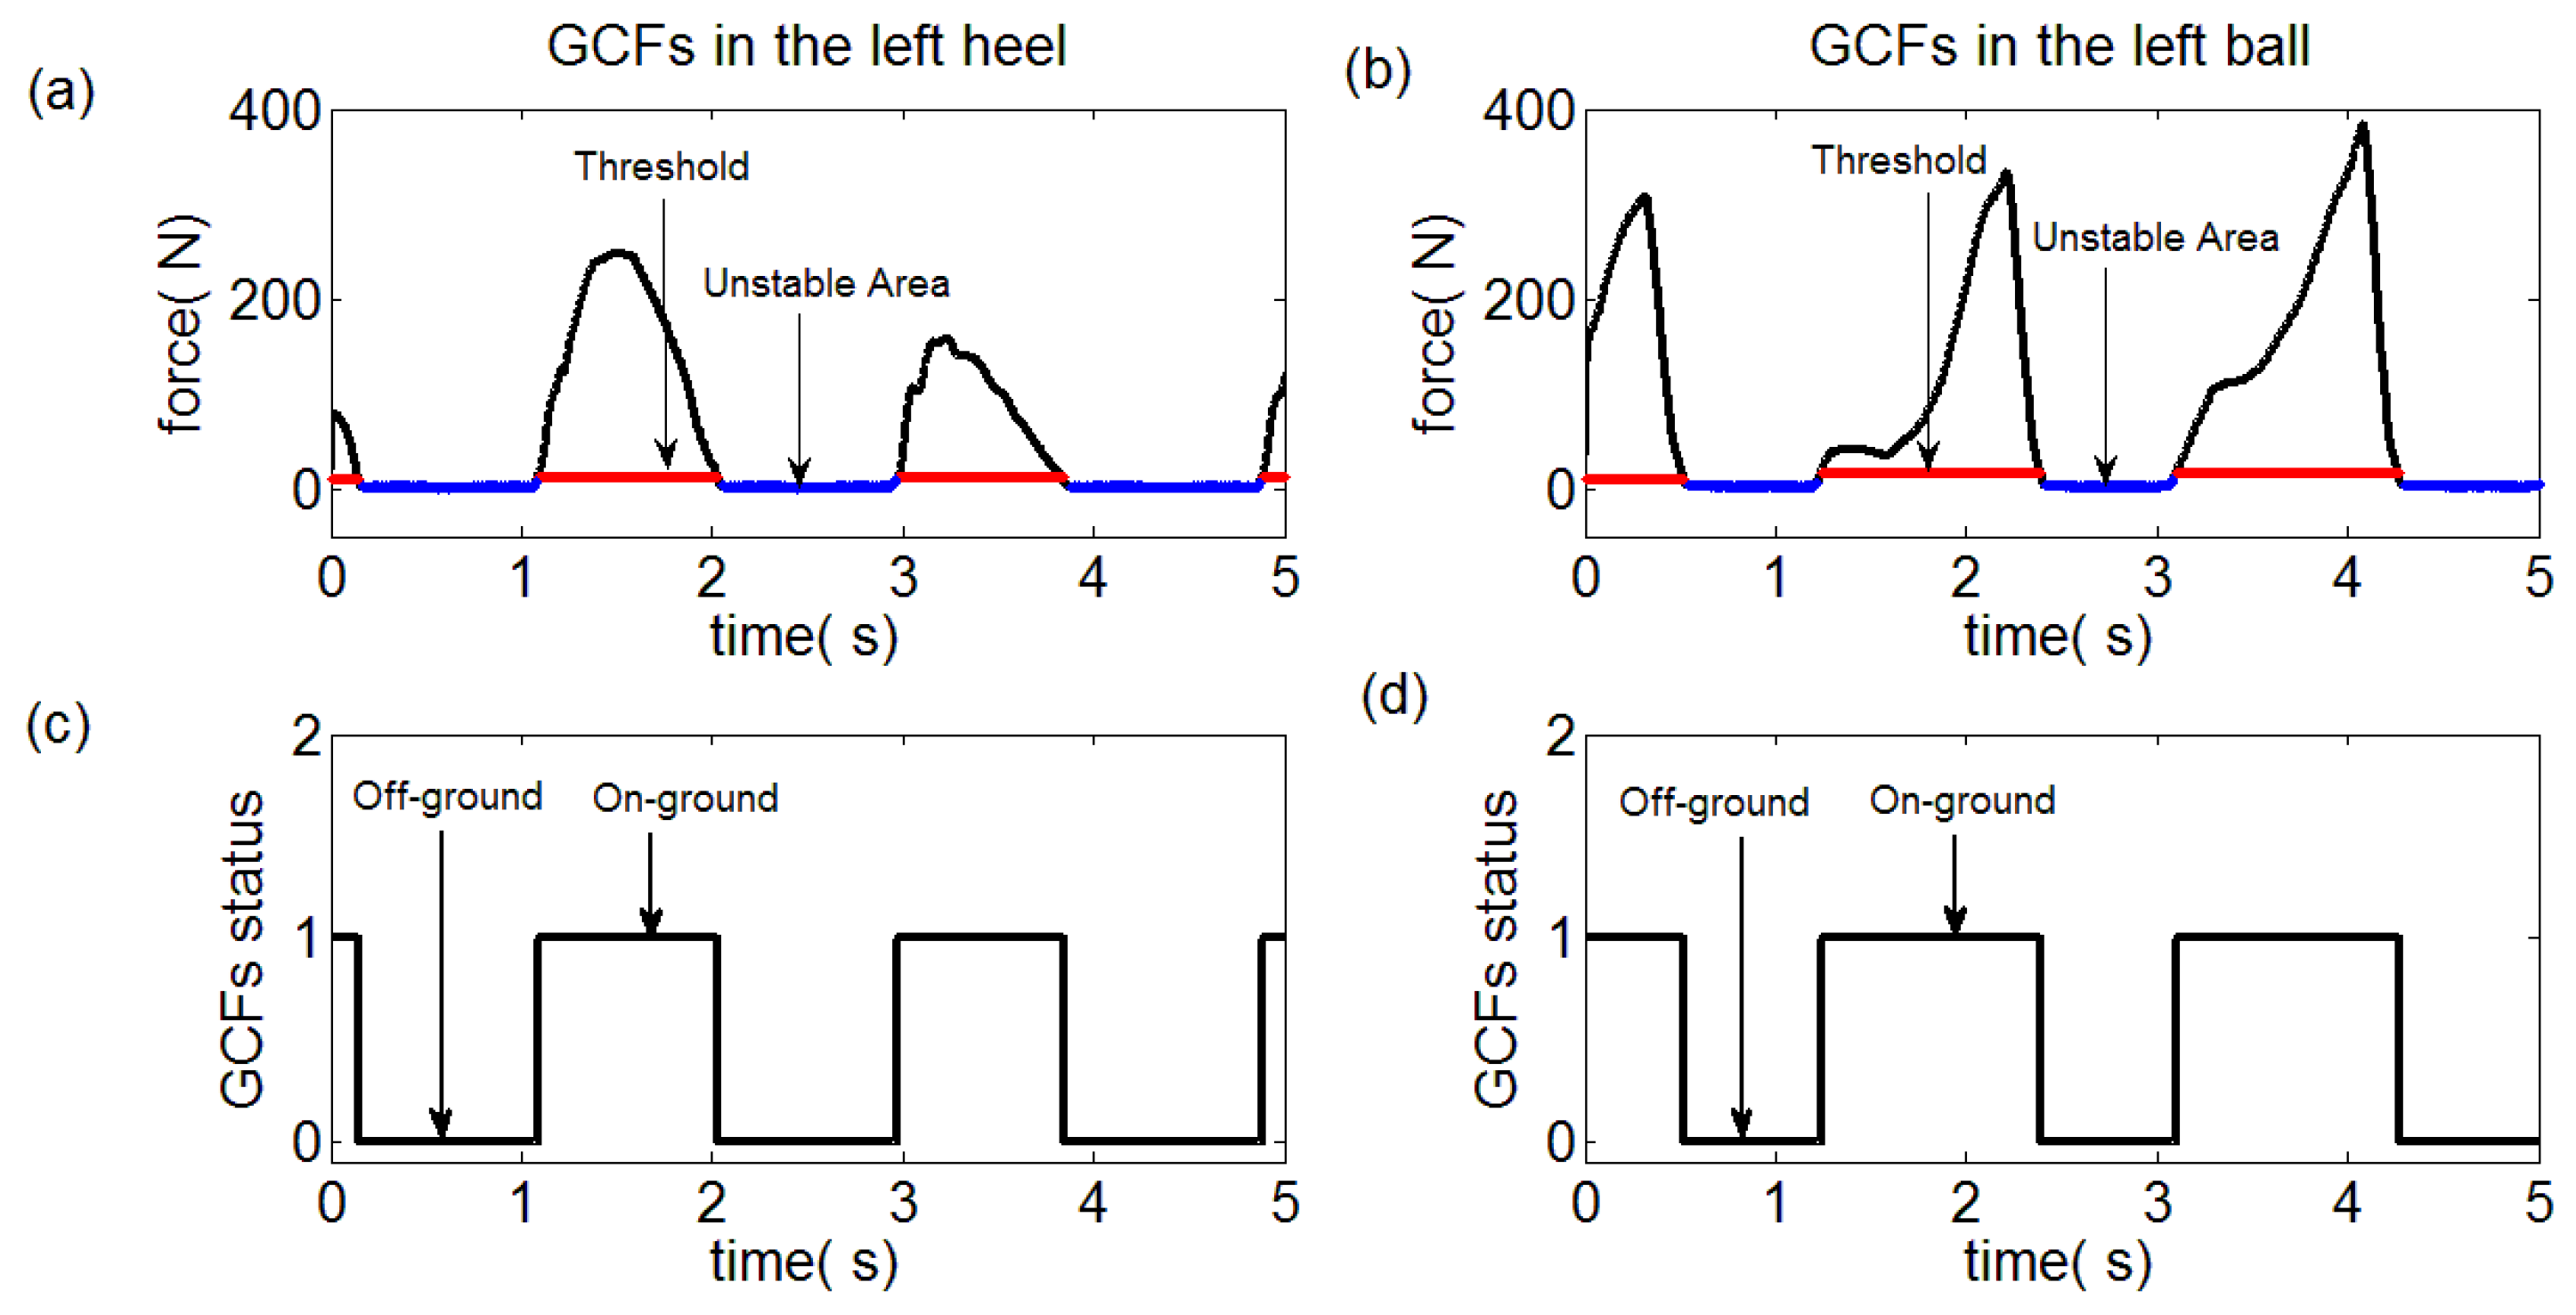
Figure 3. However, the [A’ B’] and [B’ C’] intervals could not be considered as on-ground status. As a result, this statistical characteristic analysis would lead to false detection such that further research should be carried out.
2.4.2. Constant False Alarm Rate and Threshold Computation
For all of the relating studies, the set threshold is closer to the GCFs differentiated as off-ground status. Therefore, threshold computation should be made after [C’ D’] interval is searched using sliding window detector. The error between GCF value at point D’ and the computed threshold would lead to false detection. As a result, CFAR is used to make up this drawback.
It is assumed that
H0 is the detection result of GCF identified as true off-ground status and
H1 is the detection result of GCF identified as true on-ground status. Meanwhile,
D0 represents that the GCF is detected as off-ground status, while
D1 represents that the GCF is detected as on-ground status. In this paper, the threshold value is calculated based on the analysis of [C’ D’] interval which can be distinguished as off-ground status. Therefore, it would happen that the division results obtained by the computed threshold are detected as on-ground statuses, while the true detection results are off-ground statuses. Then, the false detection probability in this case can be expressed as
where
PF is the false detection probability and
P(
D1|
H0) is the probability that judges
H0 as
D1. Meanwhile,
x is the GCFs happening in the [C’ D’] interval,
T is the detection threshold and
P(
x|
H0) is the probability density function.
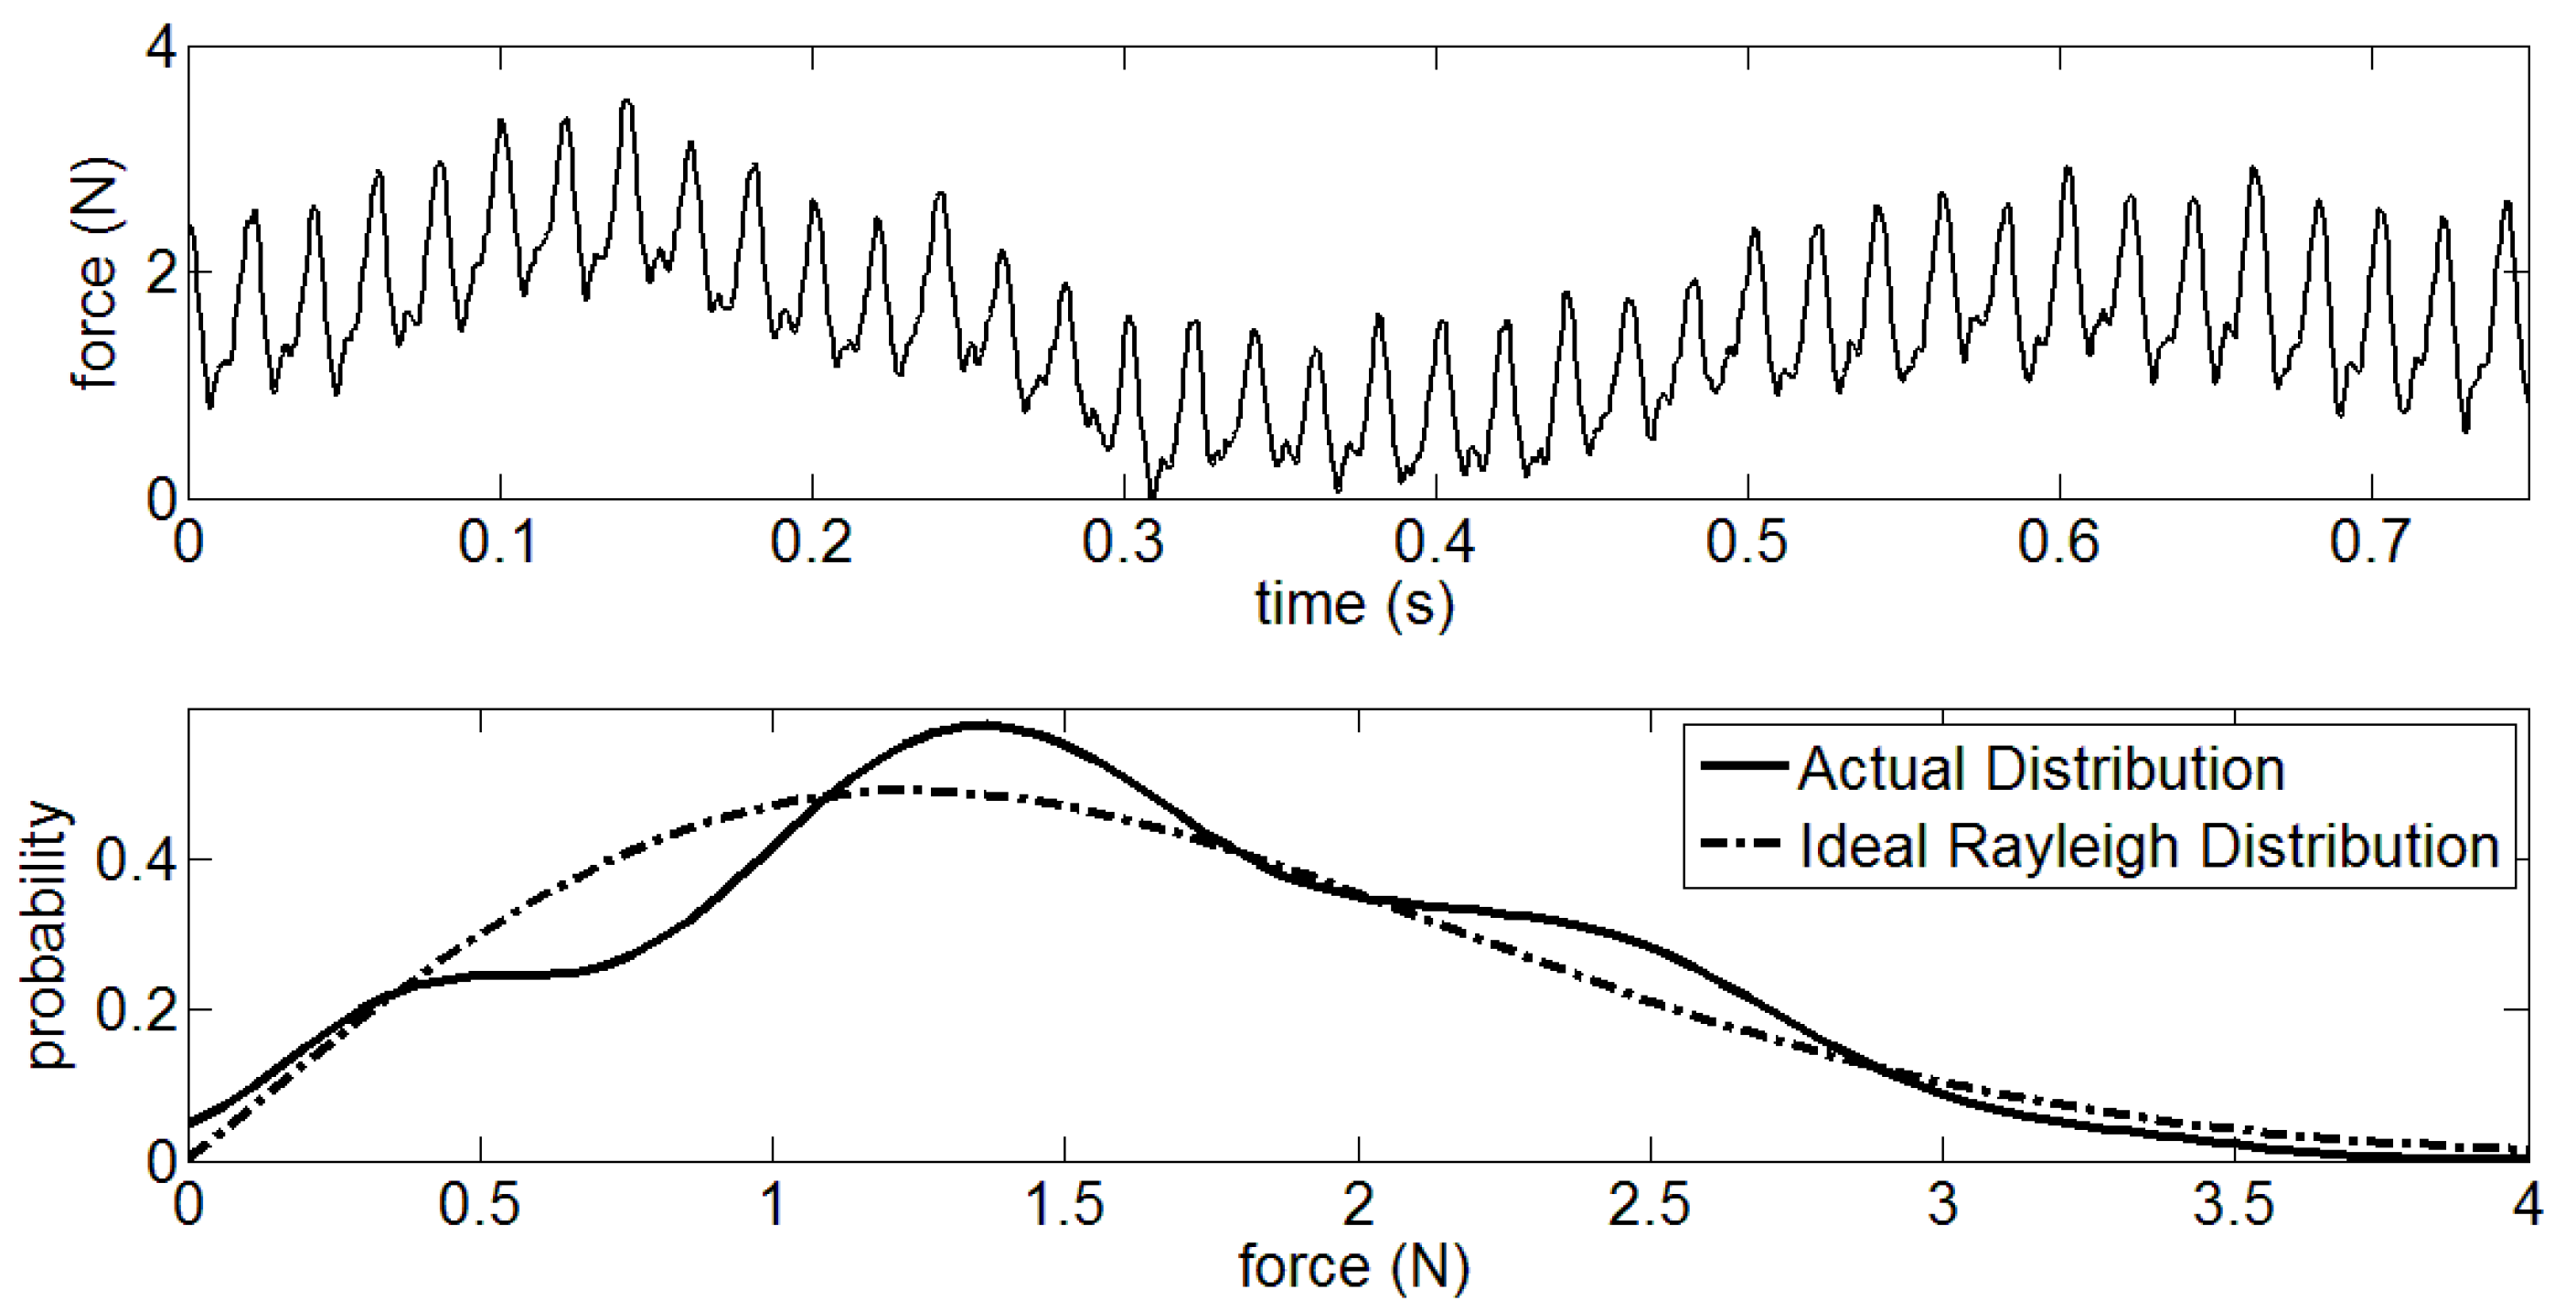
As shown in
Figure 4, the unfiltered
x in the [C’ D’] interval is subject to normal distribution. However, the filtered
x obeys the Rayleigh distribution as pictured in
Figure 5. Therefore, the
P(
x|
H0) can be described as
where
σ the signal density of
x. Substituting the Equation (5) into Equation (4), the false detection probability can be rewritten as
Then, the detection threshold T can be obtained in the following.
When the [C’ D’] interval is searched through the sliding window detector, the detection threshold would be computed immediately at point D.’ In Rayleigh distribution,
σ is proportional to the average of
x, which can be expressed as
where
x is the average value of
x in Reference [C’ D’] interval. The GCF values after D’ point would be compared to the detection threshold
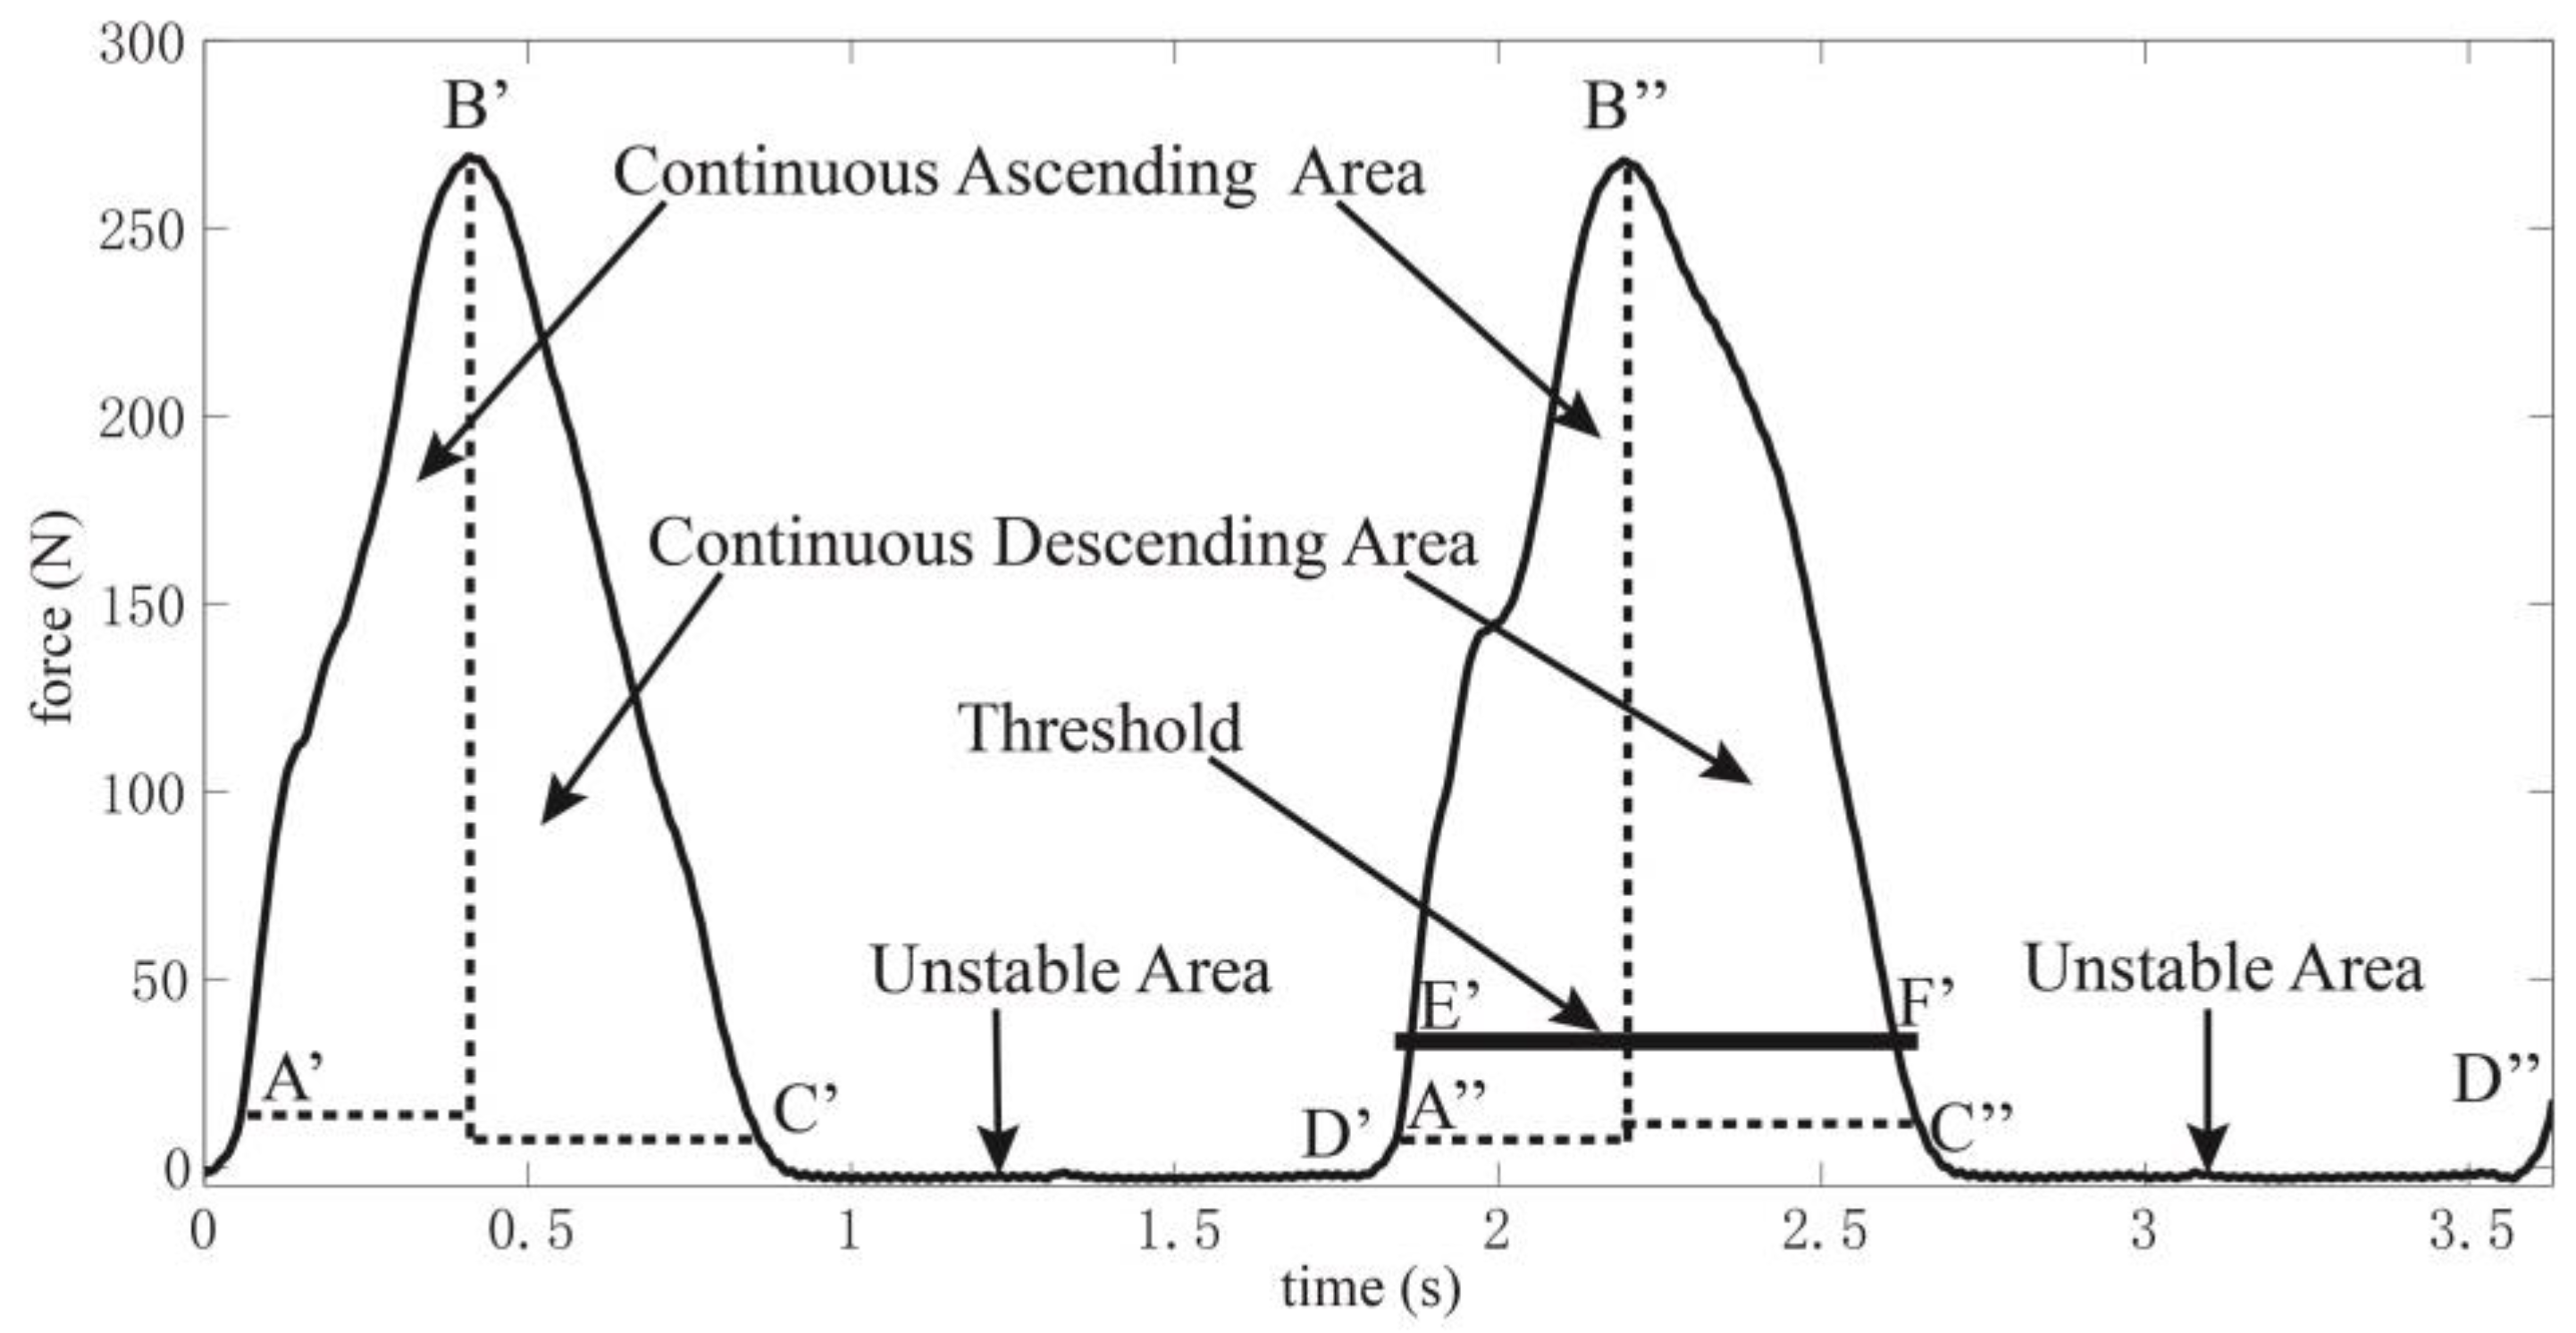
T to divide the GCFs into on-ground and off-ground statuses. As shown in
Figure 6, [A’’ B’’] and [B’’ C’’] are the continuous ascending and descending areas for the next gait cycle, respectively. Meanwhile, A’’ and D’ are the same point. In point A’’ (or D’), a threshold is computed according to Equation (7). Then, the status division can be made, which can be stated as follows.
where
F is the GCF after D’ (or A’’) point. For
S, “1” indicates an on-ground status and “0” indicates an off-ground status. As depicted in
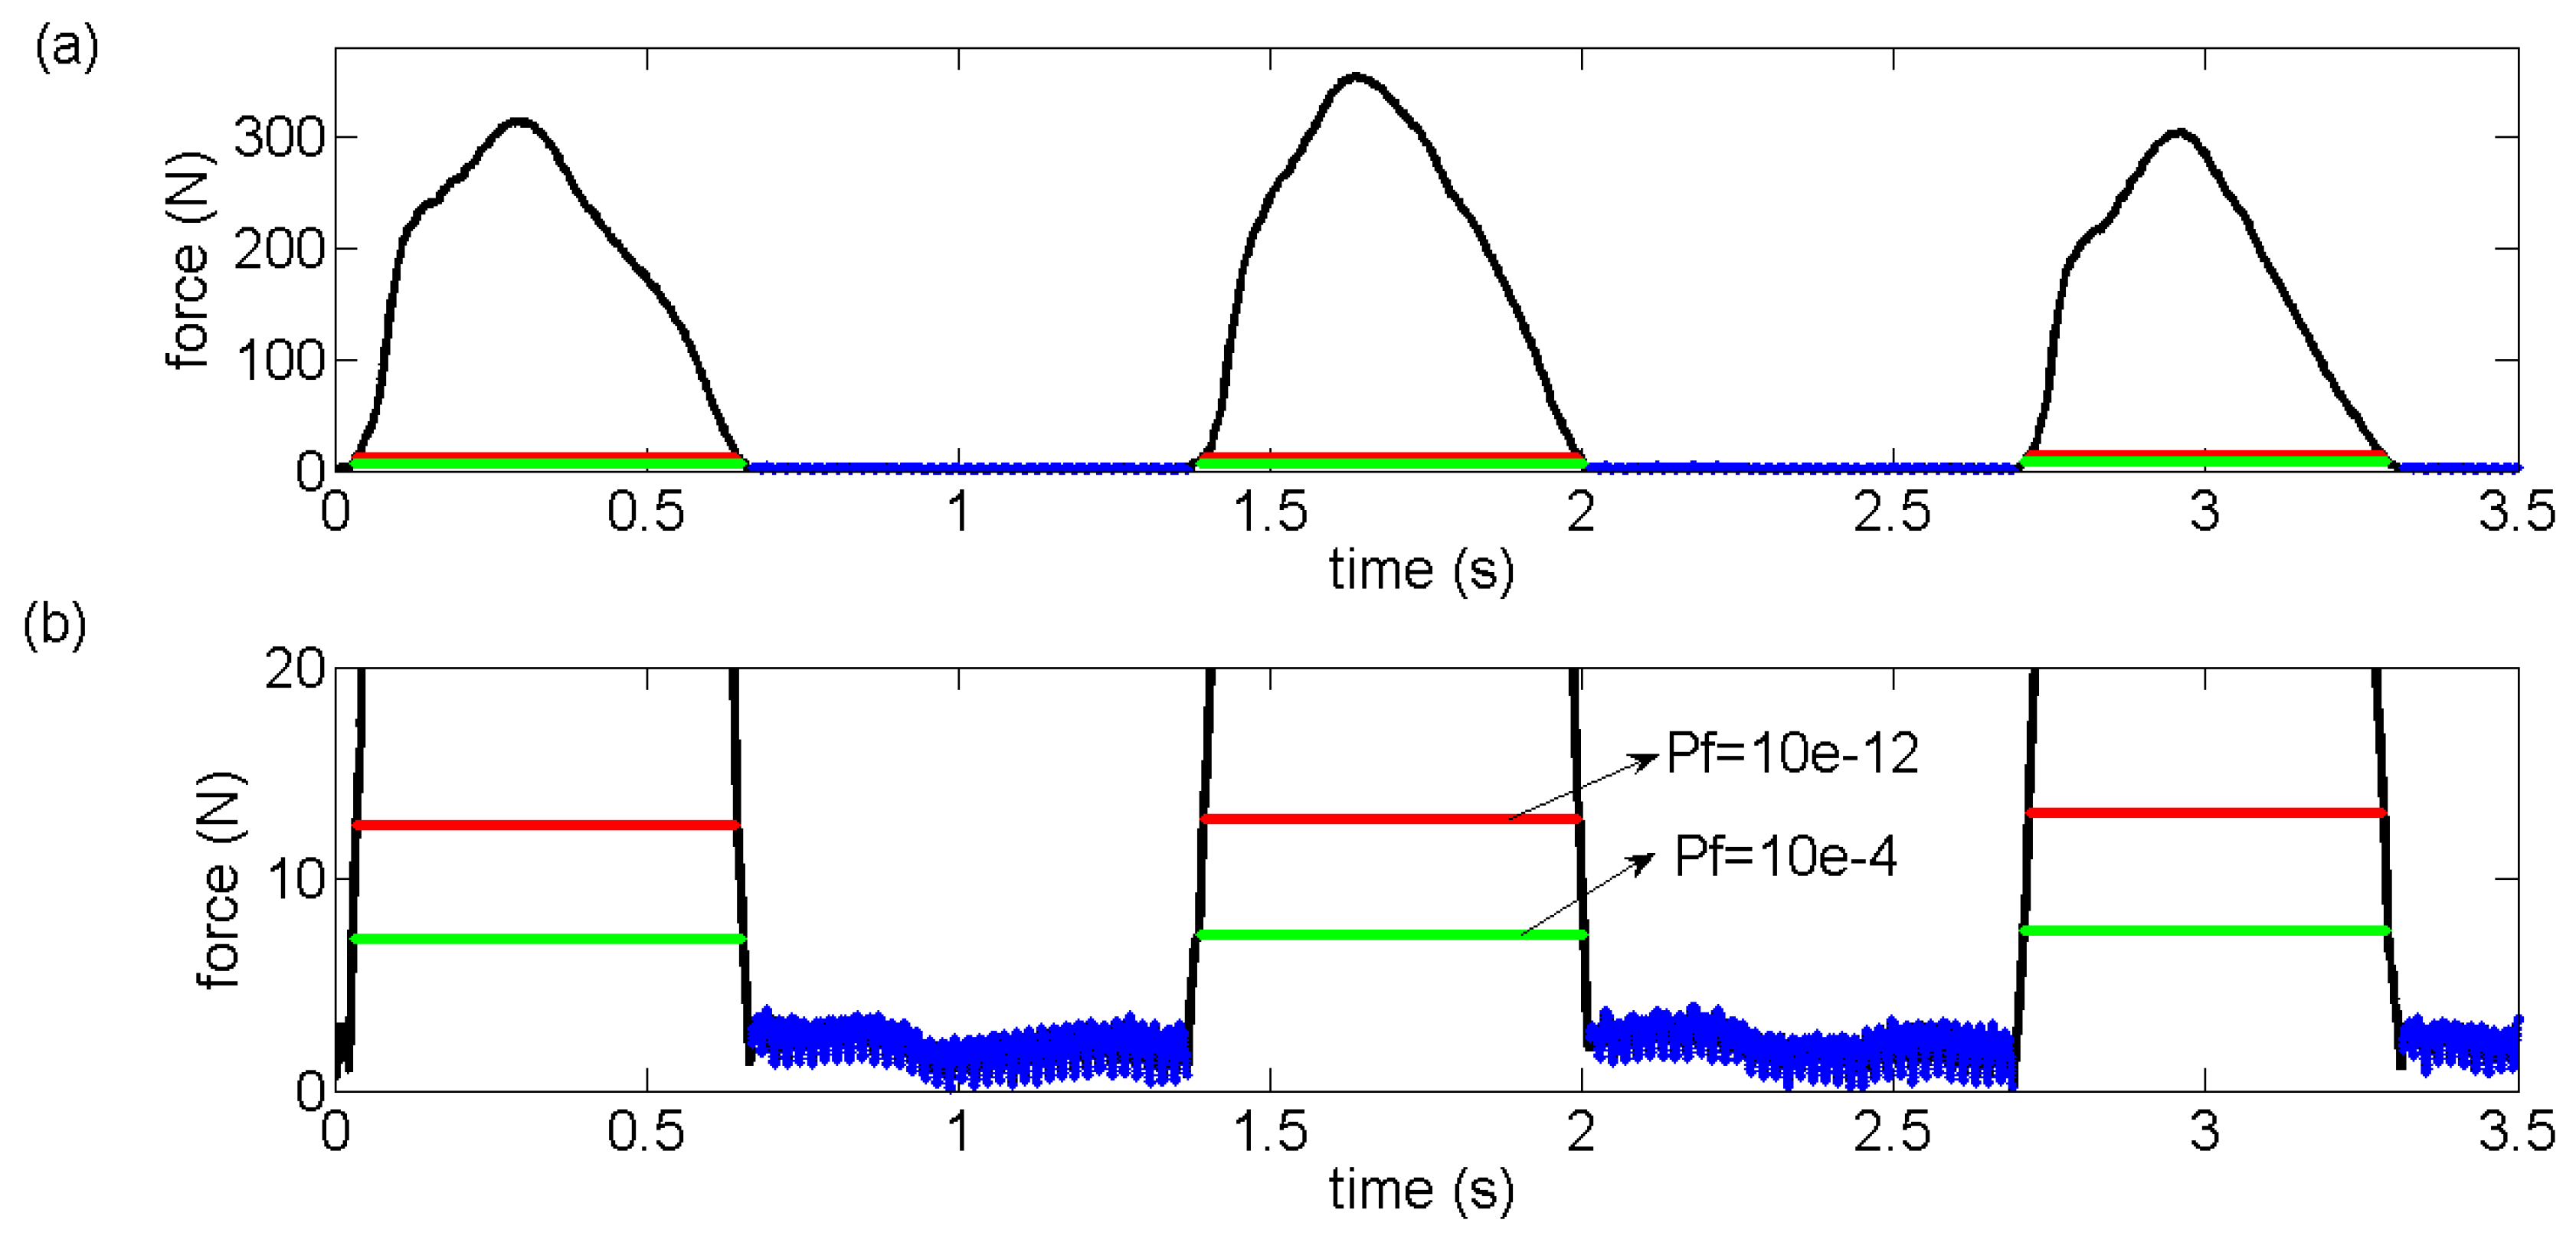
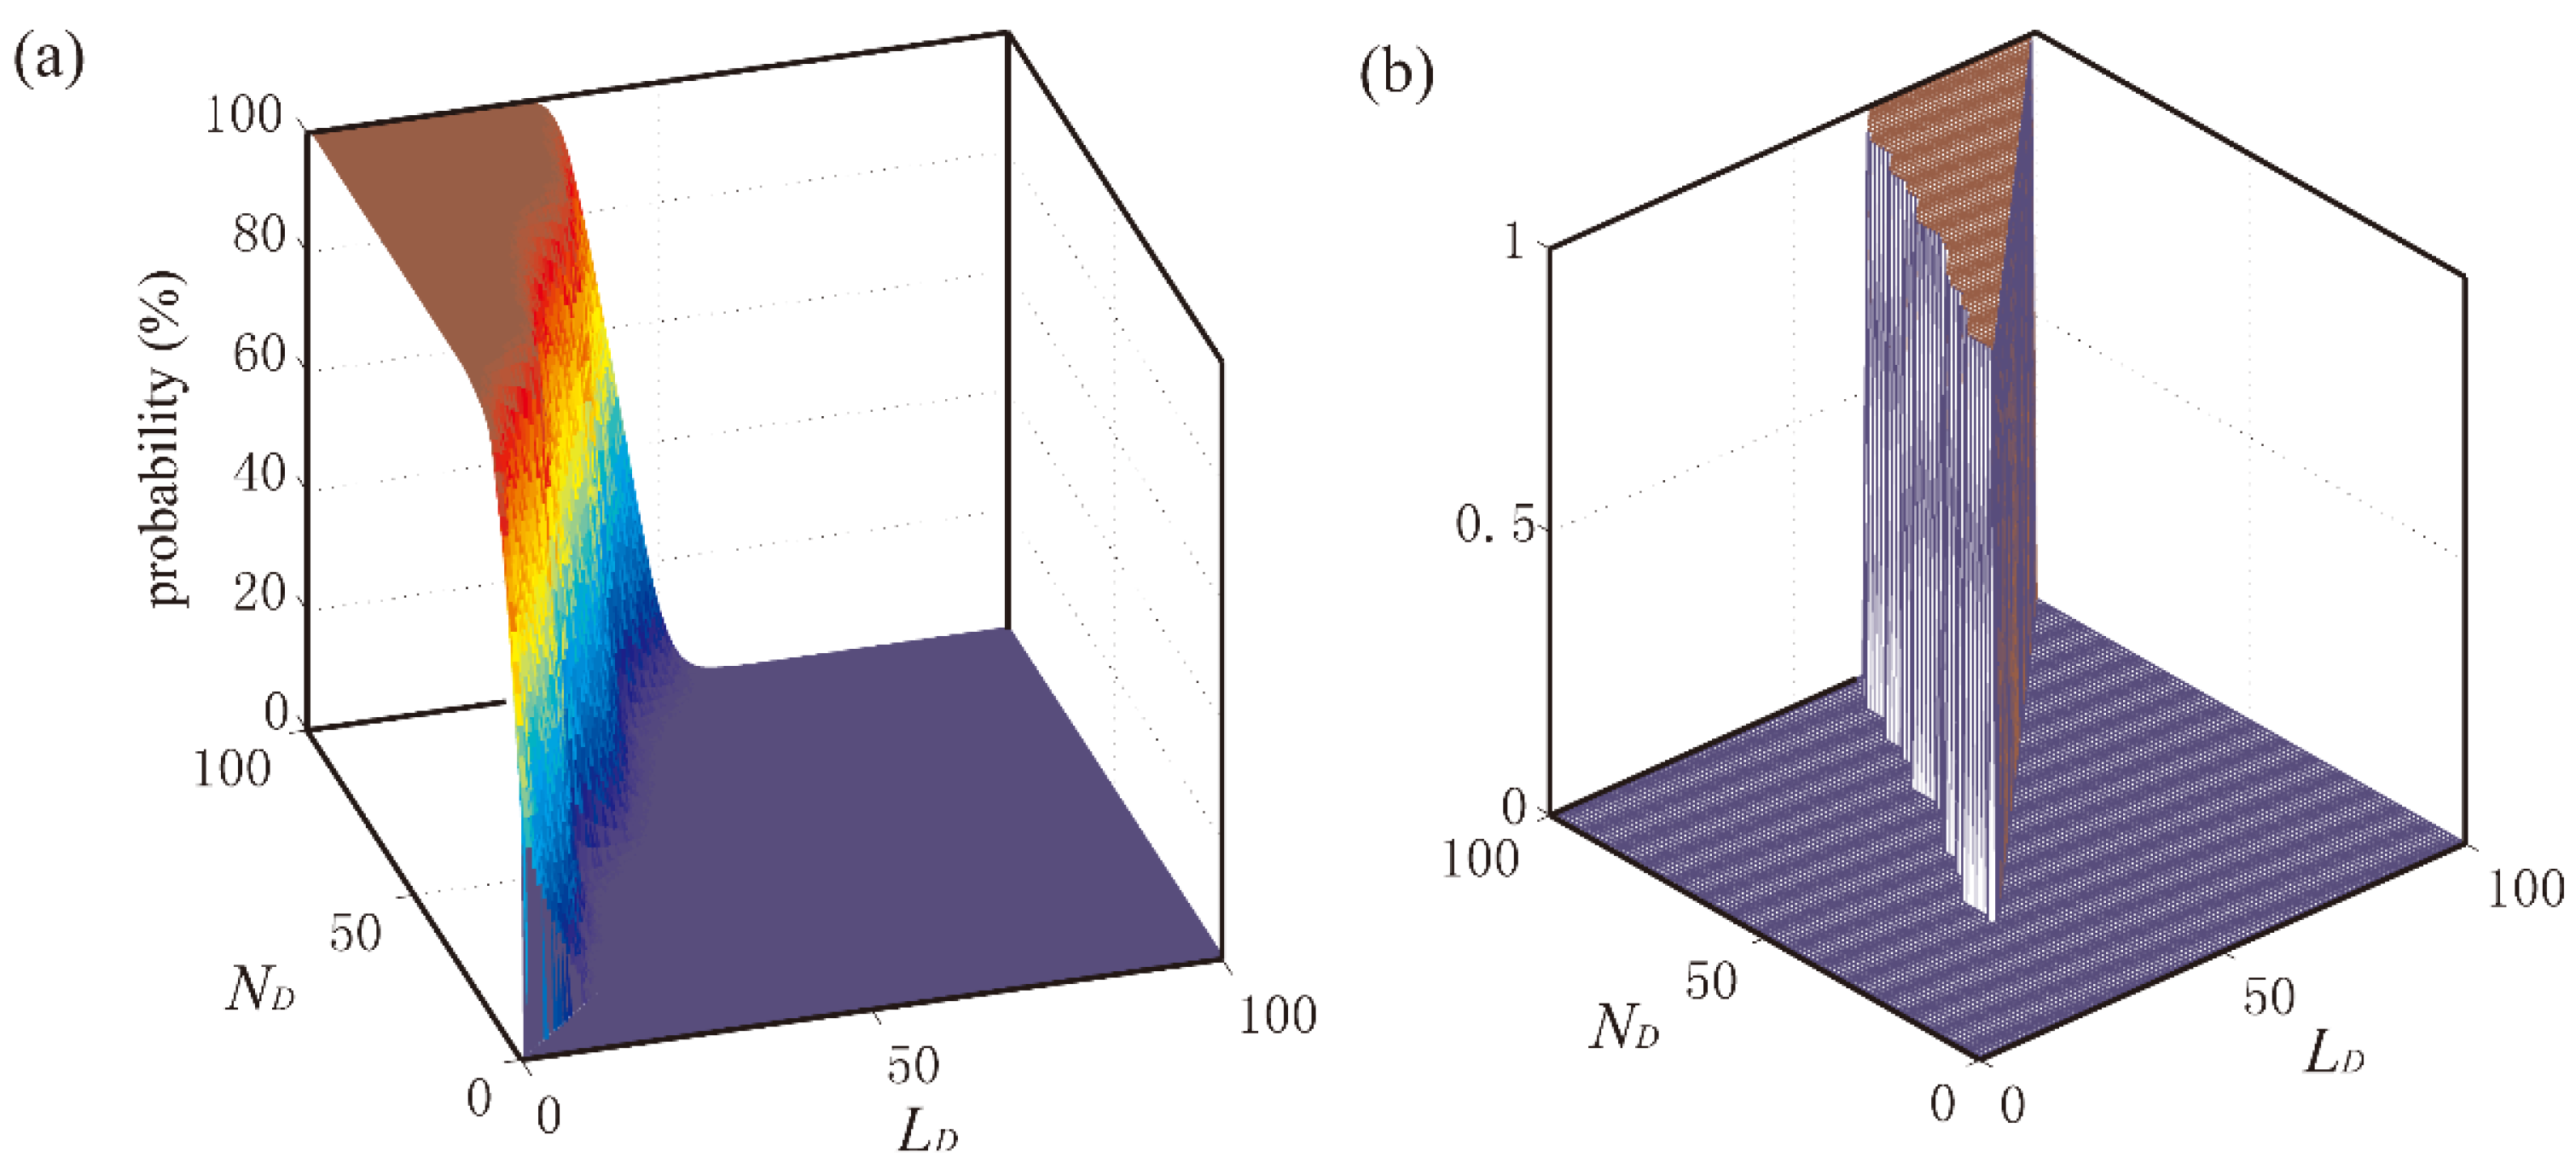
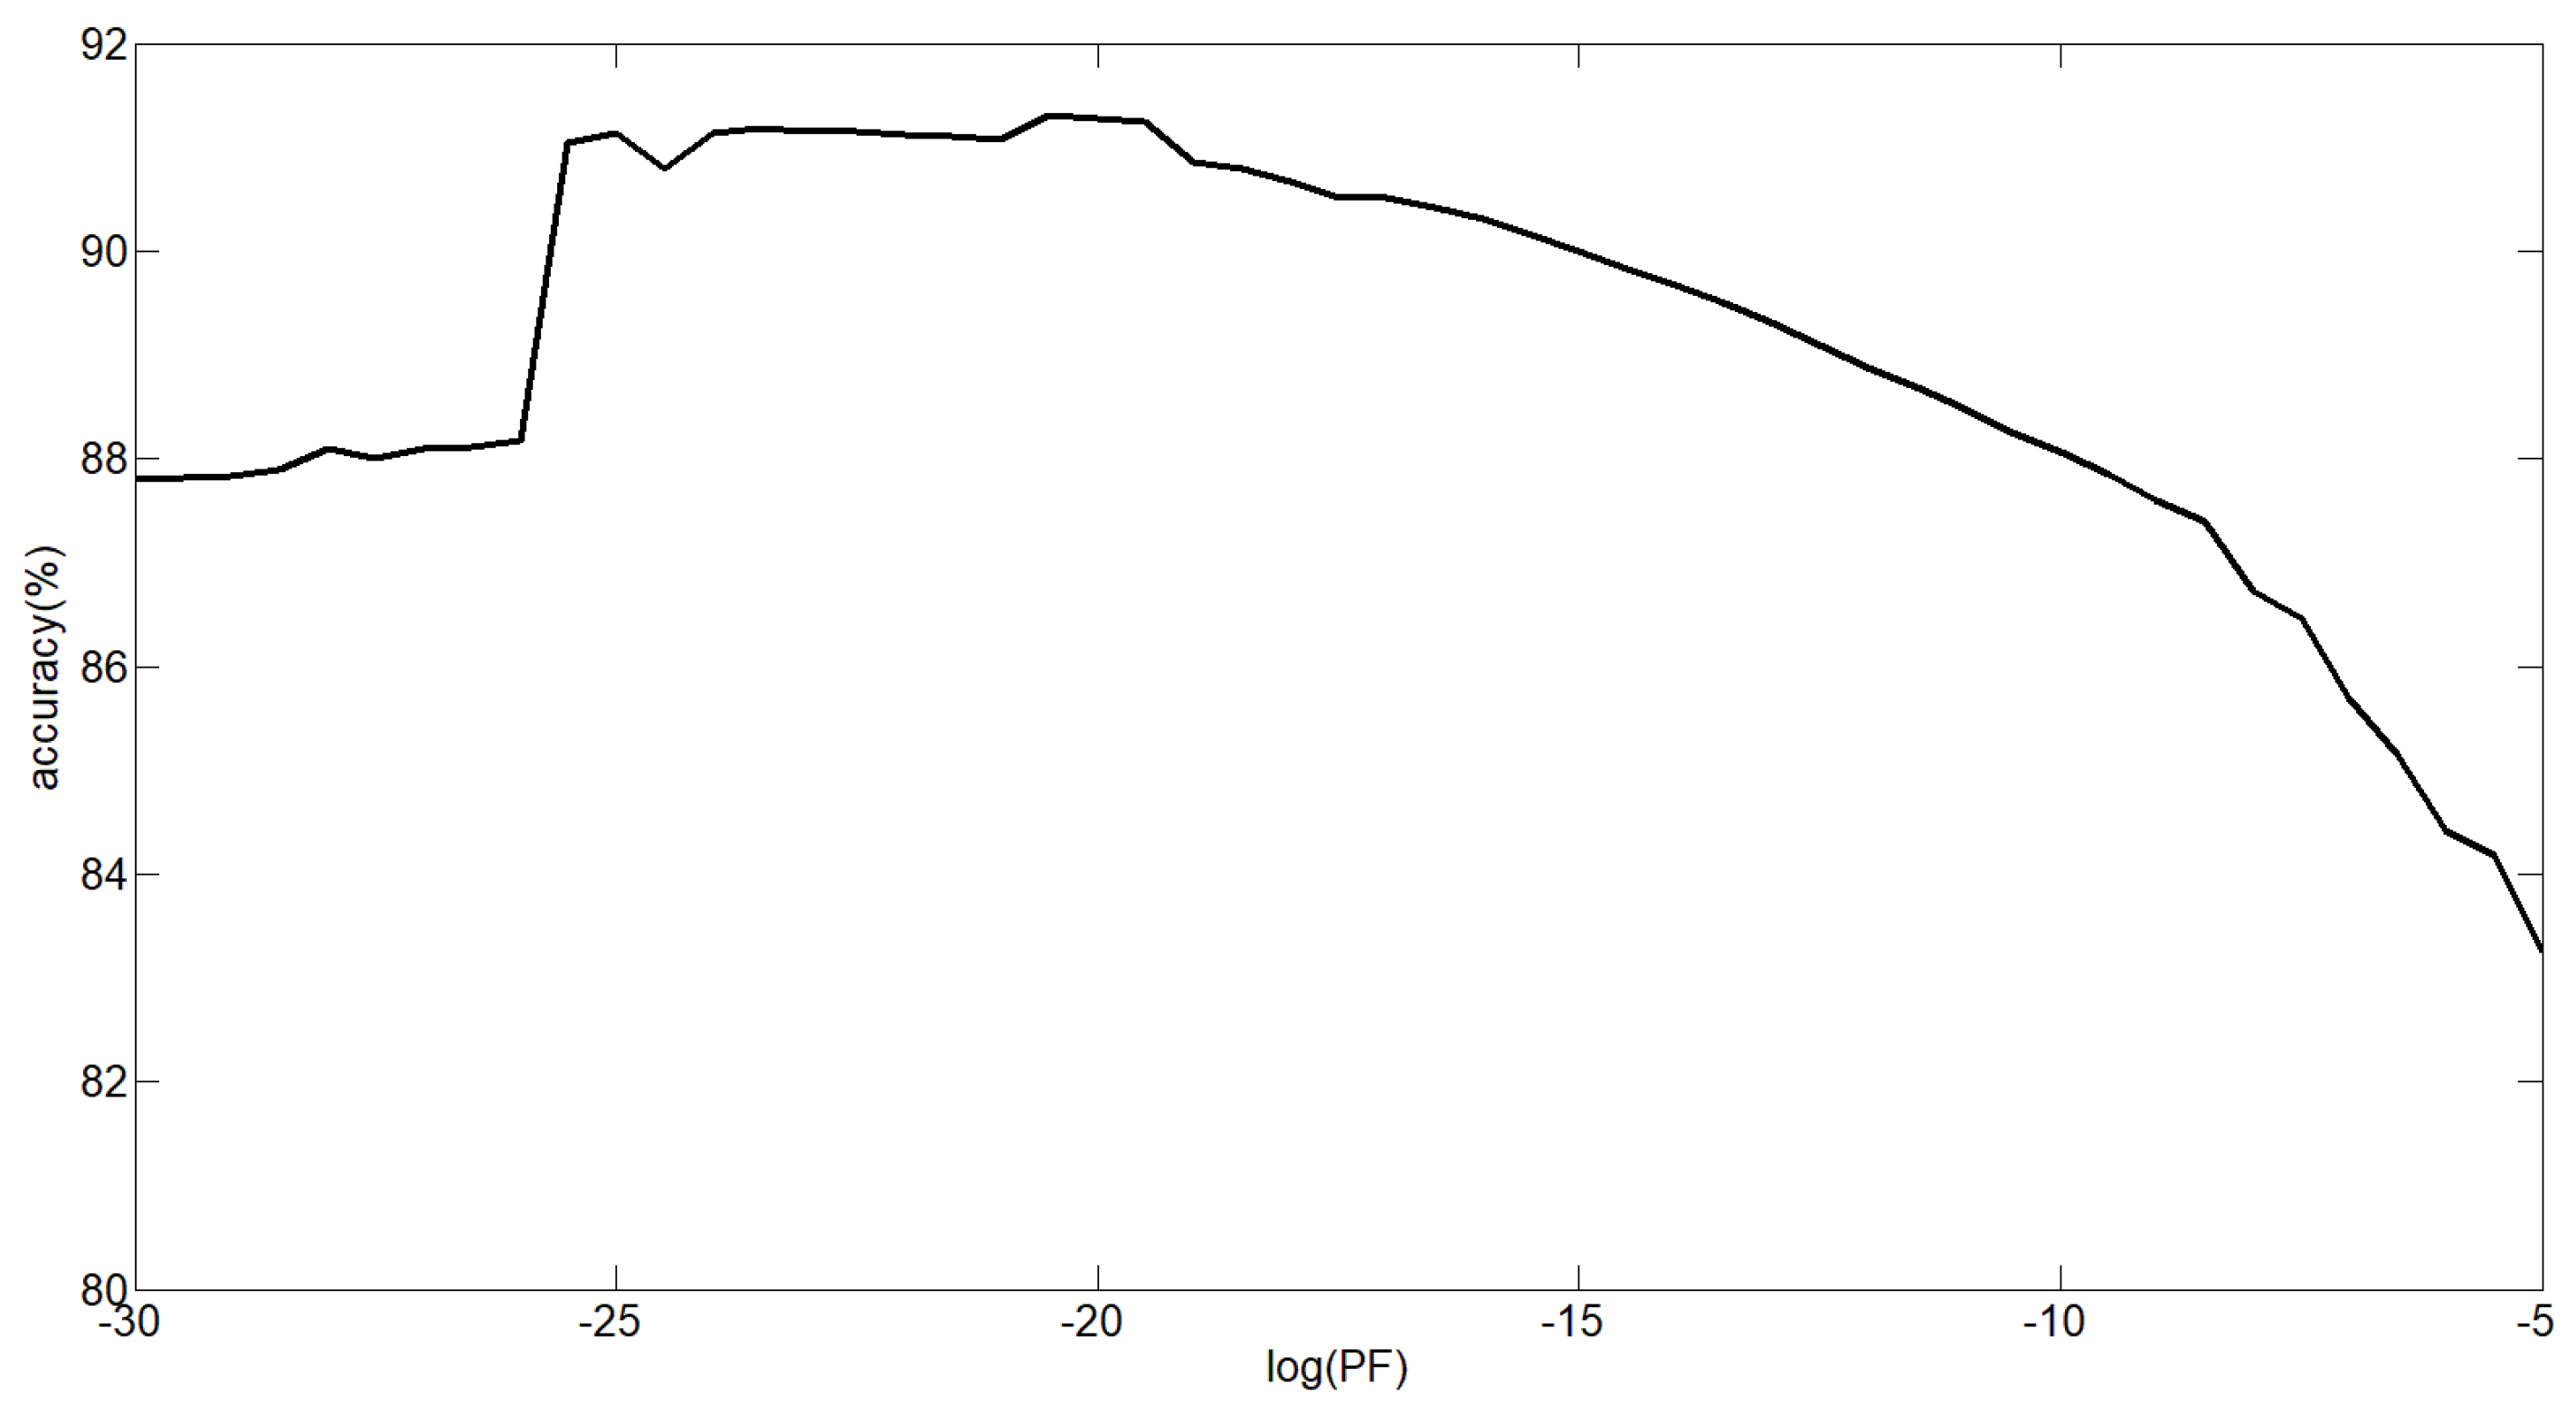
Figure 6, this calculated threshold divides the next gait cycle with the result that two intersection points E’ and F’ are obtained. Based on the division formula in Equation (9), [A’’ E’] and [F’ C’’] intervals are both judged as off-ground status. However, the
PF value would affect the threshold value according to Equation (7), which could be exactly described in
Figure 7. The GCFs marked in blue are detected to be in unstable area. The lines marked in red and green are the computed threshold using two different
PF values. Therefore, the gait patterns could be distinguished according to the rules in
Table 1, when both the status divisions of ball and heel are made.
2.5. Evaluation of the Results
In order to test the reliability of the proposed method, reference methods should be determined. As well known, the Lopez-Meyer method had been compared with the “GAITRite system” and acquired a comparative and reliable confidence of 95% [
15]. Therefore, not only the Lopez-Meyer method [
15] but also the other methods [
4,
16,
17,
18] in the literature were introduced as reference methods. The gait pattern detection rules of these methods were severally presented in Reference [
17,
18]. Hence, the reliability of this study is determined by comparing the detection results between the reference methods and the proposed algorithm. Finally, the obtained reliabilities were processed to measure the "test-retest reliability" by taking several measurements on each subject. The analysis is performed with the intraclass correlation coefficient (ICC) proposed by Bartko [
19].
4. Discussion
4.1. Advantages of the Research
When compared with the five reference methods, the proposed method is highly reliable (as seen in
Table 2) and can identify the gait patterns in real time. The proposed method can be adaptable to different subjects with different body weights at different walking speeds, because adaptive thresholds are calculated according to the GCF signal characteristic analyzed though the sliding window detector and the CFAR. As reported in Reference [
17], the attachment between the shoe and foot would lead to bigger change of GCF magnitude in the unstable area such that the PM reliability would be affected to be lower. However, this situation would not happen in this proposed method as the lasting time of the differential GCF is used by the sliding window detector to identify the GCF in the unstable area.
The STTTA [
18] and the proposed method can both achieve to adaptively identify the gait patterns in real time. However, the STTTA can identify the gait patterns using the GCFs data in the current period. Meanwhile, the proposed method applied the sliding window detector using the GCFs data in a lasting time which consisted of 35 (or 36) sampling periods. Specifically, for STTTA, when the GCFs in the heel or ball are judged to be off-ground status, a sudden change of GCF signal would lead to the GCF value to be larger than the threshold and judged to be on-ground status. Therefore, misdetection would happen for STTTA in this situation. Nevertheless, this situation will not happen in this proposed method, because the gait pattern is distinguished and given from the analysis of detection results in 35 (or 36) sampling periods.
According to the detection rules in
Table 1, when the GCFs are identified to be in the unstable area, these GCF signals are judged to be off-ground status. When the heel and ball are both judged to be off-ground status, the specific gait pattern is swing phase. In swing phase, if the foot trembles leading to relatively larger GCF values, the sliding window detector would still identify the GCF signals to be in unstable area. Meanwhile, the CFAR algorithm would figure out a larger threshold to avoid the GCF signals identified as on-ground status.
For lower exoskeleton robot systems, the gait pattern detection plays an extremely important role. The results of gait pattern detection correlate with motion intention of the wearer such that the robotic leg automatically move to stand or swing. Meanwhile, the lower exoskeleton robot systems need real-time and adaptive gait pattern detection for different wearers to move at different walking speeds. This proposed method would meet this need.
The detection results were obtained from able-bodied subjects and a cyclic gait pattern sequence could be analyzed for healthy people using this research. However, the gait pattern sequence of hospital patients would differ from that of healthy people. Therefore, this research would help with the diagnosis of some persons with walking injuries, diseases or limitations.
Most studies [
5,
22,
23] used the accelerometers and gyroscopes to obtain the acceleration and velocity for gait pattern detection. Some gait patterns in these studies did not appear in this paper, such as toe-off and initial-contact. If we want to identify the toe-off phase on this force platform, another FSR should be added to be mounted inside the top of the shoe. Meanwhile, a relatively small threshold was set for the GCF in the heel to detect the initial-contact.
4.2. Limitation of the Research
When the subject is walking at a faster speed, the lasting time of the GCF signals identified to be in the unstable area would get less such that the data points in this area reduce. In this situation, the data points in this area would not obey Rayleigh distribution strictly. To overcome this drawback, sampling frequency should be guaranteed to be high enough.
As reported in Reference [
18], the cut-off frequency of Butterworth low pass filter is 10 Hz. However, the GCF signal should not be filtered excessively in this proposed method, which would destroy the data distribution characteristic.
When the subject jumps, both feet are judged to be swing-phase. In the walking experiments, subject jumping was rarely observed and only occurred when the subjects were running at a sufficiently rapid pace.


