Review of Incoherent Broadband Cavity-Enhanced Absorption Spectroscopy (IBBCEAS) for Gas Sensing


Abstract
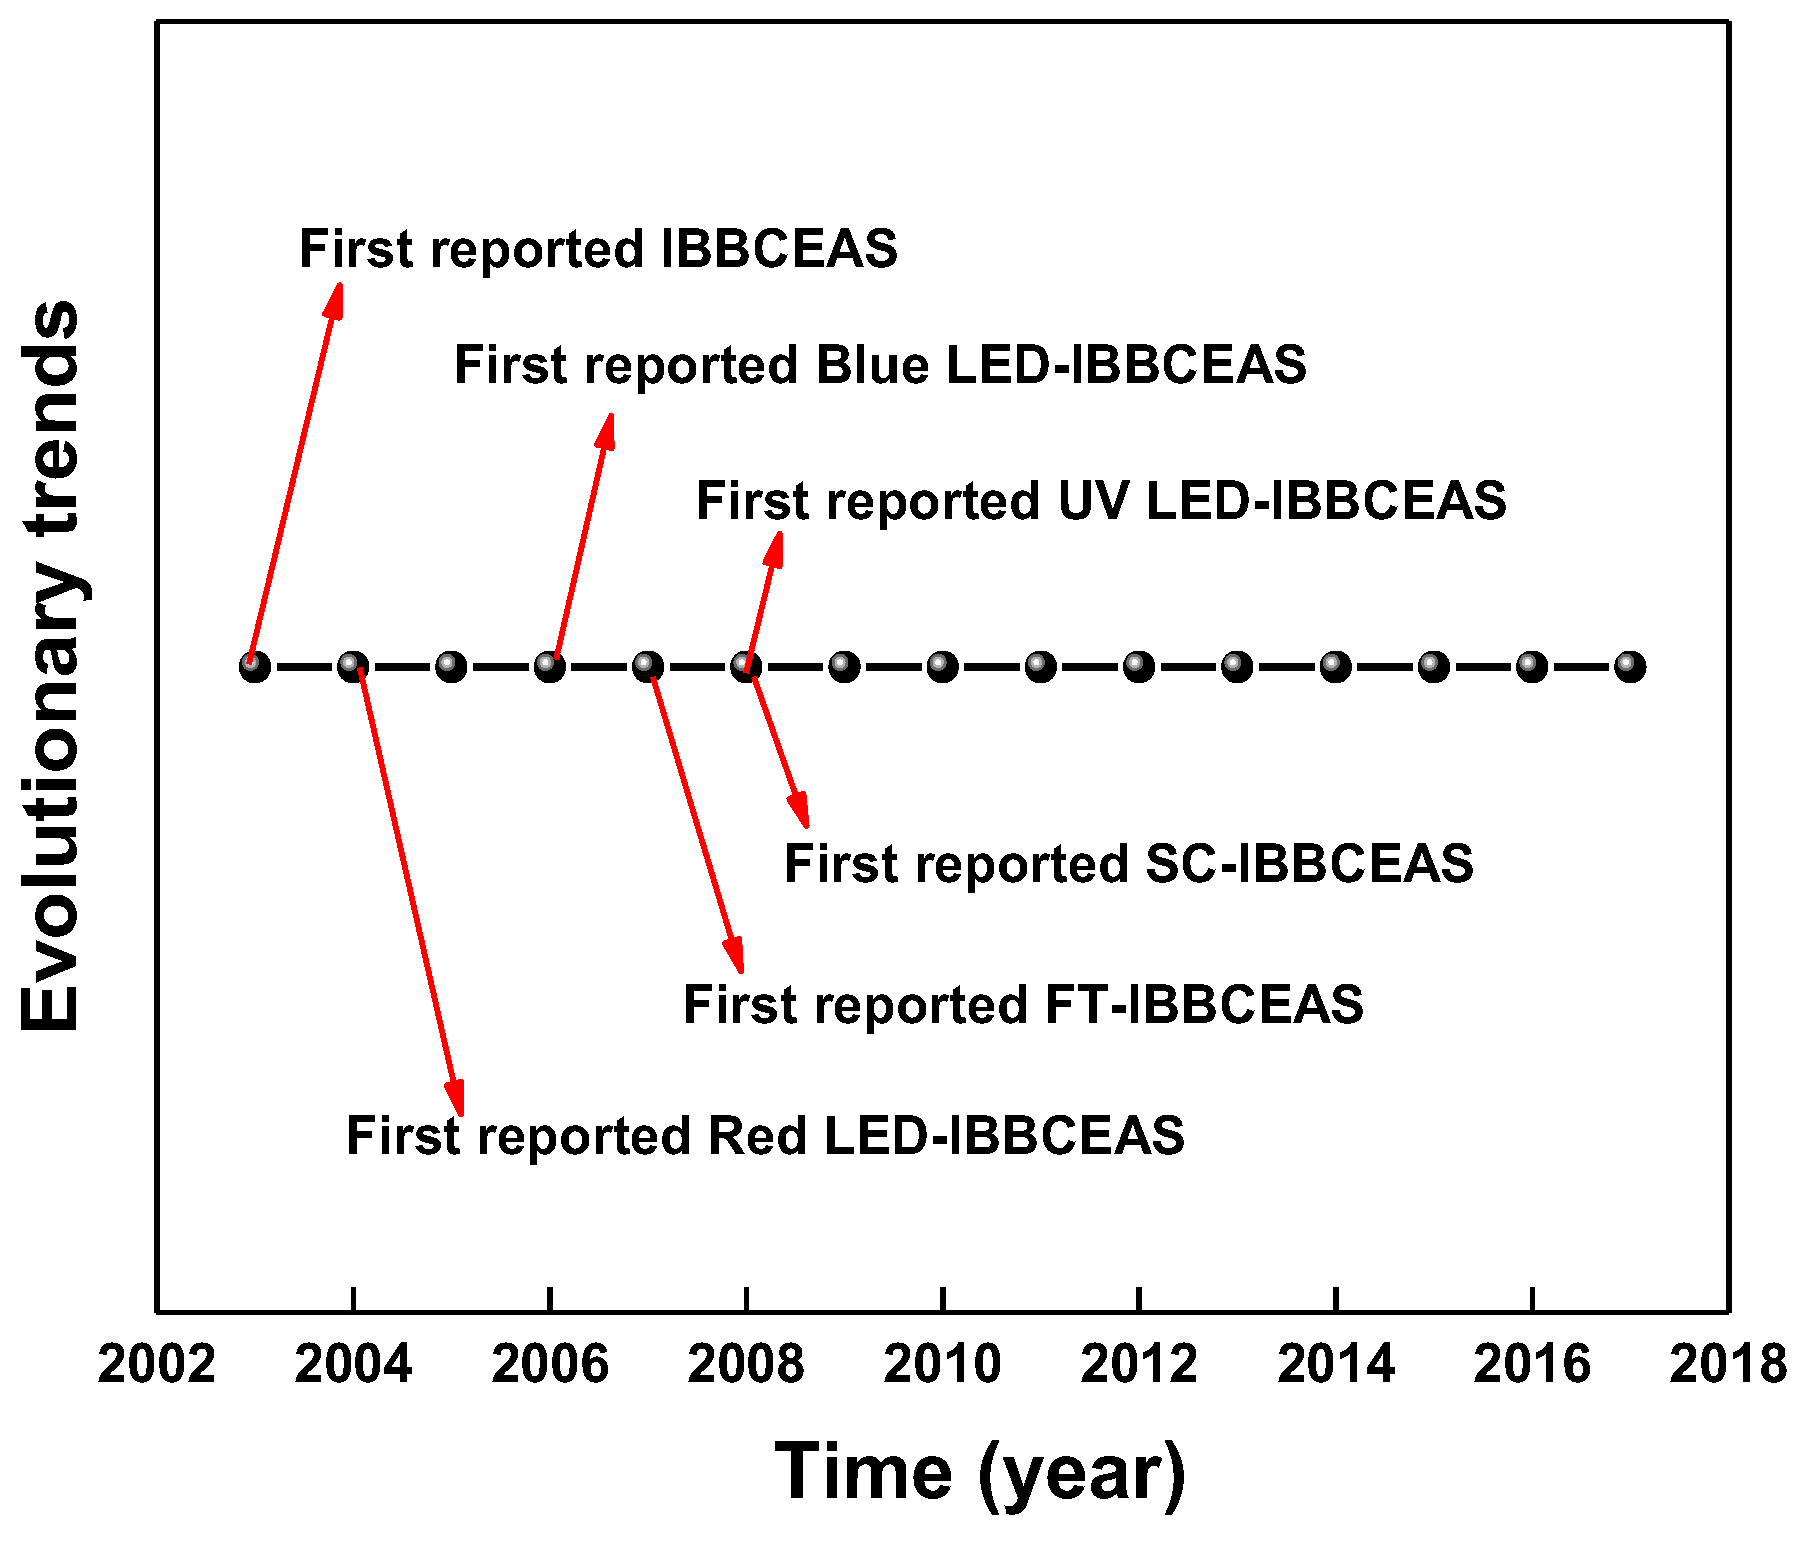
1. Introduction
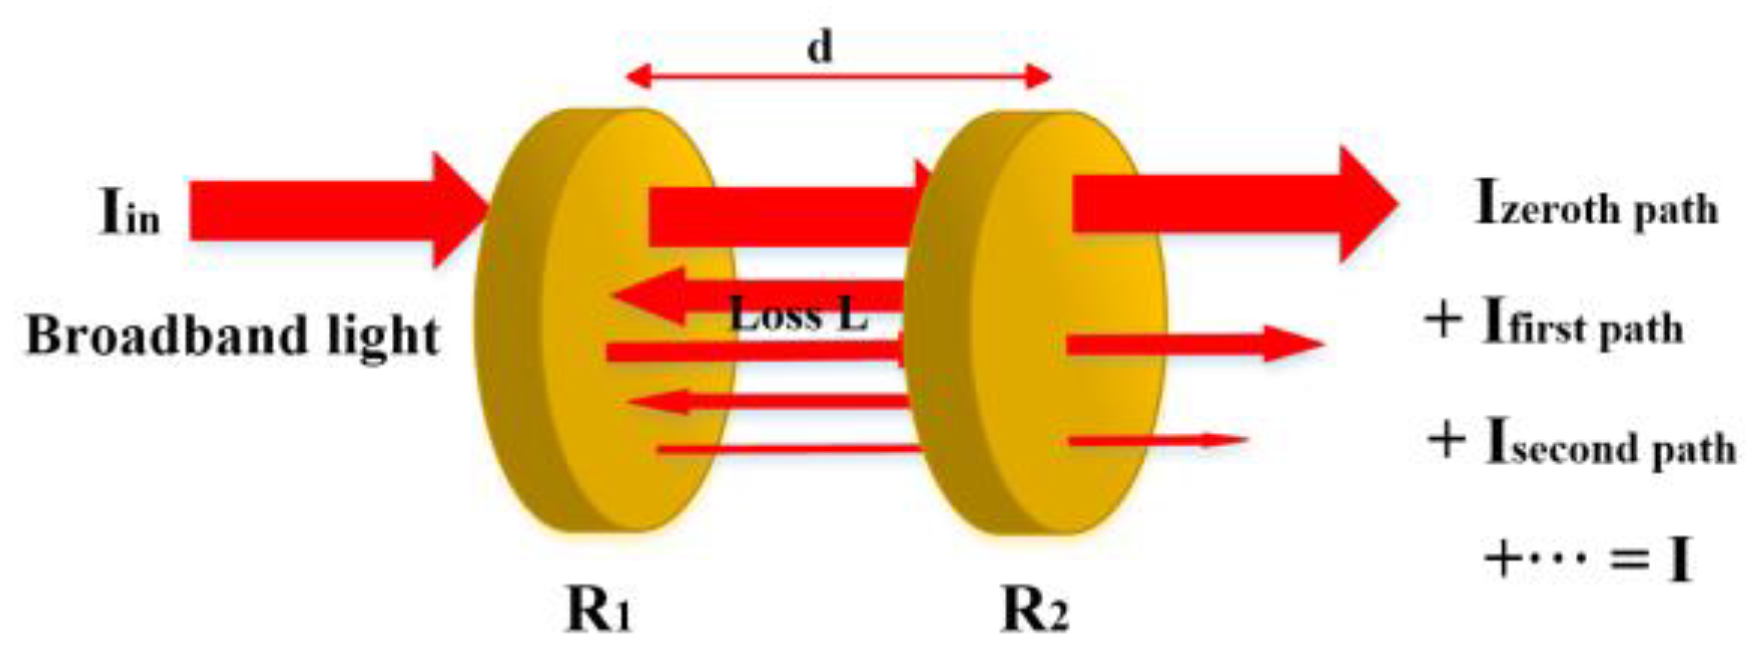
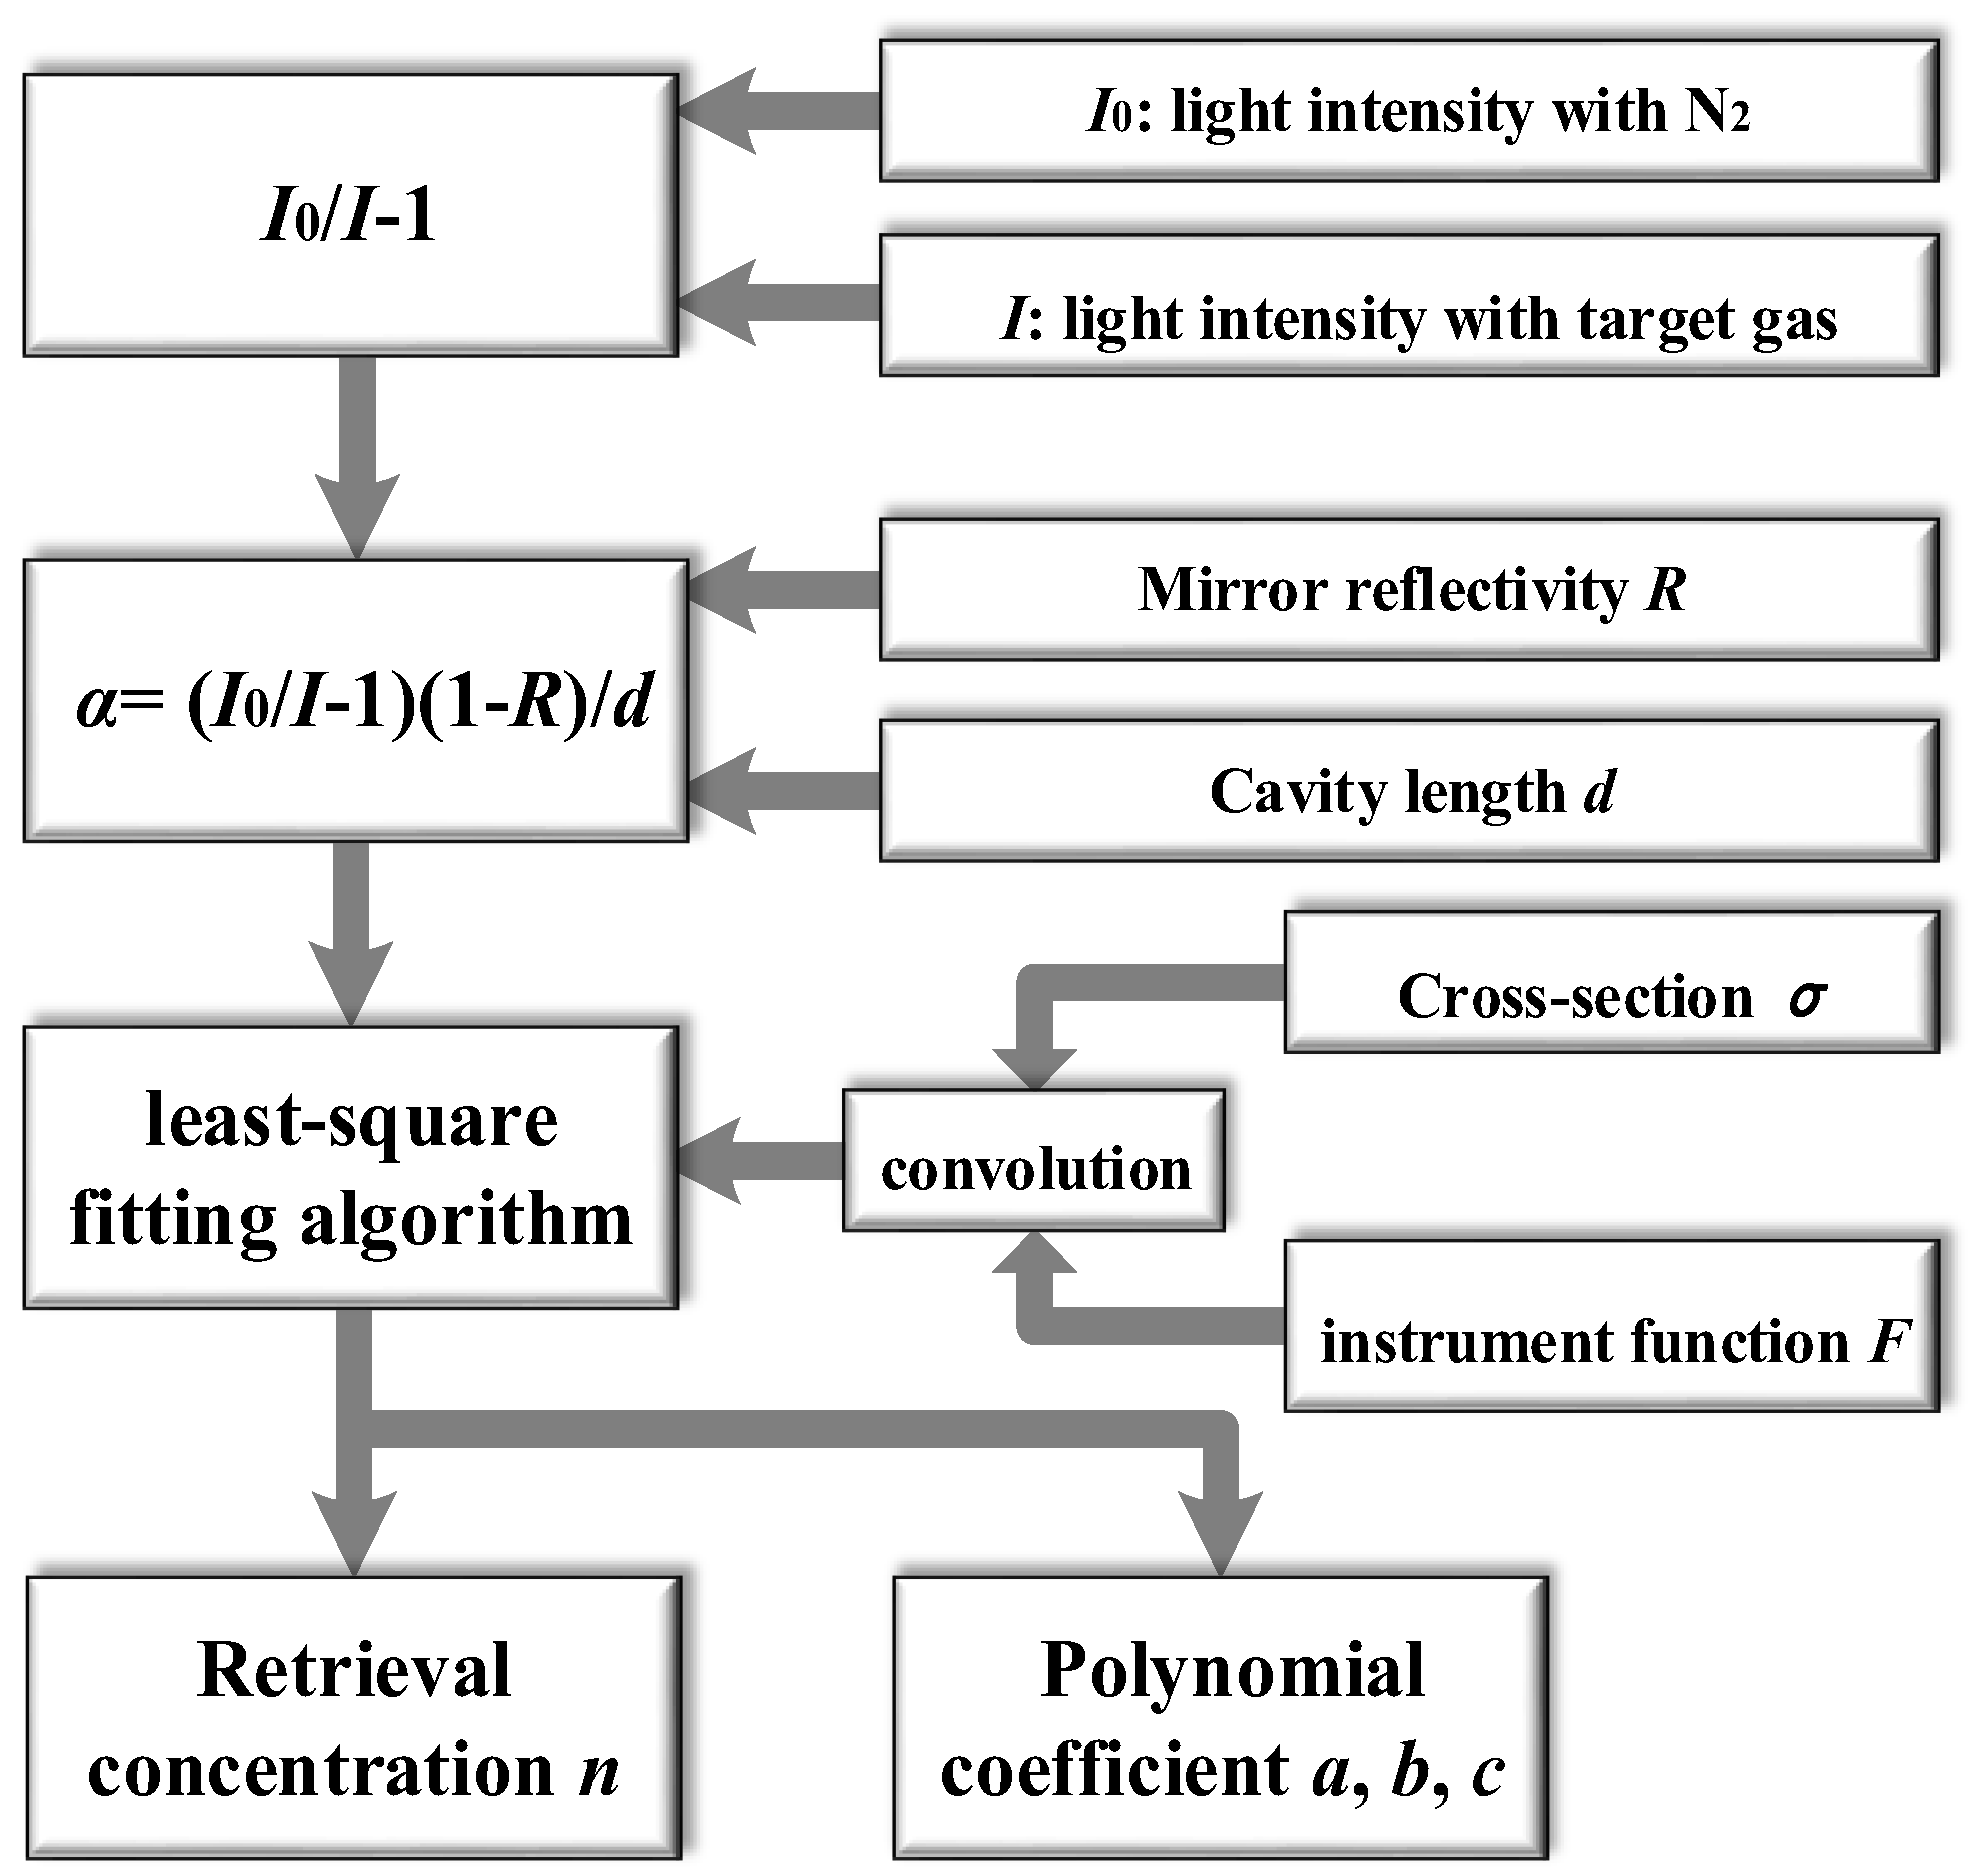
2. Principle of IBBCEAS for Gas Sensing
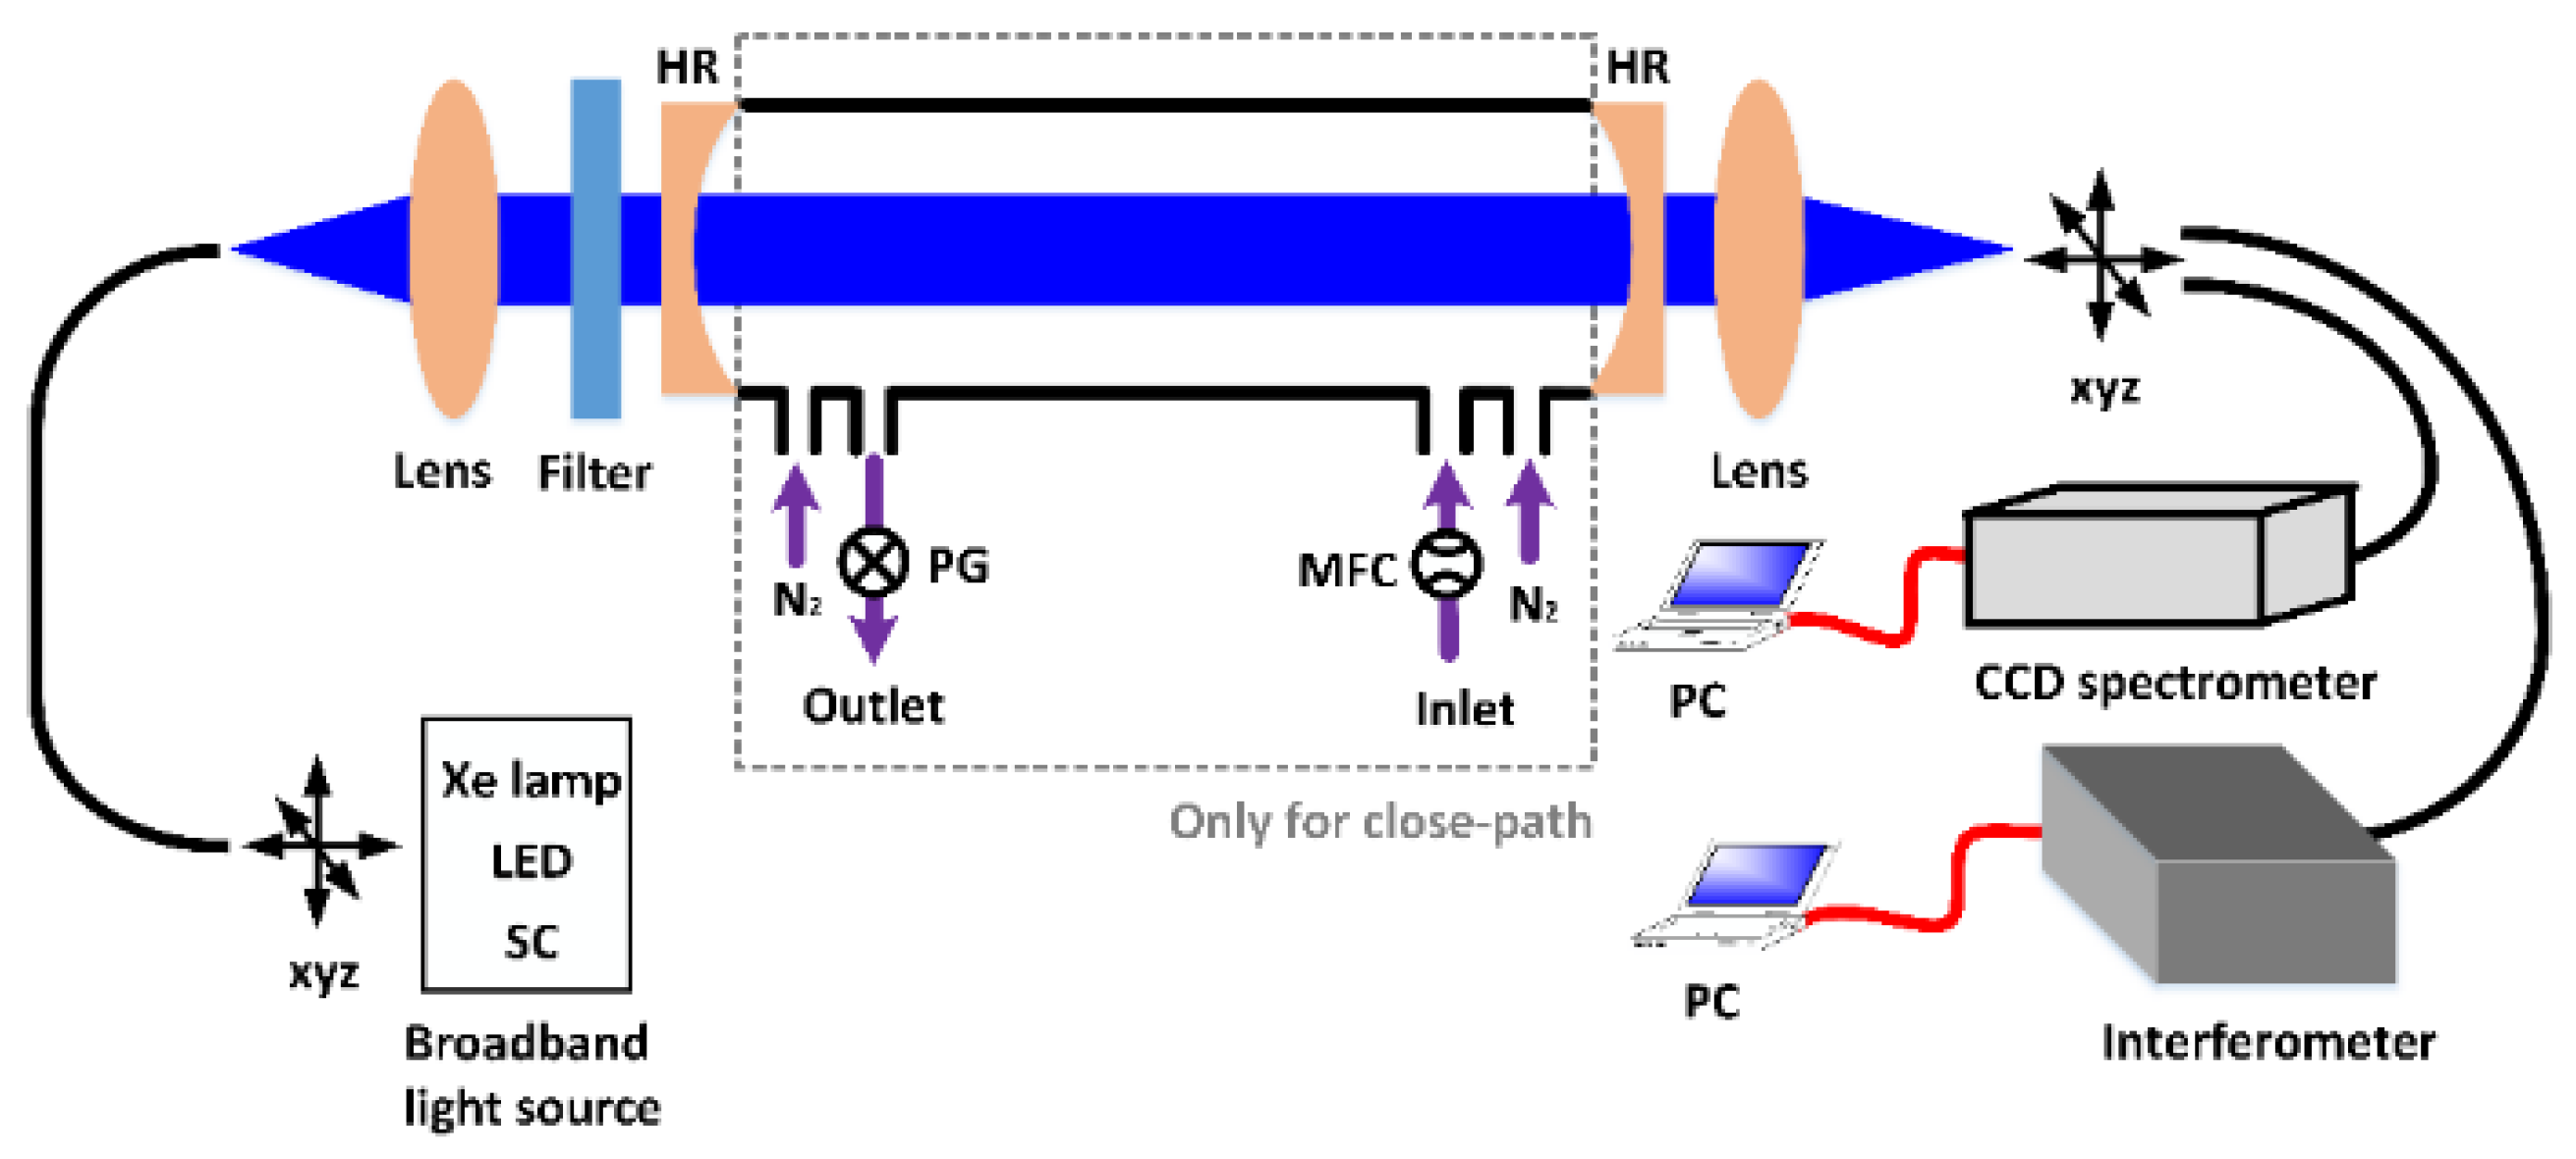
3. Experimental Aspects
3.1. Light Source
3.1.1. Short-Arc Xe Lamp
3.1.2. LED
3.1.3. SC Source
3.2. Cavity Scheme
3.2.1. Closed-Path Configuration
3.2.2. Open-Path Configuration
3.3. Detection Scheme
3.3.1. Dispersive Approach
3.3.2. Interferometric Approach
4. Target Gas Species Performances in Laboratory
4.1. Proof-of-Principle of the IBBCEAS (O2, C10H8, CO2, OCS, HD18O)
4.2. Multiple Target Gas Detection
4.2.1. Simultaneous Detection of NO3 and NO2
4.2.2. Simultaneous Detection of NO3 and N2O5
4.2.3. Simultaneous Detection of HONO and NO2
4.2.4. Simultaneous Detection of CHOCHO and NO2
4.2.5. Simultaneous Detection of I2, IO and OIO
4.3. Single Target Gas Detection
4.3.1. NO3
4.3.2. NO2
4.3.3. HONO
4.3.4. I2
4.3.5. Industrial Pollutants Measurement (C4H6, C4H8O2)
4.3.6. CO2, CH4, C2H2 Measurement
4.3.7. H2O Measurement
5. Target Gas Species in Field Measurement
5.1. Marine Boundary Layer Measurement
5.2. Airborne Measurement
5.3. Urban Environment Measurement
5.4. Suburban Site Measurement
6. Outlook
7. Conclusions
Author Contributions
Funding
Conflicts of Interest
References
- Russell, J.M.; Gordley, L.L.; Park, H.J.; Drayson, S.R.; Hesketh, W.D.; Cicerone, R.J.; Tuck, A.F.; Frederick, J.E.; Harries, J.E.; Crutzen, P.J. The halogen occultation experiment. J. Geophys. Res. 1993, 98, 10777–10797. [Google Scholar] [CrossRef]
- Anthony, K.W.; Daanen, R.; Anthony, P.; Deimling, T.S.V.; Ping, C.L.; Chanton, J P.; Grosse, G. Methane emissions proportional to permafrost carbon thawed in Arctic lakes since the 1950s. Nat. Geosci. 2016, 9, 679–682. [Google Scholar] [CrossRef]
- Miller, C.E.; Brown, L.R.; Toth, R.A. Spectroscopic challenges for high accuracy retrievals of atmospheric CO and the Orbiting Carbon Observatory (OCO) experiment. Comptes Rendus Physique 2005, 6, 876–887. [Google Scholar] [CrossRef]
- Cygan, A.; Wcislo, P.; Wójtewicz, S.; Maslowski, P.; Domyslawska, J.; Trawinski, R.S.; Ciurylo, R.; Lisak, D. Precise cavity enhanced absorption spectroscopy. J. Phys. Conf. Ser. 2014, 548, 012015. [Google Scholar] [CrossRef]
- O’Keefe, A.; Deacon, D.A.G. Cavity ring-down optical spectrometer for absorption measurements using pulsed laser sources. Rev. Sci. Instrum. 1988, 59, 2544–2551. [Google Scholar] [CrossRef]
- Brown, S.S.; Stark, H.; Ciciora, S.J.; Mclaughlin, R.J.; Ravishankara, A.R. Simultaneous in–situ detection of atmospheric NO3 and N2O5 via cavity ring–down spectroscopy. Geophys. Res. Lett. 2001, 28, 3227–3230. [Google Scholar] [CrossRef]
- Awtry, A.R.; Miller, J.H. Development of a cw-laser-based cavity-ringdown sensor aboard a spacecraft for trace air constituents. Appl. Phys. B 2002, 75, 255–260. [Google Scholar] [CrossRef] [PubMed]
- Ayers, J.D.; Apodaca, R.L.; Simpson, W.R.; Baer, D.S. Off–axis cavity ringdown spectroscopy: Application to atmospheric nitrate radical detection. Appl. Opt. 2005, 44, 7239–7242. [Google Scholar] [CrossRef] [PubMed]
- Varma, R.M.; Venables, D.S.; Ruth, A.A.; Heitmann, U.; Schlosser, E.; Dixneuf, S. Long optical cavities for open–path monitoring of atmospheric trace gases and aerosol extinction. Appl. Opt. 2009, 48, 159–171. [Google Scholar] [CrossRef]
- Walsh, A.; Zhao, D.; Ubachs, W.; Linnartz, H. Optomechanical shutter modulated broad–band cavity–enhanced absorption spectroscopy of molecular transients of astrophysical interest. J. Phys. Chem. A 2013, 117, 9363–9369. [Google Scholar] [CrossRef] [PubMed]
- Engeln, R.; Berden, G.; Peeters, R.; Meijer, G. Cavity enhanced absorption and cavity enhanced magnetic rotation spectroscopy. Rev. Sci. Instrum. 1998, 69, 3763–3769. [Google Scholar] [CrossRef]
- Fiedler, S.E.; Hese, A.; Ruth, A.A. Incoherent broad-band cavity-enhanced absorption spectroscopy. Chem. Phys. Lett. 2003, 371, 284–294. [Google Scholar] [CrossRef]
- Platt, U. Modern methods of the measurement of atmospheric trace gases invited lecture. Phys. Chem. Chem. Phys. 1999, 1, 5409–5415. [Google Scholar] [CrossRef]
- Platt, U.; Perner, D. Direct measurements of atmospheric CH2O, HNO2, O3, NO2, SO2 by differential optical absorption in the near UV. J. Geophys. Res. Oceans 1980, 85, 7453–7458. [Google Scholar] [CrossRef]
- Zybin, A.; Kuritsyn, Y.A.; Mironenko, V.R.; Niemax, K. Cavity enhanced wavelength modulation spectrometry for application in chemical analysis. Appl. Phys. B 2004, 78, 103–109. [Google Scholar] [CrossRef]
- O’Keefe, A. Integrated cavity output analysis of ultra-weak absorption. Chem. Phys. Lett. 1998, 293, 331–336. [Google Scholar] [CrossRef]
- Fiedler, S.E.; Hese, A.; Ruth, A.A. Erratum: Incoherent broad–band cavity–enhanced absorption spectroscopy of liquids. Rev. Sci. Instrum. 2003, 76, 023107. [Google Scholar] [CrossRef]
- Fiedler, S.E.; Hese, A.; Heitmann, U. Influence of the cavity parameters on the output intensity in incoherent broadband cavity–enhanced absorption spectroscopy. Rev. Sci. Instrum. 2007, 78, 073104. [Google Scholar] [CrossRef] [PubMed]
- Zhao, W.X.; Xu, X.Z.; Fang, B.; Zhang, Q.L.; Qian, X.D.; Wang, S.; Liu, P.; Zhang, W.J.; Wang, Z.Z.; Liu, D.; et al. Development of an incoherent broad–band cavity–enhanced aerosol extinction spectrometer and its application to measurement of aerosol optical hygroscopicity. Appl. Opt. 2017, 56, E16–E22. [Google Scholar] [CrossRef] [PubMed]
- Fang, B.; Zhao, W.X.; Xu, X.Z.; Zhou, J.C.; Ma, X.; Wang, S.; Zhang, W.J.; Venables, D.S.; Chen, W.D. Portable broadband cavity–enhanced spectrometer utilizing Kalman filtering: Application to real–time, in–situ monitoring of glyoxal and nitrogen dioxide. Opt. Express 2017, 25, 26910–26922. [Google Scholar] [CrossRef] [PubMed]
- Wilbers, A.T.M.; Kroesen, G.M.W.; Timmermans, C.J.; Schram, D.C. The continuum emission of an arc plasma. J. Quant. Spectrosc. Radiat. Transf. 1991, 45, 1–10. [Google Scholar] [CrossRef]
- Ruth, A.A.; Orphal, J.; Fiedler, S.E. Fourier–transform cavity–enhanced absorption spectroscopy using an incoherent broadband light source. Appl. Opt. 2007, 46, 3611–3616. [Google Scholar] [CrossRef] [PubMed]
- Orphal, J.; Ruth, A.A. High-resolution Fourier-transform cavity-enhanced absorption spectroscopy in the near–infrared using an incoherent broad-band light source. Opt. Express 2008, 16, 19232–19243. [Google Scholar] [CrossRef] [PubMed]
- Fiedler, S.E.; Hoheisel, G.; Ruth, A.A.; Hese, A. Incoherent broad-band cavity-enhanced absorption spectroscopy of azulene in a supersonic jet. Chem. Phys. Lett. 2003, 382, 447–453. [Google Scholar] [CrossRef]
- Venables, D.S.; Gherman, T.; Orphal, J.; Wenger, J.C.; Ruth, A.A. High sensitivity in–situ monitoring of NO3 in an atmospheric simulation chamber using incoherent broadband cavity–enhanced absorption spectroscopy. Environ. Sci. Technol. 2006, 40, 6758–6763. [Google Scholar] [CrossRef] [PubMed]
- Vaughan, S.; Gherman, T.; Ruth, A.A.; Orphal, J. Incoherent broad–band cavity–enhanced absorption spectroscopy of the marine boundary layer species I2, IO and OIO. Phys. Chem. Chem. Phys. 2008, 10, 4471–4477. [Google Scholar] [CrossRef] [PubMed]
- Washenfelder, R.A.; Langford, A.O.; Fuchs, H.; Brown, S.S. Measurement of glyoxal using an incoherent broadband cavity enhanced absorption spectrometer. Atmos. Chem. Phys. 2008, 8, 7779–7793. [Google Scholar] [CrossRef]
- Dixneuf, S.; Ruth, A.A.; Vaughan, S.; Varma, R.M. The time dependence of molecular iodine emission from Laminaria digitate. Atmos. Chem. Phys. 2008, 8, 823–829. [Google Scholar]
- Nitschke, U.; Ruth, A.A.; Dixneuf, S.; Stengel, D.B. Molecular iodine emission rates and photosynthetic performance of different thallus parts of Laminaria digitata (Phaeophyceae) during emersion. Planta 2011, 233, 737–748. [Google Scholar] [CrossRef] [PubMed]
- Chen, J.; Venables, D.S. A broadband optical cavity spectrometer for measuring weak near–ultraviolet absorption spectra of gases. Atmos. Meas. Tech. 2010, 3, 425–436. [Google Scholar] [CrossRef]
- Chen, J.; Wenger, J.C.; Venables, D.S. Near–ultraviolet absorption cross sections of nitrophenols and their potential influence on tropospheric oxidation capacity. J. Phys. Chem. A 2011, 115, 12235–12242. [Google Scholar] [CrossRef] [PubMed]
- Ashu–Ayem, E.R.; Nitschke, U.; Monahan, C.; Chen, J.; Darby, S.B.; Smith, P.D.; O’Dowd, C.D.; Stengel, D.B.; Venables, D.S. Coastal iodine emissions. 1. Release of I2 by Laminaria digitata in chamber experiments. Environ. Sci. Technol. 2012, 46, 10413–10421. [Google Scholar] [CrossRef] [PubMed]
- Cui, X.J.; Lengignon, C.; Wu, T.; Zhao, W.X.; Wysocki, G.; Fertein, E.; Coeur, C.; Cassez, A.; Croize, L.; Chen, W.D.; et al. Photonic sensing of the atmosphere by absorption spectroscopy. J. Quant. Spectrosc. Radiat. Transf. 2012, 113, 1300–1316. [Google Scholar] [CrossRef]
- Ball, S.M.; Langridge, J.M; Jones, R.L. Broadband cavity enhanced absorption spectroscopy using light emitting diodes. Chem. Phys. Lett. 2004, 398, 68–74. [Google Scholar] [CrossRef]
- Denzer, W.; Hamilton, M.L.; Hancock, G.; Islam, M.; Langley, C.E.; Peverall, R.; Ritchie, G.A.D. Near-infrared broad-band cavity enhanced absorption spectroscopy using a superluminescent light emitting diode. Analyst 2009, 134, 2220–2223. [Google Scholar] [CrossRef] [PubMed]
- Denzer, W.; Hancock, G.; Islam, M.; Langley, C.E.; Peverall, R.; Ritchie, G.A.D.; Taylor, D. Trace species detection in the near infrared using Fourier transform broadband cavity enhanced absorption spectroscopy: Initial studies on potential breath analytes. Analyst 2011, 136, 801–806. [Google Scholar] [CrossRef] [PubMed]
- Udem, T.; Holzwarth, R.; Hänsch, T.W. Optical frequency metrology. Encyclopedia Mater. Sci. Technol. 2005, 416, 233–237. [Google Scholar]
- Kasparian, J.; Rodriguez, M.; Méjean, G.; Yu, J.; Salmon, E.; Wille, H.; Bourayou, R.; Frey, S.; Andre, Y.B.; Mysyrowicz, A.; et al. White-light filaments for atmospheric analysis. Science 2003, 301, 61–64. [Google Scholar] [CrossRef] [PubMed]
- Sfeir, M.Y.; Wang, F.; Huang, L.; Chuang, C.C.; Hone, J.; O’brien, S.P.; Heinz, T.F.; Brus, L.E. Probing electronic transitions in individual carbon nanotubes by Rayleigh scattering. Science 2004, 306, 1540–1543. [Google Scholar] [CrossRef] [PubMed]
- Unterhuber, A.; Povazay, B.; Bizheva, K.; Hermann, B.; Sattmann, H.; Stingl, A.; Le, T.; Seefeld, M.; Menzel, R.; Preusser, M. Advances in broad bandwidth light sources for ultrahigh resolution optical coherence tomography. Phys. Med. Biol. 2004, 49, 1235–1246. [Google Scholar] [CrossRef] [PubMed]
- Jia, S.J.; Yao, C.F.; Zhao, Z.P.; Jia, Z.X.; Qin, G.S.; Ohishi, Y.; Qin, W.P. Flat supercontinuum generation from 1028–2804 nm in an all-solid fluorotellurite fiber. Laser Phys. Lett. 2018, 15, 115104–115108. [Google Scholar] [CrossRef]
- Langridge, J.M.; Laurila, T.; Watt, R.S.; Jones, R.L.; Kaminski, C.F.; Hult, J. Cavity enhanced absorption spectroscopy of multiple trace gas species using a supercontinuum radiation source. Opt. Express 2008, 16, 10178–10188. [Google Scholar] [CrossRef] [PubMed]
- Ruth, A.A.; Dixneuf, S.; Orphal, J. Laser-induced plasmas in ambient air for incoherent broadband cavity–enhanced absorption spectroscopy. Opt. Express 2015, 23, 6092–6101. [Google Scholar] [CrossRef] [PubMed]
- Wang, H.C.; Chen, J.; Lu, K.D. Development of a portable cavity-enhanced absorption spectrometer for the measurement of ambient NO3 and N2O5: Experimental set-up, lab characterizations, and field applications in a polluted urban environment. Atmos. Meas. Tech. 2017, 10, 1465–1479. [Google Scholar] [CrossRef]
- Ling, L.Y.; Xie, P.H.; Lin, P.P.; Huang, Y.R.; Qin, M.; Duan, J.; Hu, R.Z.; Wu, F.C. A concentration retrieval method for incoherent broadband cavity–enhanced absorption spectroscopy based on O2-O2 absorption. Acta Phys. Sin. 2015, 64, 82–88. [Google Scholar]
- Fuchs, H.; Ball, S.M.; Bohn, B.; Brauers, T.; Cohen, R.C.; Dorn, H.P.; Dube, W.P.; Fry, J.L.; Haseler, R.; Heitmann, U.; et al. Intercomparison of measurements of NO2 concentrations in the atmosphere simulation chamber SAPHIR during the NO3Comp campaign. Atmos. Meas. Tech. 2009, 2, 21–37. [Google Scholar]
- Wu, T.; Chen, W.; Fertein, E.; Cazier, F.; Dewaele, D.; Gao, X. Development of an open–path incoherent broadband cavity-enhanced spectroscopy based instrument for simultaneous measurement of HONO and NO2, in ambient air. Appl. Phys. B 2012, 106, 501–509. [Google Scholar] [CrossRef]
- Ruth, A.A.; Dixneuf, S.; Raghunandan, R. Broadband Cavity–Enhanced Absorption Spectroscopy with Incoherent Light. In Cavity-Enhanced Spectroscopy and Sensing; Gagliardi, G., Loock, H.P., Eds.; Springer: Berlin/Heidelberg, Germany, 2014; Volume 179. [Google Scholar]
- Fiddler, M.N.; Begashaw, I.; Mickens, M.A.; Collingwood, M.S.; Assefa, Z.; Bililign, S. Laser spectroscopy for atmospheric and environmental sensing. Sensors 2009, 9, 10447–10512. [Google Scholar] [CrossRef] [PubMed]
- Ventrillard-Courtillot, I.; O’Brien, E.S.; Kassi, S.; Méjean, G.; Romanini, D. Incoherent broad-band cavity-enhanced absorption spectroscopy for simultaneous trace measurements of NO2, and NO3 with a LED source. Appl. Phys. B 2010, 101, 661–669. [Google Scholar] [CrossRef]
- Wu, T.; Coeur-Tourneurb, C.; Dhont, G.; Cassez, A.; Fertein, E.; He, X.D.; Chen, W.D. Simultaneous monitoring of temporal profiles of NO3, NO2, and O3, by incoherent broadband cavity enhanced absorption spectroscopy for atmospheric applications. J. Quant. Spectrosc. Radiat. Transf. 2014, 133, 199–205. [Google Scholar] [CrossRef]
- Kennedy, O.J.; Ouyang, B.; Langridge, J.M.; Daniels, M.J.S.; Bauguitte, S.; Freshwater, R.; McLeod, M.W.; Ironmonger, C.; Sendall, J.; Norris, O.; et al. An aircraft based three channel broadband cavity enhanced absorption spectrometer for simultaneous measurements of NO3, N2O5 and NO2. Atmos. Meas. Tech. 2011, 4, 1759–1776. [Google Scholar] [CrossRef]
- Gherman, T.; Venables, D.S.; Vaughan, S.; Orphal, J.; Ruth, A.A. Incoherent broadband cavity-enhanced absorption spectroscopy in the near-ultraviolet: Application to HONO and NO2. Environ. Sci. Technol. 2008, 42, 890–895. [Google Scholar] [CrossRef] [PubMed]
- Wu, T.; Zha, Q.Z.; Chen, W.D.; Zheng, X.; Wang, T.; He, X.D. Development and deployment of a cavity enhanced UV–LED spectrometer for measurements of atmospheric HONO and NO2, in Hong Kong. Atmos. Environ. 2014, 95, 544–551. [Google Scholar] [CrossRef]
- Duan, J.; Qin, M.; Fang, W.; Ling, L.Y.; Hu, R.Z.; Lu, X.; Shen, L.L.; Wang, D.; Xie, P.H.; Liu, J.G.; et al. Incoherent broadband cavity enhanced absorption spectroscopy for measurements of atmospheric HONO. Acta Phys. Sin. 2015, 64, 222–229. [Google Scholar]
- Langridge, J.M.; Ball, S.M.; Shillings, A.J.L.; Jones, R.L. A broadband absorption spectrometer using light emitting diodes for ultrasensitive, in-situ trace gas detection. Rev. Sci. Instrum. 2008, 79, 123110. [Google Scholar] [CrossRef] [PubMed]
- Triki, M.; Cermak, P.; Méjean, G.; Romanini, D. Cavity-enhanced absorption spectroscopy with a red LED source for NOx, trace analysis. Appl. Phys. B 2008, 91, 195–201. [Google Scholar] [CrossRef]
- Langridge, J.M.; Ball, S.M.; Jones, R.L. A compact broadband cavity enhanced absorption spectrometer for detection of atmospheric NO2 using light emitting diodes. Analyst 2006, 131, 916–922. [Google Scholar] [CrossRef] [PubMed]
- Wu, T.; Zhao, W.X.; Li, J.S.; Zhang, W.J.; Chen, W.D.; Gao, X.M. Incoherent broadband cavity enhanced absorption spectroscopy based on LED. Spectrosc. Spect. Anal. 2008, 28, 2469–2472. [Google Scholar]
- Wu, T.; Zhao, W.X.; Chen, W.D.; Zhang, W.J.; Gao, X.M. Incoherent broadband cavity enhanced absorption spectroscopy for in–situ measurements of NO2 with a blue light emitting diode. Appl. Phys. B 2009, 94, 85–94. [Google Scholar] [CrossRef]
- Ling, L.Y.; Xie, P.H.; Qin, M.; Fang, W.; Jiang, Y.; Hu, R.Z.; Zheng, N.N. In-situ measurements of atmospheric NO2 using incoherent broadband cavity–enhanced absorption spectroscopy with a blue light-emitting diode. Chin. Opt. Lett. 2013, 11, 77–80. [Google Scholar] [CrossRef]
- Liang, S.X.; Qin, M.; Duan, J.; Fang, W.; Li, A.; Xu, J.; Lu, X.; Tang, K.; Xie, P.H.; Liu, J.G.; et al. Airborne cavity enhanced absorption spectroscopy for high time resolution measurements of atmospheric NO2. Acta Phys. Sin. 2017, 66, 74–81. [Google Scholar]
- Nakashima, Y.; Sadanaga, Y. Validation of in–situ Measurements of Atmospheric Nitrous Acid Using Incoherent Broadband Cavity-enhanced Absorption Spectroscopy. Anal. Sci. 2017, 33, 519–524. [Google Scholar] [CrossRef] [PubMed]
- Johansson, O.; Mutelle, H.; Parker, A.E.; Batut, S.; Demaux, P.; Schoemaecker, C.; Fittschen, C. Quantitative IBBCEAS measurements of I2 in the presence of aerosols. Appl. Phys. B 2014, 114, 421–432. [Google Scholar] [CrossRef]
- Chandran, S.; Varma, R. Near infrared cavity enhanced absorption spectra of atmospherically relevant ether-1, 4-Dioxane. Spectrochim. Acta A 2015, 153, 704–708. [Google Scholar] [CrossRef] [PubMed]
- Ruth, A.A. Hochauflösende optische Absorptionsspektroskopie: Cavity-Ring-Down-Spektroskopie. Physikalische Blätter 2015, 55, 47–49. [Google Scholar] [CrossRef]
- Yi, H.M.; Wu, T.; Wang, G.S.; Zhao, W.X.; Fertein, E.; Coeur, C.; Gao, X.X.; Zhang, W.J.; Chen, W.D. Sensing atmospheric reactive species using light emitting diode by incoherent broadband cavity enhanced absorption spectroscopy. Opt. Express 2016, 24, A781–A790. [Google Scholar] [CrossRef] [PubMed]
- Zheng, K.Y.; Zheng, C.T.; He, Q.X.; Yao, D.; Hu, L.E.; Zhang, Y.; Wang, Y.D.; Tittel, F.K. Near-infrared acetylene sensor system using off-axis integrated-cavity output spectroscopy and two measurement schemes. Opt. Express 2018, 26, 26205–26216. [Google Scholar] [CrossRef]
- Monks, P.S. Gas-phase radical chemistry in the troposphere. Chem. Soc. Rev. 2005, 34, 376–395. [Google Scholar] [CrossRef] [PubMed]
- Zheng, K.Y.; Zheng, C.T.; Liu, Z.D.; He, Q.X.; Du, Q.L.; Zhang, Y.; Wang, Y.D.; Tittel, F.K. Near-infrared broadband cavity-enhanced sensor system for methane detection using a wavelet-denoising assisted Fourier-transform spectrometer. Analyst 2018, 143, 4699–4706. [Google Scholar] [CrossRef] [PubMed]
- Zheng, C.T.; Ye, W.L.; Sanchez, N.P.; Li, C.G.; Dong, L.; Wang, Y.D.; Griffin, R.J.; Tittel, F.K. Development and field deployment of a mid-infrared methane sensor without pressure control using interband cascade laser absorption spectroscopy. Sens. Actuators B Chem. 2017, 244, 365–372. [Google Scholar] [CrossRef]
- Huisman, A.J.; Hottle, J.R.; Galloway, M.M.; DiGangi, J.P.; Coens, K.L.; Choi, W.; Faloona, I.C.; Gilman, J.B.; Kuster, W.C.; de Gouw, J.; et al. Photochemical modeling of glyoxal at a rural site: Observations and analysis from BEARPEX 2007. Atmos. Chem. Phys. 2011, 11, 8883–8897. [Google Scholar] [CrossRef]
- Fu, T.M.; Jacob, D.J.; Wittrock, F.; Burrows, J.P.; Vrekoussis, M.; Henze, D.K. Global budgets of atmospheric glyoxal and methylglyoxal, and implications for formation of secondary organic aerosols. J. Geophys. Res. Atmos. 2008, 113, D15. [Google Scholar] [CrossRef]
- Volkamer, R.; Martini, F.S.; Molina, L.T.; Salcedo, D.; Jimenez, J.L.; Molina, M.J. A missing sink for gas-phase glyoxal in Mexico City: Formation of secondary organic aerosol. Geophys. Res. Lett. 2007, 34, 255–268. [Google Scholar] [CrossRef]
- Chameides, W.L.; Davis, D.D. Iodine: Its possible role in tropospheric photochemistry. J. Geophys. Res. Oceans 1980, 85, 7383–7398. [Google Scholar] [CrossRef]
- Vogt, R.; Sander, R.; Glasow, R.V.; Crutzen, P.J. Iodine chemistry and its role in halogen activation and ozone loss in the marine boundary layer: A model study. J. Atmos. Chem. 1999, 32, 375–395. [Google Scholar] [CrossRef]
- Allan, B.J.; McFiggans, G.; Plane, J.M.C.; Coe, H. Observations of iodine monoxide in the remote marine boundary layer. J. Geophys. Res. 2000, 105, 14363–14369. [Google Scholar] [CrossRef]
- Carpenter, L.J. Iodine in the marine boundary layer. Chem. Rev. 2003, 103, 4953. [Google Scholar] [CrossRef] [PubMed]
- Saiz-Lopez, A.; Plane, J.M.C. Recent applications of differential optical absorption spectroscopy: Halogen chemistry in the lower troposphere. J. Phys. IV 2004, 121, 223–238. [Google Scholar] [CrossRef]
- Mcfiggans, G.; Plane, J.M.C.; Allan, B.J.; Carpenter, L.J.; Coe, H.; O’Dowd, C. A modeling study of iodine chemistry in the marine boundary layer. J. Geophys. Res. Atmos. 2000, 105, 14371–14385. [Google Scholar] [CrossRef]
- O’Dowd, C.D.; Jimenez, J.L.; Bahreini, R.; Flagan, R.C.; Seinfeld, J.H.; Hämeri, K.; Pirjola, L.; Kulmala, M.; Jennings, S.G.; Hoffmann, T. Marine aerosol formation from biogenic iodine emissions. Nature 2002, 417, 632–636. [Google Scholar] [CrossRef] [PubMed]
- O’Dowd, C.D.; Yoon, Y.J.; Junkerman, W.; Aalto, P.; Kulmala, M.; Lihavainen, H.; Viisanen, Y. Airborne measurements of nucleation mode particles I: Coastal nucleation and growth rates. Atmos. Chem. Phys. 2007, 7, 1491–1501. [Google Scholar] [CrossRef]
- Pirjola, L.; O’Dowd, C.D.; Yoon, Y.J.; Sellegri, K. Modelling iodine particle formation and growth from seaweed in a chamber. Environ. Chem. 2006, 2, 271–281. [Google Scholar] [CrossRef]
- Saiz-Lopez, A.; Plane, J.M.C.; Mcfiggans, G.; Williams, P.I.; Ball, S.M.; Bitter, M.; Jones, R.L.; Hongwei, C.; Hoffmann, T. Modelling molecular iodine emissions in a coastal marine environment: The link to new particle formation. Atmos. Chem. Phys. 2006, 6, 883–895. [Google Scholar] [CrossRef]
- Saunders, R.W.; Kumar, R.; Gómez Martín, J.C.; Mahajan, A.S.; Murray, B.J.; Plane, J.M.C. Studies of the formation and growth of aerosol from molecular iodine precursor. Int. J. Res. Phys. Chem. Chem. Phys. 2010, 224, 1095–1117. [Google Scholar] [CrossRef]
- Sellegri, K.; Yoon, Y.J.; Jennings, S.G.; O’Dowd, C.D.; Pirjola, L.; Cautenet, S.; Chen, H.W.; Hoffmann, T. Quantification of coastal new ultra–fine particles formation from in-situ and chamber measurements during the BIOFLUX campaign. Environ. Chem. 2006, 2, 260–270. [Google Scholar] [CrossRef]
- Reeser, D.I.; Kwamena, N.O.A.; Donaldson, D.J. Effect of organic coatings on gas–phase Nitrogen dioxide production from aqueous nitrate photolysis. J. Phys. Chem. C 2013, 117, 22260–22267. [Google Scholar] [CrossRef]
- Alfonso, S.; Plane, J.M.C. Novel iodine chemistry in the marine boundary layer. Geophys. Res. Lett. 2004, 31, 235–250. [Google Scholar]
- Shirey, R.E.; Linton, C.M. The extraction and analysis of 1,4-dioxane from water using solid–phase microextraction coupled with gas chromatography and gas chromatography-mass spectrometry. J. Chromatogr. Sci. 2006, 44, 444–450. [Google Scholar] [CrossRef] [PubMed]
- Nishimura, T.; Iizuka, S.; Kibune, N.; Ando, M.; Magara, Y. Study of 1,4-Dioxane Intake in the Total Diet. J. Health Sci. 2004, 51, 514–517. [Google Scholar] [CrossRef]
- Aalto, A.; Genty, G.; Laurila, T.; Toivonen, J. Incoherent broadband cavity enhanced absorption spectroscopy using supercontinuum and superluminescent diode sources. Opt. Express 2015, 23, 25225–25234. [Google Scholar] [CrossRef] [PubMed]
- Amiot, C.; Aalto, A.; Ryczkowski, P.; Toivonen, J.; Genty, G. Cavity enhanced absorption spectroscopy in the mid–infrared using a supercontinuum source. Appl. Phys. Lett. 2017, 111, 061103. [Google Scholar] [CrossRef]
- Watt, R.S.; Laurila, T.; Kaminski, C.F.; Hult, J. Cavity enhanced spectroscopy of high-temperature H2O in the near–infrared using a supercontinuum light source. Appl. Spectrosc. 2009, 63, 1389–1395. [Google Scholar] [CrossRef] [PubMed]
- Nakashima, Y.; Sadanaga, Y.; Saito, S.; Hoshi, J.; Ueno, H. Contributions of vehicular emissions and secondary formation to nitrous acid concentrations in ambient urban air in Tokyo in the winter. Sci. Total Environ. 2017, 592, 178–186. [Google Scholar] [CrossRef] [PubMed]
- Räikkönen, E.; Kaivola, M.; Buchter, S. Compact supercontinuum source for the visible using gain–switched Ti: Sapphire laser as pump. J. Eur. Opt. Soc. Rapid 2006, 1, 06012–06015. [Google Scholar] [CrossRef]
- Reeves, W.H.; Skryabin, D.V.; Biancalana, F.; Knight, J.C.; Russell, P.S.J.; Omenetto, F.G.; Efimov, A.; Taylor, A.J. Transformation and control of ultra–short pulses in dispersion-engineered photonic crystal fibres. Nature 2003, 424, 511–515. [Google Scholar] [CrossRef] [PubMed]
- Johnston, P.S.; Lehmann, K.K. Cavity enhanced absorption spectroscopy using a broadband prism cavity and a supercontinuum source. Opt. Express 2008, 16, 15013–15023. [Google Scholar] [CrossRef] [PubMed]
- Lee, B.; Lehmann, K.; Taylor, J.; Yalin, A. A high-finesse broadband optical cavity using calcium fluoride prism retroreflectors. Opt. Express 2014, 22, 11583–11591. [Google Scholar] [CrossRef] [PubMed]
- Kudlinski, A.; George, A.K.; Knight, J.C.; Travers, J.C.; Rulkov, A.B.; Popov, S.V.; Taylor, J.R. Zero-dispersion wavelength decreasing photonic crystal fibers for ultraviolet–extended supercontinuum generation. Opt. Express 2006, 14, 5715–5722. [Google Scholar] [CrossRef] [PubMed]
- Xia, C.A.; Kumar, M.; Cheng, M.Y.; Hegde, R.S.; Islam, M.N.; Galvanauskas, A.; Winful, H.G.; Terry, F.L.; Freeman, M.J.; Poulain, M.; et al. Power scalable mid-infrared supercontinuum generation in ZBLAN fluoride fibers with up to 1.3 watts time-averaged power. Opt. Express 2007, 15, 865–871. [Google Scholar] [CrossRef] [PubMed]
- Kilgus, J.; Duswald, K.; Langer, G.; Brandstetter, M. Mid-Infrared Standoff Spectroscopy Using a Supercontinuum Laser with Compact Fabry–Pérot Filter Spectrometers. Appl. Spectrosc. 2018, 72, 634–642. [Google Scholar] [CrossRef] [PubMed]


| Items | Classification | Reference | Advantages | Disadvantages |
|---|---|---|---|---|
| Light Source | Short-arc Xe lamp | Fiedler et al. (2003) | high spectral brightness; | intensity fluctuations; |
| Ashu-Ayem et al. (2012) | broad spectral region; | high energy consumption; | ||
| LED | Wu et al. (2009) | high brightness, low power consumption; | sensitive to temperature and current fluctuations; | |
| Wang et al. (2017) | narrow full width at half maximum (FWHM); | |||
| SC source | Chandran et al. (2016) | high power density and broadband wavelength coverage; | unstable in a long acquisition periods and costly | |
| Cavity Scheme | Closed-path | Gherman et al. (2008) | enabling the design of a portable system with good mechanical stability and compactness; | wall losses for different target species; |
| Amiot et al. (2017) | ||||
| Open-path | Varma et al. (2009) | simple calibration procedure; | at a high aerosol concentration levels, | |
| Ling et al. (2013) | free from wall loss of target species; | the concentration retrieval is challenging; | ||
| Nakashim et al. (2017) | arbitrarily extended cavity length; | a reference spectrum I0 is not available; | ||
| Detection Scheme | dispersive approaches | Kennedy et al. (2011) | rapid detection over a wide wavelength range with a multi-channel detector; | low spectral resolution of ~0.1 nm and ~1 nm; |
| Liang et al. (2017) | ||||
| interferometric approaches | Orphal et al. (2008) | high resolution and sensitivity of ~0.02 cm−1 and ~4 cm−1 from VIS to near-IR range; | long acquisition time; | |
| Denzer et al. (2011) | not compact and costly; |
| Species Measured | Light Source | Reflectivity (%) (Radius of Curvature) | Cavity Length (m) | Spectral Resolution (nm) | Minimum Detection Limit (Acquiring Time) | Retrieval Range (nm) | Ref. |
|---|---|---|---|---|---|---|---|
| NO3, NO2 | Xe lamp | 99.99 (5 m) | 4.62 | 0.3 | NO3 (4 pptv) NO2 (10 ppbv) (57 s) | 645–675 | [25] |
| Xe lamp | 99.9 (21 m) | 20 | 0.6 | NO3 (2 pptv) NO2 (2 pptv) (5 s) | 630–690 | [9] | |
| Red-LED | 99.98 (1 m) | 0.5 | 2.3 | NO3 (2 pptv) NO2 (600 pptv) (400 s) | 610–640 | [50] | |
| Red-LED | 99.98 (2 m) | 2 | 0.77 | NO3 (7.9 pptv) NO2 (9 ppbv) (60 s) | 638–672 | [51] | |
| NO3, N2O5 | Red-LED | 99.99 (6 m) | 0.94 | 0.9 | NO3 (1.1 pptv) N2O5 (2.4 pptv) (850 s) | 615–706 | [52] |
| Red-LED | 99.99 (1 m) | 0.5 | 0.85 | NO3 (2.4 pptv) N2O5 (2.7 pptv) (1 s) | 640–680 | [44] | |
| HONO, NO2 | UV-LED | 99.85 (not available) | 1.15 | 0.35 | HONO (~4 ppbv) NO2 (~14 ppbv) (20 s) | 360–380 | [53] |
| 4.5 | 0.5 | HONO (~0.13 ppbv) NO2 (~0.38 ppbv) (10 min) | 360–380 | ||||
| UV-LED | 99.97 (2 m) | 1.85 | 0.77 | HONO (~430 pptv) NO2 (~1 ppbv) (90 s) | 358–378 | [47] | |
| UV-LED | 99.9 (2 m) | 1.76 | 0.53 | HONO (~0.3 ppbv) NO2 (~1 ppbv) (120 s) | 353–376 | [54] | |
| UV-LED | 99.99 (not available) | 0.55 | 0.5 | HONO (~0.22 ppbv) NO2 (~0.45 ppbv) (320 s) | 359–387 | [55] | |
| CHOCHO, NO2 | Xe lamp | 99.9966 (1 m) | 0.944 | 0.54 | CHOCHO (29 pptv) NO2 (30 pptv) (60 s) | 404–532 | [27] |
| Blue-LED | 99.98 (not available) | 0.42 | 0.35 | CHOCHO (8 pptv) NO2 (40 pptv) (21 s) | 440–480 | [20] | |
| I2, IO, OIO | Xe lamp | 99.99 (2m) | 1.45 | 0.4 | I2 (26 pptv,60 s) OIO (45 pptv, 5 s) | 525–555 | [26] |
| 99.98 (10m) | 0.2 | IO (210 pptv, 60 s) | 420–460 | ||||
| Xe lamp | 99.97 (not available) | 1.99 | 0.96 | I2 (not available) OIO (not available) | 520–560 | [32] | |
| IO (not available) | 420–460 | ||||||
| NO3 | Red-LED | 99.995 (6 m) | 1.9 | 0.45 | NO3 (2.5 pptv) (516 s) | 652–672 | [34] |
| Red-LED | 99.99 (1 m) | 1.1 | 0.38 | NO3 (0.25 pptv) | 651–672 | [56] | |
| SC | 99.995 (1 m) | 1.15 | 0.3 | NO3 (3 pptv) (3σ) | 640–675 | [42] | |
| NO2 | Green-LED | 99.99 (6 m) | 1.5 | 0.09 | NO2 (64.8 ± 0.7 ppbv) (500 s) | 540–580 | [34] |
| Red-LED | 99.92 (0.5 m) | 0.5 | 1.85 | NO2 (<10 ppbv) (1 s) | 615–655 | [57] | |
| Blue-LED | 99.976 (6 m) | 1.5 | 0.33 | NO2 (100 pptv) (60 s) | 441–462 | [58] | |
| Blue-LED | 99.7 (1 m) | 0.925 | 0.89 | NO2 (3.1–4.7 ppbv) (60 s) | 472–480 | [59] | |
| Blue-LED | 99.7 (1 m) | 0.975 | 0.9 | NO2 (2.2 ppbv) (100 s) | 450–490 | [60] | |
| Blue-LED | 99.9 (1.5 m) | 0.7 | 0.3 | NO2 (9.6 ppbv) (90 s) | 444–468 | [61] | |
| Blue-LED | 99.985 (6 m) | 1 | 0.5 | NO2 (95 pptv) (2 s) | 450–470 | [62] | |
| Blue-LED | 99.99 (6 m) | 0.94 | 0.4 | NO2 (5 pptv) (1748 s) | 410–482 | [52] | |
| HONO | UV-LED | 99.985 (not available) | 1 | 0.5 | HONO (~0.2 ppbv) (5 min) | 360–375 | [63] |
| I2 | Green-LED | 99.99 (6 m) | 1.5 | 0.09 | I2 (991 ± 11 pptv) (300 s) | 530–565 | [34] |
| Green-LED | 99.99 (1 m) | 0.5 | 0.5 | I2 (0.04 nmol/L, ~1 ppbv) | 500–550 | [64] | |
| C4H6 | SLED | 99.98 (not available) | 0.25 | 1.8 cm−1 | dispersive spectrometer (6.1 × 10⁻⁸ cm−1) | 1620–1700 | [35] |
| 0.5 cm−1 | FTS (1.5 × 10⁻⁸ cm−1) | ||||||
| C4H8O2 | SC | 99.9 (6 m) | 6.44 | 0.08 cm−1 | 8 × 10⁻⁸ cm−1 (~200 pptv, 120 min) | 1215–1700 | [65] |
| Wavelength Range (nm) | Effective Optical Path Length (m) | Minimum Limit Detection (pptv) | Dynamic Range (pptv) | Ref. |
|---|---|---|---|---|
| 628–688 | 2000 | 4 | Not stated | [25] |
| 630–690 | 2000 | 2 | Not stated | [9] |
| 610–640 | 25,000 | 2 | Not stated | [50] |
| 638–672 | 22,000 | 7.9 | 0–185 | [51] |
| 645–680 | 9400 | 1.1 | Not stated | [52] |
| 640–680 | 5000 | 2.4 | 0–64 | [44] |
| 652–672 | 38,000 | 2.5 | 0–43 | [34] |
| 651–672 | 11,000 | 0.25 | Not stated | [56] |
| 640–675 | 19,200 | 1 | 0–38 | [42] |
| Different Platforms | Light Source | Gas | Location | Date | Duration | Average Concentration | Measured Concentration Range | Minimum Detection Limit | Temporal Resolution | R2 * | Ref. |
|---|---|---|---|---|---|---|---|---|---|---|---|
| Marine boundary layer | Red-LED | NO2, NO3, N2O5 | Brittany, France | September 2006 | 15 h | Not stated | NO3 (above 1 ppbv) | NO3 (0.25 pptv) | 10 s | Not stated | [56] |
| Aircraft | Red-LED | NO2, NO3, N2O5 | North Sea and Thames Estuary, UK | July 2010 | 5 h | Not stated | NO3 (<2–200 pptv) N2O5 (<2–600 pptv) NO2 (<0.05–12 ppbv) | NO3 (1.1pptv) N2O5 (2.4 pptv) NO2 (5 pptv) | NO3 (1.2 s) N2O5 (8 s) NO2 (1 s) | 0.99 | [52] |
| Blue-LED | NO2 | Anhui, China | March 2016 | 36 h | ~11.98 ppbv | 4–31 ppbv | NO2 (95 pptv) | 2 s | 0.86 | [62] | |
| Urban site | Red-LED | NO3, N2O5 | Beijing, China | February, May 2016 | 7 days | Not stated | NO3 + N2O5 (1 ppbv) NO3 (up to 50 pptv) | NO3 (2.4 pptv) N2O5 (2.7 pptv) | 1 s | Not stated | [44] |
| Blue-LED | NO2 | Cambridge, UK | October 2006 | 38 h | Not stated | 3–34 ppbv | NO2 (100 pptv) | 60 s | 0.9982 | [58] | |
| Blue-LED | NO2 | Anhui, China | May 2012 | 7 days | Not stated | 1–35 ppbv | NO2 (9.6 ppbv) | 90 s | 0.983 | [61] | |
| UV-LED | HONO, NO2 | Anhui, China | March 2014 | 3 days | HONO (0.68 ppbv) NO2 (14 ppbv) | HONO (<0.22–3.49 ppbv) NO2 (2.86–51.6 ppbv) | HONO (0.22 ppbv) NO2 (0.45 ppbv) | 20 min | HONO (0.917) NO2 (0.937) | [55] | |
| UV-LED | HONO | Tokyo, Japan | January 2016 | 21days | 1.5 ± 1.1 ppbv | 0.2–7.1 ppbv | HONO (0.2 ppbv) | 20 min | 0.94 | [63] | |
| Suburban site | UV-LED | HONO, NO2 | Tung Chung, Hong Kong | May 2012 | 2 days | Not stated | HONO (up to~2 ppbv) | HONO (0.3 ppbv) | 2 min | HONO (0.7) | [54] |
| Blue-LED | NO2, CHOCHO | PRD and YRD regions, China | August 2017 | 3 days | Not stated | NO2 (2–15 ppbv) CHOCHO (<28–180 pptv) | NO2 (40 pptv) CHOCHO (8 pptv) | 21 s | Not stated | [20] |
© 2018 by the authors. Licensee MDPI, Basel, Switzerland. This article is an open access article distributed under the terms and conditions of the Creative Commons Attribution (CC BY) license (http://creativecommons.org/licenses/by/4.0/).
Share and Cite
Zheng, K.; Zheng, C.; Zhang, Y.; Wang, Y.; Tittel, F.K. Review of Incoherent Broadband Cavity-Enhanced Absorption Spectroscopy (IBBCEAS) for Gas Sensing. Sensors 2018, 18, 3646. https://doi.org/10.3390/s18113646
Zheng K, Zheng C, Zhang Y, Wang Y, Tittel FK. Review of Incoherent Broadband Cavity-Enhanced Absorption Spectroscopy (IBBCEAS) for Gas Sensing. Sensors. 2018; 18(11):3646. https://doi.org/10.3390/s18113646
Chicago/Turabian StyleZheng, Kaiyuan, Chuantao Zheng, Yu Zhang, Yiding Wang, and Frank K. Tittel. 2018. "Review of Incoherent Broadband Cavity-Enhanced Absorption Spectroscopy (IBBCEAS) for Gas Sensing" Sensors 18, no. 11: 3646. https://doi.org/10.3390/s18113646
APA StyleZheng, K., Zheng, C., Zhang, Y., Wang, Y., & Tittel, F. K. (2018). Review of Incoherent Broadband Cavity-Enhanced Absorption Spectroscopy (IBBCEAS) for Gas Sensing. Sensors, 18(11), 3646. https://doi.org/10.3390/s18113646