A Customer Feedback Platform for Vehicle Manufacturing Compliant with Industry 4.0 Vision

 ,
,  , ,
, ,  , and
, and 
Abstract
1. Introduction
- (a)
- To guarantee compatibility with the entire range of OBD-II commands;
- (b)
- A personalized holistic decoding of supported OBD-II commands according to specific vehicles;
- (c)
- Enable parallel execution of OBD-II commands;
- (d)
- Intelligent module for sending data based on unique communication technologies;
- (e)
- Module for fog computing in order to pre-process the raw data;
- (f)
- A transparent sending mechanism for visualization and analysis in the cloud;
- (g)
- State machine to minimize the energy consumption of GPS (Global Positioning System) and communication protocols.
2. Related Works
- Battery Monitoring;
- Monitoring of poluents;
- Monitoring future and current Trouble Codes.
3. Platform Architecture
- (a)
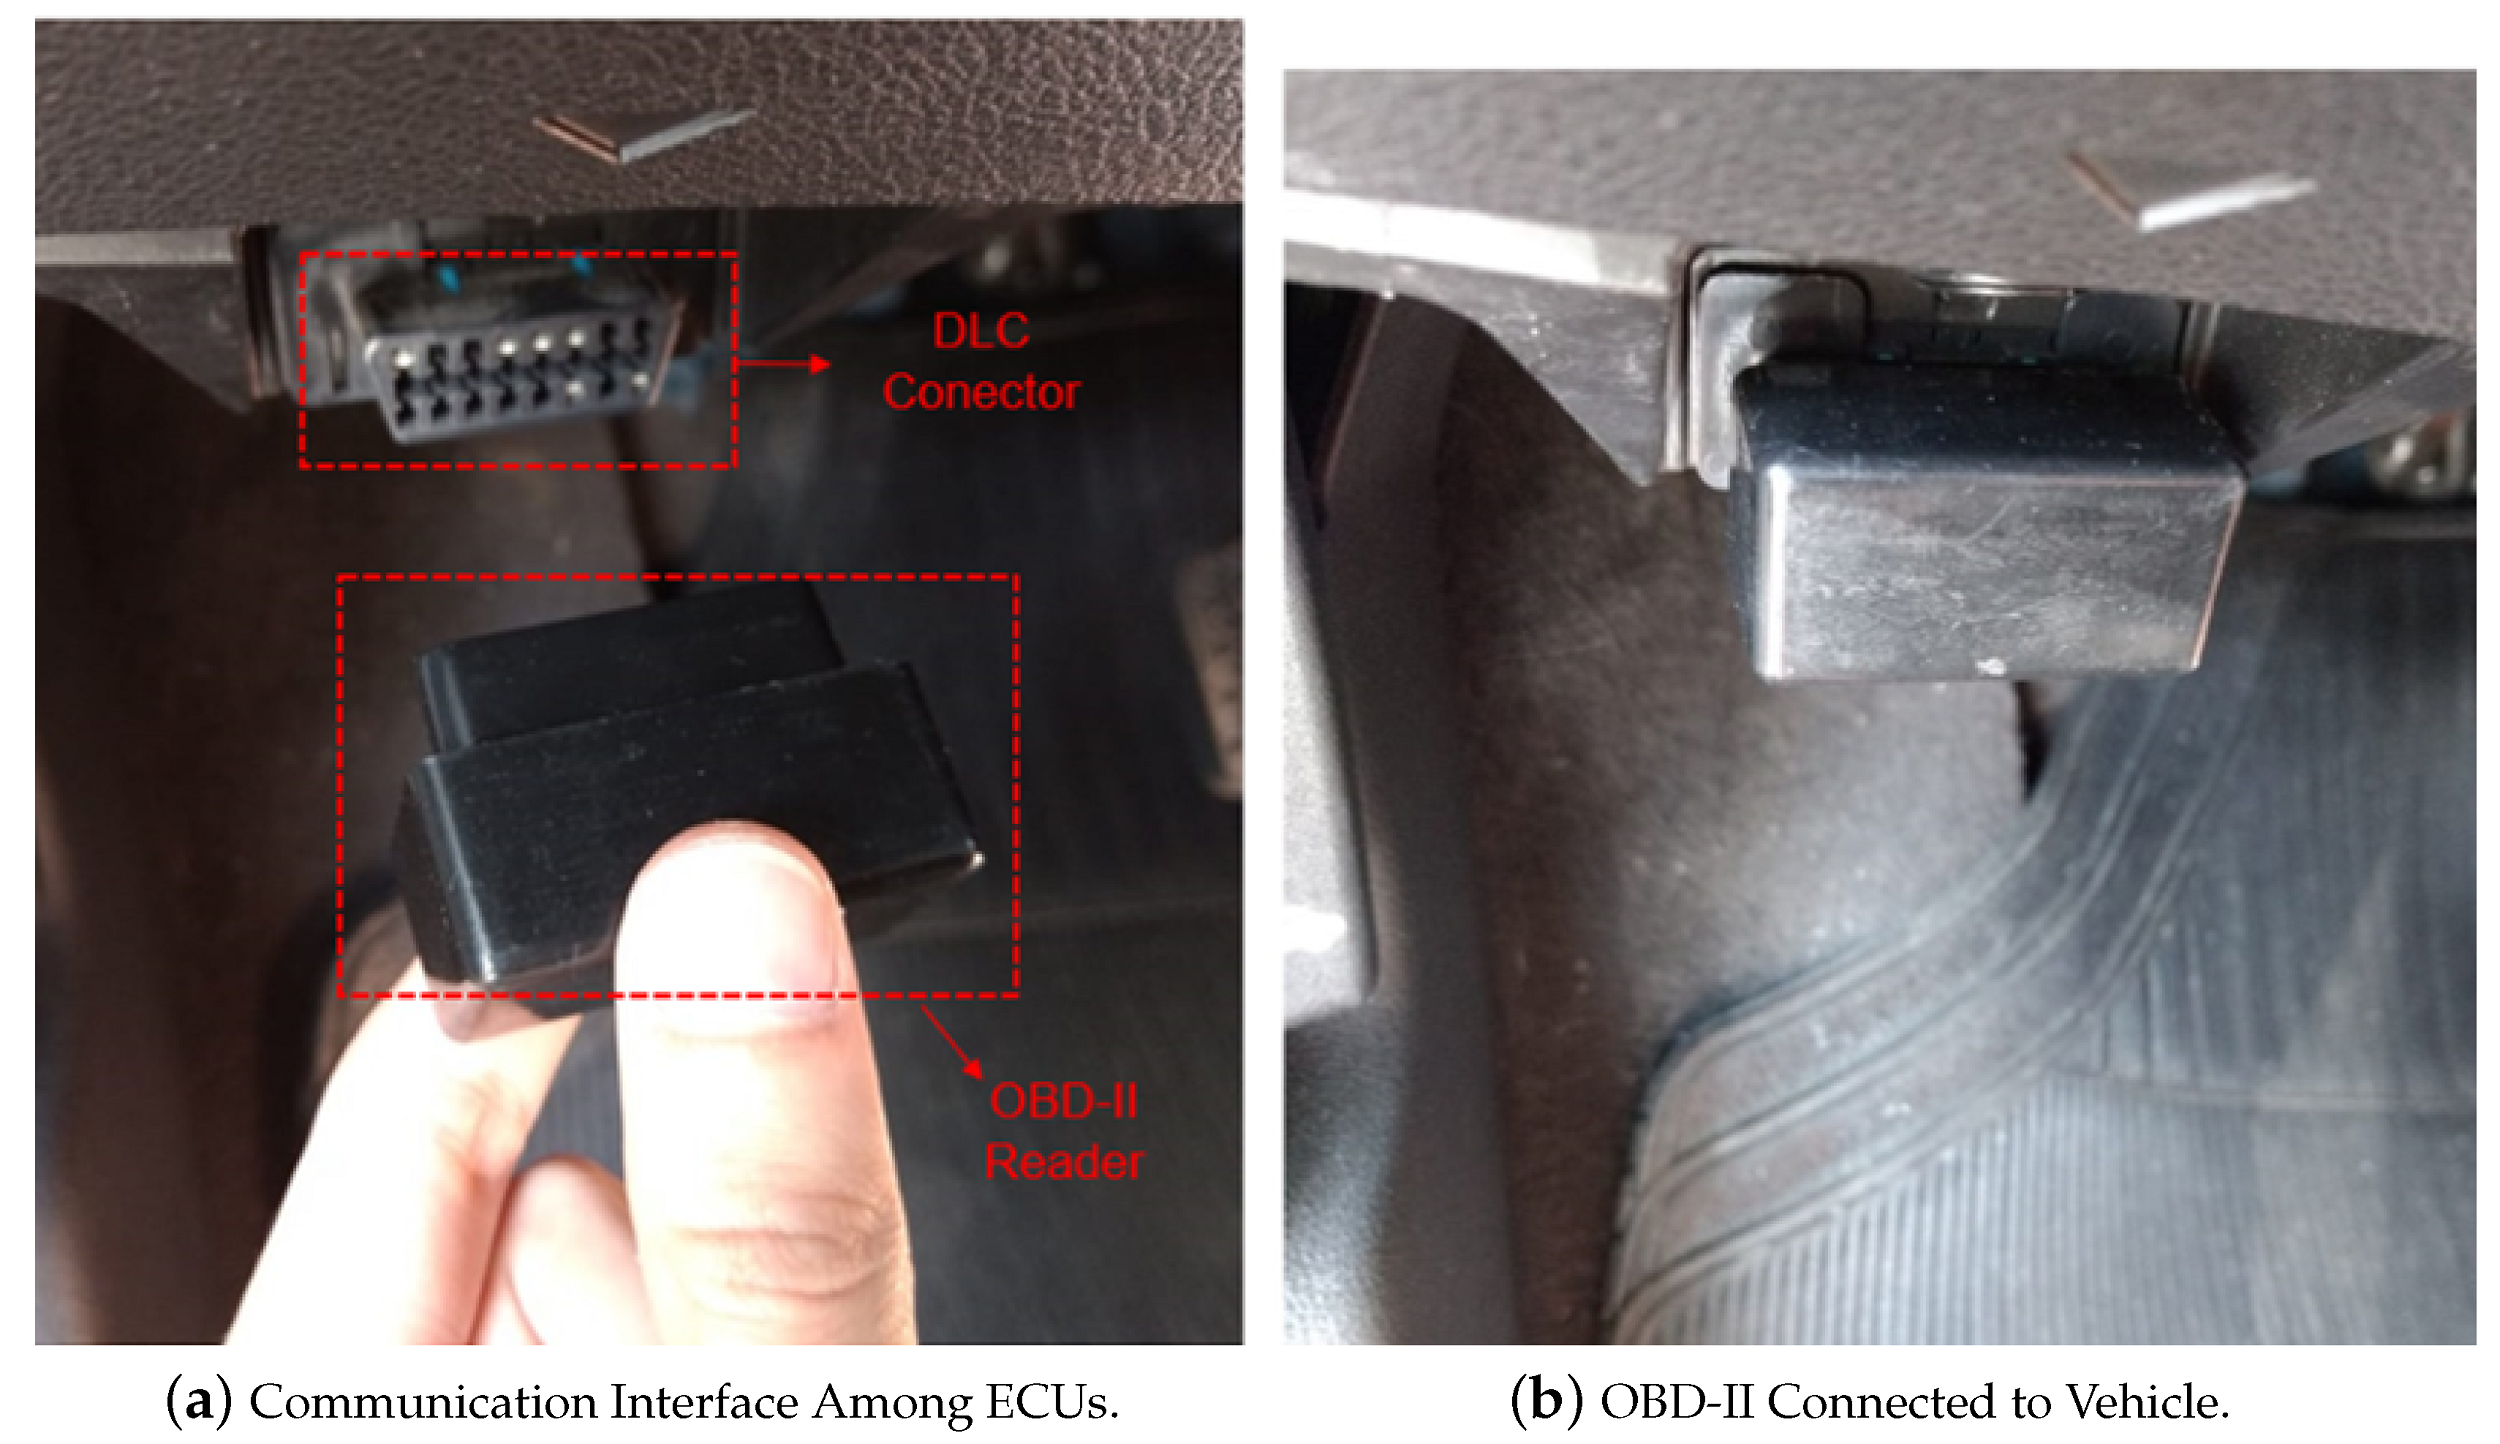
- Vehicular connection module: which aims to connect the vehicle ECU to the other platform devices through an off-the-shelf OBD-II device;
- (b)
- Data capture module: whose objective is to be a gateway between the vehicle and the cloud server, communicating all data from any support communication protocols;
- (c)
- Data storage module: is responsible for storing and data analytics from a Representational State Transfer (REST) API.
3.1. Vehicular Connection Module
3.2. Data Capture Module
- (a)
- Ready: represent the initial state of the application and only from it can actions of the system be executed;
- (b)
- Not Ready: state when the application requirements are not attended, blocking the application until they are met;
- (c)
- Connecting: represents the state when the connection is started. Here, the connection to the OBD-II interface is established and a communication socket is created. If an error occurs during this process, the state changes to “disconnecting”.
- (d)
- Connected: is reached if the connection was established correctly in the previous state, it is where the data exchange occurs through the previously created socket;
- (e)
- Disconnecting: is the state used to terminate the connection with the vehicle. It can be reached through a user action (disconnect) or in the case of an error occurrence during connection. In this state, the cleaning actions and the closing of the connection take place, returning to the initial state of the application.
{
    "dateTime": "2018-01-01 00:00:00",
    "data": [{
	"serial": "93YBSR7RHEJ2*****"",
        "GEOLOCATION": "{
		  \"altitude\": 45.835,
		  \"latitude\": -5.8321709,
		  \"longitude\": -35.2076702
	}"
        "AIR_INTAKE_TEMP": 53.0,
	"DISTANCE_TRAVELED_AFTER_CC": 63847,
	"DISTANCE_TRAVELED_MIL_ON": 0,
	"DTC_NUMBER": 0,
	"ENGINE_COOLANT_TEMP": 91.0,
	"ENGINE_LOAD": 47.058823,
	"ENGINE_RPM": 786,
	"INTAKE_MANIFOLD_PRESSURE": 46,
	"LONG_TERM_BANK_1": -3.90625,
	"PENDING_TROUBLE_CODES": "[]",
	"SHORT_TERM_BANK_1": -1.5625,
	"SPEED": 17,
	"THROTTLE_POS": 16.078432,
	"TIMING_ADVANCE": -28.5,
	"TROUBLE_CODES": "[]"
 }]
}
3.3. Data Storage Module
- (a)
- Registration: in this operation the vehicle registration is preformed, informing the model name, serial number and supported sensors;
- (b)
- Identification: the identification of the attribute types (number, Boolean, point, string, among others) which the available sensors work with. In other words, the structure of the JSON used to send the data is defined with all the necessary data types;
- (c)
- Verification: the process of verification both of the registered vehicle and the type of data that is sent;
- (d)
- Storage: Sends and receives information through a REST API making use of standard HTTP methods. The data coming from the vehicle sensors is structured in JSON format as cited in Section 3.2. This data is then stored in a database and made available for reading as a time series.
4. Evaluation
4.1. Goal Definition
4.2. Planning
4.2.1. Context Selection
4.2.2. Research Questions
- (a)
- Question 1: which are the sensors supported by each vehicle?
- (b)
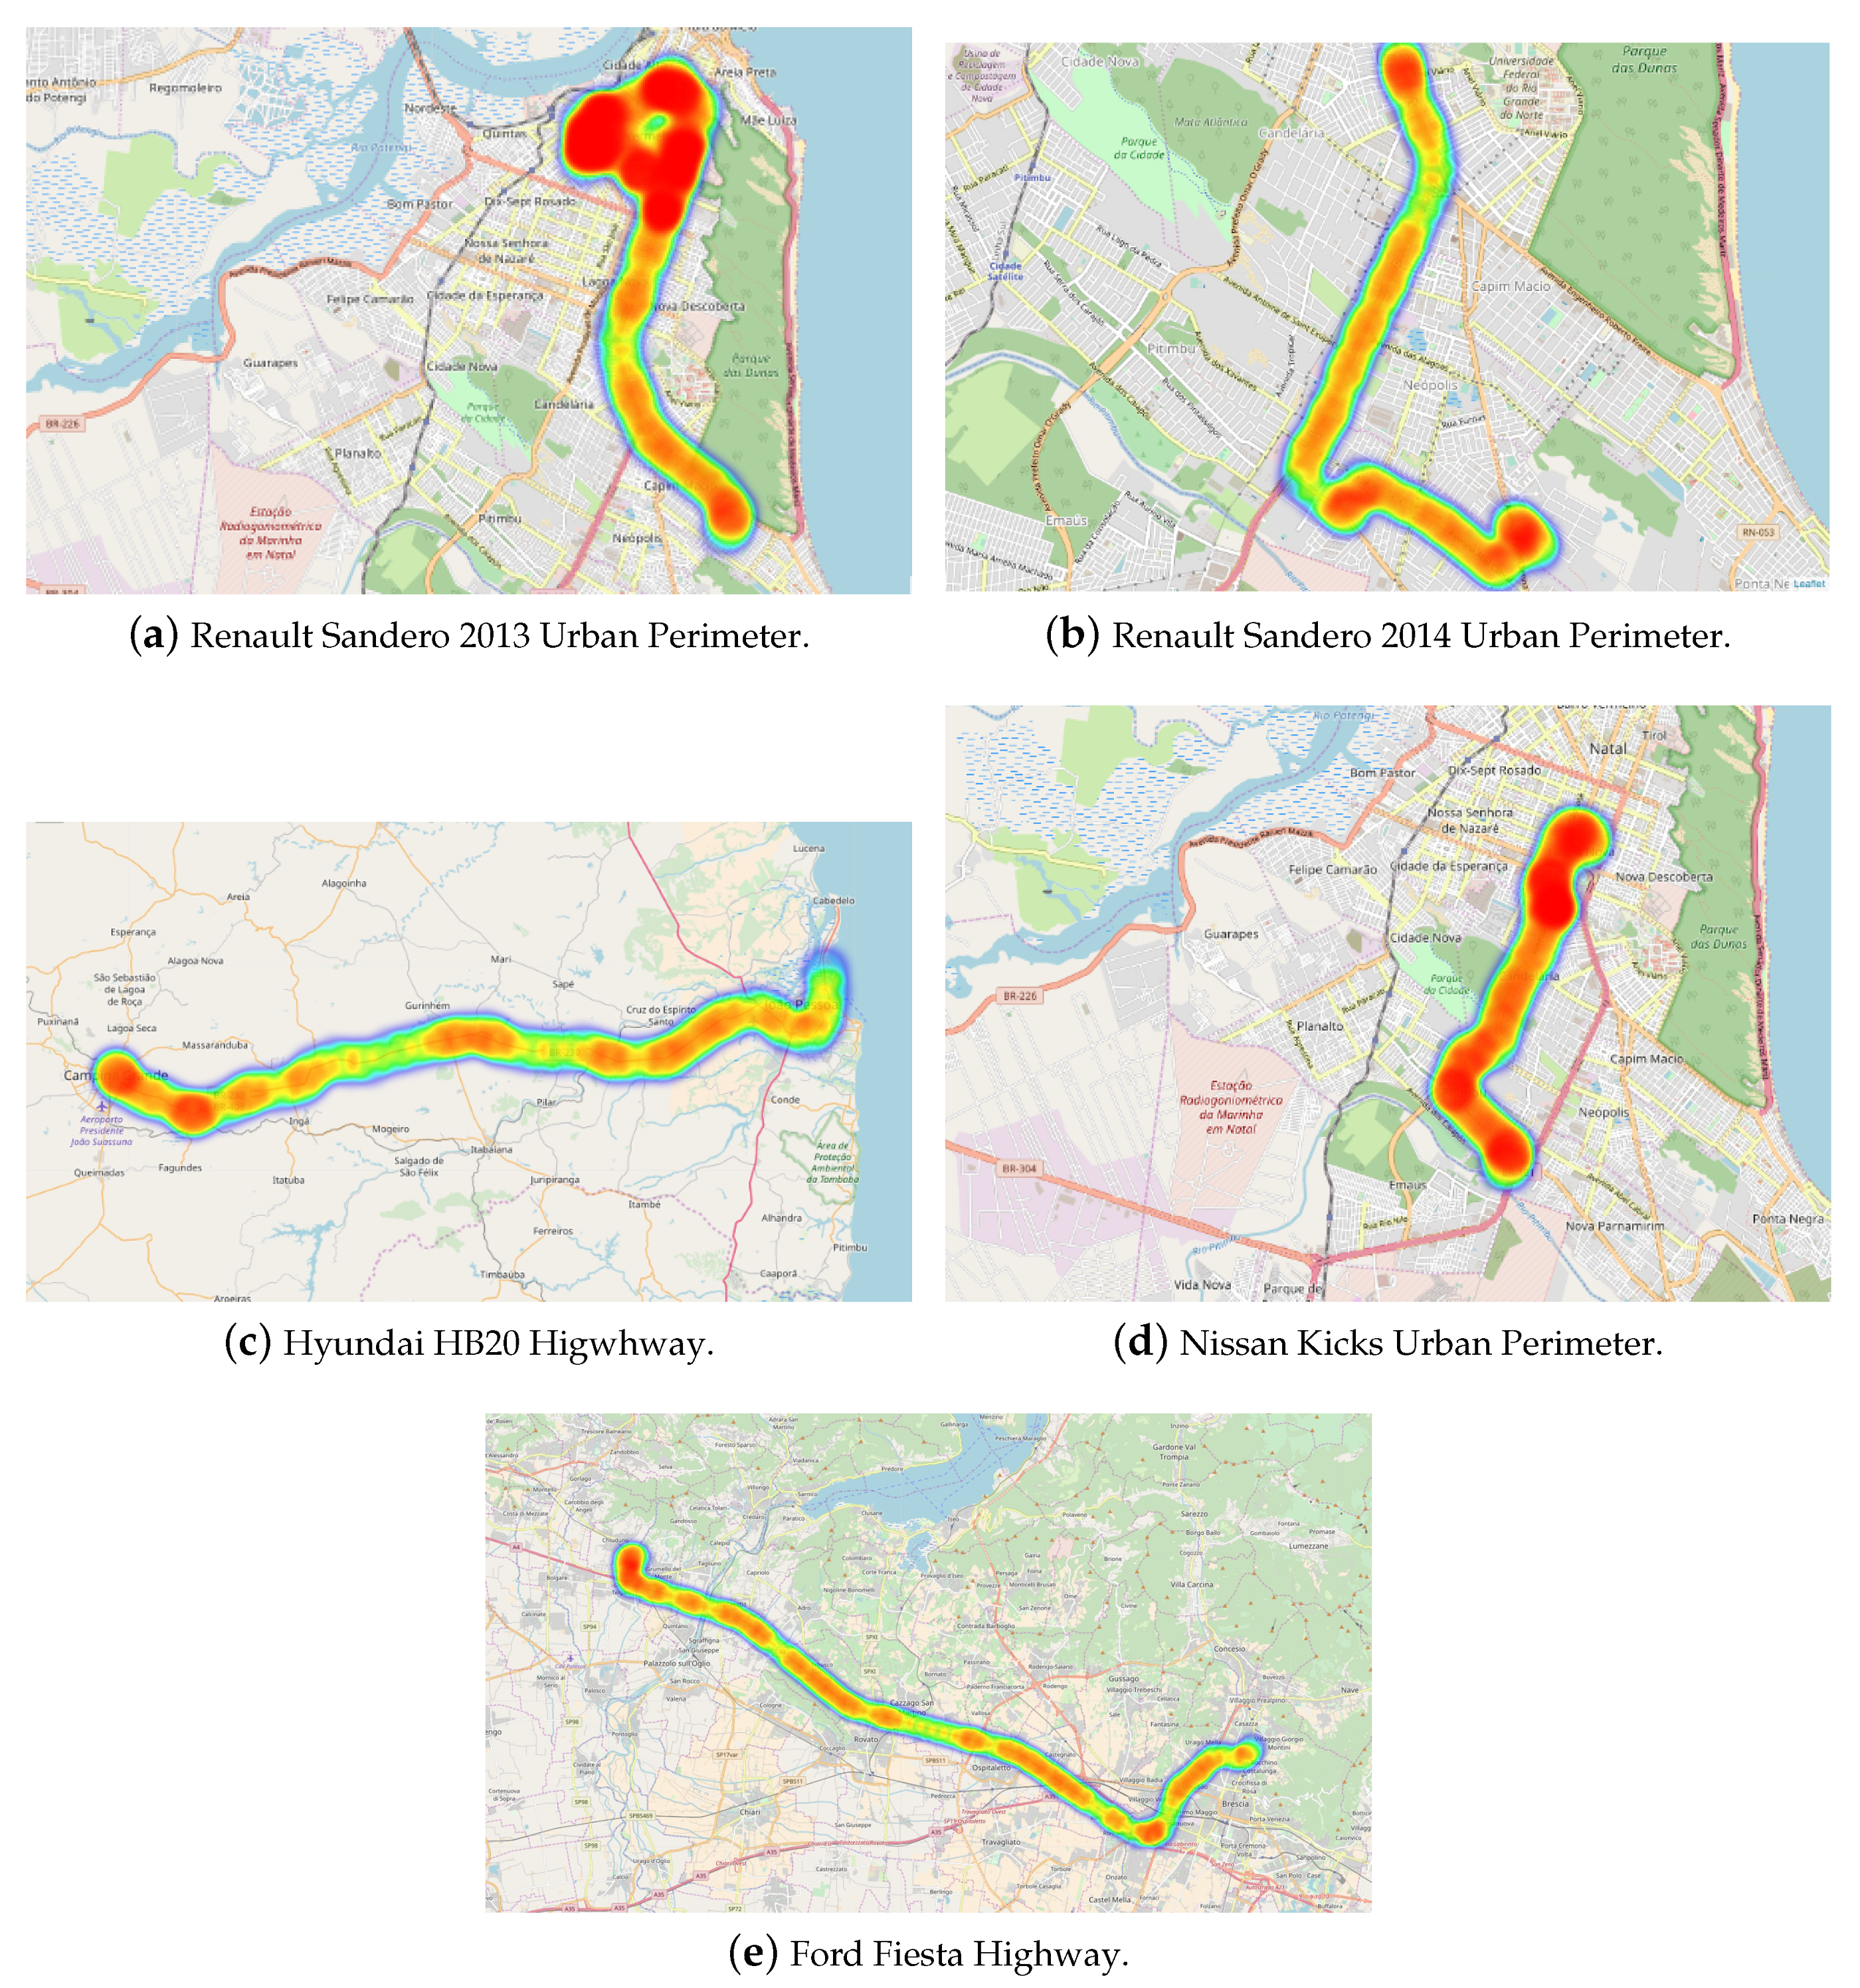
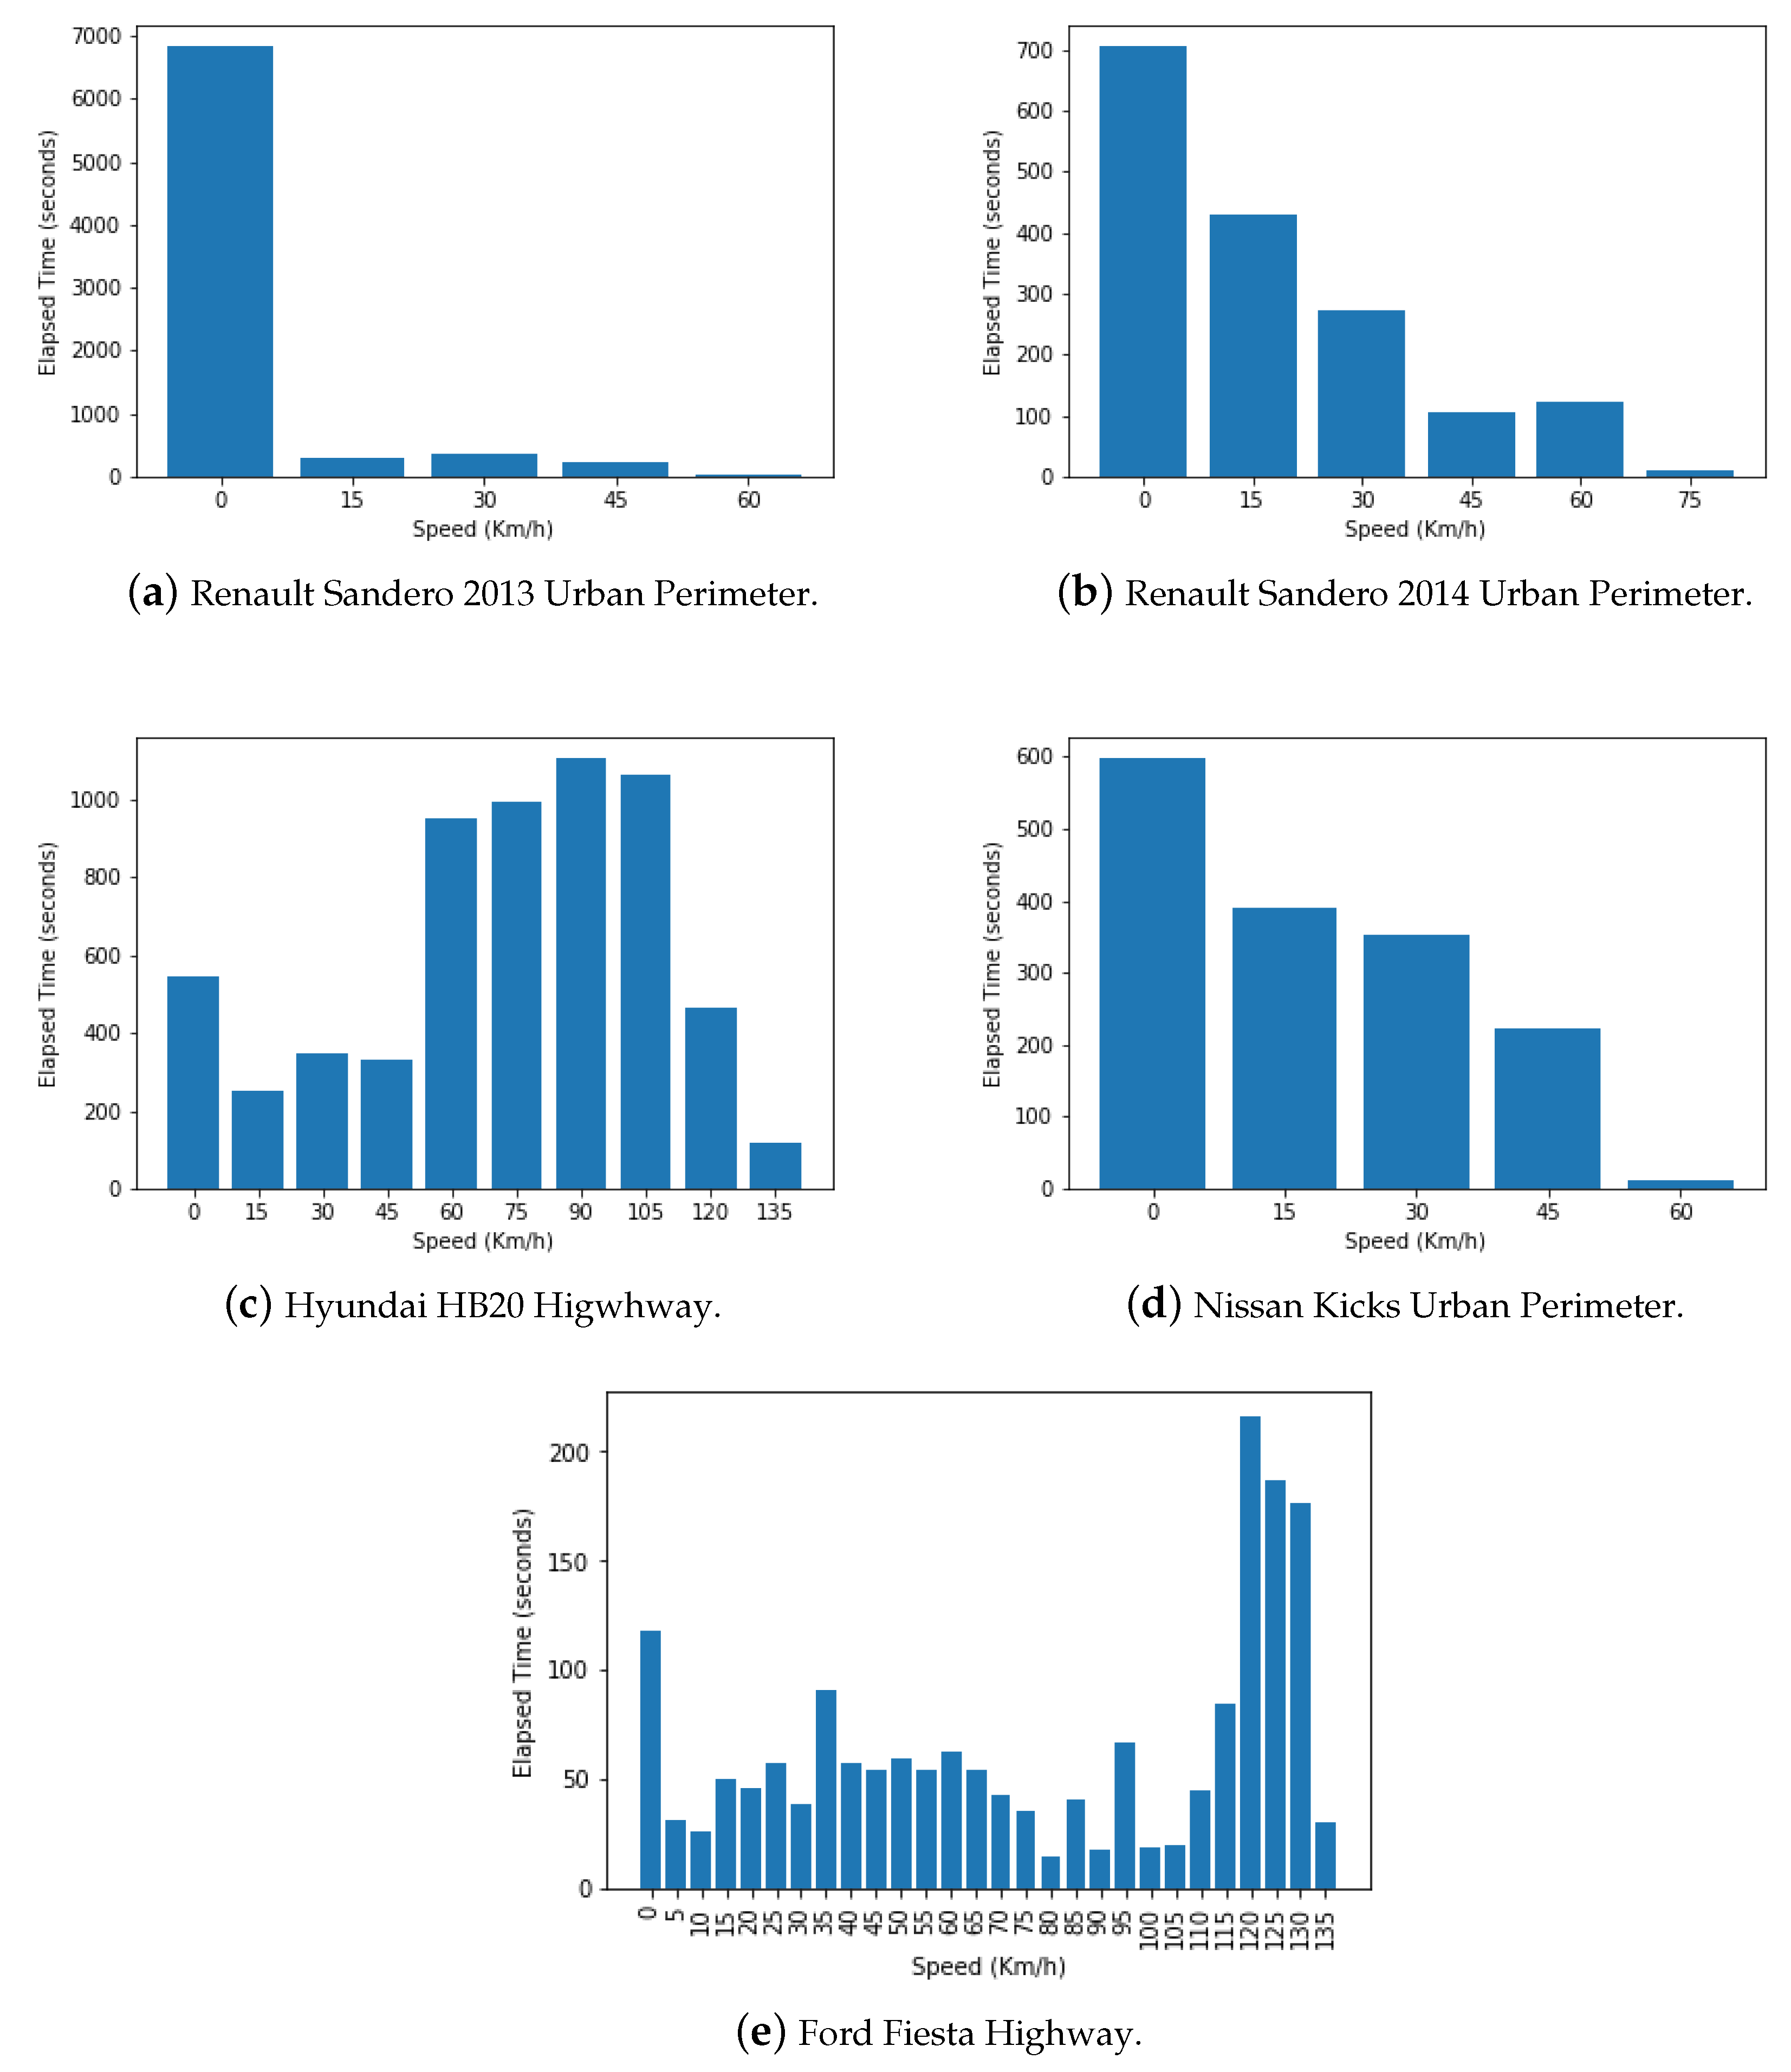
- Question 2: what are the speed patterns used by the drivers in urban routes and in highways?
- (c)
- Question 3: what is the correlation of Speed to Revolutions Per Minute (RPM)?
- (d)
- Question 4: what is the battery behaviour when the vehicle is in operation?
- (e)
- Question 5: what are the error codes presented in each of the vehicles?
4.2.3. Selected Sample
4.2.4. Instrumentation
- (a)
- Connecting the OBD-II: in the vehicle, later on, the smartphone to OBD-II. it was in Section 3.2.
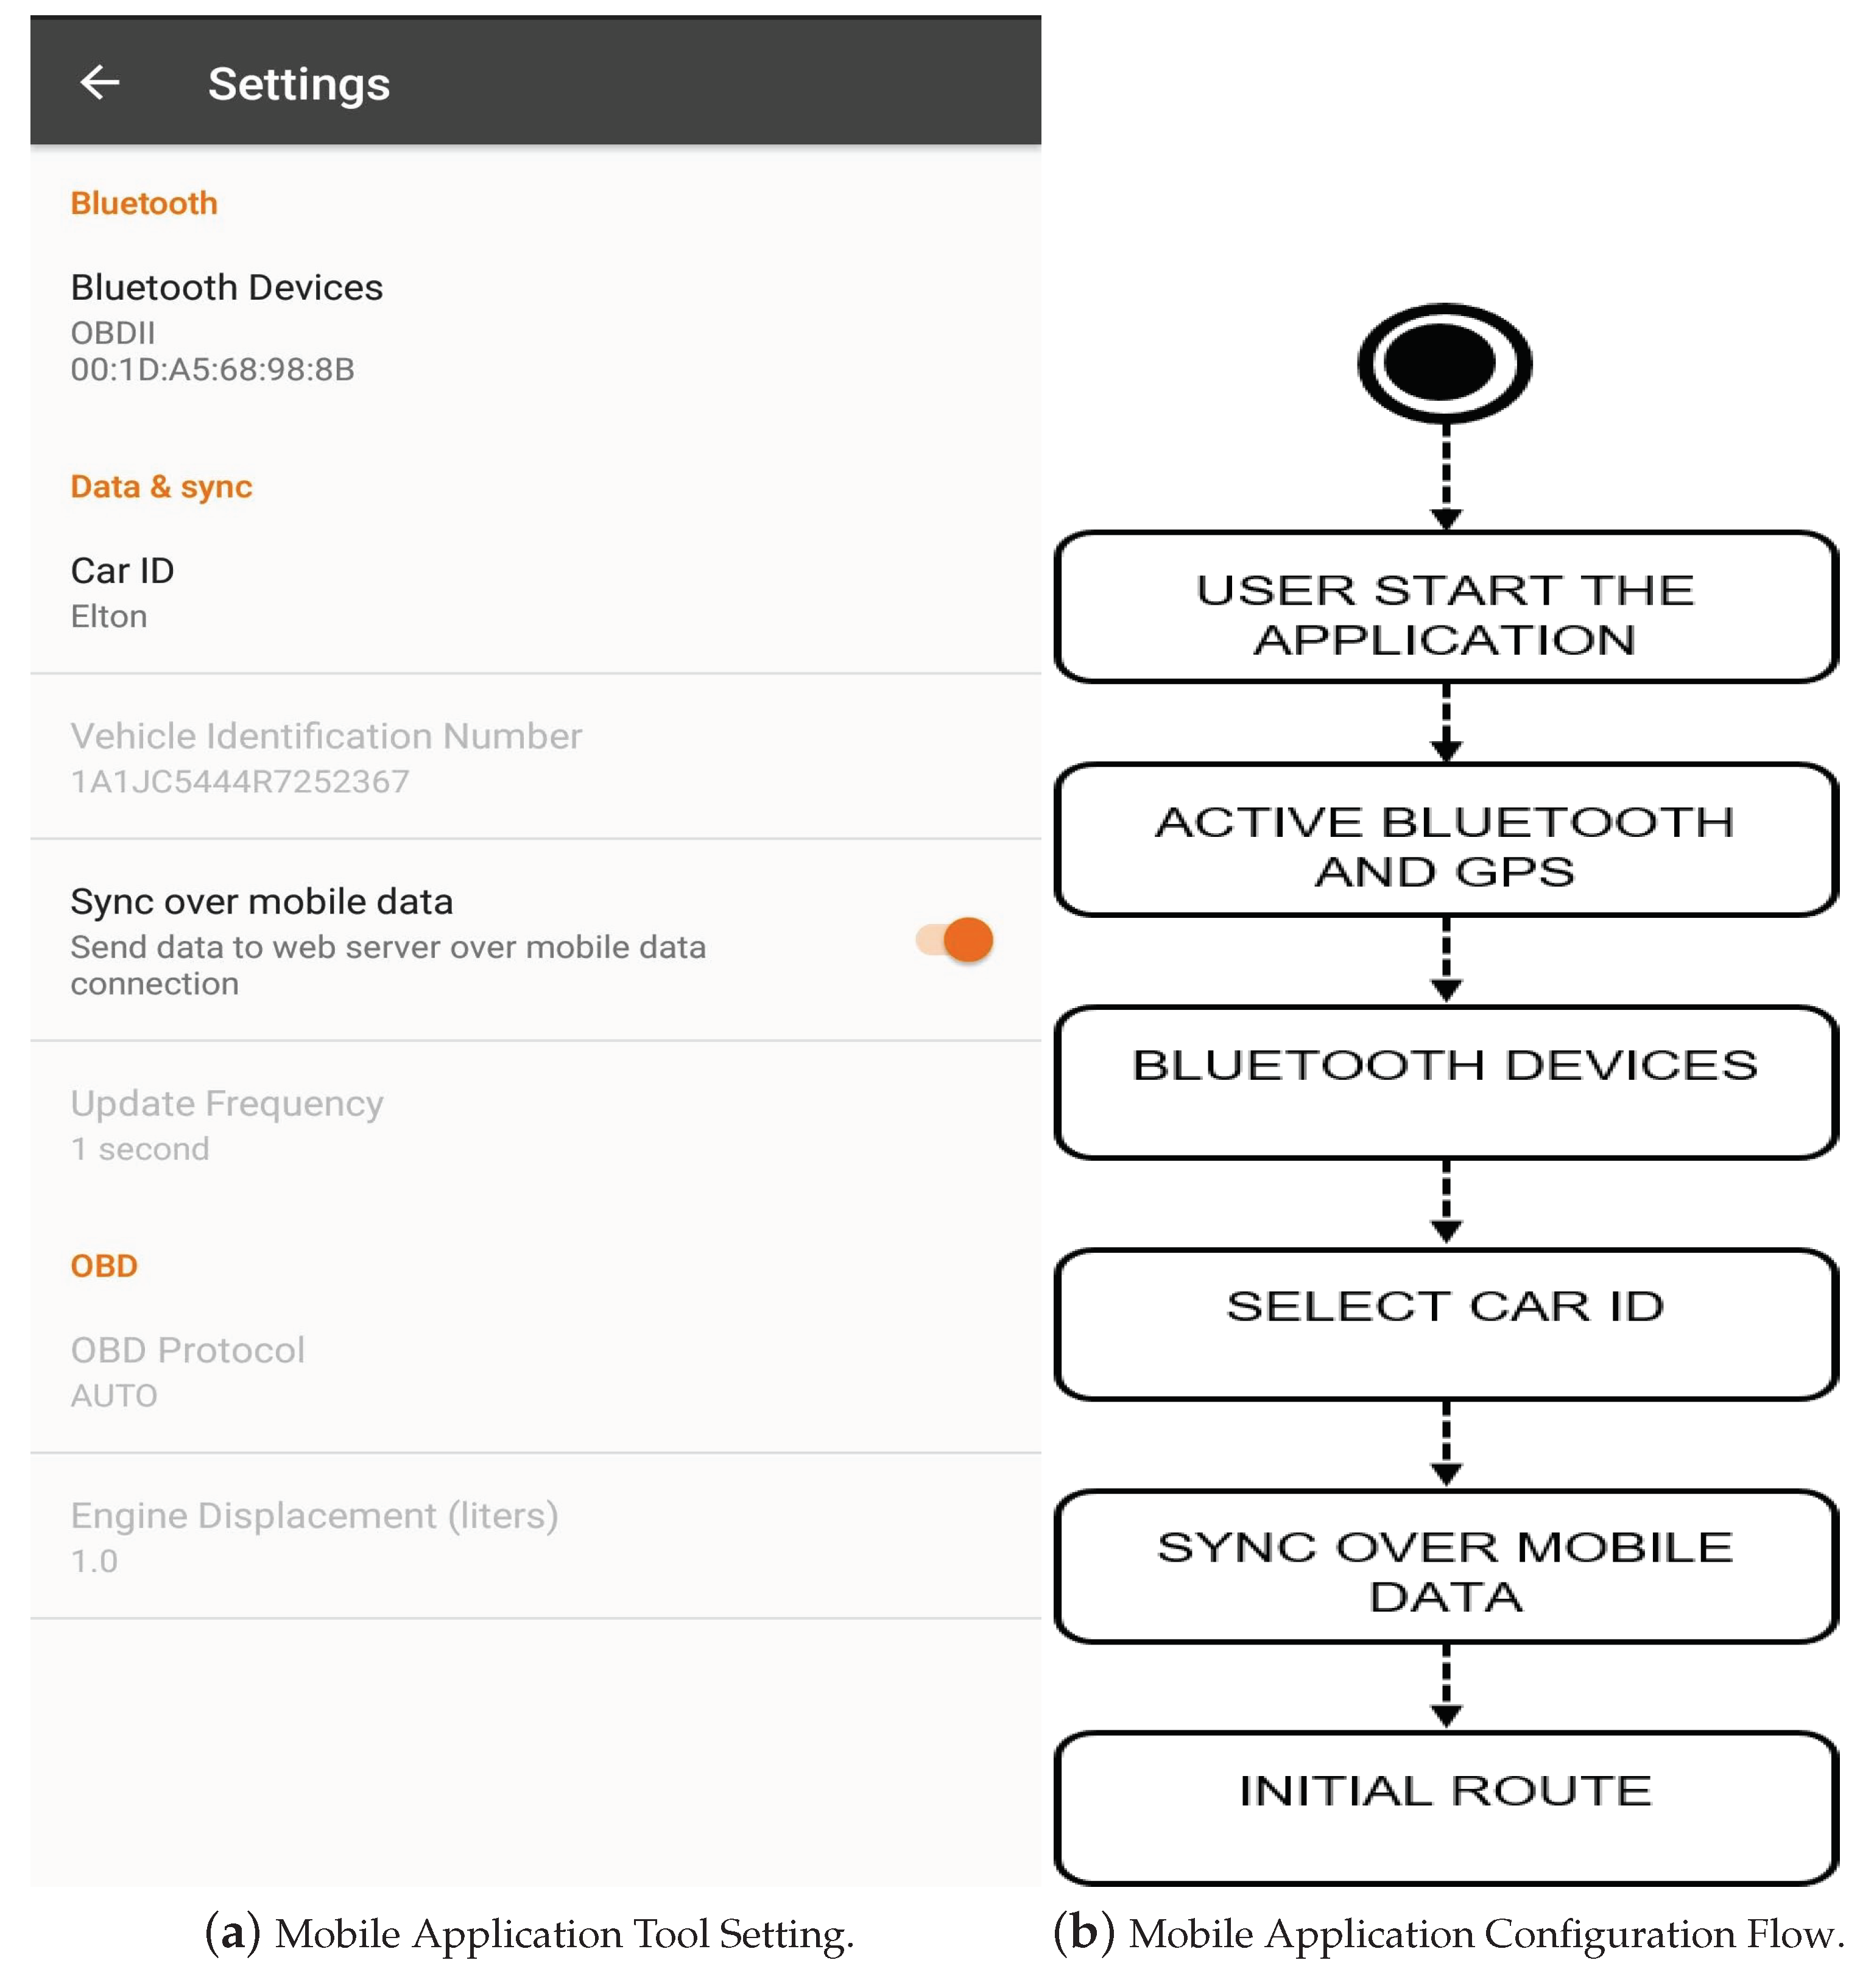
- (b)
- Mobile Application tool setting with OBD-II: is shown in the Figure 8a,b. You only need to configure Bluetooth Devices by selecting the OBD-II that is connected to your smartphone, define o Car ID, the other settings are already set by default.
- (c)
- Initial route: in different roads (highways and urban perimeter).
4.2.5. Execution
5. Results and Discussion
5.1. Research Question 1
5.2. Research Question 2
5.3. Research Question 3
5.4. Research Question 4
5.5. Research Question 5
5.6. Threats to Validity
- Geo-location, conclusion validity: routes that go through areas with no GPRS / 3G or 4G coverage do not store their geo-location data (latitude and longitude) for these areas, i.e., the sensor data is stored locally and transmitted to the server once connections is reestablished, but the route cannot be identified due to the lacking geo-location data.
- Appropriate instrumentation, internal validity: vehicles were evaluated on different routes and times, since it was not intended to make any kind of comparison between them, just check the viability of each sensor.
- Representative population, external validity: The variety of vehicles composing the sample was significant for the research purpose, however, there are vehicle models that have not been evaluated.
6. Conclusions and Future Works
Author Contributions
Funding
Acknowledgments
Conflicts of Interest
Abbreviations
| AFR | Fuel Ratio |
| AP | Acceleration Position |
| API | Application Programming Interface |
| CAN | Controller Area Network |
| CARB | California Air Resources Management Committee |
| CPS | Cyber-physical Systems |
| DLC | Data Link Connector |
| ECU | Engine Control Unit |
| EPA | Environmental Protection Agency |
| ERP | Enterprise Resource Planning |
| FL | Fuel Level |
| FSS | Fuel System Status |
| GPS | Global Positioning System |
| IIoT | Industrial Internet of Things |
| IoIV | Internet of Intelligent Vehicles |
| IoT | Internet of Things |
| JSON | JavaScript Object Notation |
| LTFT | Long Term Fuel Trim |
| MAF | Mass Air Flow Rate |
| MAP | Manifold Air Pressure |
| MES | Manufacturing Execution Systems |
| OBD-II | On-Board Diagnostics |
| PID | Parameter Identification |
| REST | Representational State Transfer |
| RPM | Revolutions Per Minute |
| SOC | State of Charge |
| SOTA | Software Updates Over The Air |
| STFT | Short Term Fuel Trim |
| VANETs | Vehicular Ad-hoc Networks |
| VIN | Vehicle Identification Number |
| VS | Vehicular Speed |
| WPANs | Wireless Personal Area Networks |
References
- Contreras-Castillo, J.; Zeadally, S.; Ibáñez, J.A.G. A seven-layered model architecture for Internet of Vehicles. J. Inf. Telecommun. 2017, 1, 4–22. [Google Scholar] [CrossRef]
- Ganti, R.K.; Ye, F.; Lei, H. Mobile crowdsensing: Current state and future challenges. IEEE Commun. Mag. 2011, 49, 32–39. [Google Scholar] [CrossRef]
- Atzori, L.; Iera, A.; Morabito, G. The Internet of Things: A survey. Comput. Netw. 2010, 54, 2787–2805. [Google Scholar] [CrossRef]
- Gubbi, J.; Buyya, R.; Marusic, S.; Palaniswami, M. Internet of Things (IoT): A vision, architectural elements, and future directions. Future Gener. Comput. Syst. 2013, 29, 1645–1660. [Google Scholar] [CrossRef]
- Zanella, A.; Bui, N.; Castellani, A.; Vangelista, L.; Zorzi, M. Internet of things for smart cities. IEEE Internet Things J. 2014, 1, 22–32. [Google Scholar] [CrossRef]
- Sadeghi, A.R.; Wachsmann, C.; Waidner, M. Security and privacy challenges in industrial Internet of Things. In Proceedings of the 2015 52nd ACM/EDAC/IEEE Design Automation Conference (DAC), San Francisco, CA, USA, 8–12 June 2015. [Google Scholar] [CrossRef]
- Silva, I.; Leandro, R.; Macedo, D.; Guedes, L.A. A dependability evaluation tool for the Internet of Things. Comput. Electr. Eng. 2013, 39, 2005–2018. [Google Scholar] [CrossRef]
- Hromic, H.; Phuoc, D.L.; Serrano, M.; Antonić, A.; Žarko, I.P.; Hayes, C.; Decker, S. Real time analysis of sensor data for the Internet of Things by means of clustering and event processing. In Proceedings of the 2015 IEEE International Conference on Communications (ICC), London, UK, 8–12 June 2015; pp. 685–691. [Google Scholar] [CrossRef]
- Shu, L.; Wang, L.; Niu, J.; Zhu, C.; Mukherjee, M. Releasing Network Isolation Problem in Group-Based Industrial Wireless Sensor Networks. IEEE Syst. J. 2017, 11, 1340–1350. [Google Scholar] [CrossRef]
- Li, Y.; Luo, C.; Zhu, R.; Chen, Y.; Zeng, H. Efficient Spatial Keyword Query Processing in the Internet of Industrial Vehicles. Mob. Netw. Appl. 2017. [Google Scholar] [CrossRef]
- Gill, S.; Chawla, P.; Sahni, P.; Kaur, S. An Effective and Empirical Review on Internet of Things and Real-Time Applications. Adv. Comput. Comput. Sci. 2017, 554, 159–167. [Google Scholar] [CrossRef]
- Wu, W.C.; Liaw, H.T.; Yen, N.Y.; Hui, L. The Next Generation of Internet of Things: Internet of Vehicles. In Proceedings of the International Conference on Frontier Computing, Osaka, Japan, 12–14 July 2017; Springer: Singapore, 2018; pp. 278–282. [Google Scholar]
- Dandala, T.T.; Krishnamurthy, V.; Alwan, R. Internet of Vehicles (IoV) for traffic management. In Proceedings of the International Conference on Computer, Communication and Signal Processing (ICCCSP), Chennai, India, 10–11 January 2017; pp. 1–4. [Google Scholar] [CrossRef]
- Sugayama, R.; Negrelli, E. Connected Vehicle on the Way of Industry 4.0. Available online: pdf.blucher.com.br.s3-sa-east-1.amazonaws.com/engineeringproceedings/simea2016/PAP16.pdf (accessed on 20 June 2018).
- Rinaldi, S.; Pasetti, M.; Sisinni, E.; Bonafini, F.; Ferrari, P.; Rizzi, M.; Flammini, A. On the Mobile Communication Requirements for the Demand-Side Management of Electric Vehicles. Energies 2018, 11. [Google Scholar] [CrossRef]
- Talib, M.; Hussin, B.; Hassan, A. Converging VANET with vehicular cloud networks to reduce the traffic congestions: A review. Int. J. Appl. Eng. Res. 2017, 12, 10646–10654. [Google Scholar]
- Chowdhary, N.; Deep Kaur, P. Addressing the characteristics of mobility models in IoV for smart city. In Proceedings of the 2016 International Conference on Computing, Communication and Automation (ICCCA), Noida, India, 29–30 April 2016; pp. 1298–1303. [Google Scholar] [CrossRef]
- Chen, Y.; Xiang, Z.; Jian, W.; Jiang, W. An improved AOMDV routing protocol for V2V communication. In Proceedings of the 2009 IEEE Intelligent Vehicles Symposium, Xi’an, China, 3–5 June 2009; pp. 1115–1120. [Google Scholar] [CrossRef]
- Pu, L.; Liu, Z.; Meng, Z.; Yang, X.; Zhu, K.; Zhang, L. Implementing on-board diagnostic and GPS on VANET to safe the vehicle. In Proceedings of the 2015 International Conference on Connected Vehicles and Expo (ICCVE), Shenzhen, China, 19–23 October 2015; pp. 13–18. [Google Scholar] [CrossRef]
- Schütze, A.; Helwig, N.; Schneider, T. Sensors 4.0—Smart sensors and measurement technology enable Industry 4.0. J. Sens. Sens. Syst. 2018, 7, 359–371. [Google Scholar] [CrossRef]
- Wu, M.; Wu, Y.; Liu, X.; Ma, M.; Liu, A.; Zhao, M. Learning-based synchronous approach from forwarding nodes to reduce the delay for Industrial Internet of Things. Eurasip J. Wirel. Commun. Netw. 2018, 2018, 10. [Google Scholar] [CrossRef]
- Weyer, S.; Schmitt, M.; Ohmer, M.; Gorecky, D. Towards Industry 4.0-Standardization as the crucial challenge for highly modular, multi-vendor production systems. Ifac-Papersonline 2015, 48, 579–584. [Google Scholar] [CrossRef]
- Lee, J.; Bagheri, B.; Kao, H.A. A Cyber-Physical Systems architecture for Industry 4.0-based manufacturing systems. Manuf. Lett. 2015, 3, 18–23. [Google Scholar] [CrossRef]
- Ferreira, F.; Faria, J.; Azevedo, A.; Marques, A. Product Lifecycle Management Enabled by Industry 4.0 Technology. In Advances in Manufacturing Technology XXX; Coh, Y.M., Case, K., Eds.; IOS Press: Amsterdam, The Netherlands, 2016; Volume 3, pp. 349–354. [Google Scholar]
- Ferrari, P.; Flammini, A.; Sisinni, E.; Rinaldi, S.; Brandão, D.; Rocha, M.S. Delay Estimation of Industrial IoT Applications Based on Messaging Protocols. IEEE Trans. Instrum. Meas. 2018, 67, 2188–2199. [Google Scholar] [CrossRef]
- Lasi, H.; Fettke, P.; Fettke, P.; Kemper, H.G.; Feld, T.; Hoffmann, M. Business & Information Systems Engineering; Springer Fachmedien Wiesbaden: Wiesbaden, Germany, 2014; pp. 239–242. [Google Scholar]
- Zawadzki, P.; Żywicki, K. Smart Product Design and Production Control for Effective Mass Customization in the Industry 4.0 Concept. Manag. Prod. Eng. Rev. 2016, 7, 105–112. [Google Scholar] [CrossRef]
- Wollschlaeger, M.; Sauter, T.; Jasperneite, J. The Future of Industrial Communication: Automation Networks in the Era of the Internet of Things and Industry 4.0. IEEE Ind. Electron. Mag. 2017, 11, 17–27. [Google Scholar] [CrossRef]
- Vitturi, S.; Tramarin, F.; Seno, L. Industrial Wireless Networks: The Significance of Timeliness in Communication Systems. IEEE Ind. Electron. Mag. 2013, 7, 40–51. [Google Scholar] [CrossRef]
- Girs, S.; Willig, A.; Uhlemann, E.; Björkman, M. Scheduling for Source Relaying With Packet Aggregation in Industrial Wireless Networks. IEEE Trans. Ind. Inform. 2016, 12, 1855–1864. [Google Scholar] [CrossRef]
- He, Q.P.; Wang, J. Statistical process monitoring as a big data analytics tool for smart manufacturing. J. Process Control 2018, 67, 35–43. [Google Scholar] [CrossRef]
- Scheidel, W.; Mozgova, I.; Lachmayer, R. Structuring Information in Technical Inheritance with PDM Systems; Leibniz Universität Hannover: Hannover, Germany, 2017; Volume 6, pp. 217–226. [Google Scholar]
- Nigon, J.; Verstaevel, N.; Boes, J.; Migeon, F.; Gleizes, M.P. Smart is a matter of context. In Proceedings of the International and Interdisciplinary Conference on Modeling and Using Context, Paris, France, 20–23 June 2017; pp. 189–202. [Google Scholar] [CrossRef]
- Lin, D.; Lee, C.; Lau, H.; Yang, Y. Strategic response to Industry 4.0: An empirical investigation on The Chinese automotive industry. In Industrial Management & Data Systems; Emerald Publishing Limited: Bingley, UK, 2018. [Google Scholar]
- Oliveira, J.; Lemos, J.; Vieira, E.; Silva, I.; Abrantes, J.; Barros, D.; Costa, D.G. CO2Catcher: A Platform for Monitoring of Vehicular Pollution in Smart Cities. In Proceedings of the IEEE First Summer School on Smart Cities, Natal, Brazil, 6–11 August 2017; pp. 37–42. [Google Scholar]
- Hernández-Alcántara, D.; Tudón-Martínez, J.C.; Amézquita-Brooks, L.; Vivas-López, C.A.; Morales-Menéndez, R. Modeling, diagnosis and estimation of actuator faults in vehicle suspensions. Control Eng. Pract. 2016, 49, 173–186. [Google Scholar] [CrossRef]
- Kuranc, A. Exhaust emission test performance with the use of the signal from air flow meter [Eksploatacyjne badania emisji spalin z wykorzystaniem sygnału z przepływomierza powietrza]. Eksploatacja i Niezawodnosc 2014, 17, 129–134. [Google Scholar] [CrossRef]
- Kang, L.; Qi, B.; Janecek, D.; Banerjee, S. EcoDrive: A mobile sensing and control system for fuel efficient driving. In Proceedings of the 21st Annual International Conference on Mobile Computing and Networking, Paris, France, 7–11 September 2015; pp. 358–371. [Google Scholar] [CrossRef]
- Cassiano, D.; Ribau, J.; Cavalcante, F.; Oliveira, M.; Silva, C. On-board Monitoring and Simulation of Flex Fuel Vehicles in Brazil. Trans. Res. Procedia 2016, 14, 3129–3138. [Google Scholar] [CrossRef]
- Malekian, R.; Moloisane, N.R.; Nair, L.; Maharaj, B.; Chude-Okonkwo, U.A. Design and implementation of a wireless OBD II fleet management system. IEEE Sens. J. 2017, 17, 1154–1164. [Google Scholar] [CrossRef]
- Kim, H.S.; Jang, S.J.; Jang, J.W. A study on development of engine fault diagnostic system. Math. Probl. Eng. 2015, 15, 271374. [Google Scholar] [CrossRef]
- Yang, Y.; Chen, B.; Su, L.; Qin, D. Research and development of hybrid electric vehicles can-bus data monitor and diagnostic system through obd-ii and android-based smartphones. Adv. Mech. Eng. 2015, 5, 741240. [Google Scholar] [CrossRef]
- Chen, L.B.; Li, H.Y.; Chang, W.J.; Tang, J.J.; Li, K.M. An intelligent vehicular telematics platform for vehicle driving safety supporting system. In Proceedings of the 2015 International Conference on Connected Vehicles and Expo (ICCVE), Shenzhen, China, 19–23 October 2015; pp. 210–211. [Google Scholar] [CrossRef]
- Borio, D.; Cano, E.; Baldini, G. Speed Consistency in the Smart Tachograph. Sensors 2018, 18. [Google Scholar] [CrossRef]
- Wang, L.Y.; Wang, L.F.; Liu, W.; Zhang, Y.W. Research on fault diagnosis system of electric vehicle power battery based on OBD technology. In Proceedings of the 2017 International Conference on Circuits, Devices and Systems (ICCDS), Chengdu, China, 5–8 September 2017; pp. 95–99. [Google Scholar] [CrossRef]
- Ablay, G. An observer-based fault diagnosis in battery systems of hybrid vehicles. In Proceedings of the International Conference on Electrical and Electronics Engineering (ELECO), Bursa, Turkey, 28–30 November 2013; pp. 238–242. [Google Scholar] [CrossRef]
- Pieroni, A.; Scarpato, N.; Brilli, M. Industry 4.0 revolution in autonomous and connected vehicle a now-conventional approach to manage Big Data. J. Theor. Appl. Inf. Technol. 2018, 96, 10–18. [Google Scholar]
- Di Vaio, M.; Guizzi, G.; Petrillo, A.; Santini, S. Fleets management of cooperative connected automated vehicles in manufacturing processes. In Proceedings of the 3rd INCOSE Italia Conference on Systems Engineering, Naples, Italy, 22–24 November 2017; Volume 2010, pp. 82–86. [Google Scholar]
- Freiwald, A.; Hwang, G. Safe and Secure Software Updates over the Air for Electronic Brake Control Systems. SAE Int. J. Passeng. Cars Electron. Electr. Syst. 2017, 10. [Google Scholar] [CrossRef]
- Thoben, K.D.; Wiesner, S.; Wuest, T. “Industrie 4.0” and smart manufacturing-a review of research issues and application examples. Int. J. Autom. Technol. 2017, 11, 4–16. [Google Scholar] [CrossRef]
- Baek, S.H.; Jang, J.W. Implementation of integrated OBD-II connector with external network. Inf. Syst. 2015, 50, 69–75. [Google Scholar] [CrossRef]
- Mouradian, C.; Naboulsi, D.; Yangui, S.; Glitho, R.H.; Morrow, M.J.; Polakos, P.A. A Comprehensive Survey on Fog Computing: State-of-the-Art and Research Challenges. IEEE Commun. Surv. Tutor. 2018, 20, 416–464. [Google Scholar] [CrossRef]
- Gil, B.; Trezentos, P. Impacts of data interchange formats on energy consumption and performance in smartphones. In Proceedings of the 2011 Workshop on Open Source and Design Of Communication, Lisboa, Portugal, 11 July 2011; pp. 1–6. [Google Scholar]
- de Melo Silva, C.C.; Ferreira, H.G.C.; de Sousa Júnior, R.T.; Buiati, F.; Villalba, L.J.G. Design and Evaluation of a Services Interface for the Internet of Things. Wirel. Pers. Commun. 2016, 91, 1711–1748. [Google Scholar] [CrossRef]
- Soltesz, S.; Pötzl, H.; Fiuczynski, M.; Bavier, A.; Peterson, L. Container-based operating system virtualization: A scalable, high-performance alternative to hypervisors. In Proceedings of the Proceedings of the 2nd ACM SIGOPS/EuroSys European Conference on Computer Systems 2007, Lisbon, Portugal, 21–23 March 2007; pp. 275–287. [Google Scholar] [CrossRef]
- Felter, W.; Ferreira, A.; Rajamony, R.; Rubio, J. An updated performance comparison of virtual machines and Linux containers. In Proceedings of the 2015 IEEE International Symposium on Performance Analysis of Systems and Software (ISPASS), Philadelphia, PA, USA, 29–31 March 2015; pp. 171–172. [Google Scholar] [CrossRef]
- de Souza, V.C.O.; dos Santos, M.V.C. Maturing, Consolidation and Performance of NoSQL Databases: Comparative Study. In Proceedings of the Annual Conference on Brazilian Symposium on Information Systems: Information Systems: A Computer Socio-Technical Perspective, Goiania, Brazil, 26–29 May 2015; pp. 32:235–32:242. [Google Scholar]


| Features | Observed Sensors | Data Storage | Industry 4.0 | App | |
|---|---|---|---|---|---|
| Works | |||||
| [37] | Gas Analyzer | Storing on a smartphone | No | No | |
| [39] | Latitude, Longitude, Altitude, Vehicular Speed (VS), Engine Coolant Temperature, Engine RPM, Ignition Timing Advance, Intake Air Temperature, AP, Mass Air Flow Rate (MAF), Manifold Air Pressure (MAP), Engine Load and Grade | Stored directly on a computer that is inside the vehicle connected to the output of the OBD-II adapter | No | No | |
| [35] | MAF, MAP, Absolute temperature (IAT) and Engine RPM | Storing on a smartphone | No | Vehicle Data Collector | |
| [38] | Fuel Level (FL), MAF, Fuel System Status (FSS), Long Term Fuel Trim (LTFT), Short Term Fuel Trim (STFT), VS, Engine RPM and Aceleration Position (AP) | Storing in dataset online | No | EcoDrive | |
| [40] | MAF, Air to Fuel Ratio (AFR) and VS | Storing in dataset online | No | No | |
| [41] | does not detail in the article | Storing on a smartphone | No | Industrial Engine Diagnostic System | |
| [42] | Engine Load, Engine coolant Temperature, Intake manifold absolute pressure, Engine RPM, VS, Intake air Temperature, MAF and Absolute throttle position | Storing in dataset online | No | Idrive | |
| [43] | VS, AFR, Engine RPM and Trouble Codes | Storing in dataset online | No | On-Line Service | |
| [44] | VS | Stored directly on a computer that is inside the vehicle connected to the output of the OBD-II adapter | No | Smart Tachograph | |
| [45] | Control Module Voltage | Stored directly on a computer that is inside the vehicle connected to the output of the OBD-II adapter | No | No | |
| [47] | Did not use OBD-II | Storing in dataset online | Yes | No | |
| [48] | Did not use OBD-II | Did not use | Yes | No | |
| [49] | Did not use OBD-II | Not suitable | Yes | No | |
| Mode | Description |
|---|---|
| 01 | Return the real-time ECU data. |
| 02 | Request the ECU data corresponding to the last failure. |
| 03 | Display the error codes stored in the vehicle. |
| 04 | Clear the stored error codes. |
| 05 | Return the test results of O2 sensors present on the vehicle. |
| 06 | Return the test results related to non-continuous monitoring. |
| 07 | Return test results related to continuous monitoring. |
| 08 | Require the control of the on-board systems. |
| 09 | Get vehicle information. |
| 10 | Displays the error codes with permanent status. |
| Model | Year | Motor | Transmission | Fluel | Country |
|---|---|---|---|---|---|
| Renault Sandero | 2013 | 1.0 | Manual | flexible | Brazil |
| Renault Sandero | 2014 | 1.0 | Manual | flexible | Brazil |
| Hyundai HB20 | 2015 | 1.0 | Manual | flexible | Brazil |
| Nissan Kicks | 2017 | 1.6 | Automatic | flexible | Brazil |
| Ford Fiesta | 2009 | 1.0 | Manual | flexible | Italy |
| Model | Year | Sensors |
|---|---|---|
| Renault Sandero | 2013 | 22 |
| Renault Sandero | 2014 | 22 |
| Hyundai HB20 | 2015 | 37 |
| Nissan Kicks | 2017 | 38 |
| Ford Fiesta | 2009 | 22 |
| Vehicle Model | Error | Description |
|---|---|---|
| Renault Sandero 2013 | P0420 | Catalyst System Efficiency Below Threshold (Bank 1) |
| Renault Sandero 2014 | None | - |
| Hyundai HB20 | None | - |
| Nissan Kicks | C0300 | Rear Speed Sensor Malfunction |
| Ford Fiesta | C0300 | Rear Speed Sensor Malfunction |
© 2018 by the authors. Licensee MDPI, Basel, Switzerland. This article is an open access article distributed under the terms and conditions of the Creative Commons Attribution (CC BY) license (http://creativecommons.org/licenses/by/4.0/).
Share and Cite
Silva, M.; Vieira, E.; Signoretti, G.; Silva, I.; Silva, D.; Ferrari, P. A Customer Feedback Platform for Vehicle Manufacturing Compliant with Industry 4.0 Vision. Sensors 2018, 18, 3298. https://doi.org/10.3390/s18103298
Silva M, Vieira E, Signoretti G, Silva I, Silva D, Ferrari P. A Customer Feedback Platform for Vehicle Manufacturing Compliant with Industry 4.0 Vision. Sensors. 2018; 18(10):3298. https://doi.org/10.3390/s18103298
Chicago/Turabian StyleSilva, Marianne, Elton Vieira, Gabriel Signoretti, Ivanovitch Silva, Diego Silva, and Paolo Ferrari. 2018. "A Customer Feedback Platform for Vehicle Manufacturing Compliant with Industry 4.0 Vision" Sensors 18, no. 10: 3298. https://doi.org/10.3390/s18103298
APA StyleSilva, M., Vieira, E., Signoretti, G., Silva, I., Silva, D., & Ferrari, P. (2018). A Customer Feedback Platform for Vehicle Manufacturing Compliant with Industry 4.0 Vision. Sensors, 18(10), 3298. https://doi.org/10.3390/s18103298