A Review of Microwave Thermography Nondestructive Testing and Evaluation


Abstract
:1. Introduction
2. Principle of Microwave Thermography
2.1. Microwave Based Heating
2.1.1. Dielectric Loss Heating
2.1.2. Eddy Current Heating
2.2. 3D Heat Transfer and Temperature Field
3. Types of Microwave Thermography
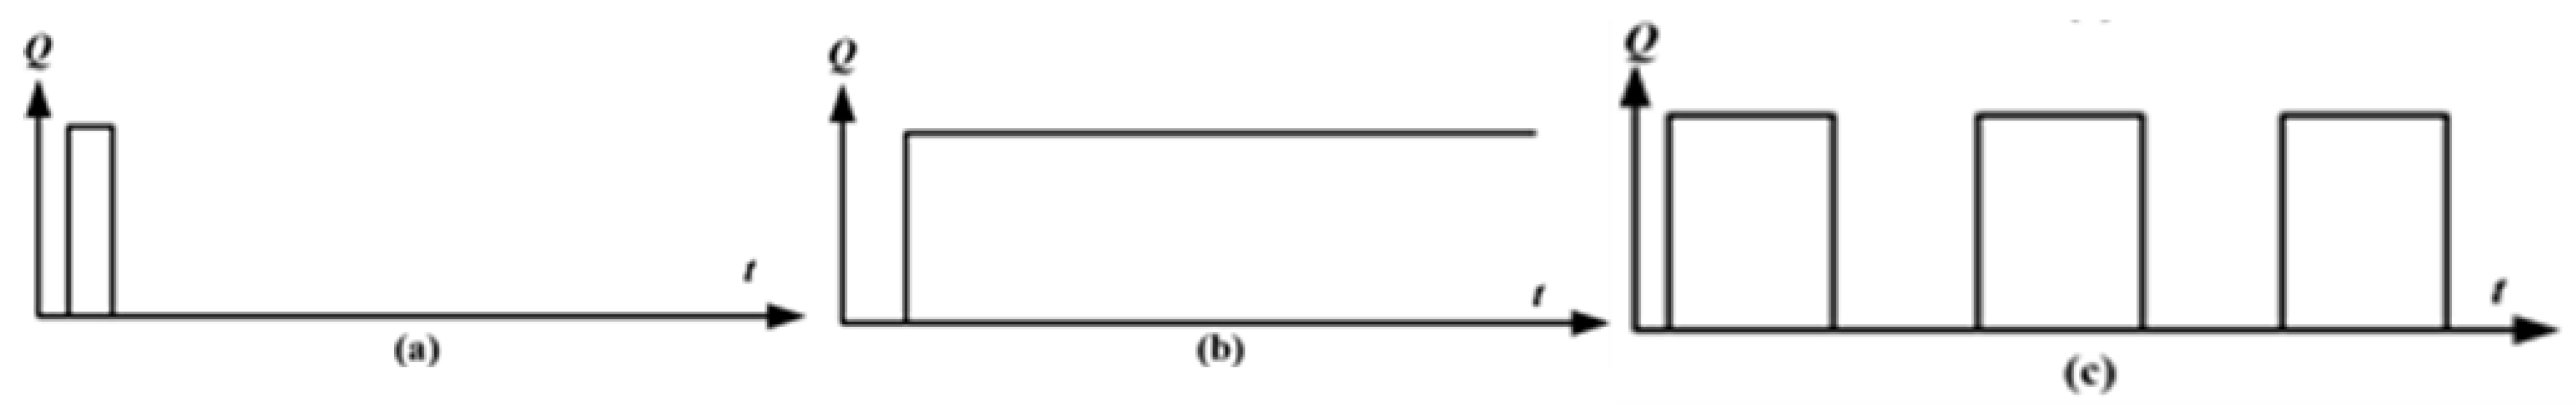
3.1. Classification of Excitation Configuration
- MPT can be fast and easily deployed. Surface temperature gradients will be introduced not only from defects, but also local variations in surface emissivity and non-uniform heating. A long inspection time is required for a thick material. In addition, the material could be damaged due to the high heating energy.
- MST is a time-resolved method and it can be used to quantify defect depth. However, the radiation from the heat source in the continuous heating process could deteriorate the temperature measurements. Also, the non-uniform heating and surface emissivity variation have adverse effects on defect evaluation.
- MLT generally required less excitation energy than MPT. MLT exhibits a higher sensitivity than MPT. The phase data can be extracted which is independent of surface emissivity and heating variations. Tests are repeated with various frequencies and it becomes a time-consuming process to detect defects with various depths. However, MLT offer a compromise with a better depth resolution.
- MPPT combines the advantages of MPT and MLT. MPPT is less sensitive to non-uniform heating and surface emissivity than MLT as only phase information can be obtained. Moreover, MPPT employed a short excitation pulse which is faster than MLT and wide frequency spectra can be obtained. However, with increasing frequency, the transferred energy is decreased with MPPT. With post processing algorithm, MPPT exhibits better detect ability and resolution than MPT for deeper defects.
3.2. Classification by Heating Style
4. Developments and Case Studies
4.1. A History of MWT Development
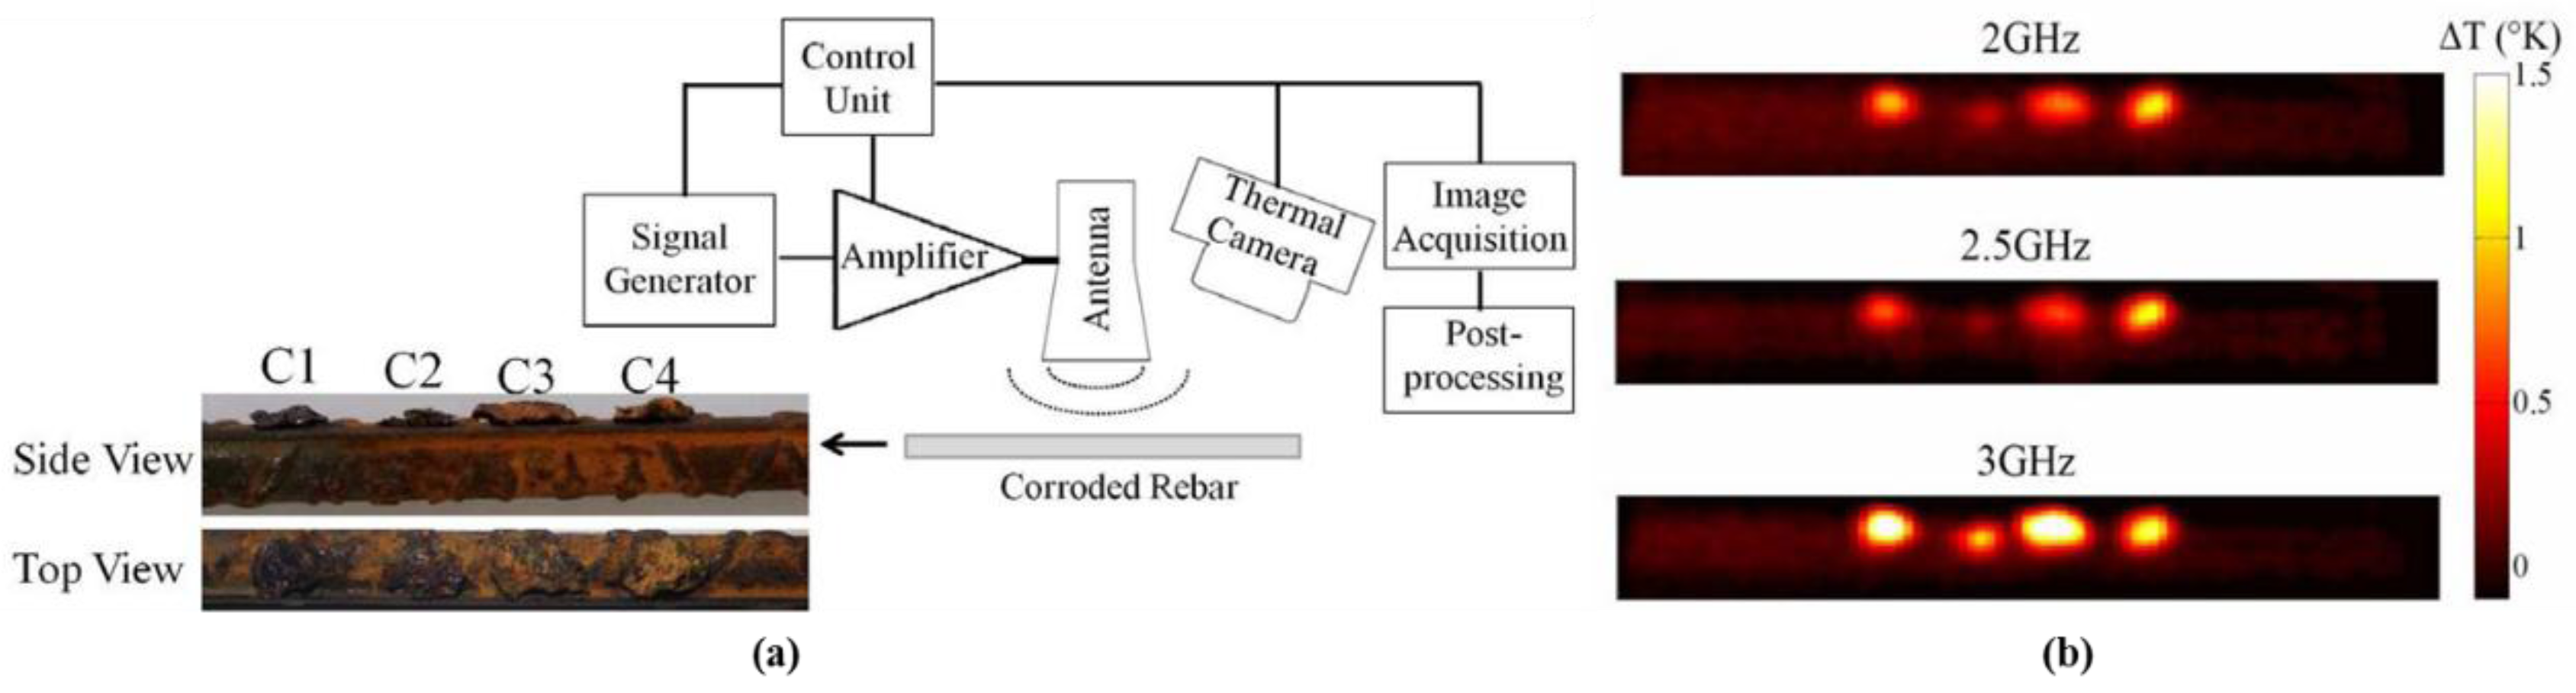
4.2. Metals and Corrosion
4.3. Dielectric Materials
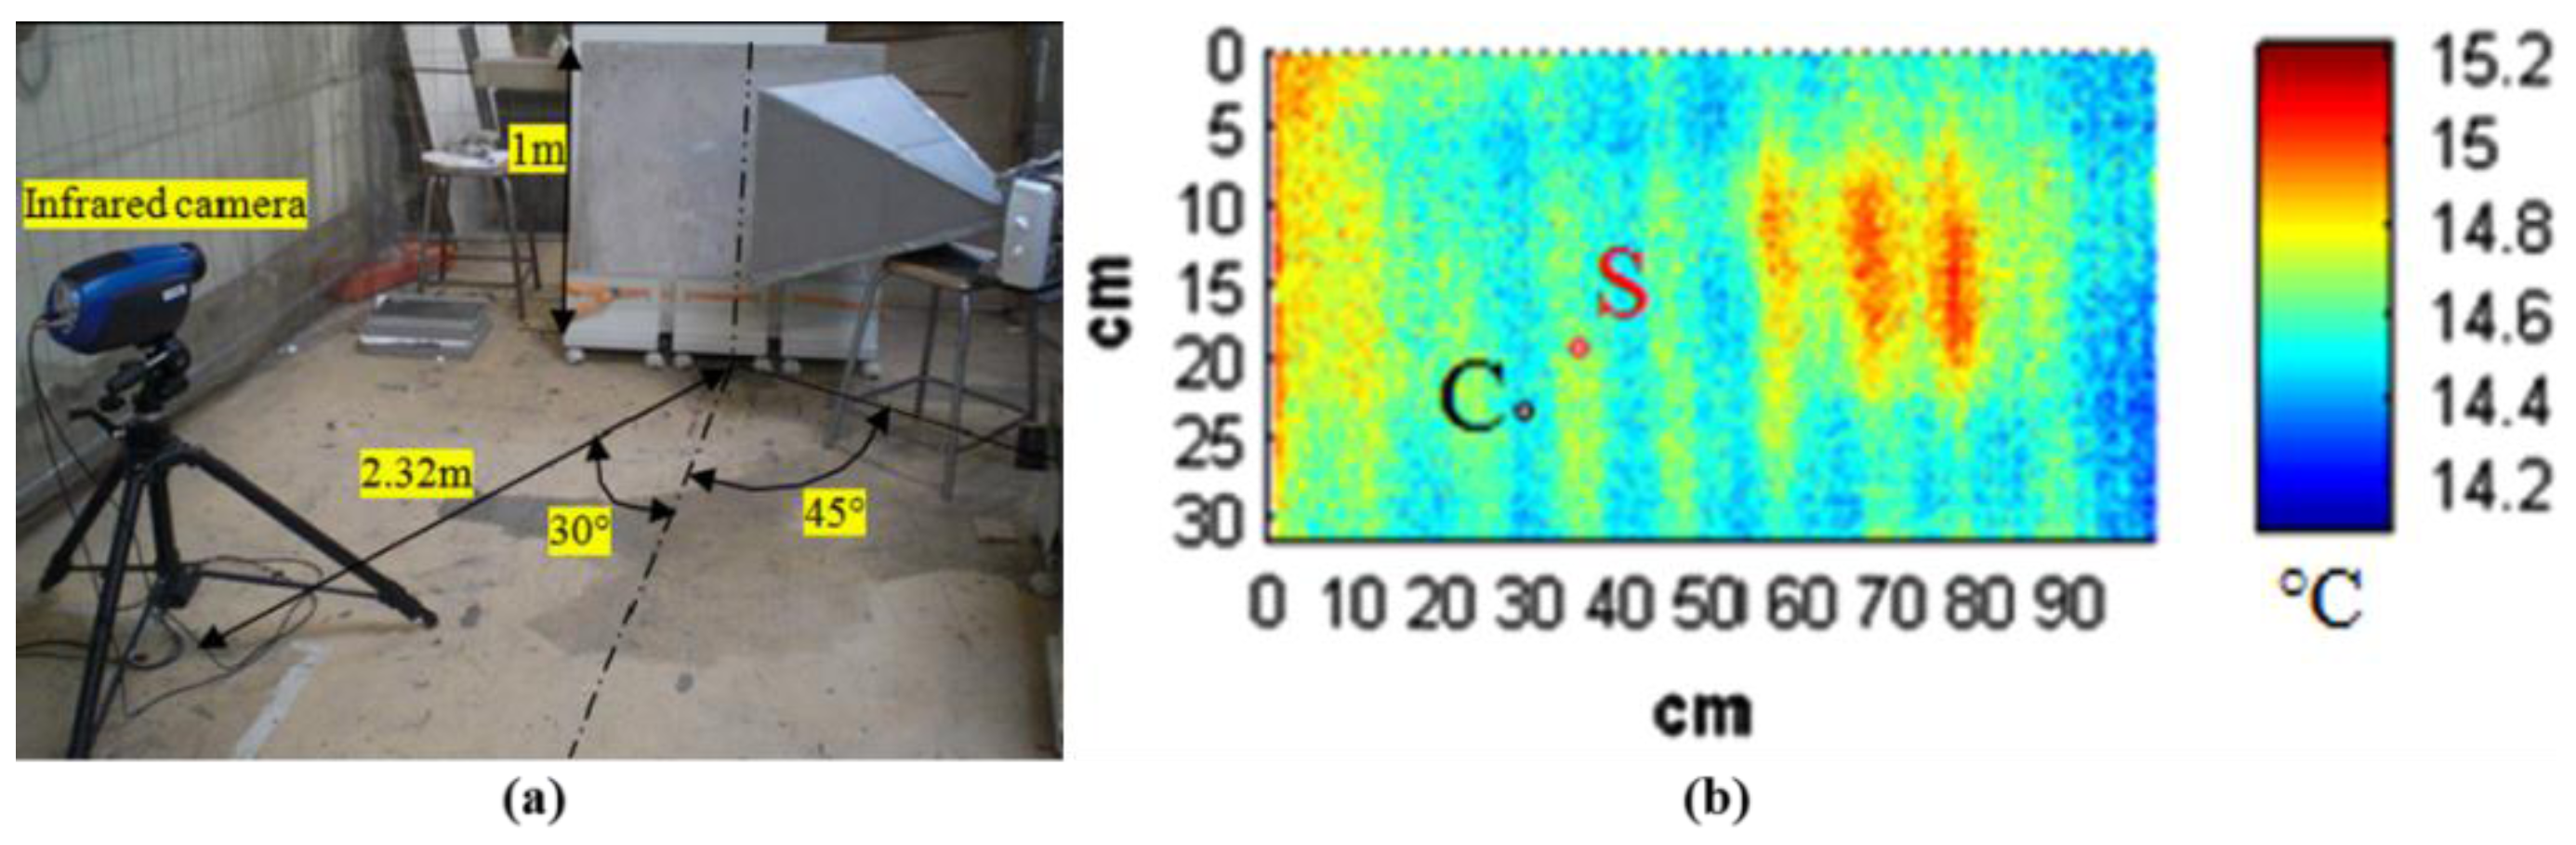
4.4. Cement and Concrete
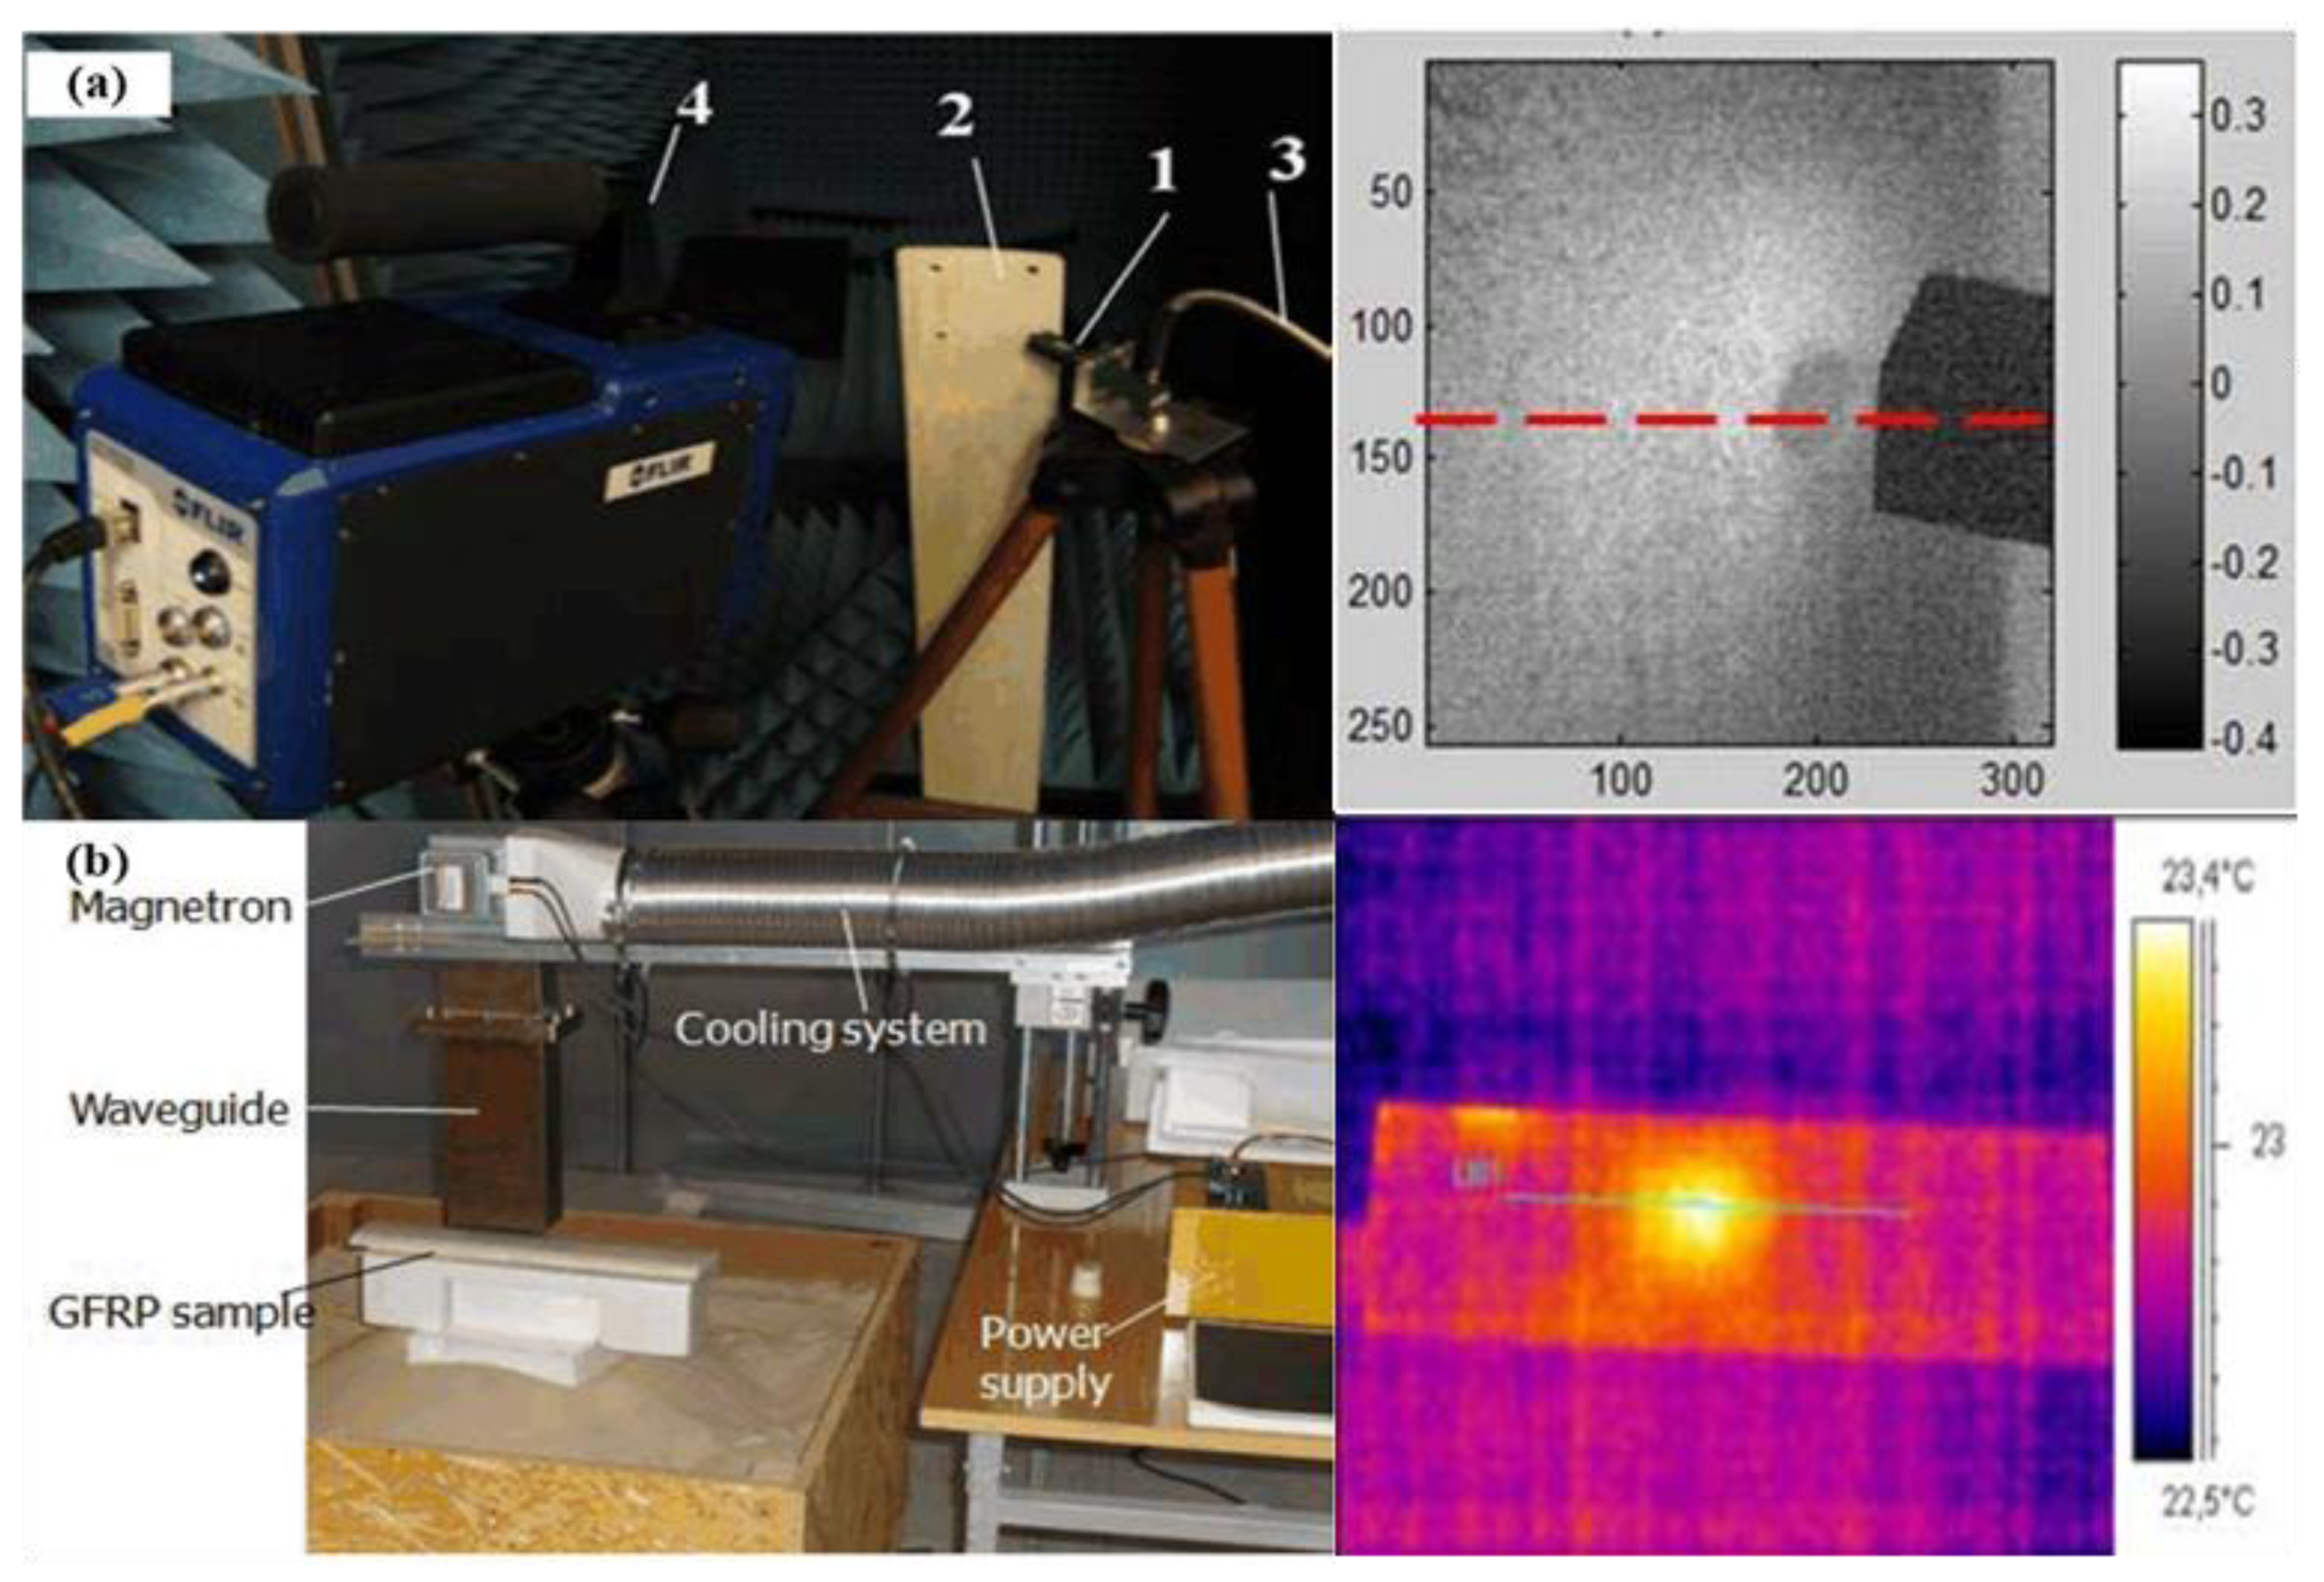
4.5. Glass Fiber Composite Structures
4.6. Carbon Fiber Composite Materials
4.7. Honeycomb Structures
4.8. Cement Based Composite
4.9. Advanced Signal and Image Processing Methods
5. Discussion
5.1. Comparison with Other Excitation Sources
- Flash/lamp: halogen or IR lamps are commonly employed for a long period in large inspection areas with an x-y scanner/robot. In all cases, the measurement surface is been illumined by light to transfer heat and to propagate inside the specimen (containing a wavelength range from the ultraviolet, visible and infrared spectrum).
- Laser: the heat is introduced into the material under test by the laser. Compared with lamps, a scan of the inspection area is needed.
- Mechanical: sound or ultrasound waves are injected by transducers. With waves propagating through the specimen, heat is produced by slapping and rubbing of the surfaces (mostly in the defect areas). Compared with optical excitation, non-uniform heating is considerably reduced and the visibility of sub-surface defects is improved.
- Induction: eddy currents are generated by an excitation coil. The penetration depth varies inversely with the operation frequency. The induction heating is limited to conductive materials. Compared with mechanical heating, heating non-uniformities have less influence in induction heating since heat is produced locally.
- Microwave: the heat is introduced into the specimen by a time-gated microwave excitation source. The sub-surface microwave absorbing features can be used for measurements (such as metal bars/fibers, water-filled areas). By analyzing the time of the thermal images, quantitative defect information can be extracted (such as depth and size).
5.2. Comparison with Other NDT Methods
5.3. Shortcomings of MWT
6. Trends
7. Conclusions
- MWT combines the advantages of microwave technology and infrared thermography. A higher heating efficiency and uniform heating pattern can be expected. A full-field, non-contact, fast detection can be performed.
- MWT can be divided into MPT, MPPT, MST and MLT. In the near future, microwave frequency modulated thermography and microwave pulsed phase thermography will be achieved.
- MWT is a fast and effective non-destructive method for material inspection, especially for water/defects identification in concrete/composite structures.
Acknowledgments
Conflicts of Interest
Abbreviations
| AHT | Abnormal heating thermography |
| ANN | Artificial neural networks |
| CFRP | Carbon fiber reinforced polymer |
| DFT | Discrete Fourier transform |
| ECLT | Eddy current lock-in thermography |
| ECPT | Eddy current pulsed thermography |
| ECPPT | Eddy current pulsed phase thermography |
| ECST | Eddy current step thermography |
| FEM | Finite element method |
| FRCM | Fiber-reinforced cement-based mortars |
| GFRP | Glass fiber reinforced polymer |
| LT | Lock-in thermography |
| MLT | Microwave lock-in thermography |
| MoM | Method of moments |
| MPT | Microwave pulsed thermography |
| MPPT | Microwave pulsed phase thermography |
| MST | Microwave step thermography |
| MT | Modulated thermography |
| MUT | Material under test |
| MWT | Microwave thermography |
| NDT | Nondestructive testing |
| PMC | Polymer matrix composites |
| PPT | Pulsed phase thermography |
| PT | Pulsed thermography |
| SHM | Structural health monitoring |
| SHT | Surface heating thermography |
| ST | Step thermography |
| VHT | Volume heating thermography |
References
- Bakht, B.; Mufti, A. Bridges: Analysis, Design, Structural Health Monitoring, and Rehabilitation; Springer: Cham, Switzerland, 2015. [Google Scholar]
- Hellier, C. Handbook of Nondestructive Evaluation; Mcgraw-hill: New York, NY, USA, 2001. [Google Scholar]
- Maldague, X.P. Introduction to NDT by active infrared thermography. Mater. Eval. 2002, 60, 1060–1073. [Google Scholar]
- Vergani, L.; Colombo, C.; Libonati, F. A review of thermographic techniques for damage investigation in composites. Fract. Struct. Integr. Ann. 2014, 8. [Google Scholar] [CrossRef]
- Sun, J.G. Analysis of Pulsed Thermography Methods for Defect Depth Prediction. J. Heat Transf. 2005, 128, 329–338. [Google Scholar] [CrossRef]
- Czichos, H. Handbook of Technical Diagnostics; Springer: Berlin, Germany, 2013; Volume 40, pp. 43–68. [Google Scholar]
- Shalin, R.E.E. Polymer Matrix Composites; Springer Science & Business Media: Berlin, Germany, 2012. [Google Scholar]
- Zalameda, J.N.; Burke, E.R.; Parker, F.R.; Seebo, J.P.; Wright, C.W.; Bly, J.B. Thermography inspection for early detection of composite damage in structures during fatigue loading. Proc. SPIE 2012, 8354. [Google Scholar] [CrossRef]
- Waugh, R.C.; Dulieu-Barton, J.M.; Quinn, S. Modelling and evaluation of pulsed and pulse phase thermography through application of composite and metallic case studies. NDT E Int. 2014, 66, 52–66. [Google Scholar] [CrossRef]
- Roche, J.M. Common tools for quantitative time-resolved pulse and step-heating thermography—Part I: Theoretical basis. Quant. Infrared Thermogr. J. 2014, 11, 43–56. [Google Scholar]
- Maldague, X.P. Theory and Practice of Infrared Technology for Nondestructive Testing; John Wiley Interscience: New York, NY, USA, 2001. [Google Scholar]
- Castanedo, C.I. Quantitative Subsurface Defect Evaluation by Pulsed Phase Thermography: Depth Retrieval with the Phase; Université Laval: Québec City, QC, Canada, 2005. [Google Scholar]
- Maldague, X.P.; Marinetti, S. Pulsed phase infrared thermography. J. Appl. Phys. 1996, 79, 2694–2698. [Google Scholar] [CrossRef]
- Yang, R.; He, Y. Optically and Non-optically Excited Thermography for Composites: A review. Infrared Phys. Technol. 2016, 75, 26–50. [Google Scholar] [CrossRef]
- Li, T.; Almond, D.P.; Rees, D.A.S. Crack imaging by scanning pulsed laser spot thermography. NDT E Int. 2011, 44, 216–225. [Google Scholar] [CrossRef]
- Wilson, J.; Tian, G.Y.; Abidin, I.Z.; Yang, S.; Almond, D. Pulsed eddy current thermography: System development and evaluation. Insight Non-Destr. Test. Cond. Monit. 2010, 52, 87–90. [Google Scholar] [CrossRef]
- Riegert, G.; Zweschper, T.; Busse, G. Eddy-current lockin-thermography: Method and its potential. J. Phys. IV Fr. 2005, 125, 587–591. [Google Scholar] [CrossRef]
- He, Y.; Tian, G.; Pan, M.; Chen, D. Eddy current pulsed phase thermography and feature extraction. Appl. Phys. Lett. 2013, 103, 084104. [Google Scholar] [CrossRef]
- Yang, R.; He, Y.; Gao, B.; Tian, G.Y.; Peng, J. Lateral heat conduction based eddy current thermography for detection of parallel cracks and rail tread oblique cracks. Measurement 2015, 66, 54–61. [Google Scholar] [CrossRef]
- He, Y.; Pan, M.; Tian, G.Y.; Chen, D.; Tang, Y.; Zhang, H. Eddy current pulsed phase thermography for subsurface defect quantitatively evaluation. Appl. Phys. Lett. 2013, 103, 144108. [Google Scholar] [CrossRef]
- He, Y.; Pan, M.; Chen, D.; Tian, G.Y.; Zhang, H. Eddy current step heating thermography for quantitatively evaluation. Appl. Phys. Lett. 2013, 103, 194101. [Google Scholar] [CrossRef]
- He, Y.; Tian, G.; Pan, M.; Chen, D. Impact evaluation in carbon fiber reinforced plastic (CFRP) laminates using eddy current pulsed thermography. Compos. Struct. 2014, 109, 1–7. [Google Scholar] [CrossRef]
- Zhang, H.; Gao, B.; Tian, G.Y.; Woo, W.L.; Bai, L. Metal defects sizing and detection under thick coating using microwave NDT. NDT E Int. 2013, 60, 52–61. [Google Scholar] [CrossRef]
- Qaddoumi, N.N.; Saleh, W.M.; Abou-Khousa, M. Innovative Near-Field Microwave Nondestructive Testing of Corroded Metallic Structures Utilizing Open-Ended Rectangular Waveguide Probes. IEEE Trans. Instrum. Meas. 2007, 56, 1961–1966. [Google Scholar] [CrossRef]
- Meredith, R. Engineers’ Handbook of Industrial Microwave Heating; The Institution of Electrical Engineers: London, UK, 1998. [Google Scholar]
- Wyckhuyse, A.; Maldague, X. A Study of Wood Inspection by Infrared Thermography, Part II: Thermography for Wood Defects Detection. Res. Nondestruct. Eval. 2001, 13, 13–22. [Google Scholar] [CrossRef]
- Balageas, D.; Lemistre, M.; Levesque, P. Mine detection using the EMIR® method-Improved configuration using a mobile detection system. In Proceedings of the 7th International Conference on Quantitative Infrared Thermography (QIRT), Bordeaux, France, 7–11 July 2004. [Google Scholar]
- Swiderski, W.; Hłosta, P.; Szugajew, L.; Usowicz, J. Microwave enhancement on thermal detection of buried objects. In Proceedings of the 11th International Conference on Quantitative InfraRed Thermography, Naples, Italy, 11–14 June 2012. [Google Scholar]
- Vinson, J.R. Adhesive bonding of polymer composites. Polym. Eng. Sci. 1989, 29, 1325–1331. [Google Scholar] [CrossRef]
- Yang, R.; He, Y.; Zhang, H. Progress and Trends in Nondestructive Testing and Evaluation for Wind Turbine Composite Blade. Renew. Sustain. Energy Rev. 2016, 60, 1225–1250. [Google Scholar] [CrossRef]
- Ibarra-Castanedo, C.; Maldague, X. Review of pulse phase thermography. Proc. SPIE 2015, 9485. [Google Scholar] [CrossRef]
- Kylili, A.; Fokaides, P.A.; Christou, P.; Kalogirou, S.A. Infrared thermography (IRT) applications for building diagnostics: A review. Appl. Energy 2014, 134, 531–549. [Google Scholar] [CrossRef]
- Bagavathiappan, S.; Lahiri, B.B.; Saravanan, T.; Philip, J.; Jayakumar, T. Infrared thermography for condition monitoring—A review. Infrared Phys. Technol. 2013, 60, 35–55. [Google Scholar] [CrossRef]
- Yang, B.; Zhang, L.; Zhang, W.; Ai, Y. Non-destructive testing of wind turbine blades using an infrared thermography: A review. In Proceedings of the International Conference on Materials for Renewable Energy and Environment, Chengdu, China, 19–21 August 2013; pp. 407–410. [Google Scholar]
- Ibarra-Castanedo, C.; Maldague, X. Pulsed phase thermography reviewed. Quant. Infrared Thermogr. J. 2004, 1, 47–70. [Google Scholar] [CrossRef]
- Hung, Y.; Chen, Y.S.; Ng, S.; Liu, L.; Huang, Y.; Luk, B.; Ip, R.; Wu, C.; Chung, P. Review and comparison of shearography and active thermography for nondestructive evaluation. Mater. Sci. Eng. R Rep. 2009, 64, 73–112. [Google Scholar] [CrossRef]
- Omar, M.A.; Zhou, Y. A quantitative review of three flash thermography processing routines. Infrared Phys. Technol. 2008, 51, 300–306. [Google Scholar] [CrossRef]
- Ghosh, K.K.; Karbhari, V.M. A critical review of infrared thermography as a method for non-destructive evaluation of FRP rehabilitated structures. Int. J. Mater. Prod. Technol. 2006, 25, 241–266. [Google Scholar] [CrossRef]
- Vavilov, V.P.; Burleigh, D.D. Review of pulsed thermal NDT: Physical principles, theory and data processing. NDT E Int. 2015, 73, 28–52. [Google Scholar] [CrossRef]
- Banerjee, D.; Chattopadhyay, S.; Tuli, S. Infrared thermography in material research—A review of textile applications. Indian J. Fiber Text. Res. 2013, 38, 427–437. [Google Scholar]
- Usamentiaga, R.; Venegas, P.; Guerediaga, J.; Vega, L.; Molleda, J.; Bulnes, F.G. Infrared thermography for temperature measurement and non-destructive testing. Sensors 2014, 14, 12305–12348. [Google Scholar] [CrossRef] [PubMed]
- Meola, C.; Carlomagno, G.M. Application of infrared thermography to adhesion science. J. Adhes. Sci. Technol. 2006, 20, 589–632. [Google Scholar] [CrossRef]
- Meola, C.; Carlomagno, G.M. Recent advances in the use of infrared thermography. Meas. Sci. Technol. 2004, 15, R27. [Google Scholar] [CrossRef]
- Yang, R.; Zhang, H.; Li, T.; He, Y. An investigation and review into microwave thermography for NDT and SHM. In Proceedings of the IEEE Far East NDT New Technology & Application Forum, Zhuhai, China, 28–31 May 2015; pp. 133–137. [Google Scholar]
- He, Y.; Yang, R.; Zhang, H.; Zhou, D.; Wang, G. Volume or inside heating thermography using electromagnetic excitation for advanced composite materials. Int. J. Thermal Sci. 2017, 111, 41–49. [Google Scholar] [CrossRef]
- Meredith, R. Engineers’ Handbook of Industrial Microwave Heating [Book Review]. Power Eng. 1999, 13, 3. [Google Scholar]
- Vrana, J.; Goldammer, M.; Bailey, K.; Rothenfusser, M.; Arnold, W. Induction and Conduction Thermography: Optimizing the Electromagnetic Excitation towards Application. AIP Conf. Proc. 2009, 1096, 518–525. [Google Scholar]
- Shao, K.; Lavers, J.D. A skin depth-independent finite element method for Eddy current problems. IEEE Trans. Magn. 1986, 22, 1248–1250. [Google Scholar] [CrossRef]
- Niliot, C.L.; Gallet, P. Infrared thermography applied to the resolution of inverse heat conduction problems: Recovery of heat line sources and boundary conditions. Revue Générale Thermique 1998, 37, 629–643. [Google Scholar] [CrossRef]
- Salazar, A. Energy propagation of thermal waves. Eur. J. Phys. 2006, 27, 1349. [Google Scholar] [CrossRef]
- Liu, J.; Yang, W.; Dai, J. Research on thermal wave processing of lock-in thermography based on analyzing image sequences for NDT. Infrared Phys. Technol. 2010, 53, 348–357. [Google Scholar] [CrossRef]
- Osiander, R.; Spicer, J.W. Time-resolved infrared radiometry with step heating. A review. Revue Générale Thermique 1998, 37, 680–692. [Google Scholar] [CrossRef]
- Yang, R.; He, Y.; Gao, B.; Tian, G.Y. Inductive pulsed phase thermography for reducing or enlarging the effect of surface emissivity variation. Appl. Phys. Lett. 2014, 105, 184103. [Google Scholar] [CrossRef]
- Yang, R.; He, Y. Eddy current pulsed phase thermography considering volumetric induction heating for delamination evaluation in carbon fiber reinforced polymers. Appl. Phys. Lett. 2015, 106, 234103. [Google Scholar] [CrossRef]
- He, Y.; Yang, R. Eddy Current Volume Heating Thermography and Phase Analysis for Imaging Characterization of Interface Delamination in CFRP. IEEE Trans. Ind. Inf. 2015, 11, 1287–1297. [Google Scholar] [CrossRef]
- Keo, S.-A.; Defer, D.; Breaban, F.; Brachelet, F. Comparison between Microwave Infrared Thermography and CO2 Laser Infrared Thermography in Defect Detection in Applications with CFRP. Mater. Sci. Appl. 2013, 4, 600–605. [Google Scholar]
- Cheng, L.; Tian, G.Y.; Szymanik, B. Feasibility studies on microwave heating for nondestructive evaluation of glass fibre reinforced plastic composites. In Proceedings of the IEEE International Instrumentation and Measurement Technology Conference, Hangzhou, China, 10–12 May 2011; pp. 1–6. [Google Scholar]
- Foudazi, A.; Donnell, K.M.; Ghasr, M.T. Application of Active Microwave Thermography to delamination detection. In Proceedings of the IEEE International Instrumentation and Measurement Technology Conference, Montevideo, Uruguay, 12–15 May 2014; pp. 1567–1571. [Google Scholar]
- Levesque, P.; Deom, A.; Balageas, D. Non destructive evaluation of absorbing materials using microwave stimulated infrared thermography. In Review of Progress in Quantitative Nondestructive Evaluation; Springer: Berlin, Germany, 1993; pp. 649–654. [Google Scholar]
- D’Ambrosio, G.; Massa, R.; Migliore, M.D.; Cavaccini, G.; Ciliberto, A.; Sabatino, C. Microwave excitation for thermographic NDE: An experimental study and some theoretical evaluations. Mater. Eval. 1995, 53, 502–508. [Google Scholar]
- Sakagami, T.; Kubo, S.; Komiyama, T.; Suzuki, H. Proposal for a new thermographic nondestructive testing technique using microwave heating. Proc. SPIE 1999, 3700. [Google Scholar] [CrossRef]
- Foudazi, A.; Ghasr, M.T.; Donnell, K.M. Characterization of Corroded Reinforced Steel Bars by Active Microwave Thermography. IEEE Trans. Instrum. Meas. 2015, 64, 2583–2585. [Google Scholar] [CrossRef]
- Pieper, D.; Donnell, K.M.; Ghasr, M.T.; Kinzel, E.C. Integration of microwave and thermographic NDT methods for corrosion detection. AIP Conf. Proc. 2014, 1581, 1560–1567. [Google Scholar]
- Foudazi, A.; Ghasr, M.T.; Donnell, K.M. Application of active microwave thermography to inspection of carbon fiber reinforced composites. In Autotestcon; IEEE: Washington, DC, USA, 2014; pp. 318–322. [Google Scholar]
- Keo, S.A.; Brachelet, F.; Breaban, F.; Defer, D. Steel detection in reinforced concrete wall by microwave infrared thermography. NDT E Int. 2014, 62, 172–177. [Google Scholar] [CrossRef]
- Osiander, R.; Spicer, J.W.M.; Murphy, J.C. Thermal imaging of subsurface microwave absorbers in dielectric materials. Proc. SPIE 1994, 2245. [Google Scholar] [CrossRef]
- Bowen, M.W.; Osiander, R.; Spicer, J.W.M.; Murphy, J.C. Thermographic Detection of Conducting Contaminants in Composite Materials Using Microwave Excitation. In Review of Progress in Quantitative Nondestructive Evaluation; Thompson, D.O., Chimenti, D.E., Eds.; Springer US: Boston, MA, 1995; Volume 14, pp. 453–460. [Google Scholar]
- Sikora, R.; Chady, T.; Szymanik, B. Infrared thermographic testing of composite materials with adhesive joints. In Proceedings of the 18th World Conference on Nondestructive Testing, Durban, South Africa, 16–20 April 2012; pp. 1–8. [Google Scholar]
- Lee, H.; Galstyan, O.; Babajanyan, A.; Friedman, B.; Berthiau, G.; Kim, J.; Lee, K. Characterization of anisotropic electrical conductivity of carbon fiber composite materials by a microwave probe pumping technique. J. Compos. Mater. 2015, 50. [Google Scholar] [CrossRef]
- Foudazi, A.; Edwards, C.A.; Ghasr, M.T.; Donnell, K.M. Active Microwave Thermography for Defect Detection of CFRP-Strengthened Cement-Based Materials. IEEE Trans. Instrum. Meas. 2016, 65, 1–9. [Google Scholar] [CrossRef]
- Osiander, R.; Spicer, J.W.M.; Murphy, J.C. Microwave-source time-resolved infrared radiometry for monitoring of curing and deposition processes. Proc. SPIE 1995, 2473. [Google Scholar] [CrossRef]
- Swiderski, W.; Szabra, D.; Wojcik, J. Nondestructive evaluation of aircraft components by thermography using different heat sources. Proceeding of the QIRT Conference, Dubrovnik, Croatia, 24–27 September 2002; pp. 78–84. [Google Scholar]
- Foudazi, A.; Mehdipour, I.; Donnell, K.M.; Khayat, K.H. Evaluation of steel fiber distribution in cement-based mortars using active microwave thermography. Mater. Struct. 2016, 49, 5051–5065. [Google Scholar] [CrossRef]
- Galietti, U.; Palumbo, D.; Calia, G.; Pellegrini, M. Non destructive evaluation of composite materials with new thermal methods. In Proceedings of the 15th European Conference on Composite Materials, Venice, Italy, 24–28 June 2012. [Google Scholar]
- Palumbo, D.; Ancona, F.; Galietti, U. Quantitative damage evaluation of composite materials with microwave thermographic technique: Feasibility and new data analysis. Meccanica 2015, 50, 443–459. [Google Scholar] [CrossRef]
- Usamentiaga, R.; Venegas, P.; Guerediaga, J.; Vega, L.; López, I. Feature extraction and analysis for automatic characterization of impact damage in carbon fiber composites using active thermography. NDT E Int. 2013, 54, 123–132. [Google Scholar] [CrossRef]
- Pickering, S.; Almond, D. Matched excitation energy comparison of the pulse and lock-in thermography NDE techniques. NDT E Int. 2008, 41, 501–509. [Google Scholar] [CrossRef]
- Gao, B.; Woo, W.L.; Tian, G.Y. Electromagnetic Thermography Nondestructive Evaluation: Physics-based Modeling and Pattern Mining. Sci. Rep. 2016, 6, 25480. [Google Scholar] [CrossRef] [PubMed]
- Gao, B.; He, Y.; Woo, W.L.; Tian, G.Y.; Liu, J.; Hu, Y. Multidimensional Tensor-Based Inductive Thermography With Multiple Physical Fields for Offshore Wind Turbine Gear Inspection. IEEE Trans. Ind. Electron. 2016, 63, 6305–6315. [Google Scholar] [CrossRef]
- Shankar, V.; Mohammadian, A.H. A Time-Domain, Finite-Volume Treatment for the Maxwell Equations. J. Microw. Power Electromagn. Energy 1990, 128–145. [Google Scholar] [CrossRef]
- Harms, P.H.; Chen, Y.; Mittra, R.; Shimony, Y. Numerical Modeling of Microwave Heating Systems. J. Microw. Power Electromagn. Energy 1996, 31, 114–121. [Google Scholar] [CrossRef]
- Vegh, V.; Turner, I.W. A hybrid technique for computing the power distribution generated in a lossy medium during microwave heating. J. Comput. Appl. Math. 2006, 197, 122–140. [Google Scholar] [CrossRef]
- Liu, T.; Zhang, W.; Yan, S. A novel image enhancement algorithm based on stationary wavelet transform for infrared thermography to the de-bonding defect in solid rocket motors. Mech. Syst. Signal Process. 2015, 62–63, 366–380. [Google Scholar] [CrossRef]
- Cheng, L.; Gao, B.; Tian, G.Y.; Woo, W.; Berthiau, G. Impact Damage Detection and Identification using Eddy Current Pulsed Thermography through Integration of PCA and ICA. IEEE Sens. J. 2014, 14, 1655–1663. [Google Scholar] [CrossRef]
- Liang, T.; Ren, W.; Tian, G.Y.; Elradi, M.; Gao, Y. Low energy impact damage detection in CFRP using eddy current pulsed thermography. Compos. Struct. 2016, 143, 352–361. [Google Scholar] [CrossRef]
- Edis, E.; Flores-Colen, I.; de Brito, J. Quasi-quantitative infrared thermographic detection of moisture variation in facades with adhered ceramic cladding using principal component analysis. Build. Environ. 2015, 94, 97–108. [Google Scholar] [CrossRef]
- Gao, B.; Woo, W.L.; He, Y.; Tian, G.Y. Unsupervised sparse pattern diagnostic of defects with inductive thermography imaging system. IEEE Trans. Ind. Inform. 2016, 12, 371–383. [Google Scholar] [CrossRef]
- Wang, H.; Hsieh, S.J.; Peng, B.; Zhou, X. Non-metallic coating thickness prediction using artificial neural network and support vector machine with time resolved thermography. Infrared Phys. Technol. 2016, 77, 316–324. [Google Scholar] [CrossRef]
- Zou, H.; Huang, F. A novel intelligent fault diagnosis method for electrical equipment using infrared thermography. Infrared Phys. Technol. 2015, 73, 29–35. [Google Scholar] [CrossRef]
- Gao, B.; Yin, A.; Tian, G.; Woo, W.L. Thermography spatial-transient-stage mathematical tensor construction and material property variation track. Int. J. Therm. Sci. 2014, 85, 112–122. [Google Scholar] [CrossRef]
- Abdelniser, M.; Abdulbaset, A.; Ramahi, O.M. Reducing Sweeping Frequencies in Microwave NDT Employing Machine Learning Feature Selection. Sensors 2016, 16, 559. [Google Scholar]


| Techniques | Strength | Limitation |
|---|---|---|
| Microwave pulsed thermography [13] | Full-field, high resolution, high sensitivity, good visibility, quantification, fast, easy deployment | Small depth, long time for thick material, emissivity and non-uniform heating dependence, high power |
| Microwave step thermography [52] | Full-field, high resolution, high sensitivity, good visibility, quantification, fast, easy deployment, time-resolved | The radiation from heat source in the continuous heating process could have a negative influence on temperature measurements of MUT, emissivity, and non-uniform heating dependence |
| Microwave lock-in thermography [51] | Full-field, high resolution, higher sensitivity, good visibility, quantification, low power, emissivity independence, elimination of non-uniform heating | Compromise between depth and depth resolution, time-consuming, |
| Microwave pulsed phase thermography | Full-field, high resolution, high sensitivity, good visibility, quantification, fast, emissivity independence, elimination of non-uniform heating, greater depth and resolution, better detectability | Post signal processing, energy attenuation with frequency |
| Hardware Development | Software Development | Experimental Study | ||||||
|---|---|---|---|---|---|---|---|---|
| Operation Frequency | Antenna/Sensor | Power | IR Camera | Simulation Study | Sampling Software | Signal Processing | Material under Test | Defects |
| 8 GHz to 18 GHz [59] | Horns and parabolic antennas [59] | 100 W [59] | AGEMA 782 LWB [59] | Not available | CEDIP PTR-9010 system [59] | Normalized the infrared images pixel by pixel [59] | Glass-epoxy composites [59] | Delaminations |
| 2.45 GHz [60,61] | Magnetron [60] | 600 W–1700 W [60] | AGEMA AGA 880 [60] | Influence of defect permittivity and depth has been estimated [60]. | HP 8757 C network analyzer [60] | Open cavity applicator and large cavity applicator have been designed [60] | Kevlar or fiberglass slabs and sandwich samples [60] | Defects |
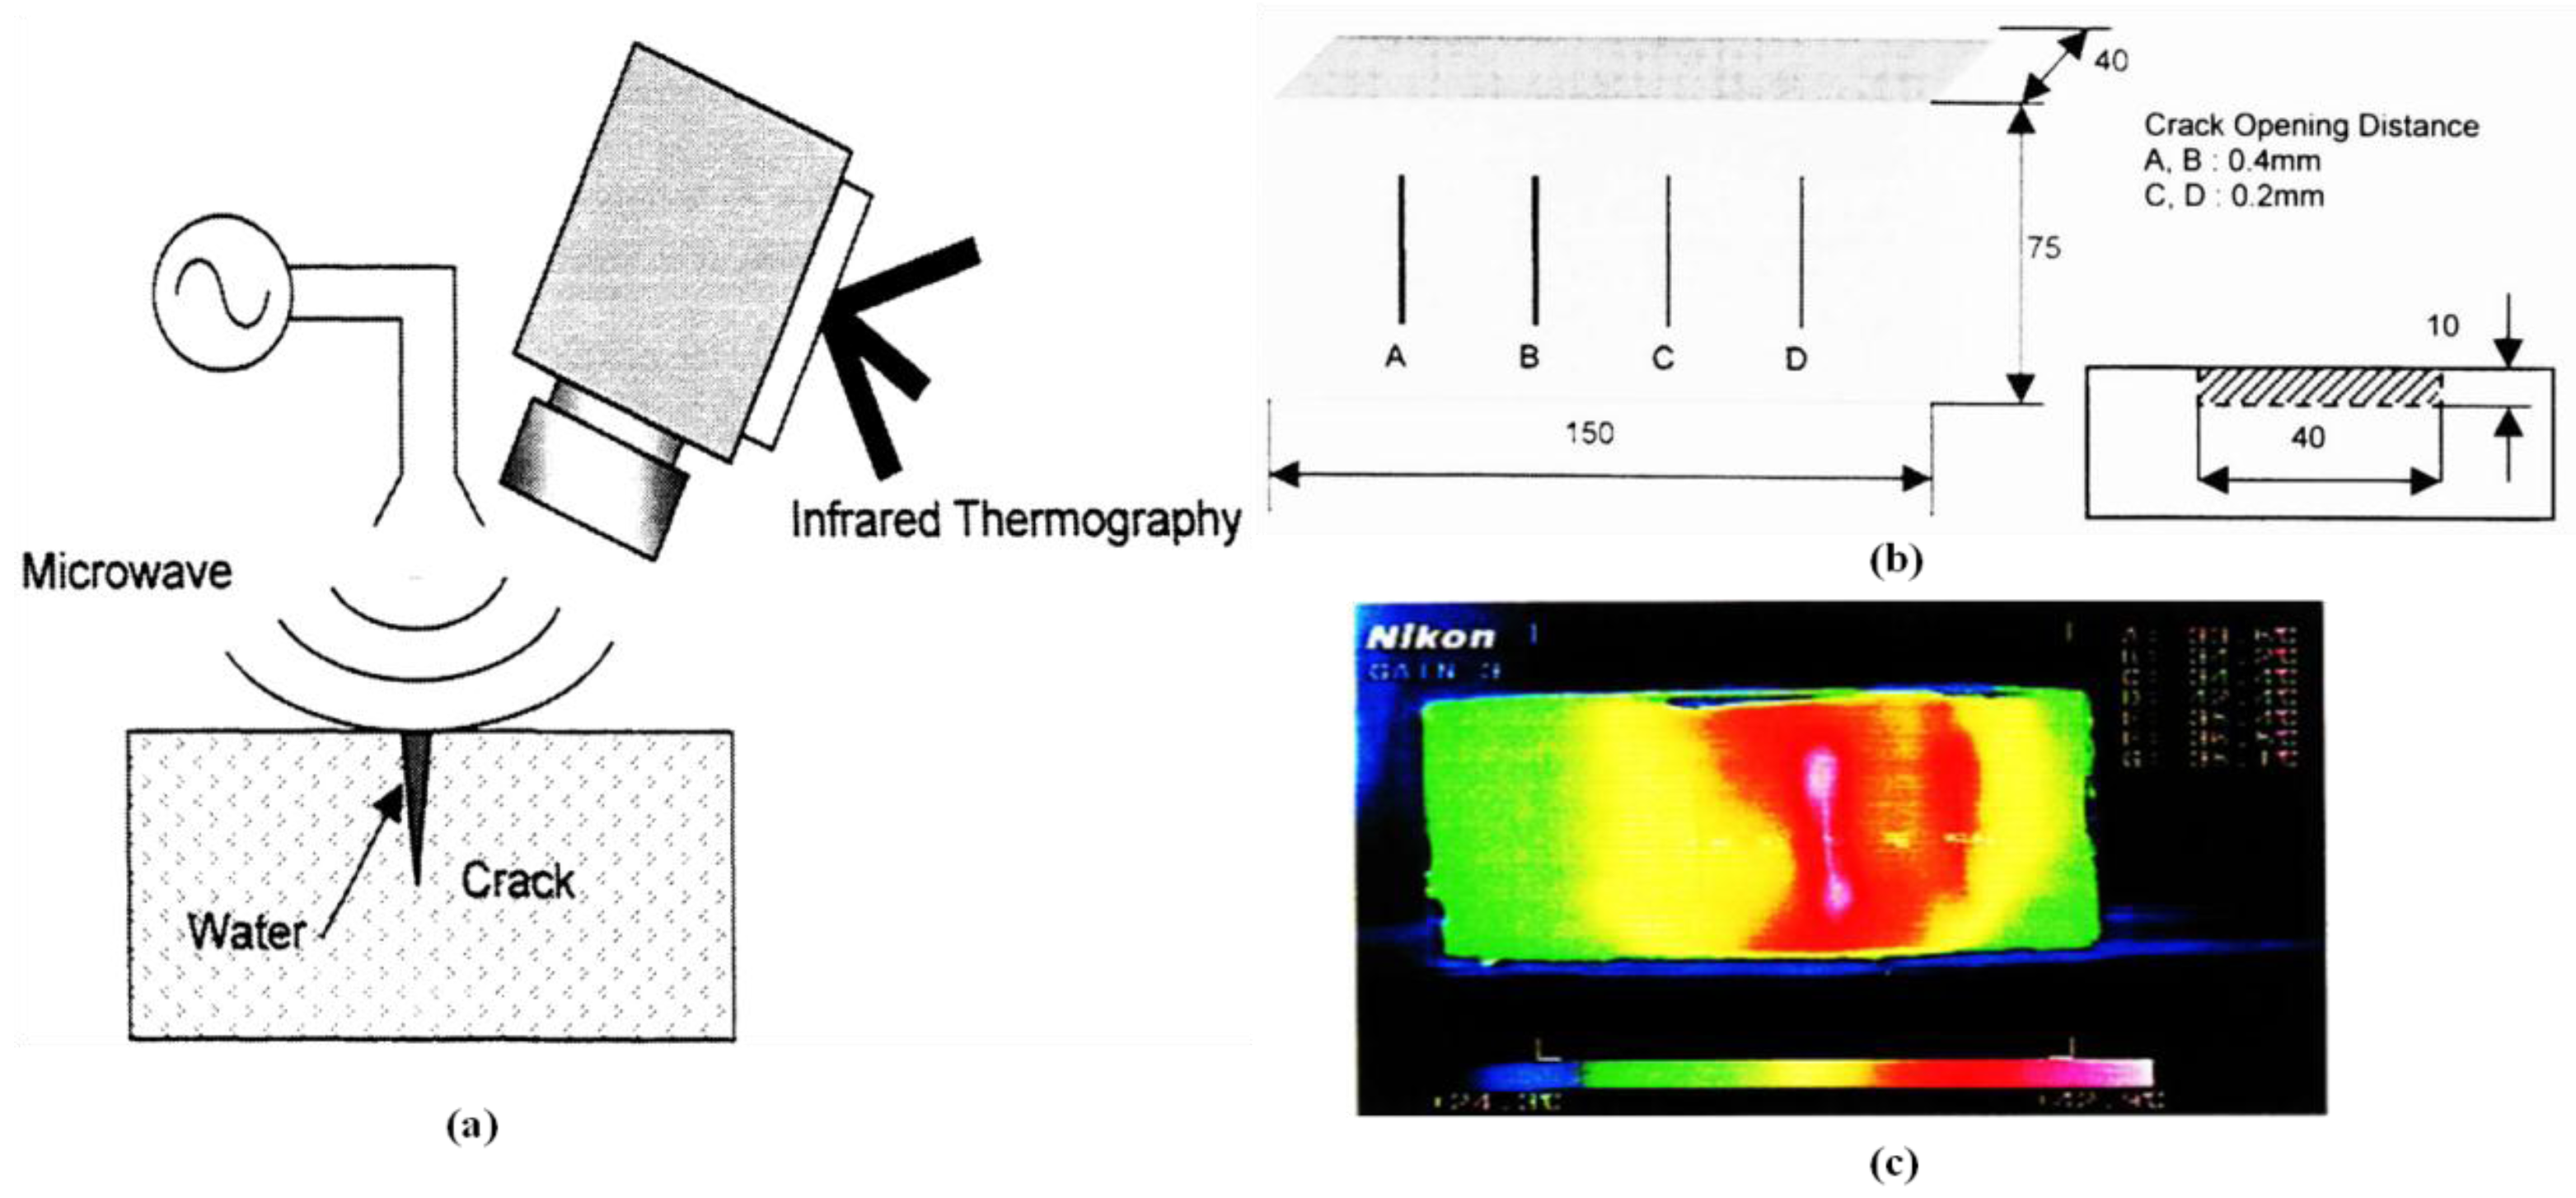
| Microwave oven [61] | 1400 W [61] | Nikon LAIRD-3 [61] | Not available | Not available | Thermal image was taken at 20 s [61] | Mortar block [61] | Cracks | |
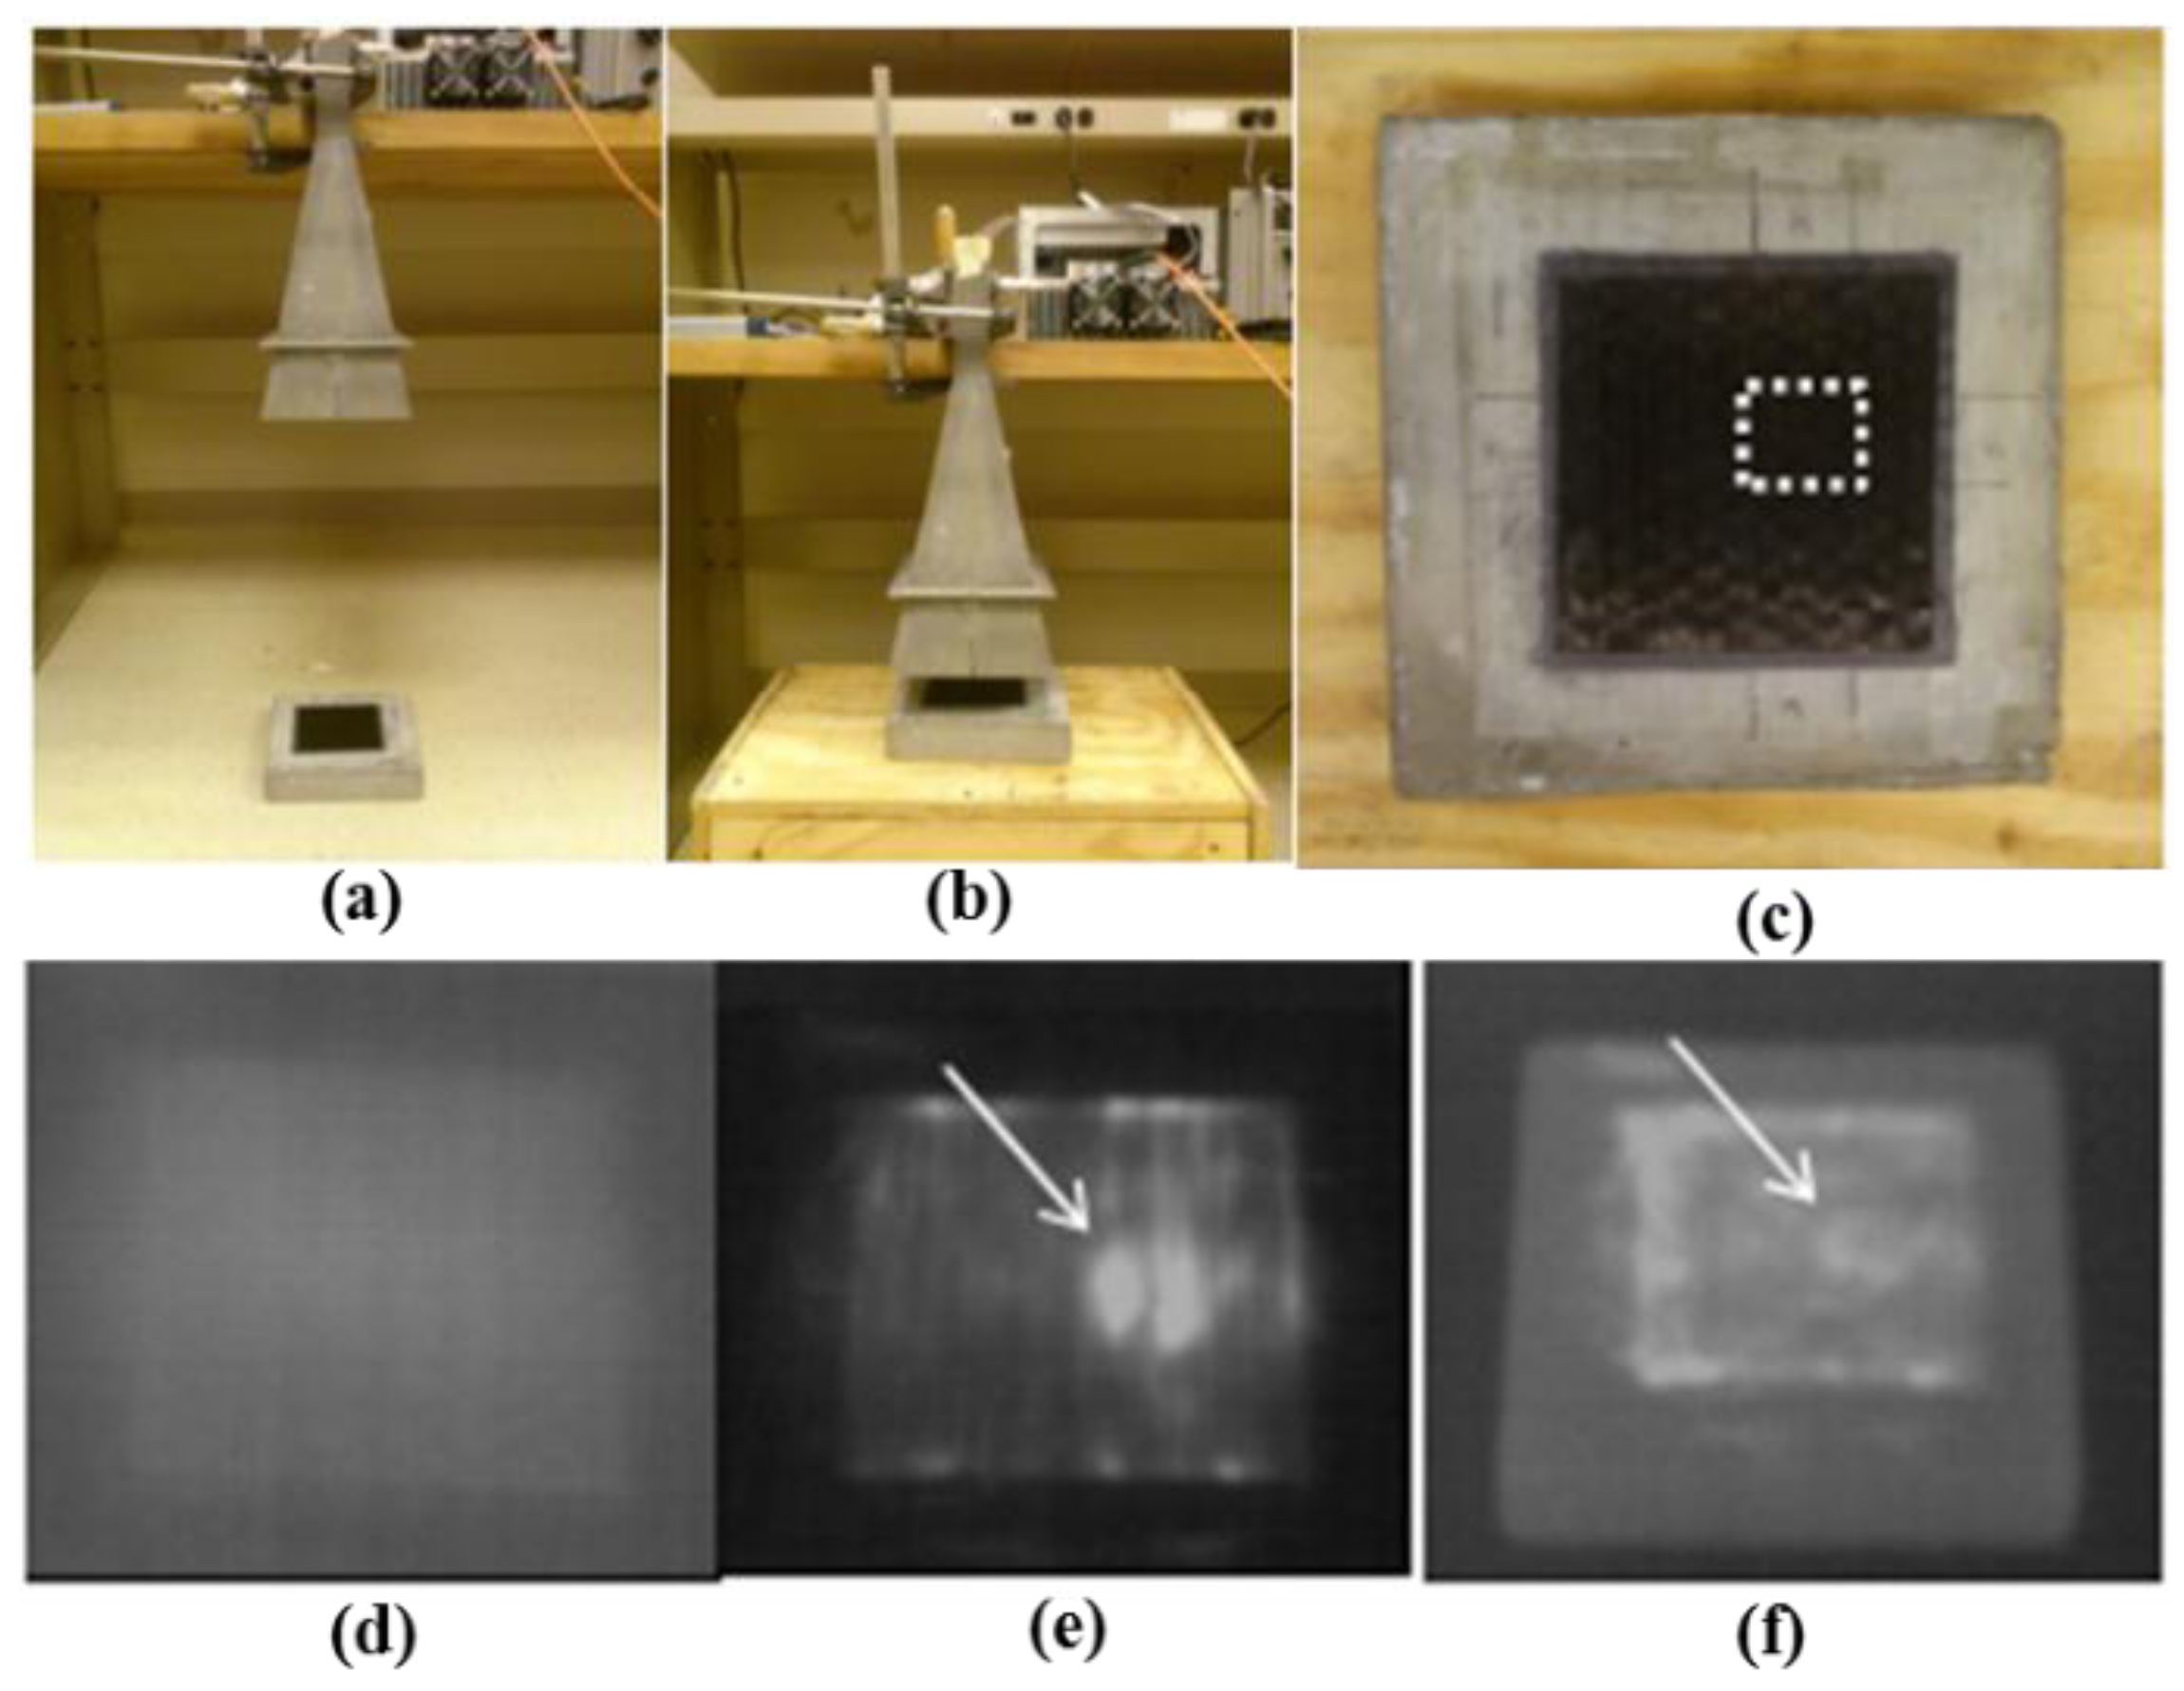
| 2 GHz to 3 GHz [62], 2.45 GHz [63,64] | TEM horn antenna [62,64] | 50 W [62,64], 10 W [63] | DRS Tamarisk 320 [62,64], FLIR SC 500 [63] | CST Microwave Studio and MPHYSICS Studio [62]. | Not available | The surface thermal profile was taken after 10 s of heating [62]. The surface thermal profile was taken after 5 s and 15 s of heating [63]. | Reinforced steel bars [62], Rebar in air [63]; Embedded in cement [63,65], CFRP [64] | Corrosion, delaminations, debonding and crack |
| 2.45 GHz [65] | Magnetron generated horn antenna [65] | 600 W [65] | Not available | Not available | ALTAIR software | A contrast algorithm is used to analyze the thermogram series with 5 min of heating [65]. | Steel bar corrosion | |
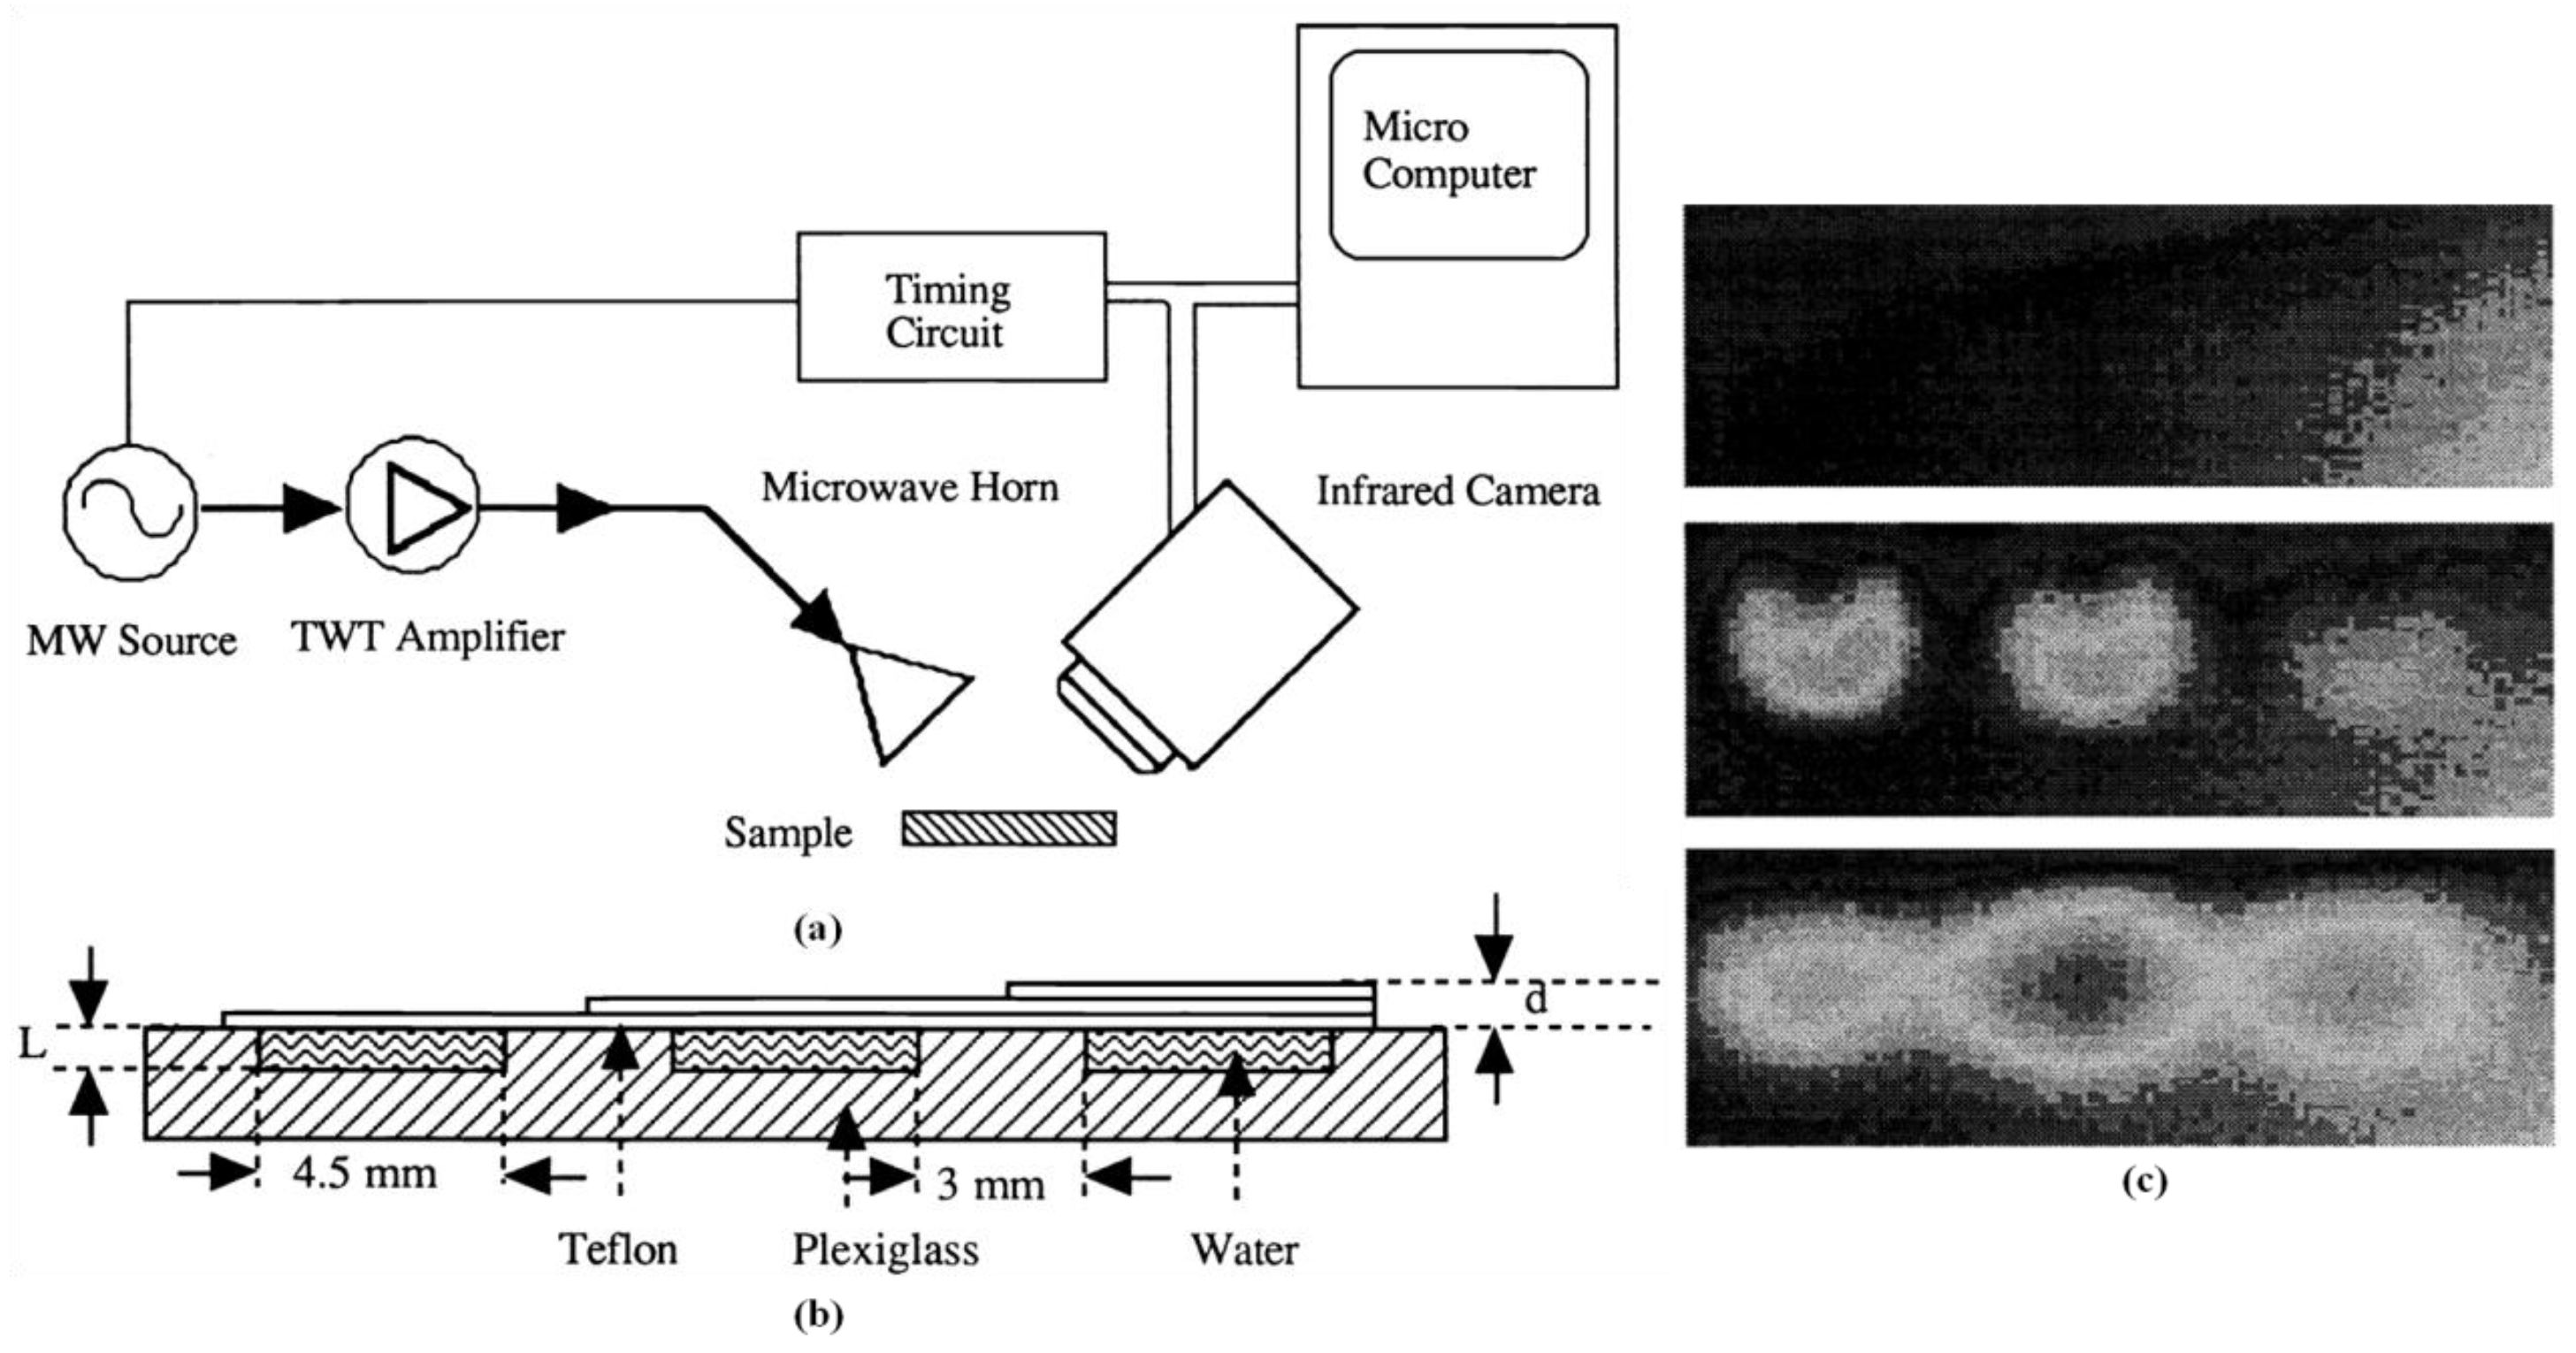
| 5 GHz to 10 GHz [66] | Horn antenna [66] | 2.3 W [66,67] | Mikron 6T61 and SantaBarbara IR camera [66] | Not available | Macintosh microcompute [66] | A 2.7 s microwave pulse was used [66] | Multilayered plexiglass-water-teflon specimen [66] | Debonding |
| 9 GHz [67] | A single flare horn antenna [67] | Santa Barbara Focalplane [67] | Not available | LabVIEW | The surface thermal profile was taken after 8 s and 10 s of heating [67] | Carbon fibers in different epoxy structures [67] | Embedded fibers | |
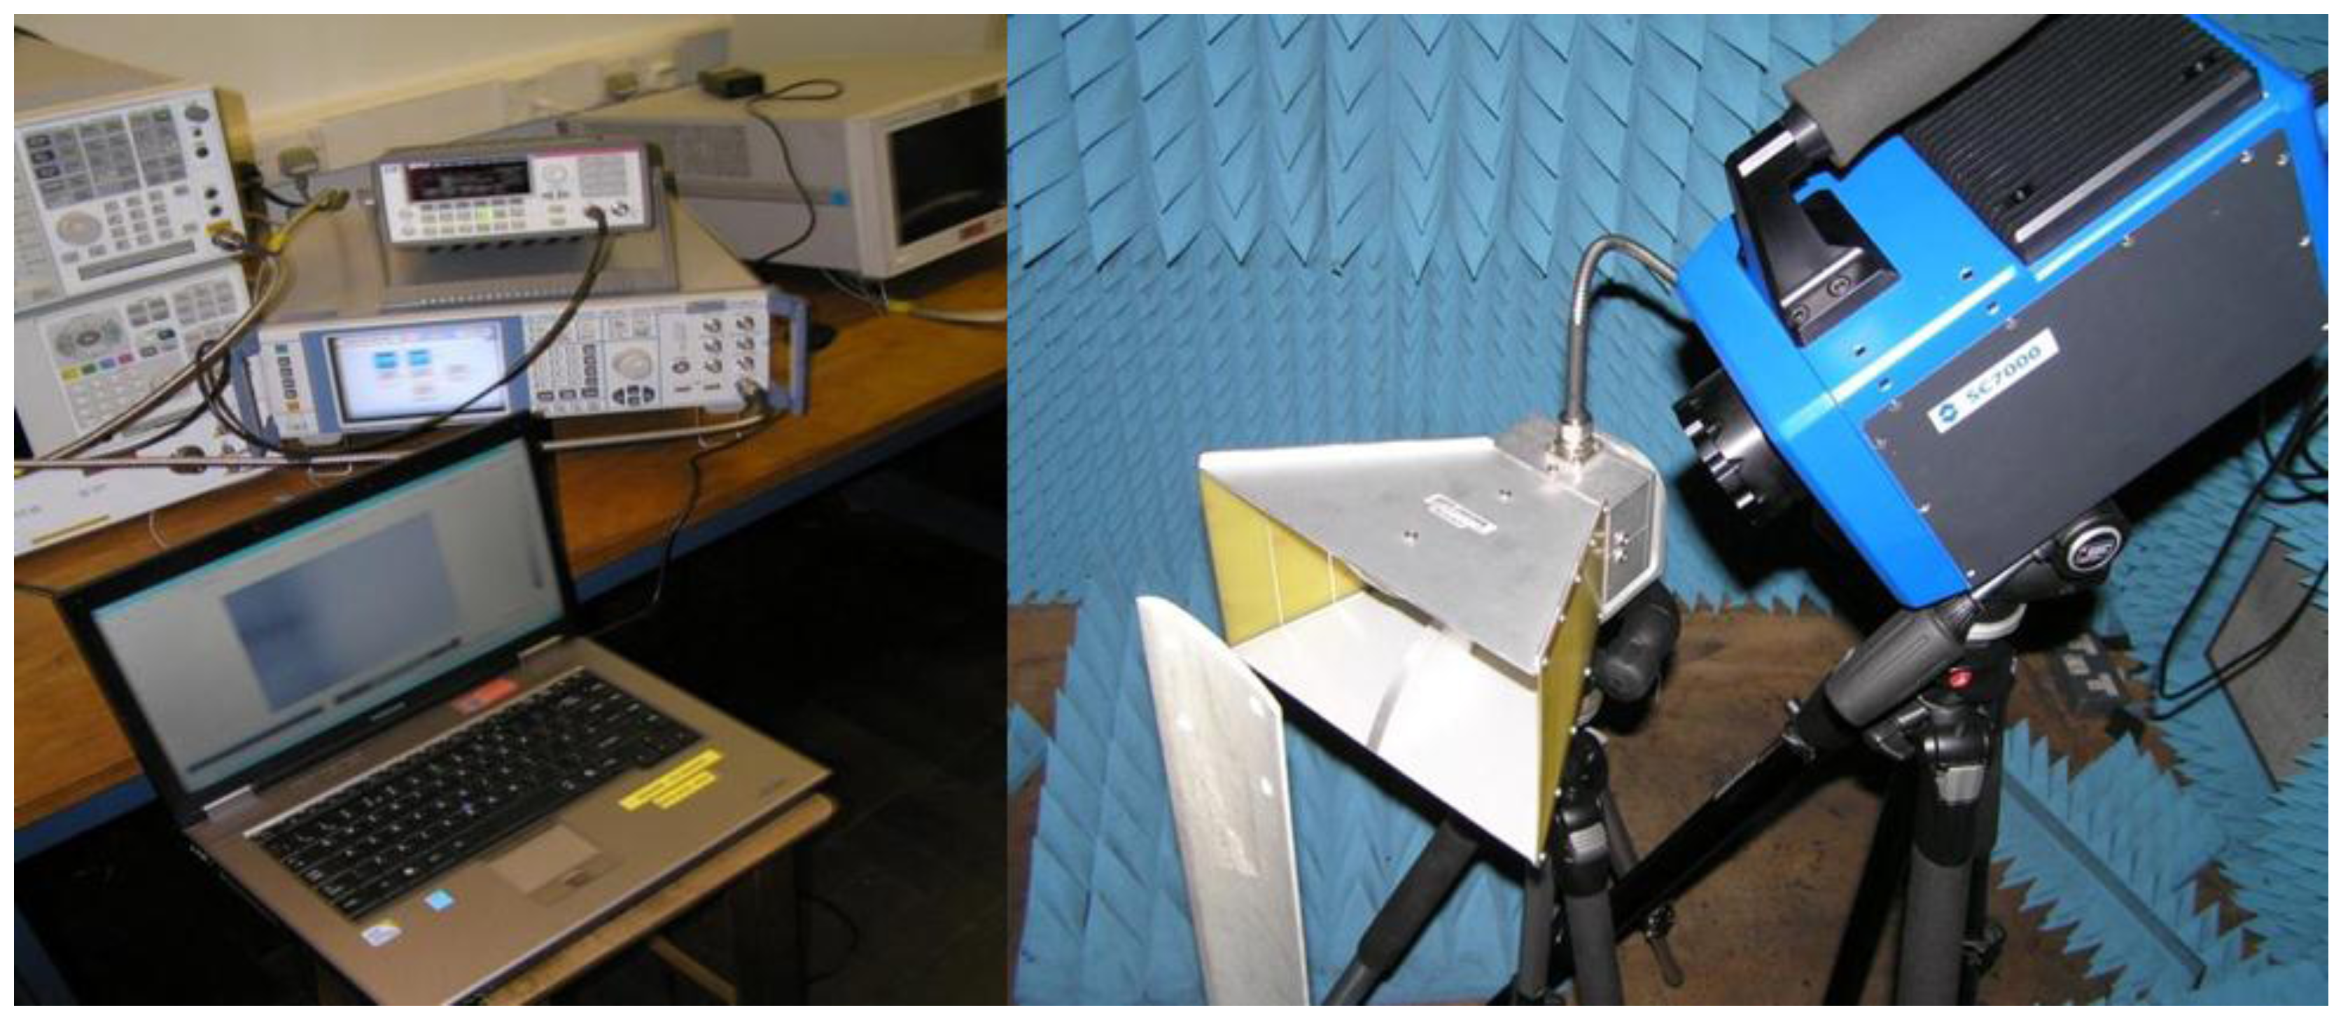
| 18 GHz [57] | Flann 18 094-SF40 waveguide [57] | 1 W [57] | FLIR SC7500 [57] | COMSOL Multiphysics and CST Microwave Studio [57] | Rohde & Schwarz SMF 100 A signal generator [57] | The surface thermal profile was taken after 10 min of heating [57] | GFRP [57] | Defects |
| 2.45 GHz [56,68] | WR430 waveguide [57] | 1000 W [57] | Flir A325 [57,68] | Not available | The surface thermal profile was obtained after 10 s to 15 s of heating [57] | Debonding and delamination | ||
| Magnetron [68] | 500 W [68] | Not available | A sequence of 180 thermograms was obtained and processed by using normalized, standardized contrast and cosine transform [68] | Composite materials with adhesive bounded joints [68] | Defects | |||
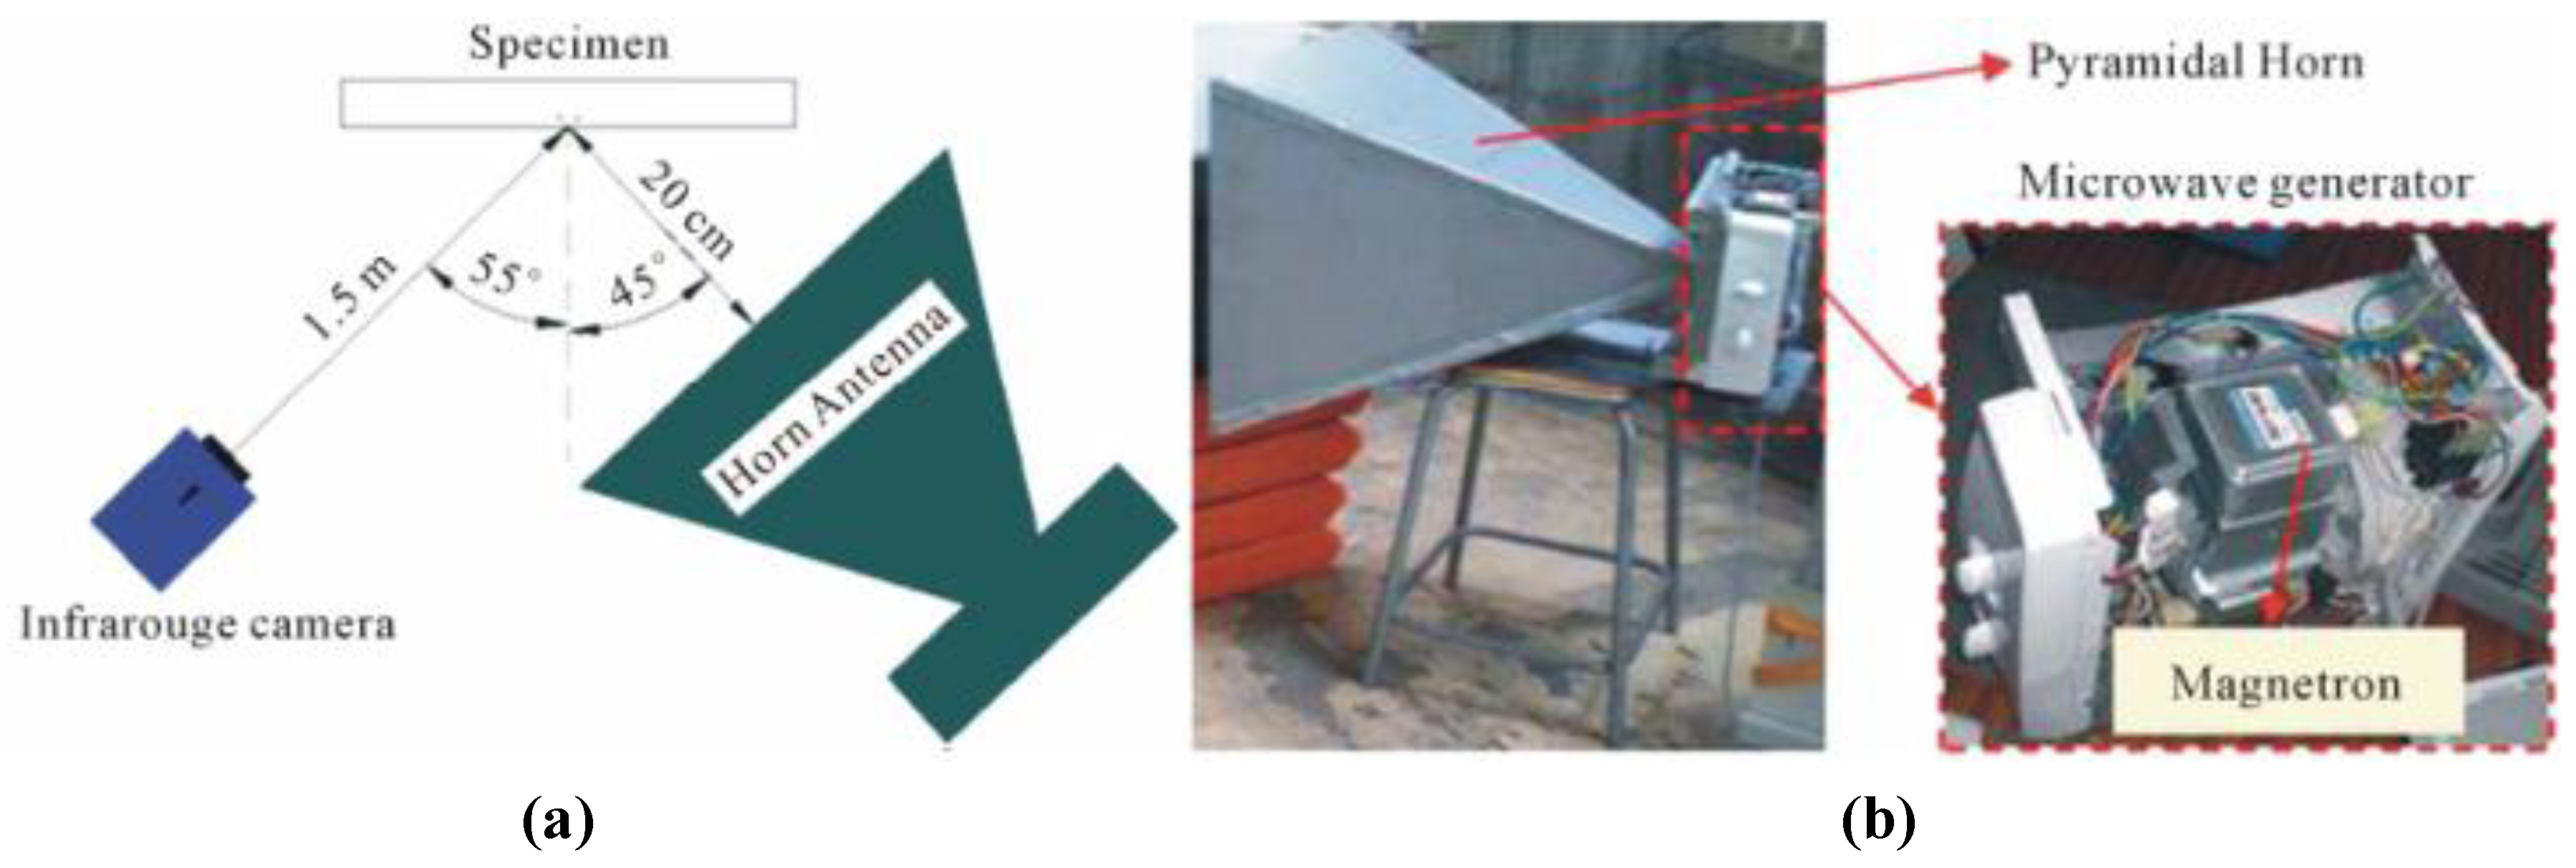
| Pyramidal horn antenna [56] | 360 W [56] | Not available | Not available | ALTAIR program [56] | The surface thermal profile was taken after 150 s of heating [56] | CFRP [56] | Defects | |
| 1 GHz [69] | Coaxial-type probes [69] | 0.1 W [69] | FLIR T620 [69] | CST Microwave Studio [69] | Spectrometer [69] | Normalized to the maximum value of field intensity [69] | Carbon-fiber composite materials [69] | Conductivity measurement |
| Heating Sources | Strengths | Limitations |
|---|---|---|
| Flash, lamp | Non-contact, full-field, low cost, methods are mature | Surface heating, impact of surface condition on heating, heating reflection |
| Laser | Non-contact, remote heating from a far distance, high sensitivity, great resolution, quantification, fast | Heating area relies on excitation source, scanning is required, more suitable for surface defect detection |
| Mechanical | Full-field, high resolution, high sensitivity, quantification, fast, selective heating | Contact, know-how, specimen needs to be fixed, lack of quantitative information |
| Induction | Non-contact, relatively low-cost of excitation system, full-field, high resolution, great sensitivity, quantification, fast, inner heating | Limited to conductive material, non-uniform heating, complex heating system, near-field heating, heating area is limited to the excitation coil |
| Microwave | Non-contact, remote excitation, full-field, high resolution, great sensitivity, quantification, fast, uniform heating, selective heating | Complex and expensive microwave excitation system, electromagnetic radiation |
| NDT Techniques | Strength | Limitation |
|---|---|---|
| Ultrasound-echo/Phased array/Linear array | Great depth, high resolution, many deployment options | Sound attenuation, coupling for contact testing, non-sensitive to surface defects |
| Guide wave | Large areas | Sound attenuation, coupling for contact testing |
| Acoustic emission | In-service, passive, large areas, | Noise, bad quantitation, non-sensitive to static defects |
| Shearography | Non-contact, full-field, fast, high sensitivity | Sensitive to part movement, small thickness/stiffness, require unique test set-ups, expensive, hard to quantitatively analyze |
| Eddy current | Non-contact, low-cost, no surface treatment | Conductive material, scanner required, sensitive to lift-off, low resolution |
| Microwave | Non-contact, high resolution, suitable for dielectric material | Scanner required, near-field, lift-off influence |
| Microwave thermography | Non-contact, full-field, high resolution, high sensitivity, quantification, fast, uniform heating, selective heating | Heating system complex, electromagnetic radiation |
| X-ray/Gamma-ray | High resolution, non-contact | X-ray radiation hazards, operation complex, scanner required |
© 2017 by the authors. Licensee MDPI, Basel, Switzerland. This article is an open access article distributed under the terms and conditions of the Creative Commons Attribution (CC BY) license (http://creativecommons.org/licenses/by/4.0/).
Share and Cite
Zhang, H.; Yang, R.; He, Y.; Foudazi, A.; Cheng, L.; Tian, G. A Review of Microwave Thermography Nondestructive Testing and Evaluation. Sensors 2017, 17, 1123. https://doi.org/10.3390/s17051123
Zhang H, Yang R, He Y, Foudazi A, Cheng L, Tian G. A Review of Microwave Thermography Nondestructive Testing and Evaluation. Sensors. 2017; 17(5):1123. https://doi.org/10.3390/s17051123
Chicago/Turabian StyleZhang, Hong, Ruizhen Yang, Yunze He, Ali Foudazi, Liang Cheng, and Guiyun Tian. 2017. "A Review of Microwave Thermography Nondestructive Testing and Evaluation" Sensors 17, no. 5: 1123. https://doi.org/10.3390/s17051123
APA StyleZhang, H., Yang, R., He, Y., Foudazi, A., Cheng, L., & Tian, G. (2017). A Review of Microwave Thermography Nondestructive Testing and Evaluation. Sensors, 17(5), 1123. https://doi.org/10.3390/s17051123