1. Introduction
Monitoring vital conditions, such as heart rate, respiration cycle, and weight transitions, plays an important role in daily life. Individuals can use the information for health management [
1,
2,
3,
4,
5,
6]. In order to support activities for health management based on such monitoring, it is important that a sensing method should not involve excessive efforts by individuals for the sensing of biosignals. Thus, sensing devices should be in total harmony with the living environment, such as rooms, clothes, and belongings, and should be capable of casually measuring biosignals with high precision in daily life. We call such methods “casual sensing” [
7]. Sudden changes in vital conditions in daily life are detected by using casual sensing devices. Load signals include vital conditions, such as a heart beat, as well as physical conditions, such as signs of illness that affect the behavior of individuals. Therefore, it is possible to evaluate health conditions by measuring multiple biosignals using load sensors. Load signals from multiple biosignals correspond to various ranges and, thus, a wide measurement range is a key requirement for a load sensor. For example, a heartbeat is on the order of tens of milliNewtons, respiration is on the order of sub-Newtons, and body motion is on the order of hundreds of Newtons.
Several extant studies focused on biosignal detection using load sensors and included pulse detection using strain gauge-type sensors [
8,
9], pulse and respiration detection using piezoelectric-type sensors [
10,
11,
12], and detection of body motion while sleeping [
13] or during sports [
14] using capacitance change-type sensors. Although these sensors can non-invasively measure vital information or body motions of individuals, the measurement range does not cover multiple biosignals such as a heart rate signal under a weight-loaded condition. Conversely, we have been developing load sensors using a QCR (QCR load sensor). Specifically, the characteristic of a QCR includes linearly changing the resonant frequency with the magnitude of the applied load [
15,
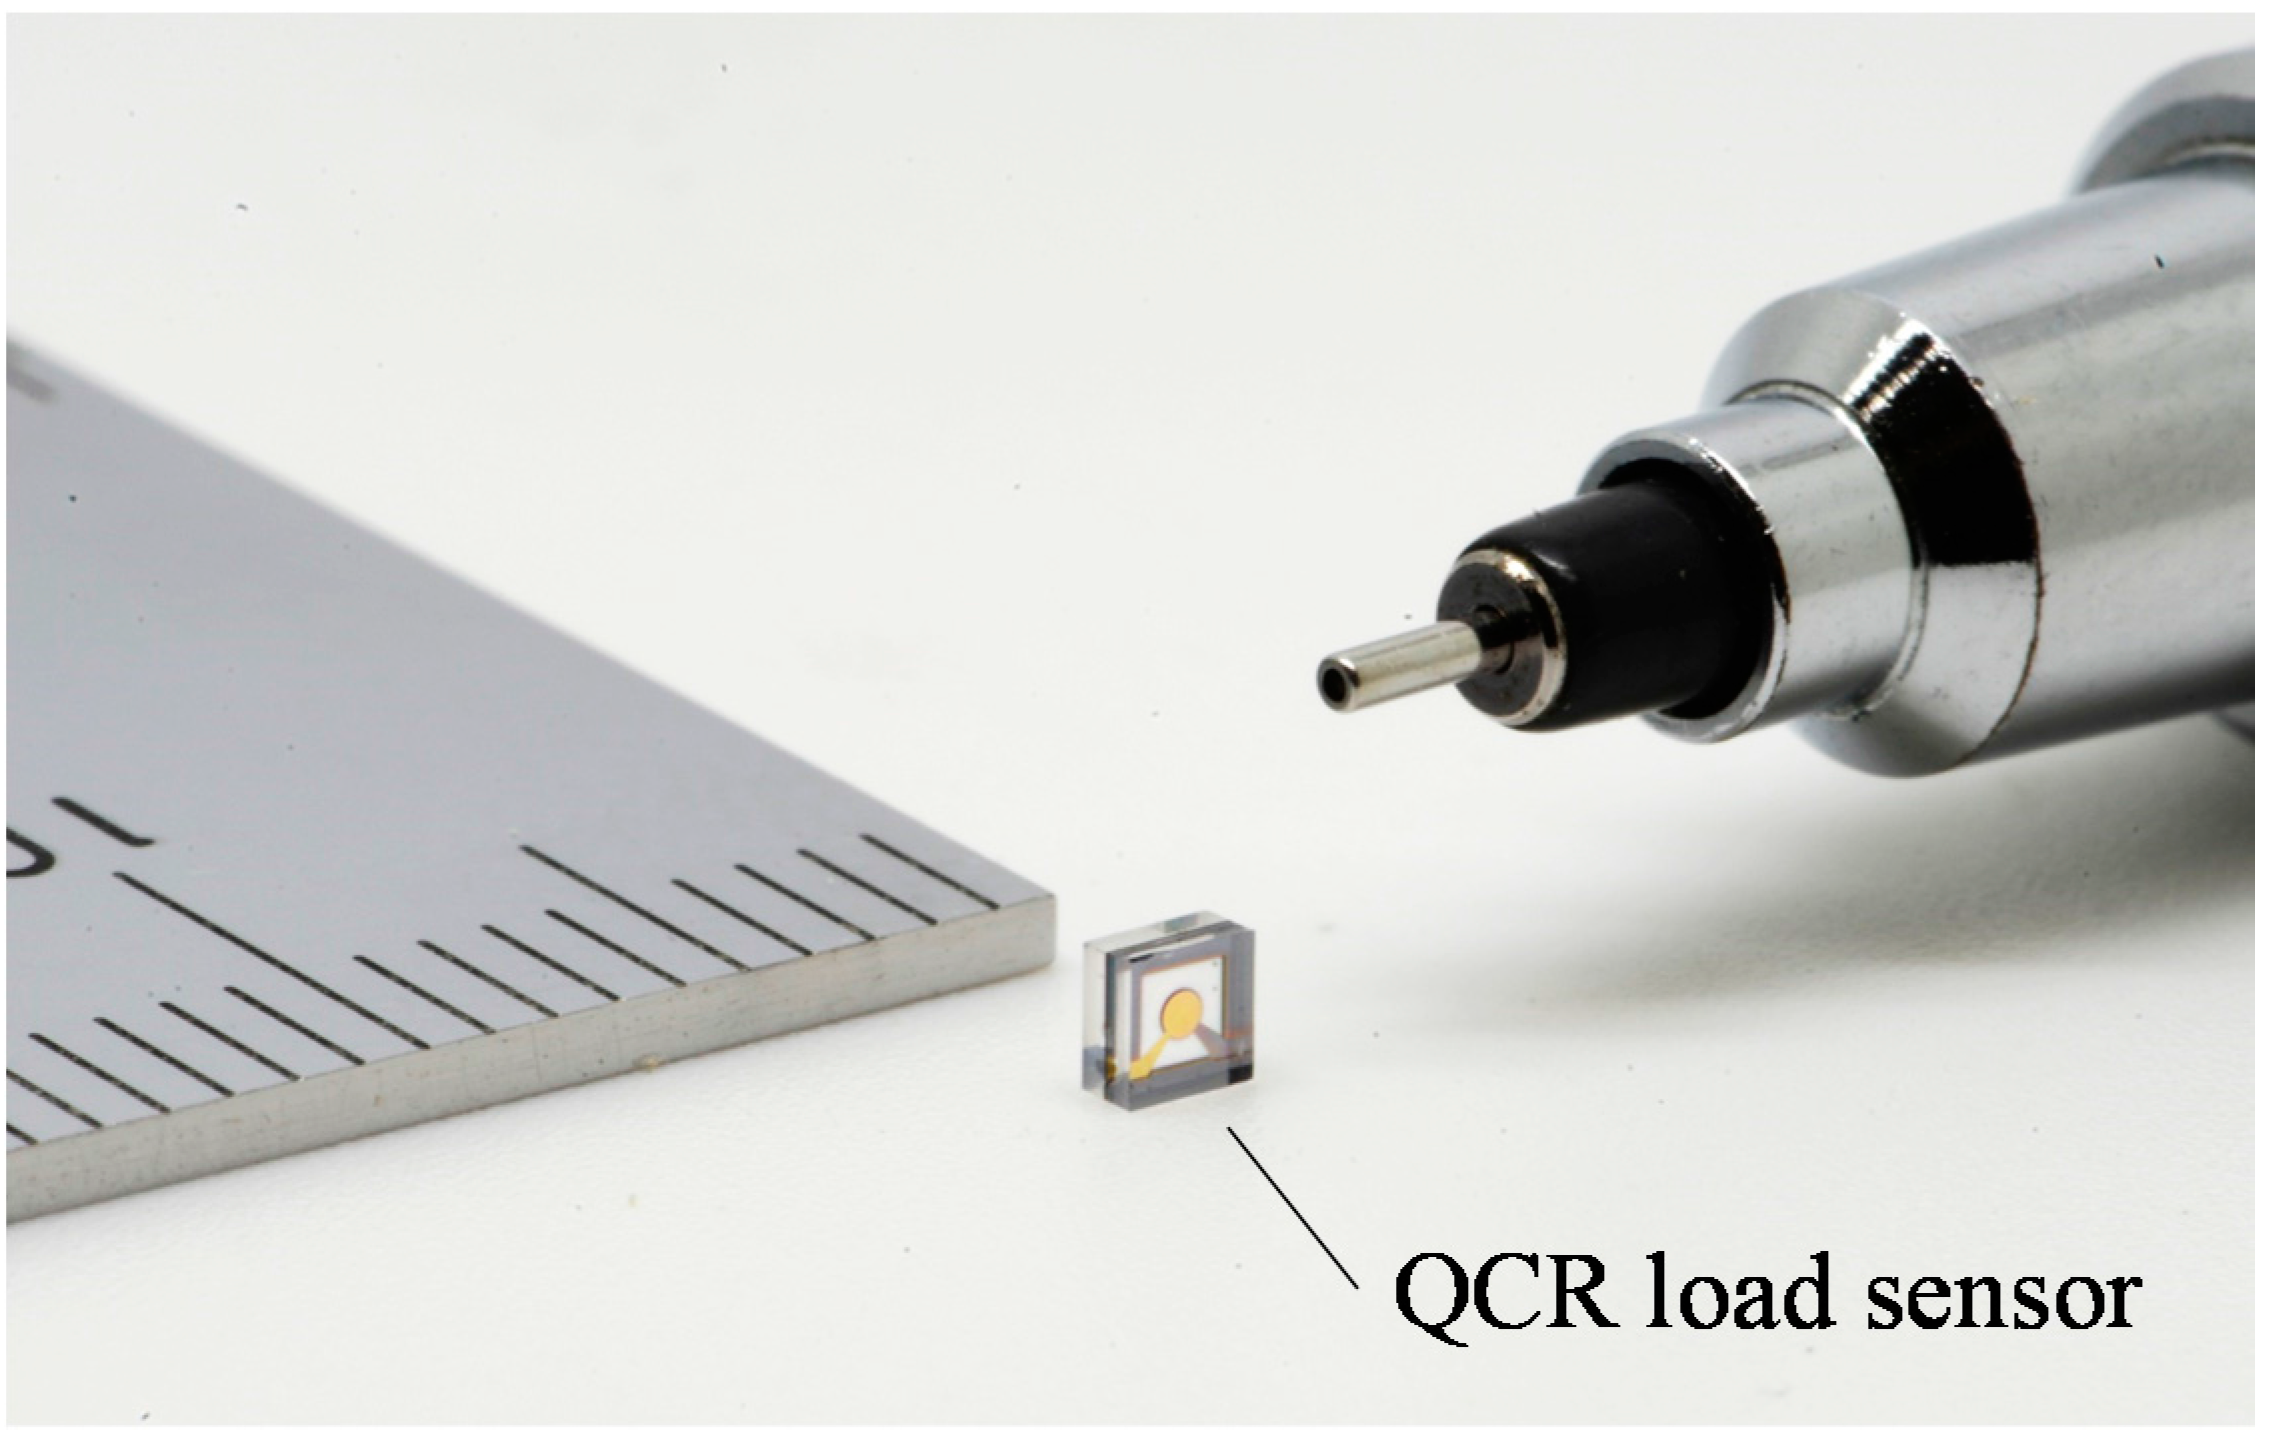
16]. A quartz crystal possesses high strength against compressive stress and, thus, a wide measurement range for load sensing is expected. We have succeeded in fabricating a miniaturized QCR load sensor with dimensions of 2 mm × 2 mm × 1.04 mm using MEMS techniques [
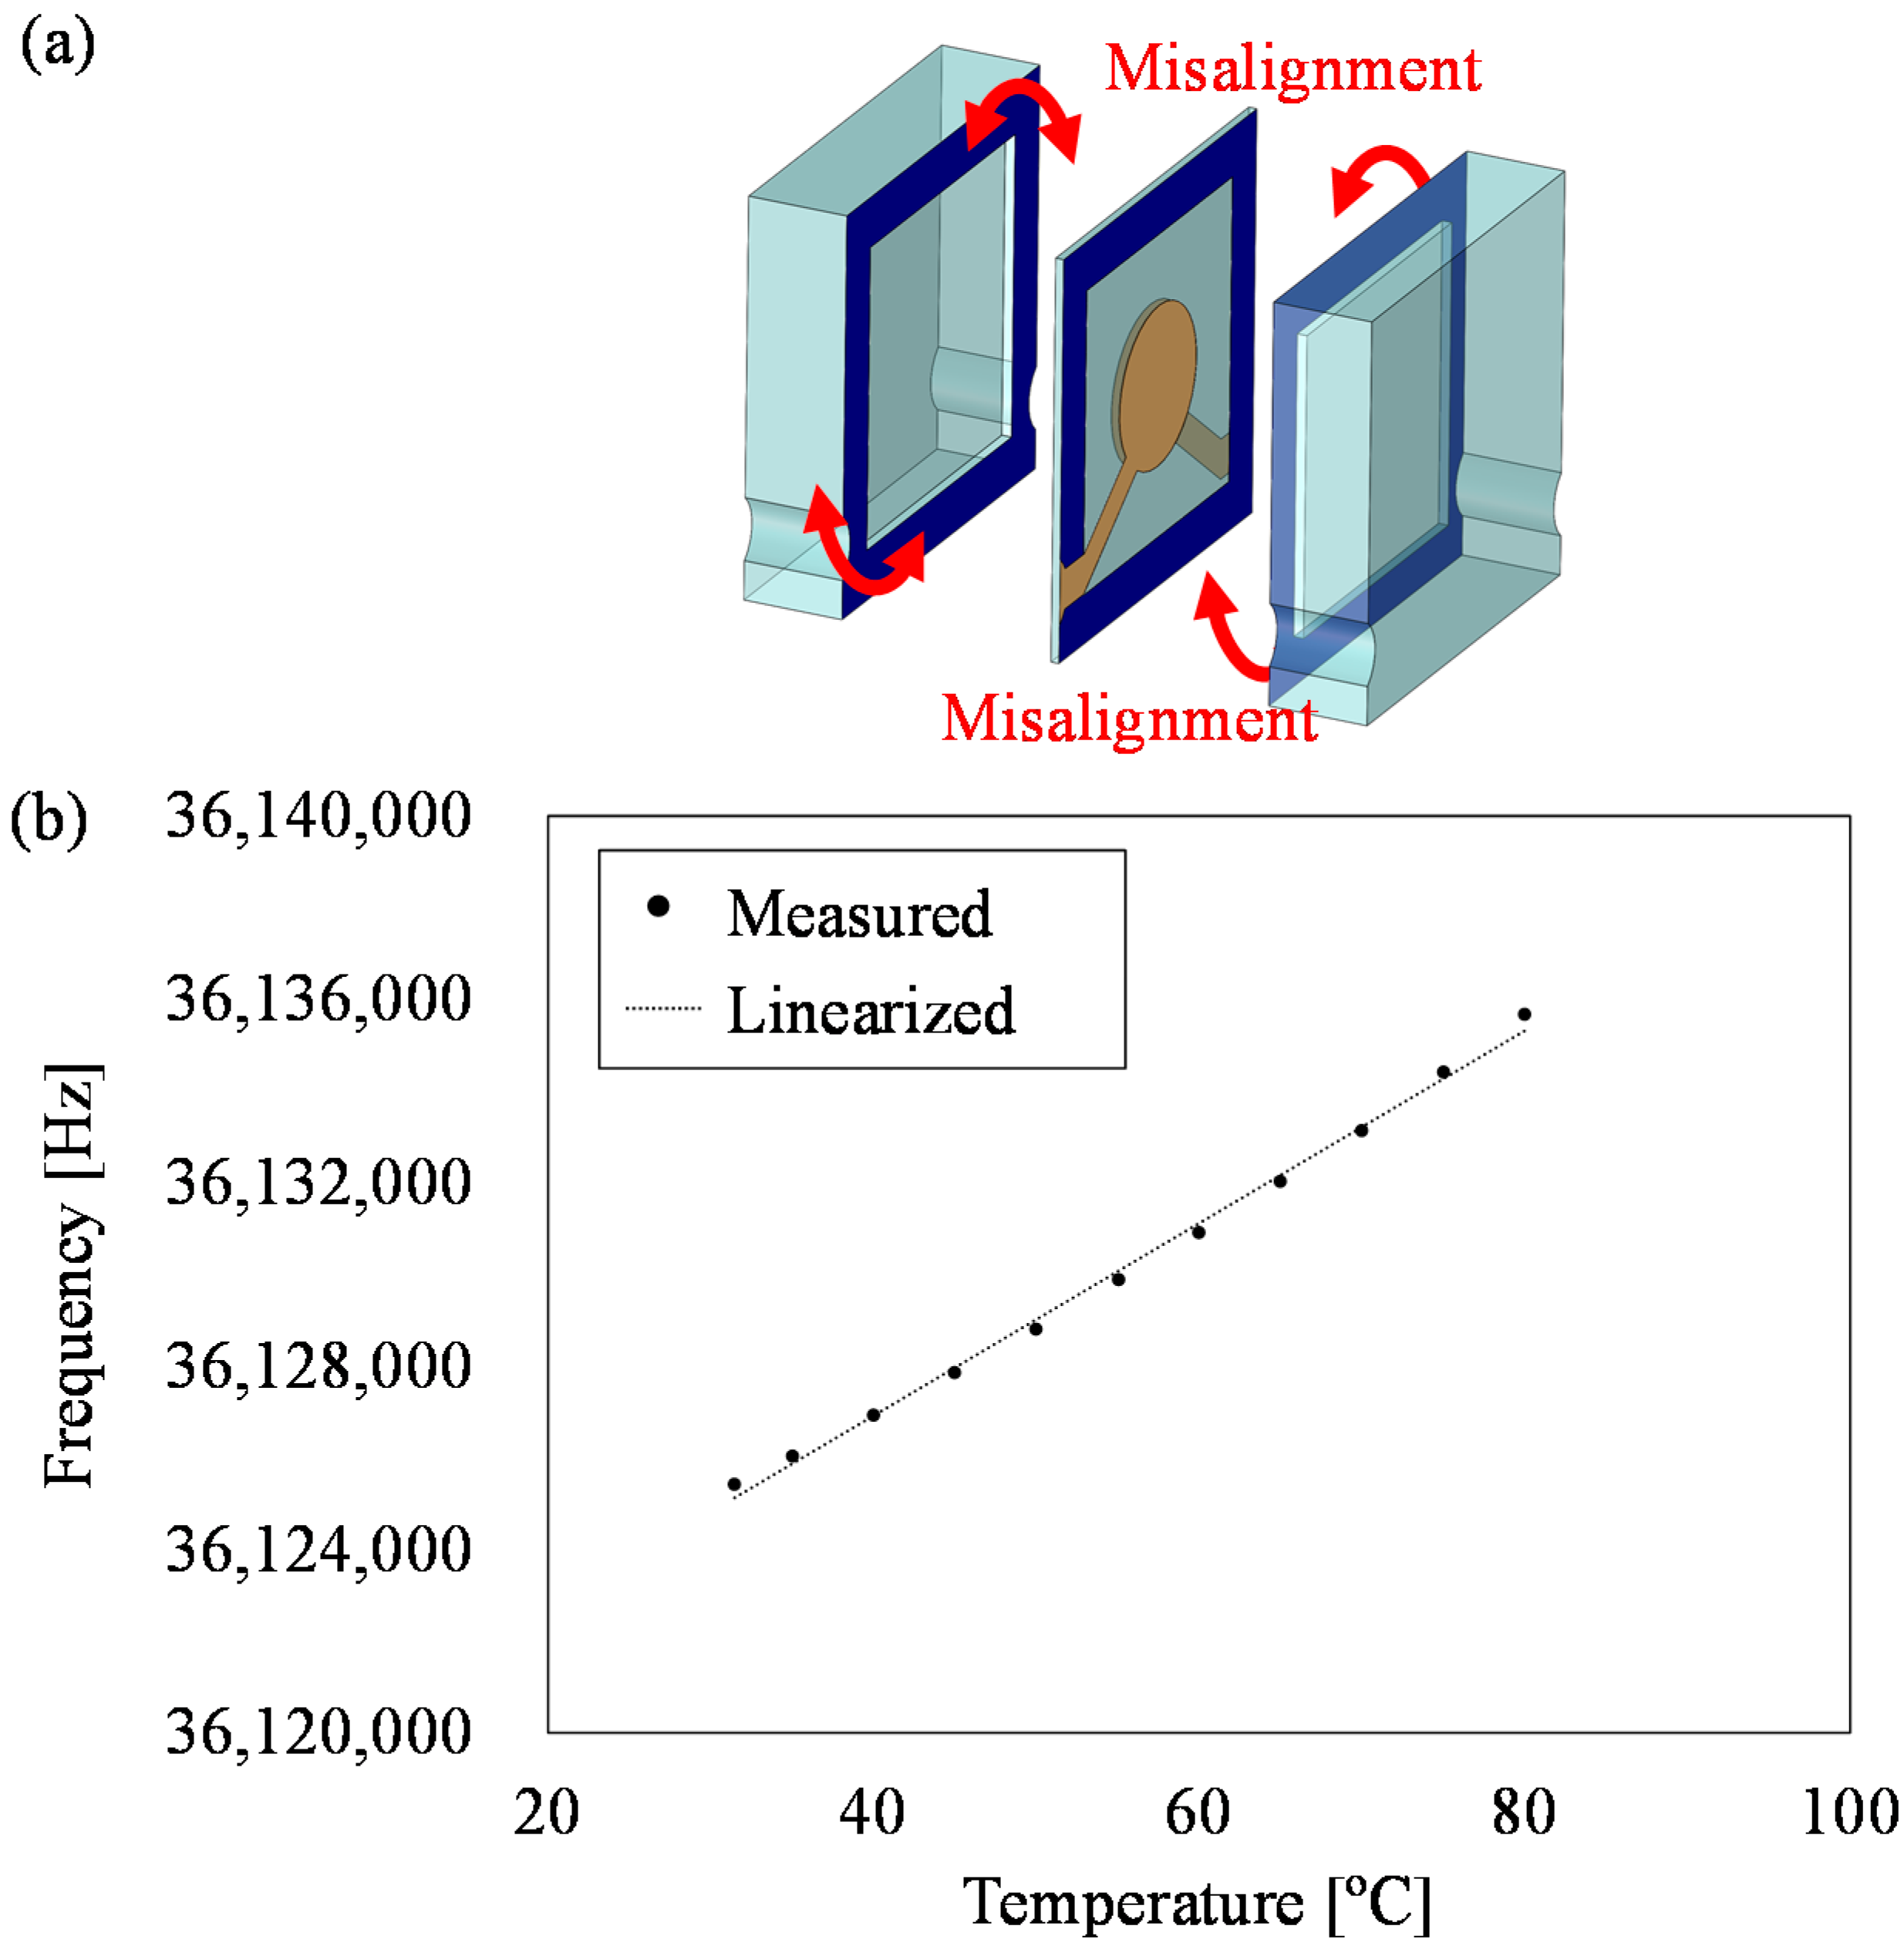
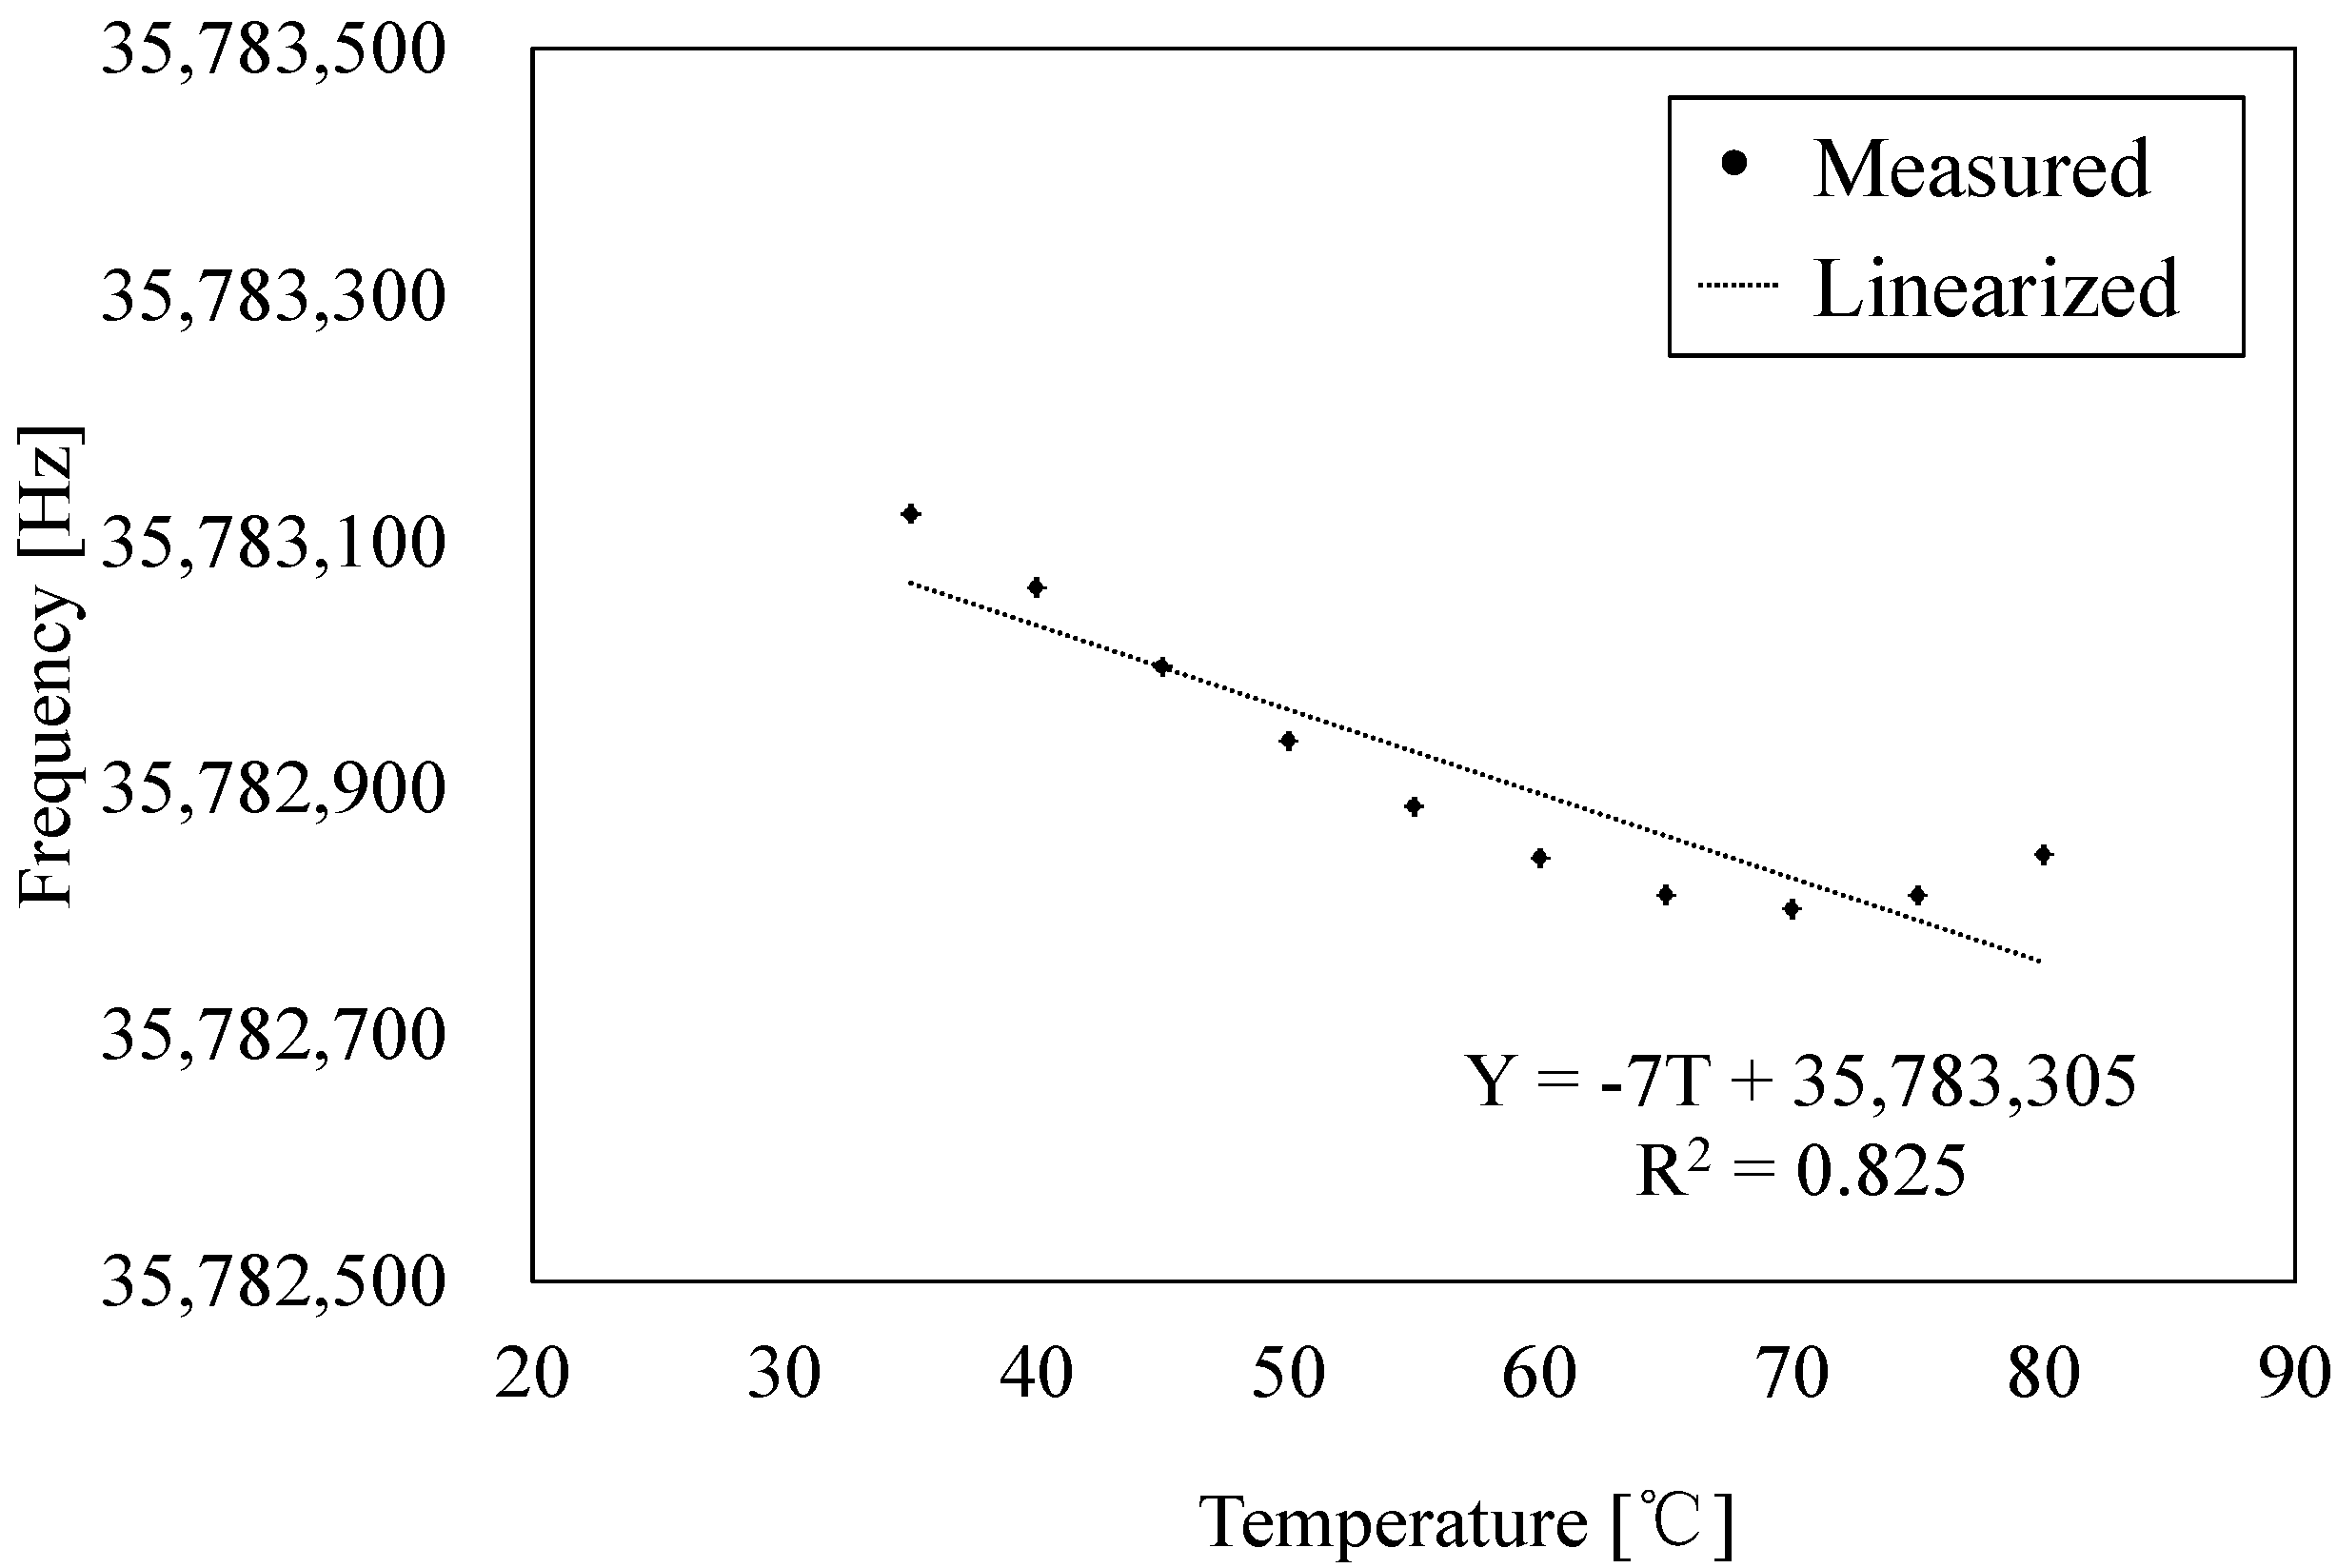
17]. The sensor mainly consists of three layers, namely a QCR layer and two silicon (Si) layers. Additionally, multiple biosignals, such as body motion, respiration, and pulse signals, were successfully detected by integrating the sensor into a chair because the fabricated sensor possesses a wide measurement range. It is considered that load sensors with an expanded measurement range can detect weight, as well as pulse, signals by setting the sensors in the floor or weighing scales. However, there is a paucity of extant research that focuses on improvements in the measurement range. It is necessary to design a sensor by considering the destruction limit of a sensor to expand the measurement range. Furthermore, a QCR load sensor involves a problem related to the temperature characteristics due to a mismatch between the temperature coefficients of expansion of the quartz crystal and silicon [
7,
17,
18]. In practical use situations, the stability of sensor output is significantly affected by the environmental temperature fluctuation. Thus, improvements in temperature characteristics are also necessary to achieve a wide-range of measurements in practical use.
In this study, a design method of the QCR load sensor is proposed to expand its measurement range by restraining the buckling of the QCR and also by using a thinner QCR. The fundamental characteristics of the fabricated sensor are evaluated. The results indicate that a measurement range of 1.5 × 10
6 is achieved. Additionally, an all-quartz crystal structure is proposed for the sensor in which the QCR load sensor is composed of all crystal layer components. The sensor consists of a QCR layer and two holding layers. The base material of the three layers is completely composed of quartz crystal. In a previous study, the two holding layers were composed of silicon [
7]. The usage of quartz crystal holding layers significantly reduces the sensor output fluctuation caused by temperature. Finally, measurements of weight and pulse are performed to confirm the effectiveness of the fabricated sensor. The results indicated that multiple biosignals of pulse and weight are successfully detected.
2. Measurement Range of QCR Load Sensors
AT-cut QCRs possess superior temperature stability at room temperature. AT-cut QCRs generate thickness-shear vibration when an oscillation circuit is connected, and the frequency change is obtained depending on the applied force. The frequency change
is proportionally related to the applied force (
):
where
denotes sensor sensitivity given by the following expression:
where
denotes the coefficient of sensitivity determined by direction of the applied force,
denotes the load transfer efficiency, and
and
denote the width and thickness of the QCR, respectively. We defined load transfer efficiency as the ratio of the compressive load on the QCR to the vertical component of the external force. Equation (2) indicates that a reduction in the thickness of the QCR is efficient in improving sensor sensitivity.
The practical resolution of load
is defined as follows:
where
denotes fluctuation of the sensor output that indicates stability of the oscillation frequency. Conversely, the theoretical maximum allowable load
is given as:
where
denotes the allowable stress of AT-cut quartz crystals. Equation (4) indicates that the maximum measurable load improves with decreases in the load transfer efficiency. The theoretical measurement range (
) corresponds to the ratio of the maximum allowable load to the practical resolution and is given by Equations (3) and (4) as follows:
The aforementioned proportional relation indicated that the factors necessary to achieve a wide-range QCR load sensor include decreasing the QCR thickness, increasing the stability of the sensor output, and enhancing the maximum allowable load.
It is necessary to consider the following points: The resonant frequency of the QCR increases with decreases in the QCR thickness. That is, the resonant frequency of the QCR is inversely related to thinning of the QCR thickness:
where
denotes the resonant frequency of QCR in an infinite plane plate and
denotes the thickness the QCR in mm. The stability of the sensor output is related to the
Q factor of the QCR. A high
Q factor of the QCR is necessary to obtain a highly stable output. The maximum value of the
Q factor obtainable for AT-cut crystal units at ordinary temperatures corresponds to an inverse function of frequency. The results indicate that the values of the
Q factor range from 15 × 10
6 at 1 MHz to 0.15 × 10
6 at 100 MHz [
19]. The
Q factor is given by Equation (7):
The theoretical maximum value of Q factor decreases with reducing the QCR thickness. Thus, with respect to reducing the QCR thickness, it is necessary to consider the electrode thickness, electrode diameter, shape of the QCR, and wiring of the QCR to ensure a high value of the Q factor.
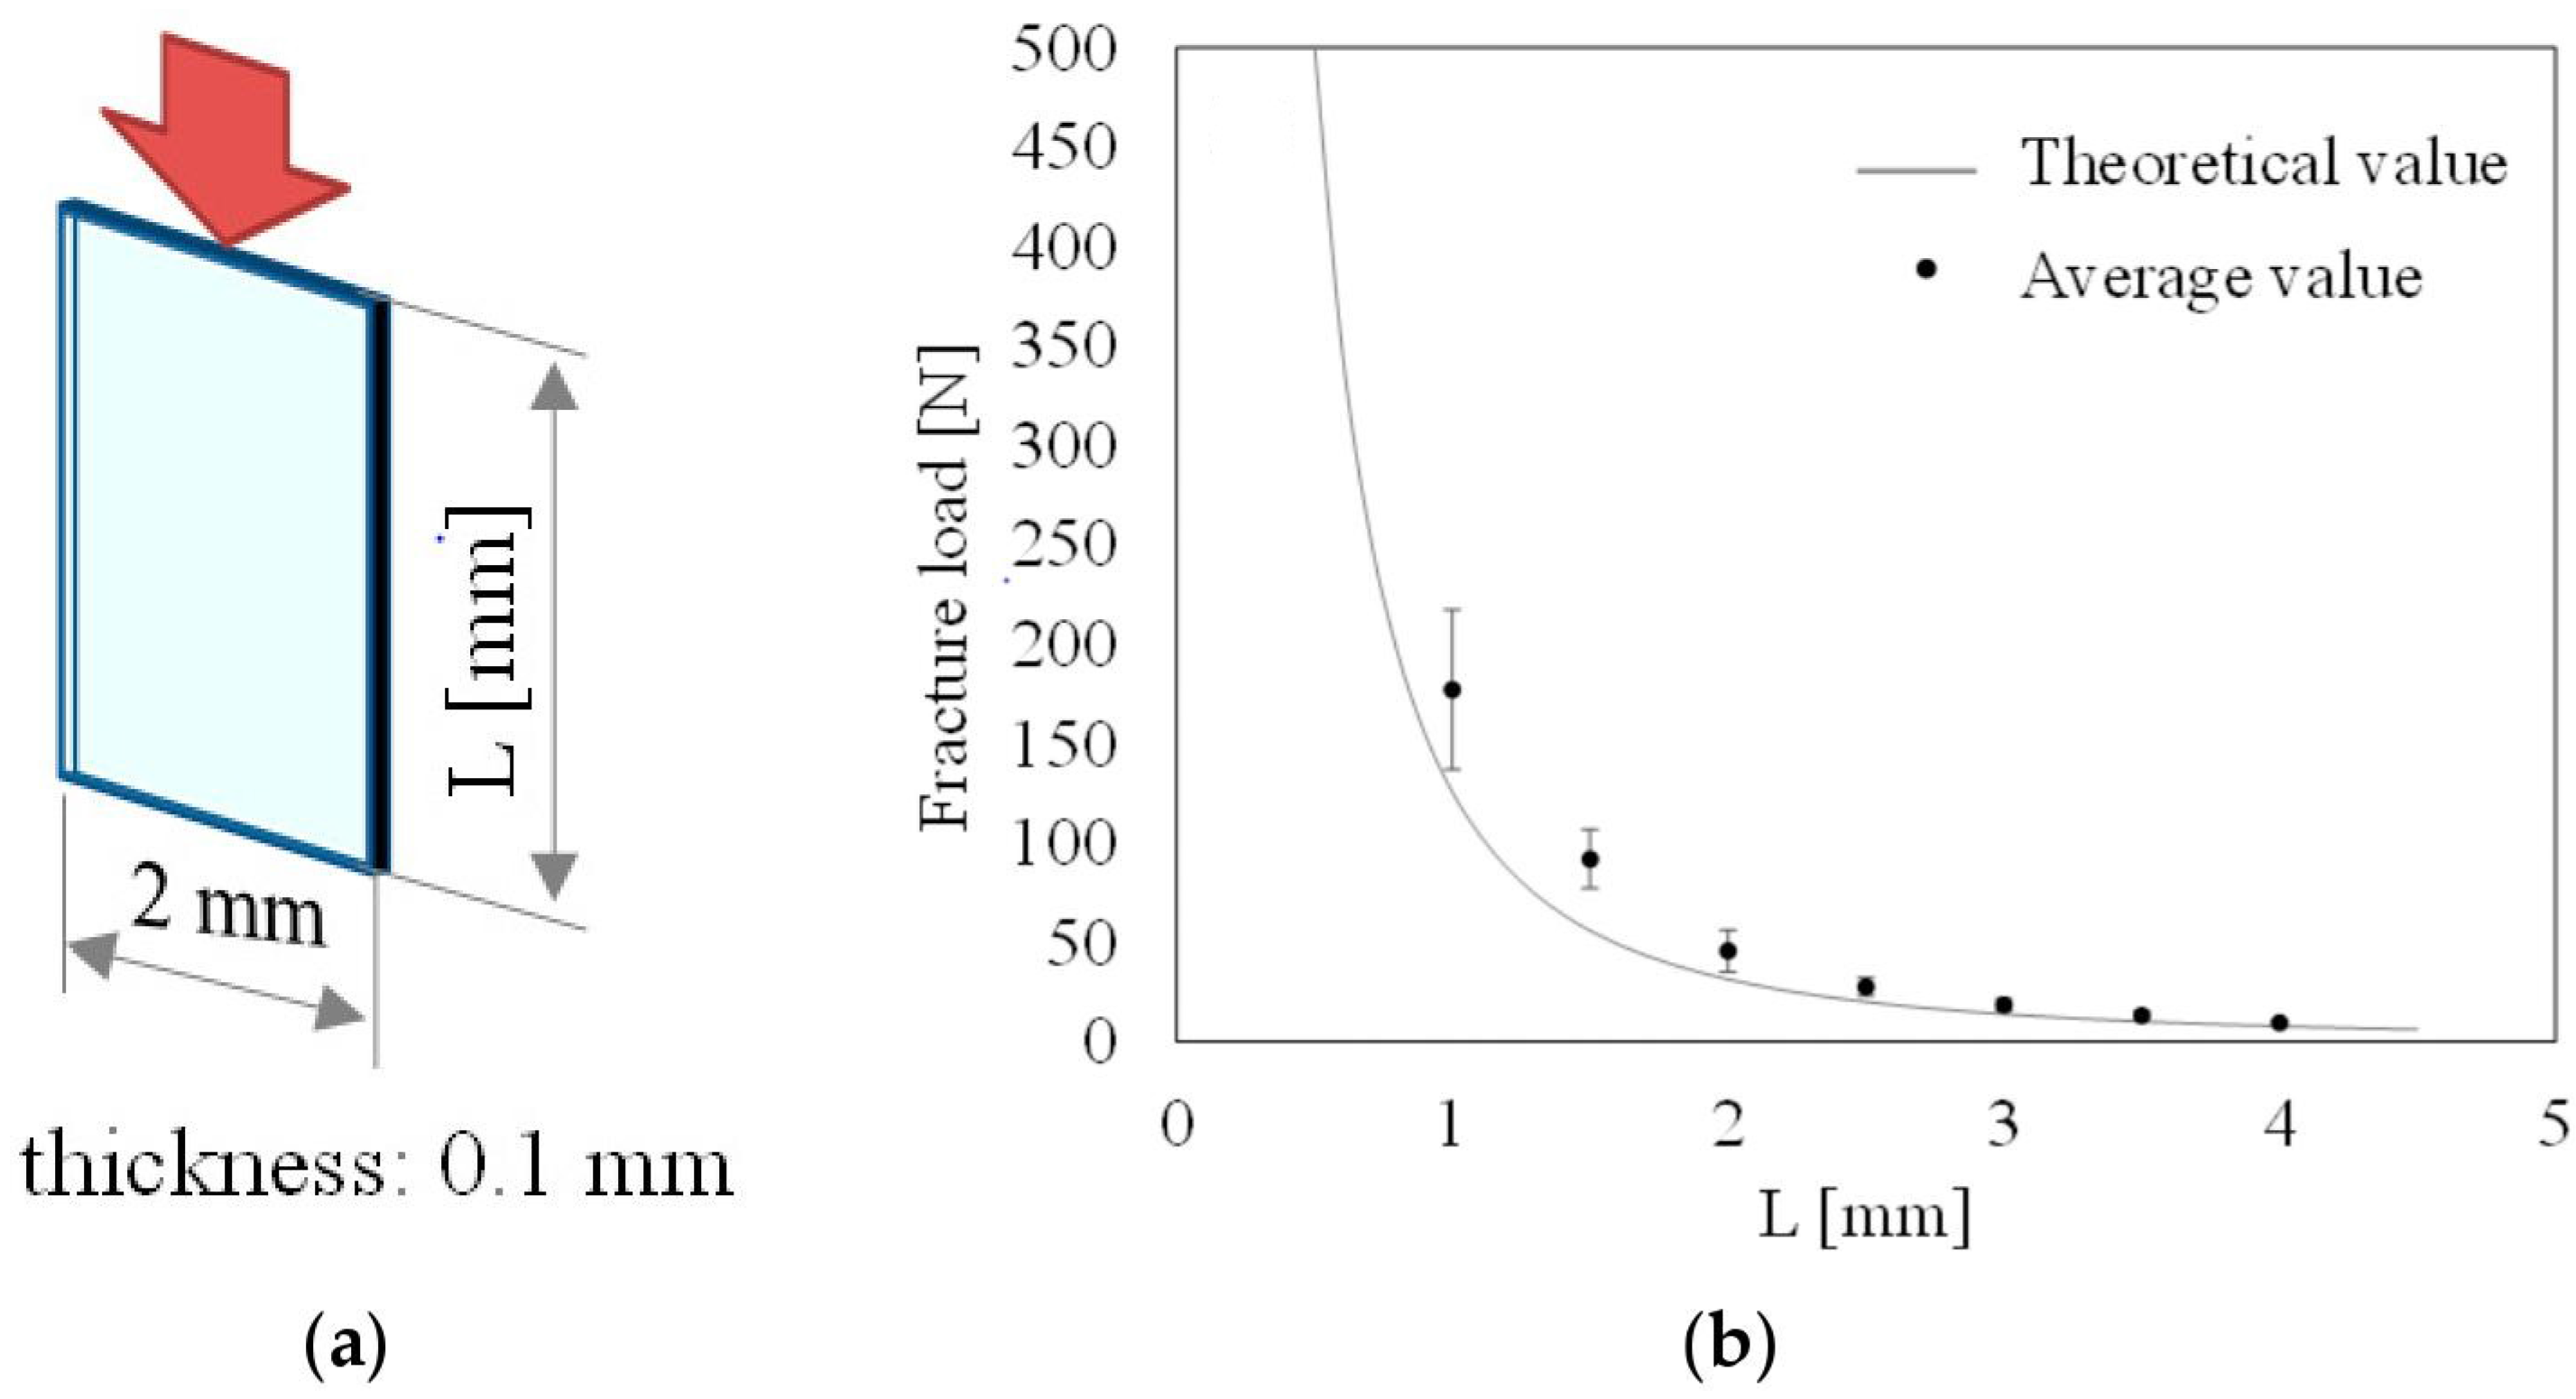
The maximum allowable load depends on the buckling load of the QCR due to its thin structure. A failure test is conducted to examine the relationship between the failure stress and buckling load as determined by the structure of the QCRs. In the experiment, test pieces of quartz crystal with different lengths (100 μm thickness, 2 mm width, lengths ranging from 1 mm to 4 mm, in 0.5 mm increments) are used. The test pieces of quartz crystal are set on the load cell and compressed until they break down. The applied load at failure is measured by a load cell (9031A, Kistler Corporation, Winterthur, Switzerland). The average value of the failure load of each shape of test pieces is shown in
Figure 1. The error bars indicate standard deviation. Specifically, 20 test pieces are used for each size in the experiment. The theoretical value expresses Euler’s critical load for hinged ends as expressed by Equation (8):
where
denotes the modulus of elasticity,
denotes the area moment of inertia of the cross-section of the test piece, and
denotes the unsupported length of the column.
The results indicate that the shorter test piece is associated with higher failure stress, and this is considered to depend on the buckling stress. Furthermore, a test piece with a length of 1 mm indicated a failure stress of 900 MPa (when converted from the failure load of 180 N divided by the cross-section, which corresponded to an area of 0.2 mm
2). The failure stress corresponds to six times the general tensile strength of 150 MPa. The quartz crystal consists of a crystalline material with low dislocations. The low dislocation results in the increased mechanical stability of quartz [
20]. Consequently, a quartz crystal possesses high strength relative to the compressive stress and is fragile relative to the tensile or bend stress. The result suggests that preventing the buckling of the QCR leads to an increase in the allowable stress of the QCR load sensor.
3. Design of the QCR Load Sensor
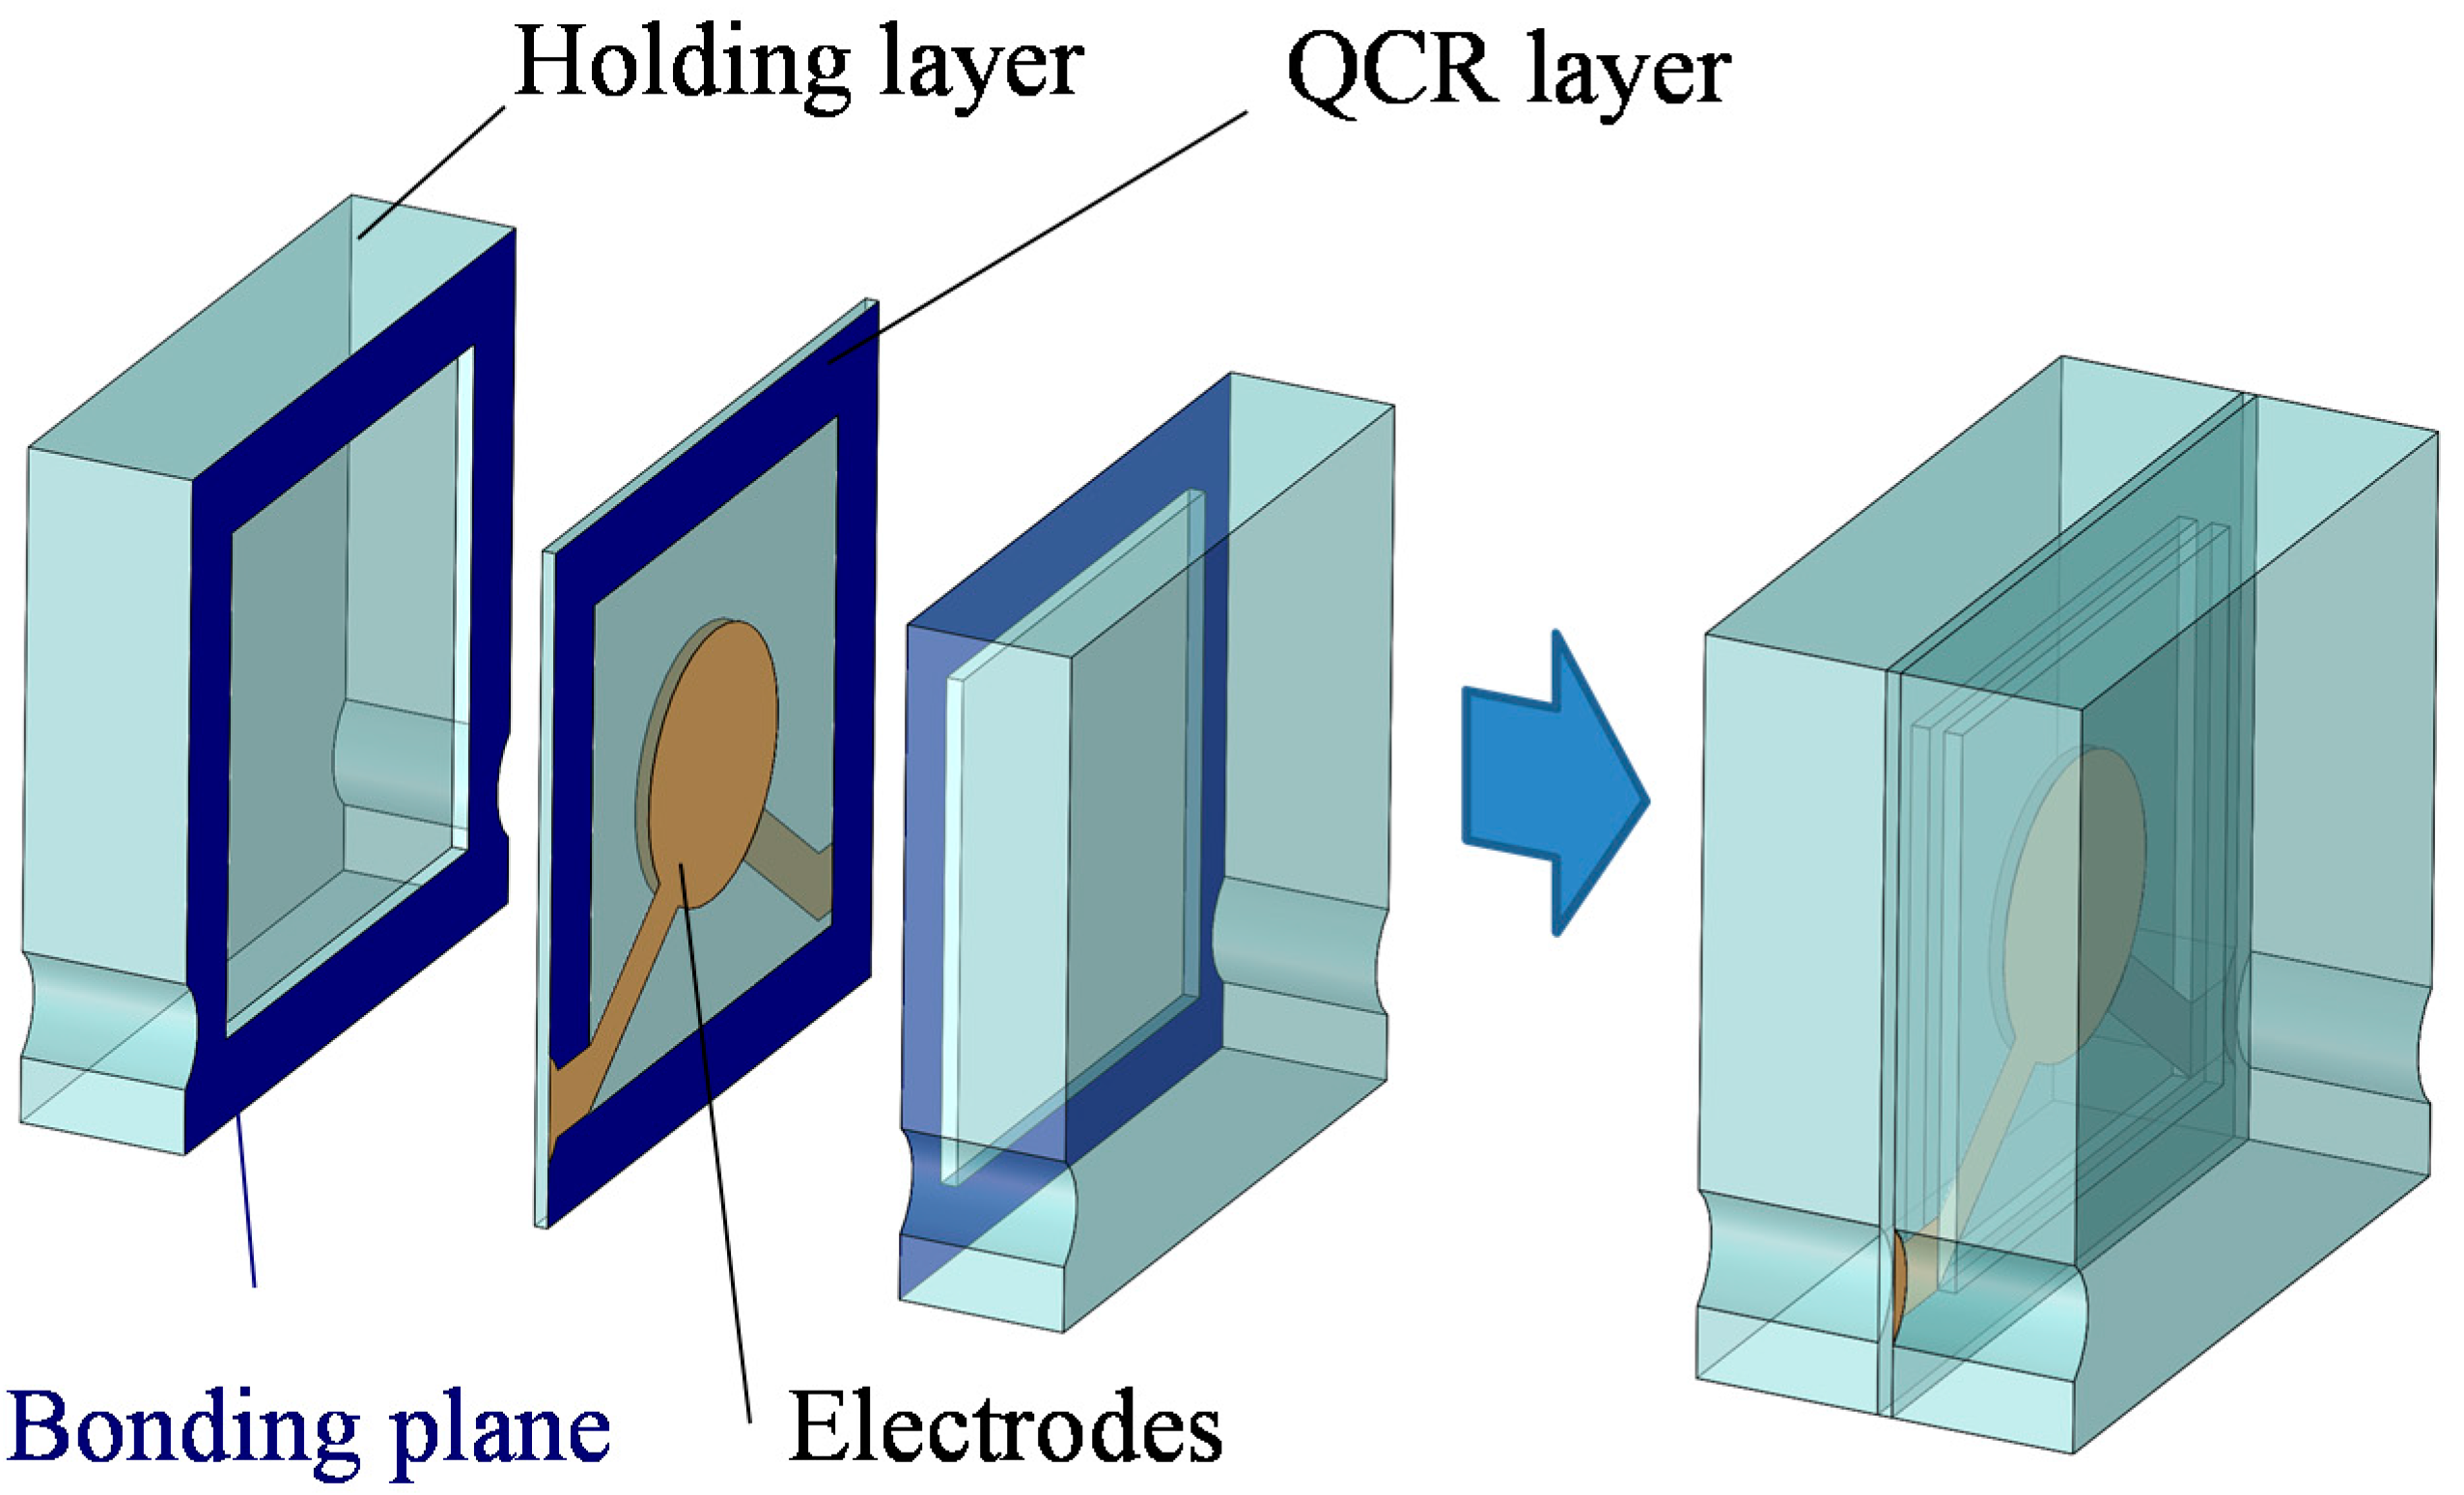
A design of the QCR load sensor is proposed to miniaturize and enlarge the measurement range. The sensor consists of three layers, namely two holding layers (with a thickness of 500 μm) and a QCR layer as shown in
Figure 2. The thickness of the QCR is reduced when compared with that of a conventional sensor [
18] to improve the measurement range of the QCR load sensor. Etching processes of quartz crystals can reduce the QCR thickness. However, the etching processes deteriorates the surface roughness and flatness, which leads to a low
Q of the QCRs. Thus, a quartz crystal wafer with a thickness of 41.7 μm and double-sided mirror-polished surface is used. It is necessary to ensure that the diameter of the electrodes is 15–20 times the QCRs thickness in order to obtain a stable output of the QCRs [
20]. Thus, the diameter of the electrodes is determined as 0.8 mm. Additionally, it is necessary for the outer shape of the QCR to be sufficiently high when compared with the diameter of the electrodes. Thus, the outer size of the QCR load sensor is determined as 2 mm × 2 mm. Miniaturization of the sensor can also be achieved by thinning down the QCR. The QCR layer is firmly fixed by the two holding layers bonded at the four corners. This structure enables the QCR sensor to withstand breakage due to bending and buckling. Furthermore, the applied load is shared by the holding layers and it can realize a high maximum allowable load. The surface of each holding layer is slightly etched to avoid interference with the oscillation. A wiring connection is placed on the bonding part to consider the effect of oscillation. Thus, connection holes are designed for the wiring at the holding layers. However, these holes could involve defects due to stress concentration. Consequently, the arc-shaped holes are fabricated to reduce stress concentration. Quartz crystal is used for the substrate of the holding layers to prevent sensor output fluctuation caused by temperature due to thermal stress generated by the difference in thermal expansion between the QCR and the holding layers.
Analysis of the buckling load of the proposed sensor structure is evaluated using finite element method (FEM) analysis with SolidWorks Simulation (2014 SP5.0, SolidWorks Corp., Waltham, MA, USA). As a result, the buckling load of the QCR layer corresponds to 996 N (stress at center of QCR layer was calculated as 573 MPa). Conversely, the buckling load of the quartz crystal layer component with 41.7 μm thickness and 2 mm outer size corresponds to 4.5 N (54 MPa). The proposed sensor structure can improve the buckling load such that it is ten times higher than that of the QCR single layer. Additionally, load transfer efficiency is calculated using FEM analysis with SolidWorks Simulation. Von Mises stress of the sensor is analyzed with the assumption that a perpendicular compressive load of 10 N is applied to the sensor tip. The analytical results are shown in
Figure 3. The results indicate that the load applied to the QCR corresponds to 0.48 N (it is calculated as 5.8 MPa by multiplying the average stress on the A-A cross-section with an area of 0.083 mm
2). In the analysis, the load transfer efficiency is calculated as 4.8%. The low load transfer efficiency can be used to obtain a high maximum allowable load of the sensor.
5. Application
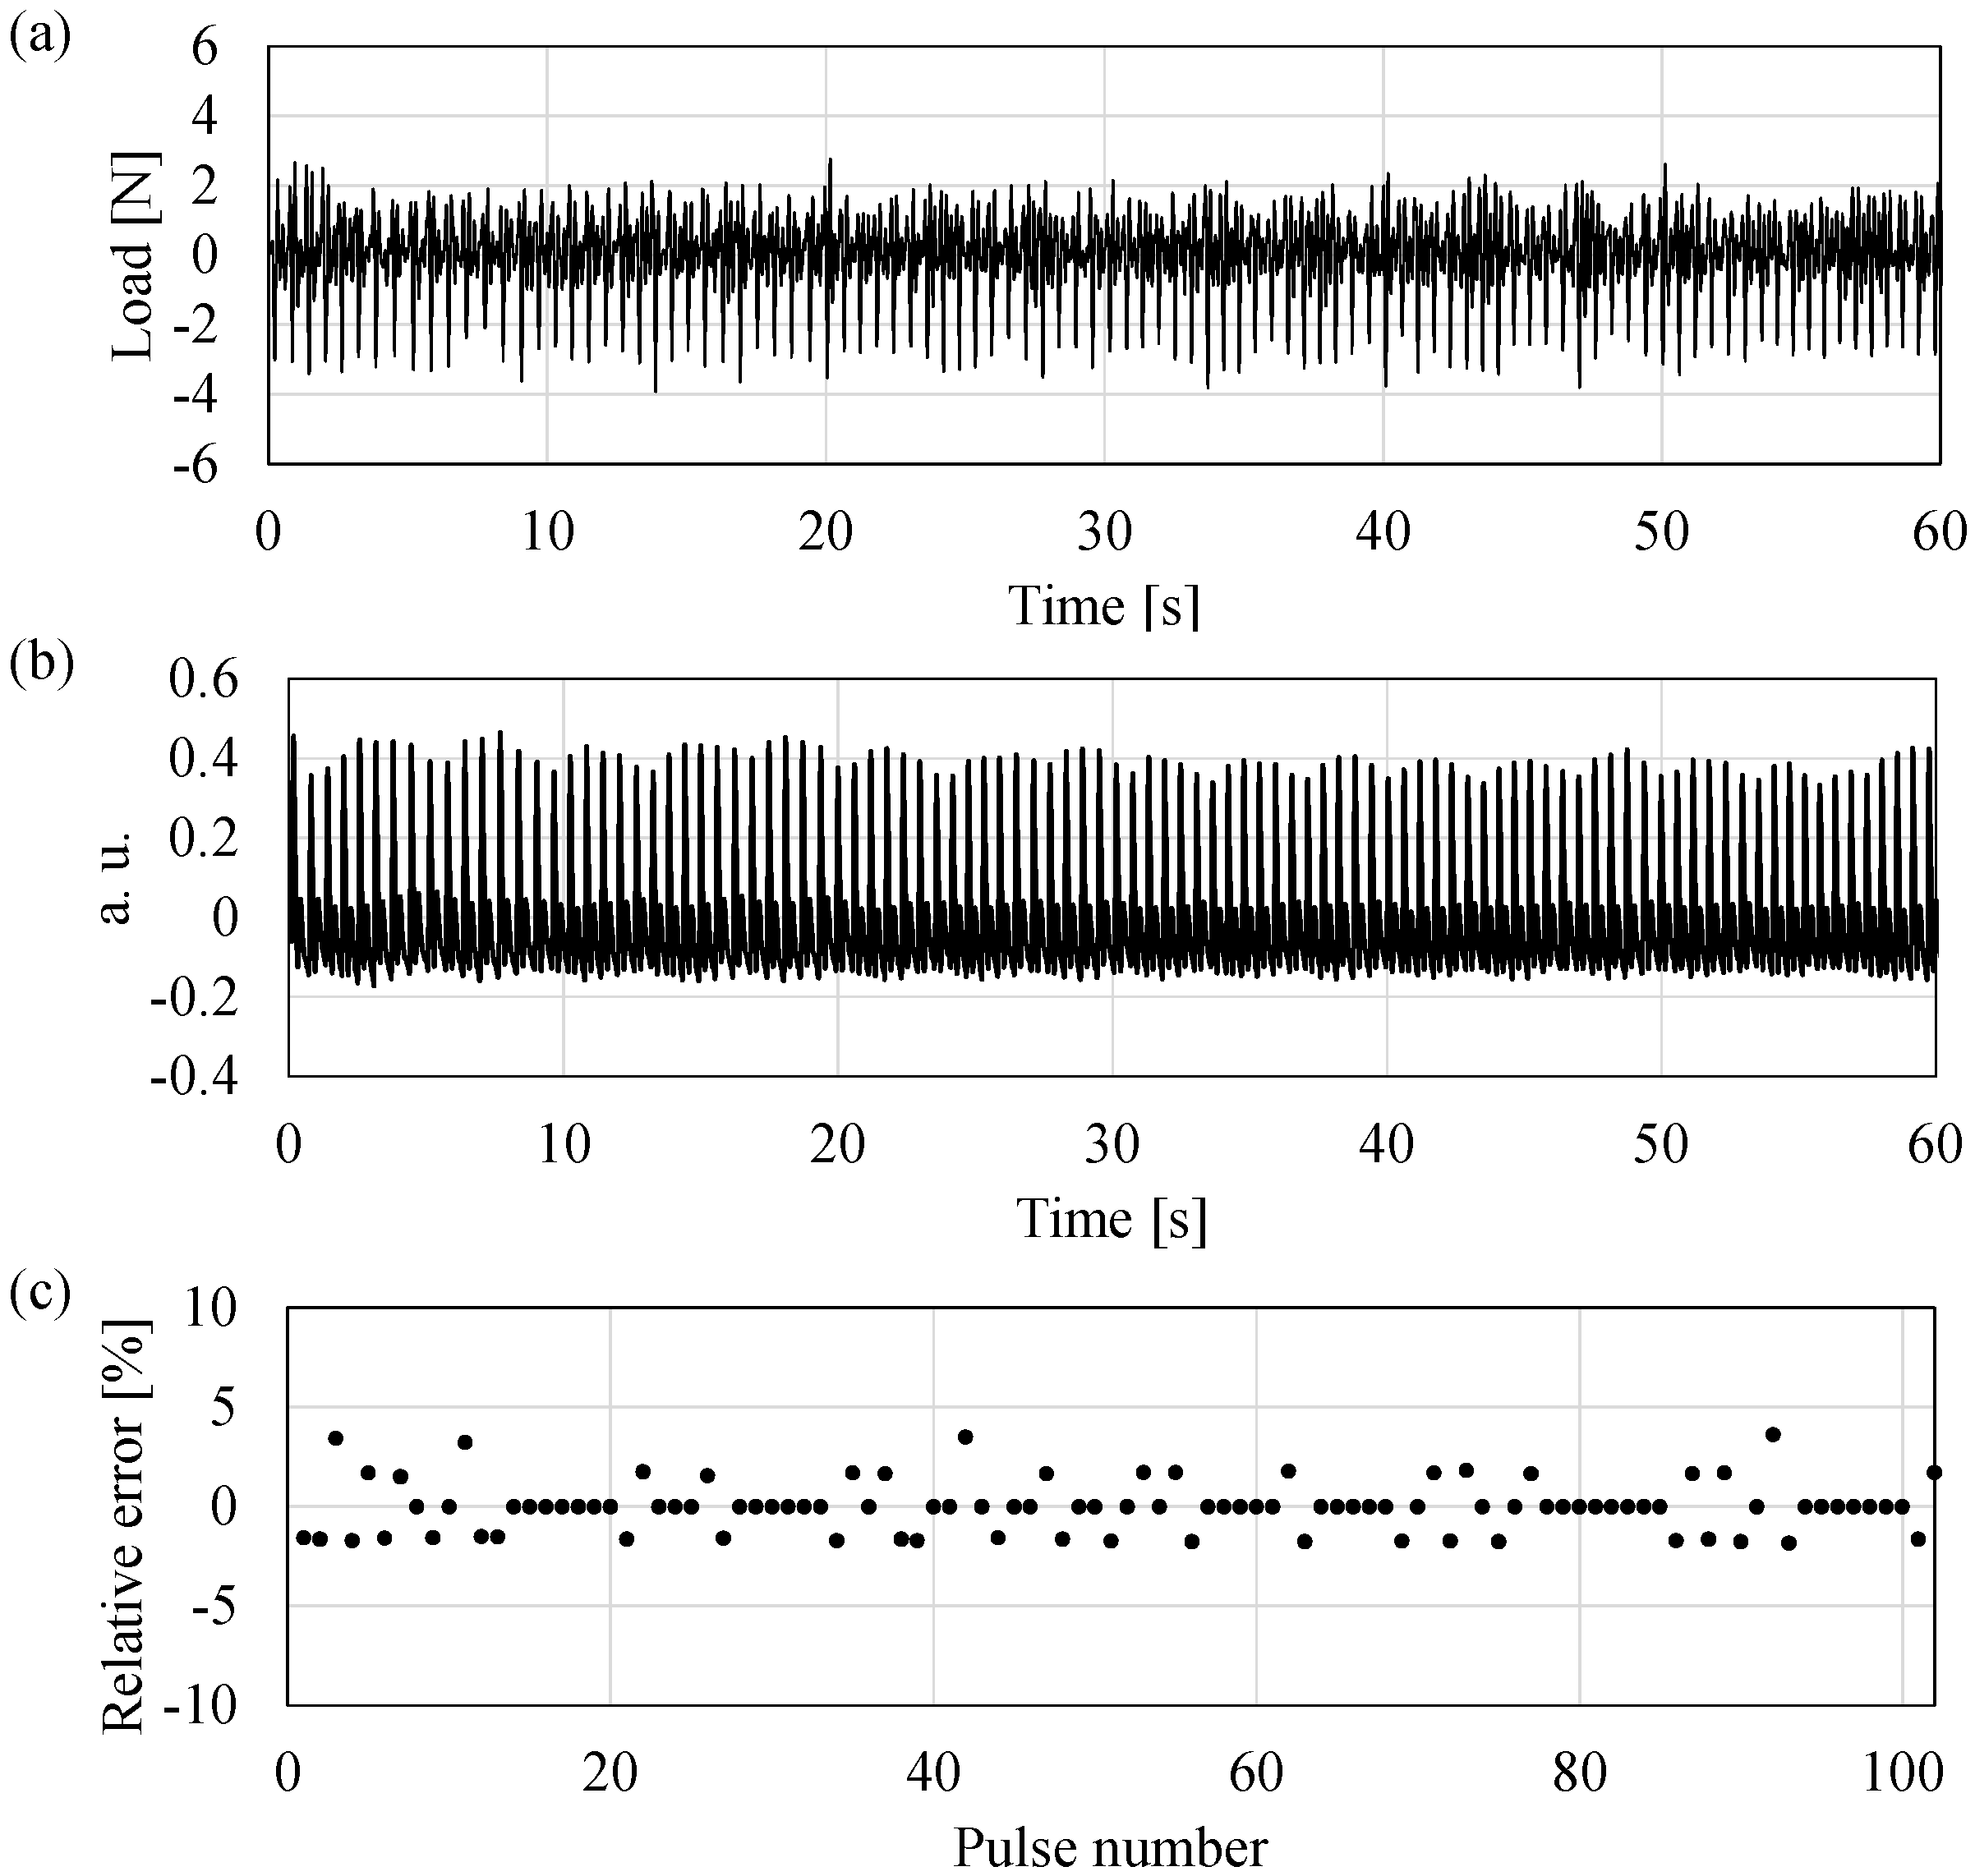
A multiple biosignal detection of weight and pulse is conducted to evaluate the effectiveness of the fabricated sensor. In the experiment, four sensors are fixed to the corners of a board. The applied load on the board is completely shared between the four sensors. The experimental result is shown in
Figure 9a. The experimental procedure is as follows. A male subject aged 25 years, 62 kg in weight, and a height of 182 cm rides on the board 10 s after the measurement commences. The subject gets off the board after approximately 30 s. Additionally, 610 N of the load is measured after the subject rides on the board.
Figure 9b shows the data after applying a band-pass filter ranging between 0.6 Hz and 20 Hz. A periodic change occurs when the subject rides on the board. A comparative experiment is conducted to estimate the pulse rate detection of the weighing scale using a QCR load sensor. In the experiment, a finger cuff-type pulse wave meter using an infrared sensor (Finapres Medical Systems, Finapres NOVA, Enschede, The Netherlands) is used as the reference of the pulse rate. The measurement commenced after the subject rides on the weighing scale. The subject stands upright without moving during the measurement.
Figure 10a,b shows the data after applying a band-pass filter ranging between 0.8 Hz and 20 Hz. This is followed by comparing the peak-to-peak interval of the pulse rate results for approximately 1 min (102 peaks of pulse) in the cases of the sensor
and the pulse wave meter
. Band-pass filtering and peak detection are conducted by using MATLAB R2012a (Mathworks Inc., Natick, MA, USA).
Figure 10c shows the relative errors for each interval in which the relative error is defined as follows:
The average error for 3 min corresponds to −0.01% and the standard deviation corresponds to 1.26%. From these results, it is confirmed that the fabricated sensor can simultaneously measure the weight and pulse information.


