A Novel Ultrasonic Method for Liquid Level Measurement Based on the Balance of Echo Energy

Abstract
:1. Introduction
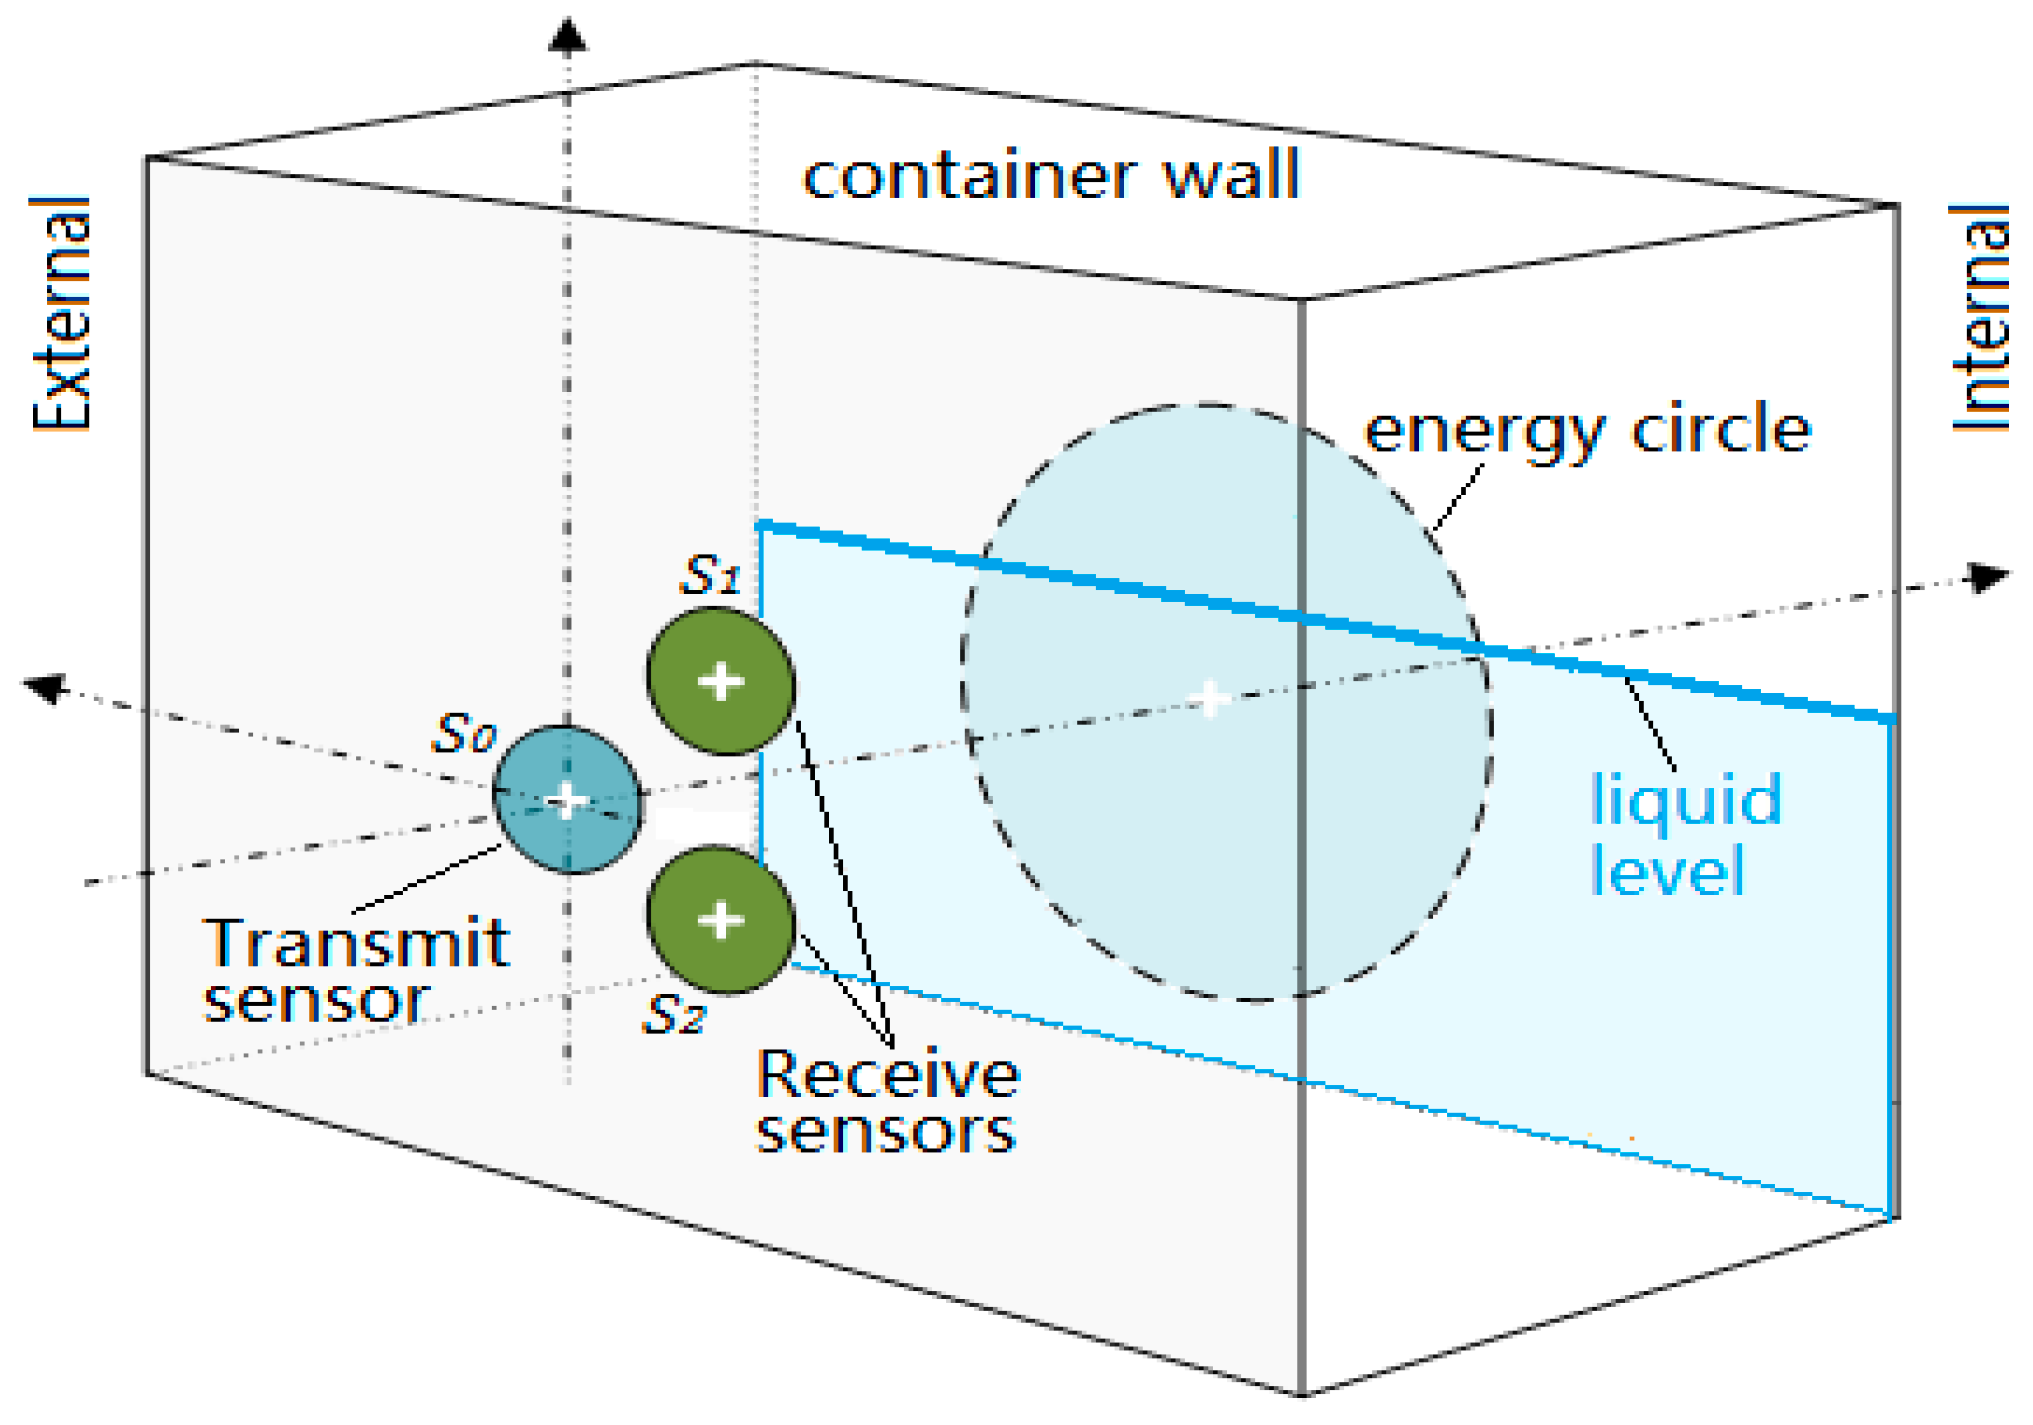
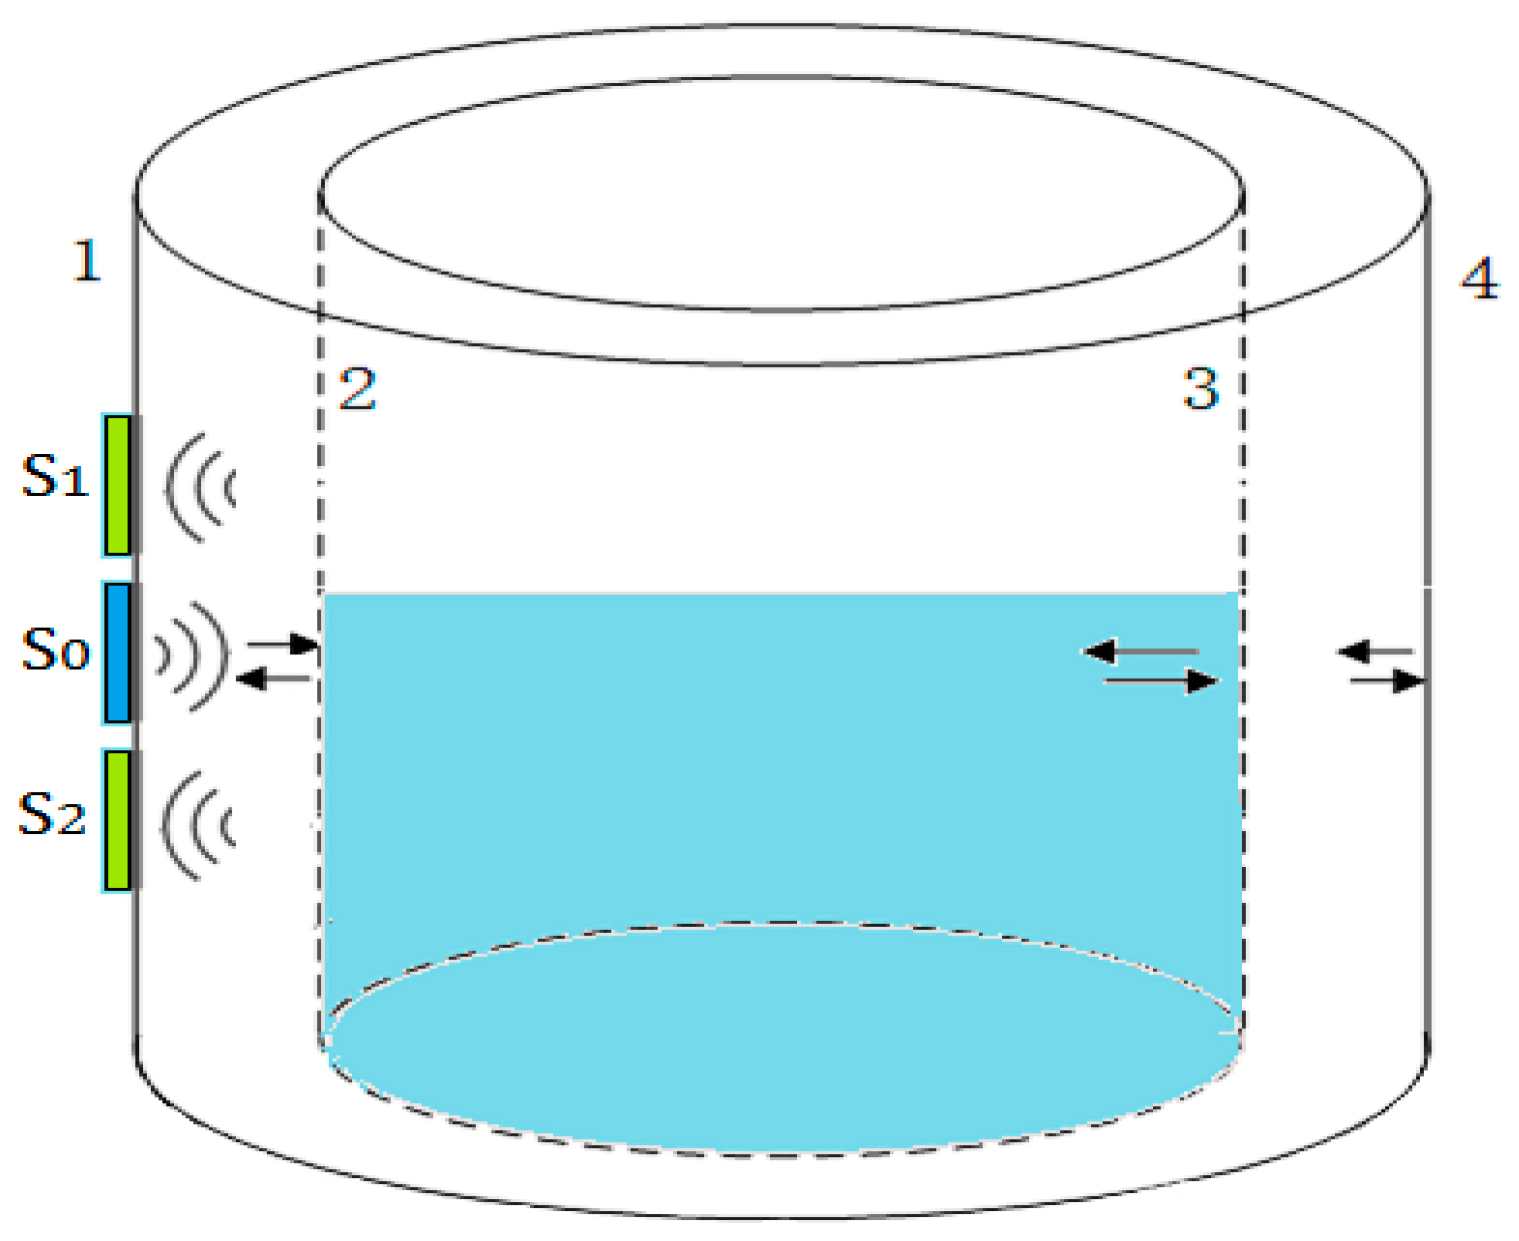
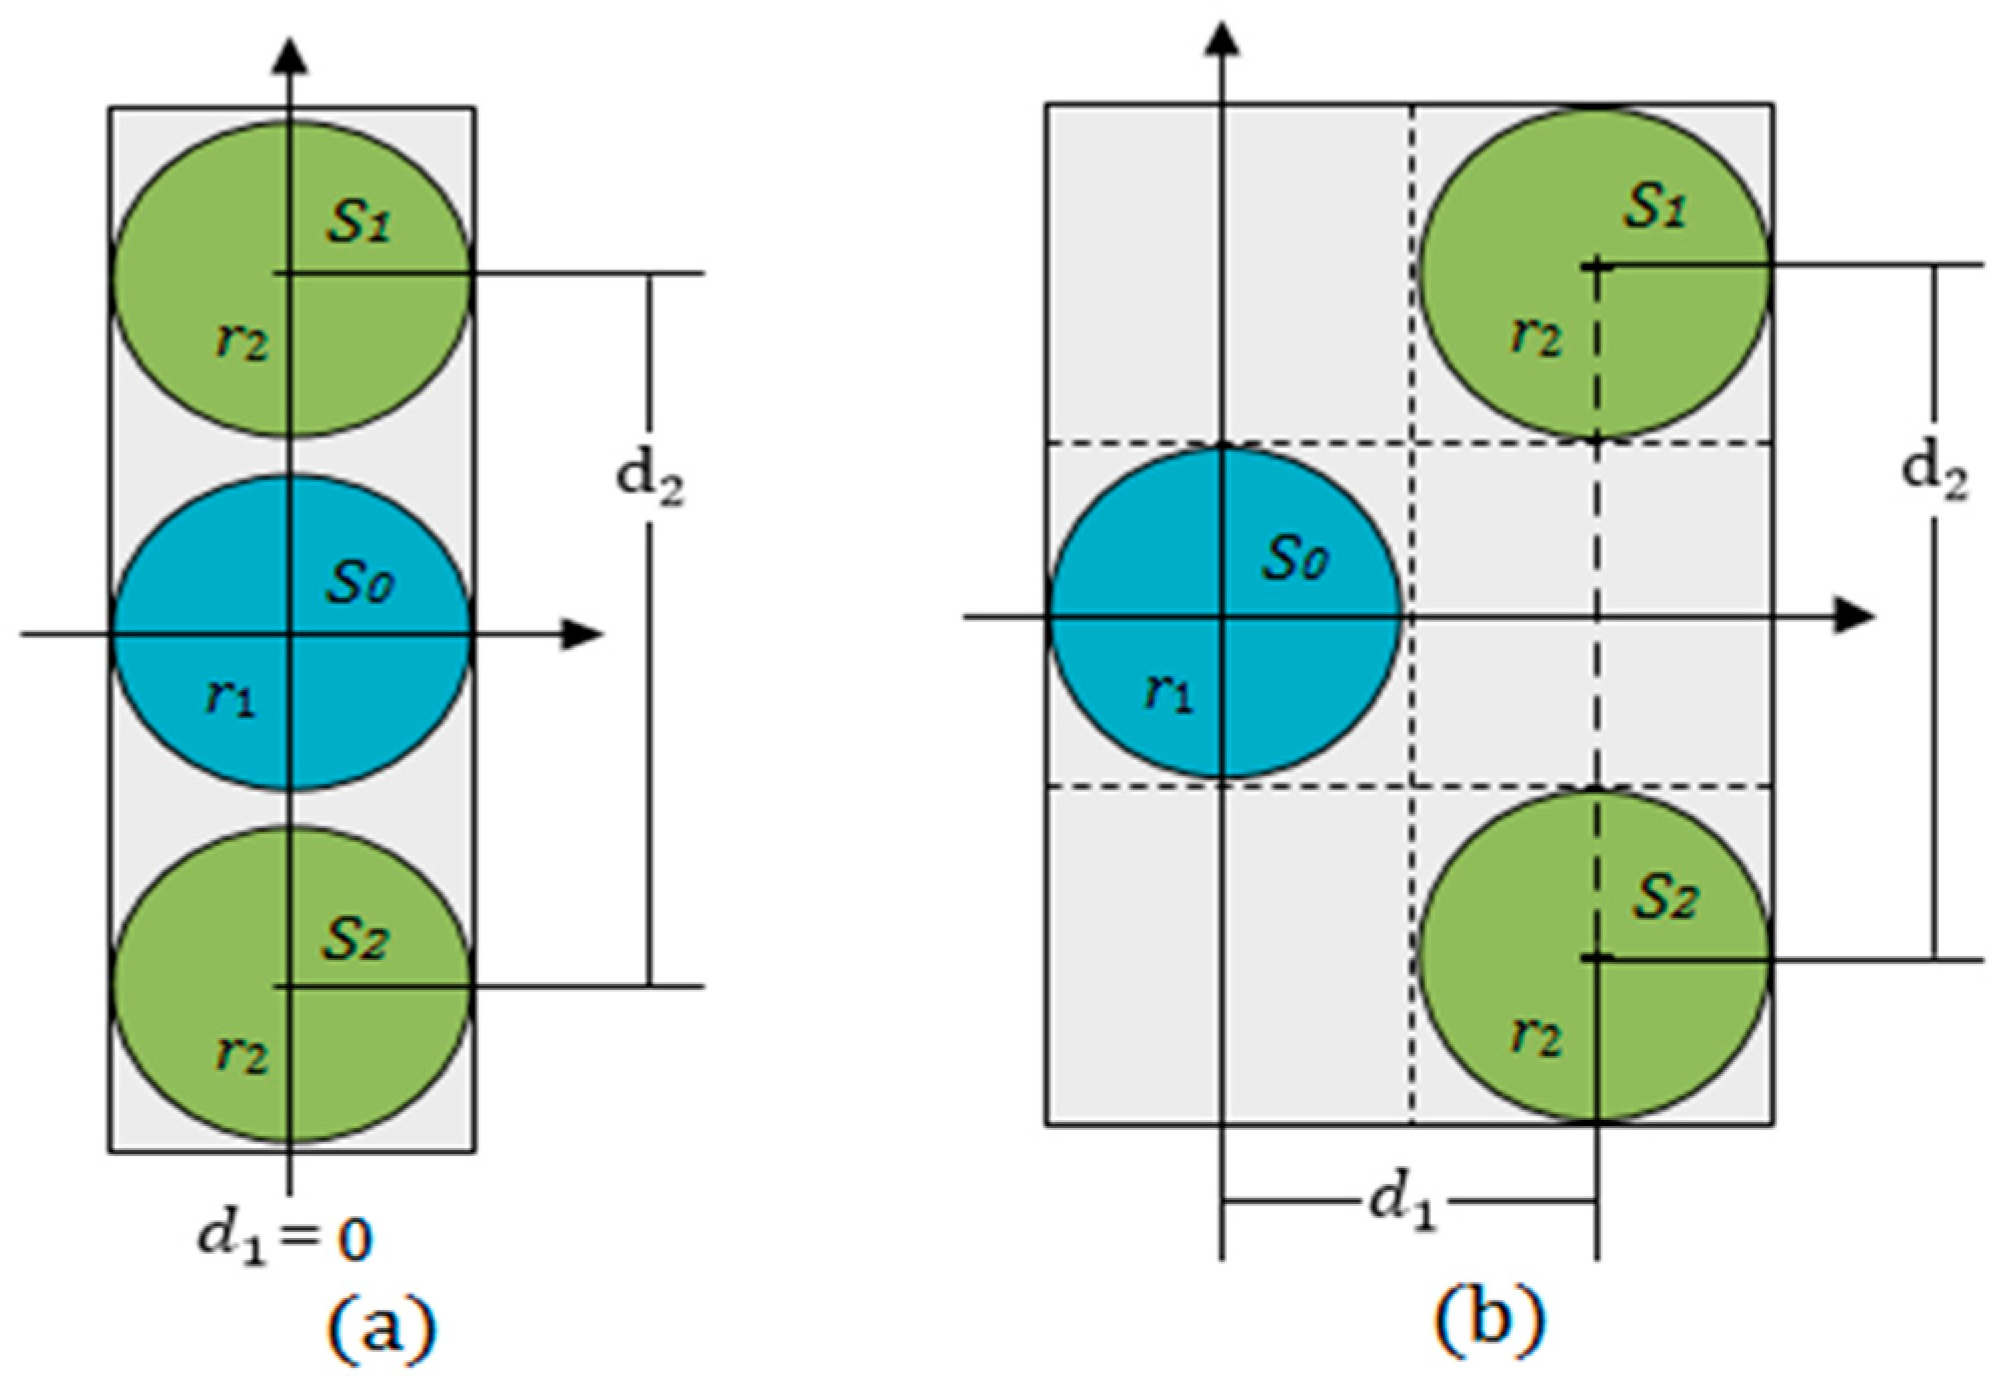
- The transducer is used as an ultrasonic transmitter. The other two sensors, and , are used as receivers;
- The distances and meet the conditions , . The two receiving sensors and are arranged symmetrically along the horizontal coordinate axis;
- Three sensors are placed on the same coupling plane and encapsulated in a rectangular plastic box with epoxy;
- In the detection process, the sensors are moved along the longitudinal direction on the surface of a container wall.
2. Theory and Methods
2.1. The Energy Circle
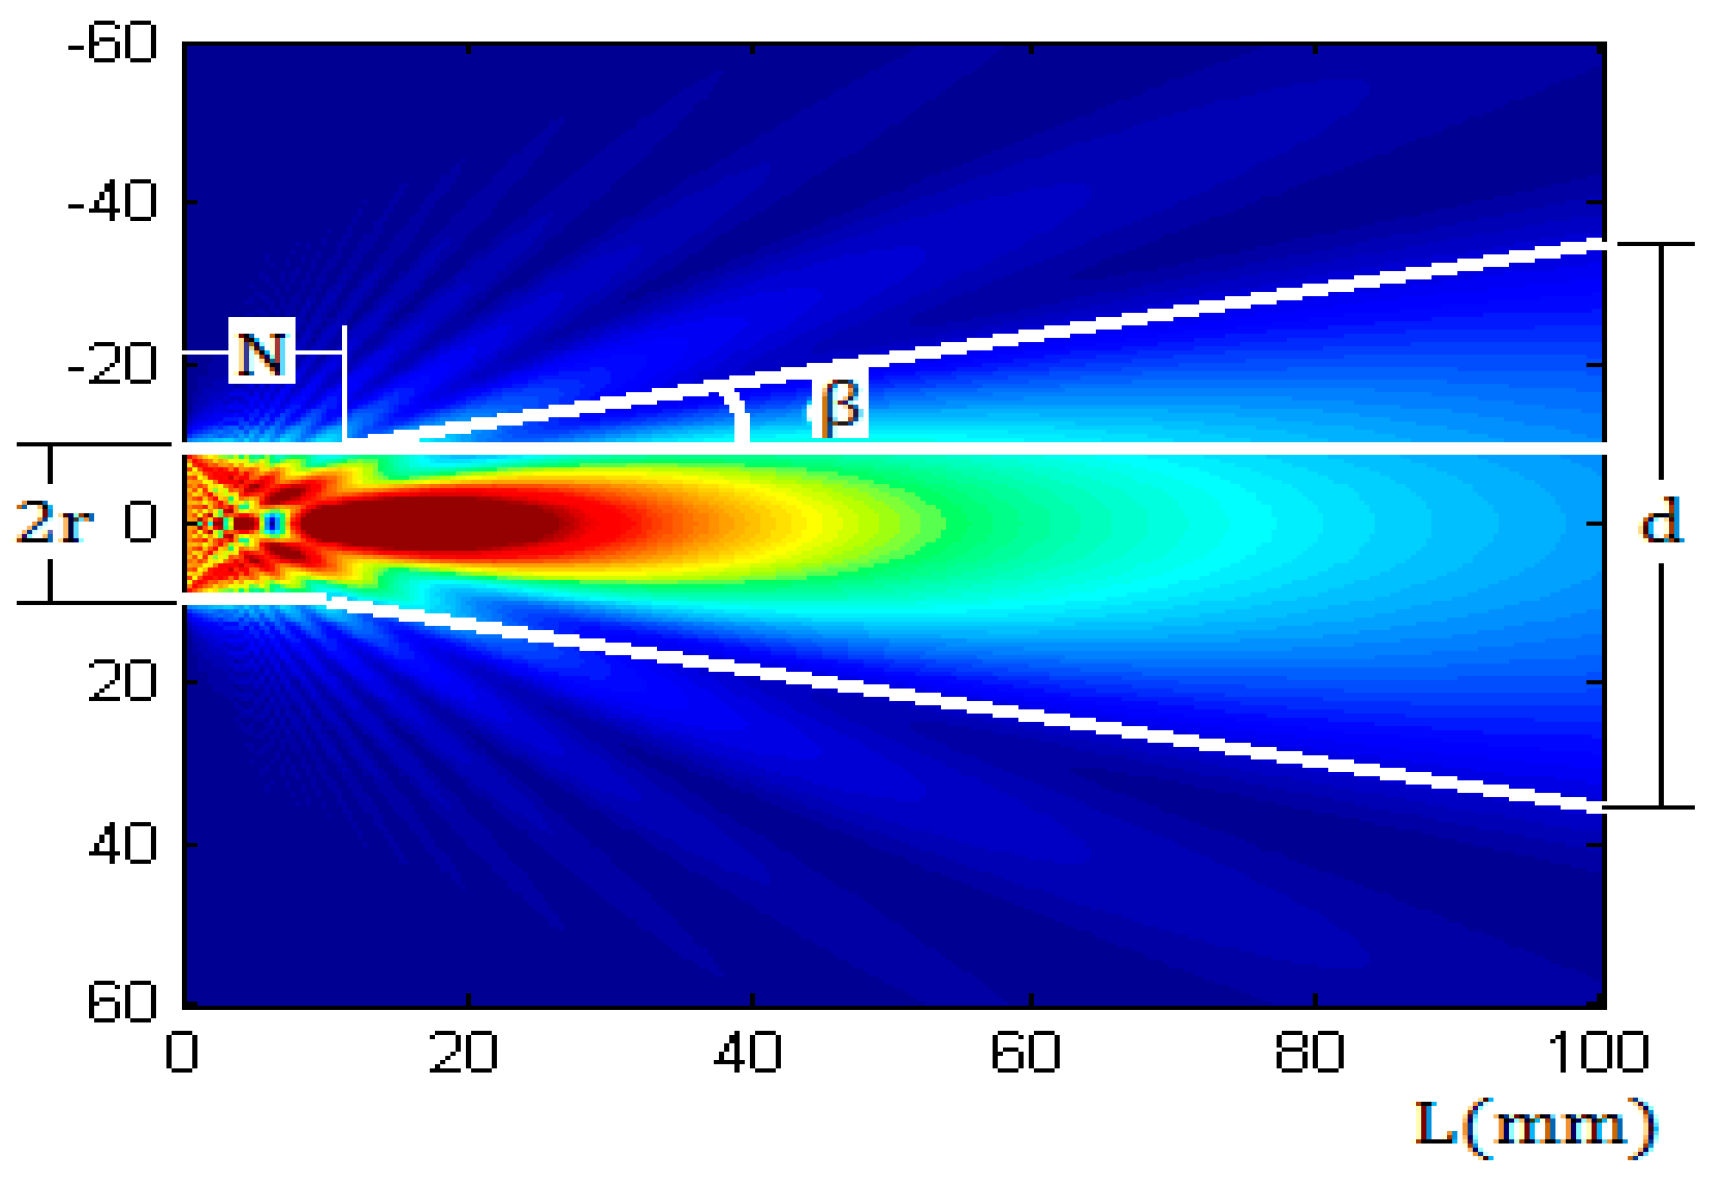
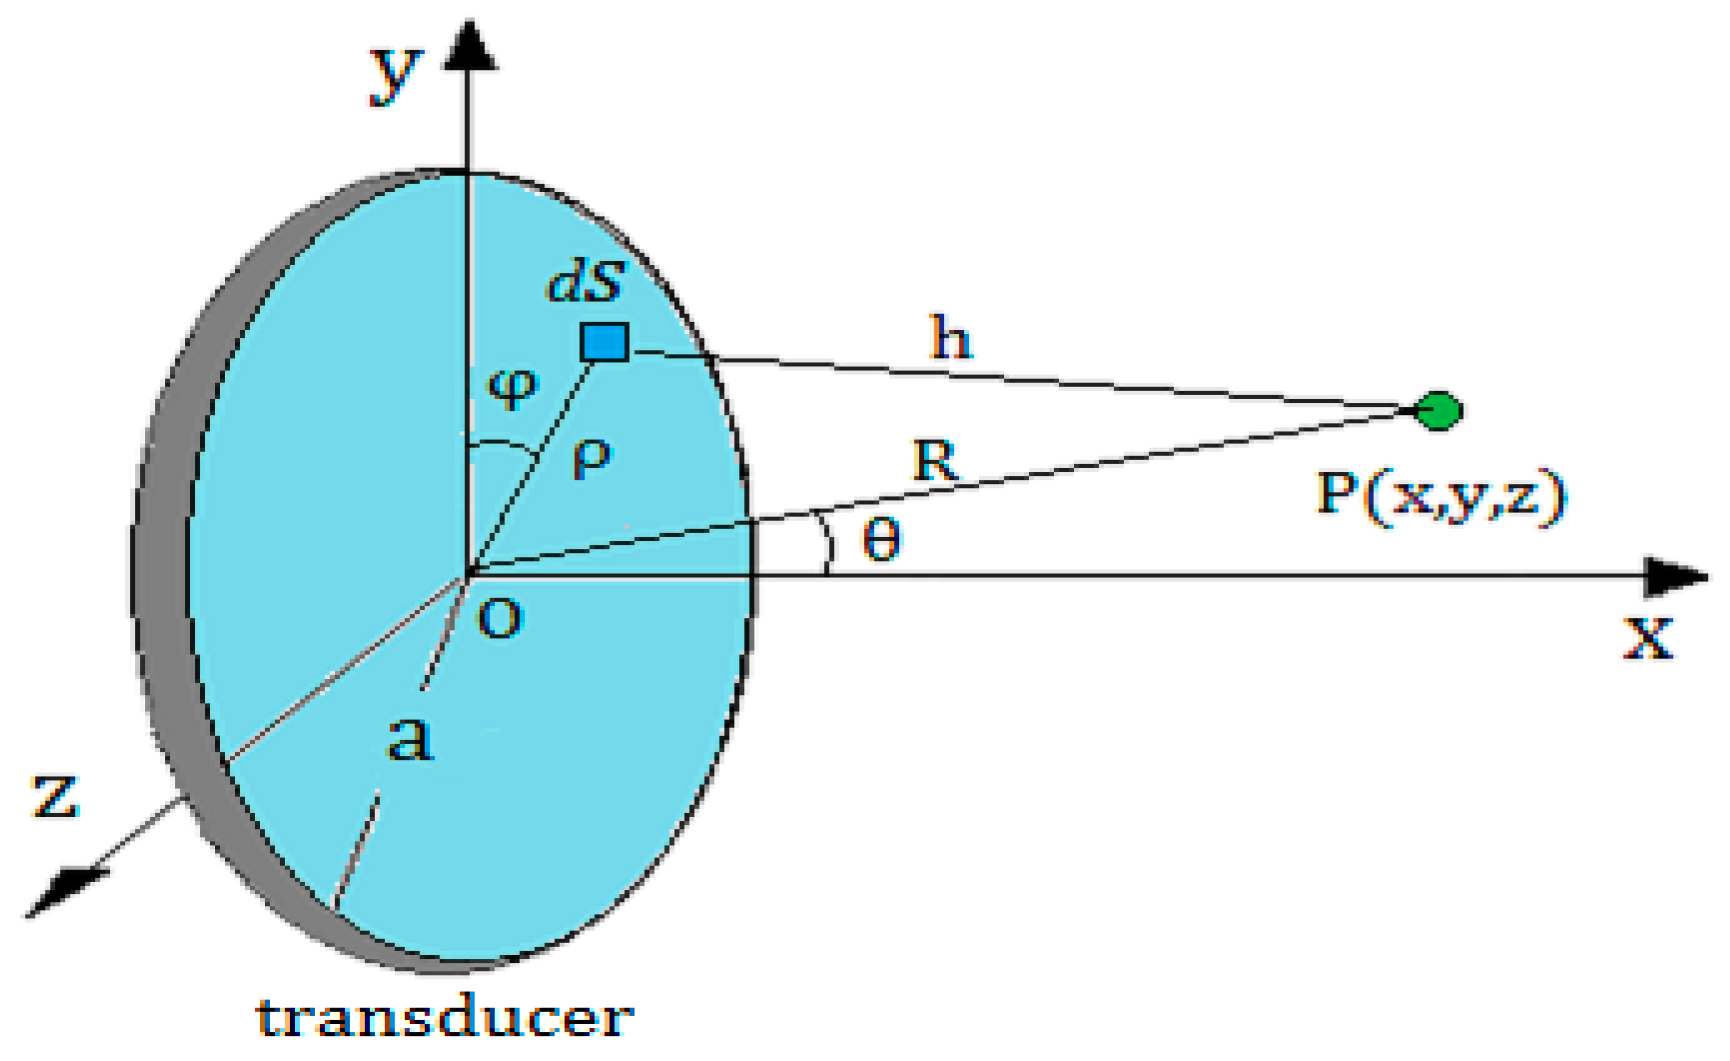
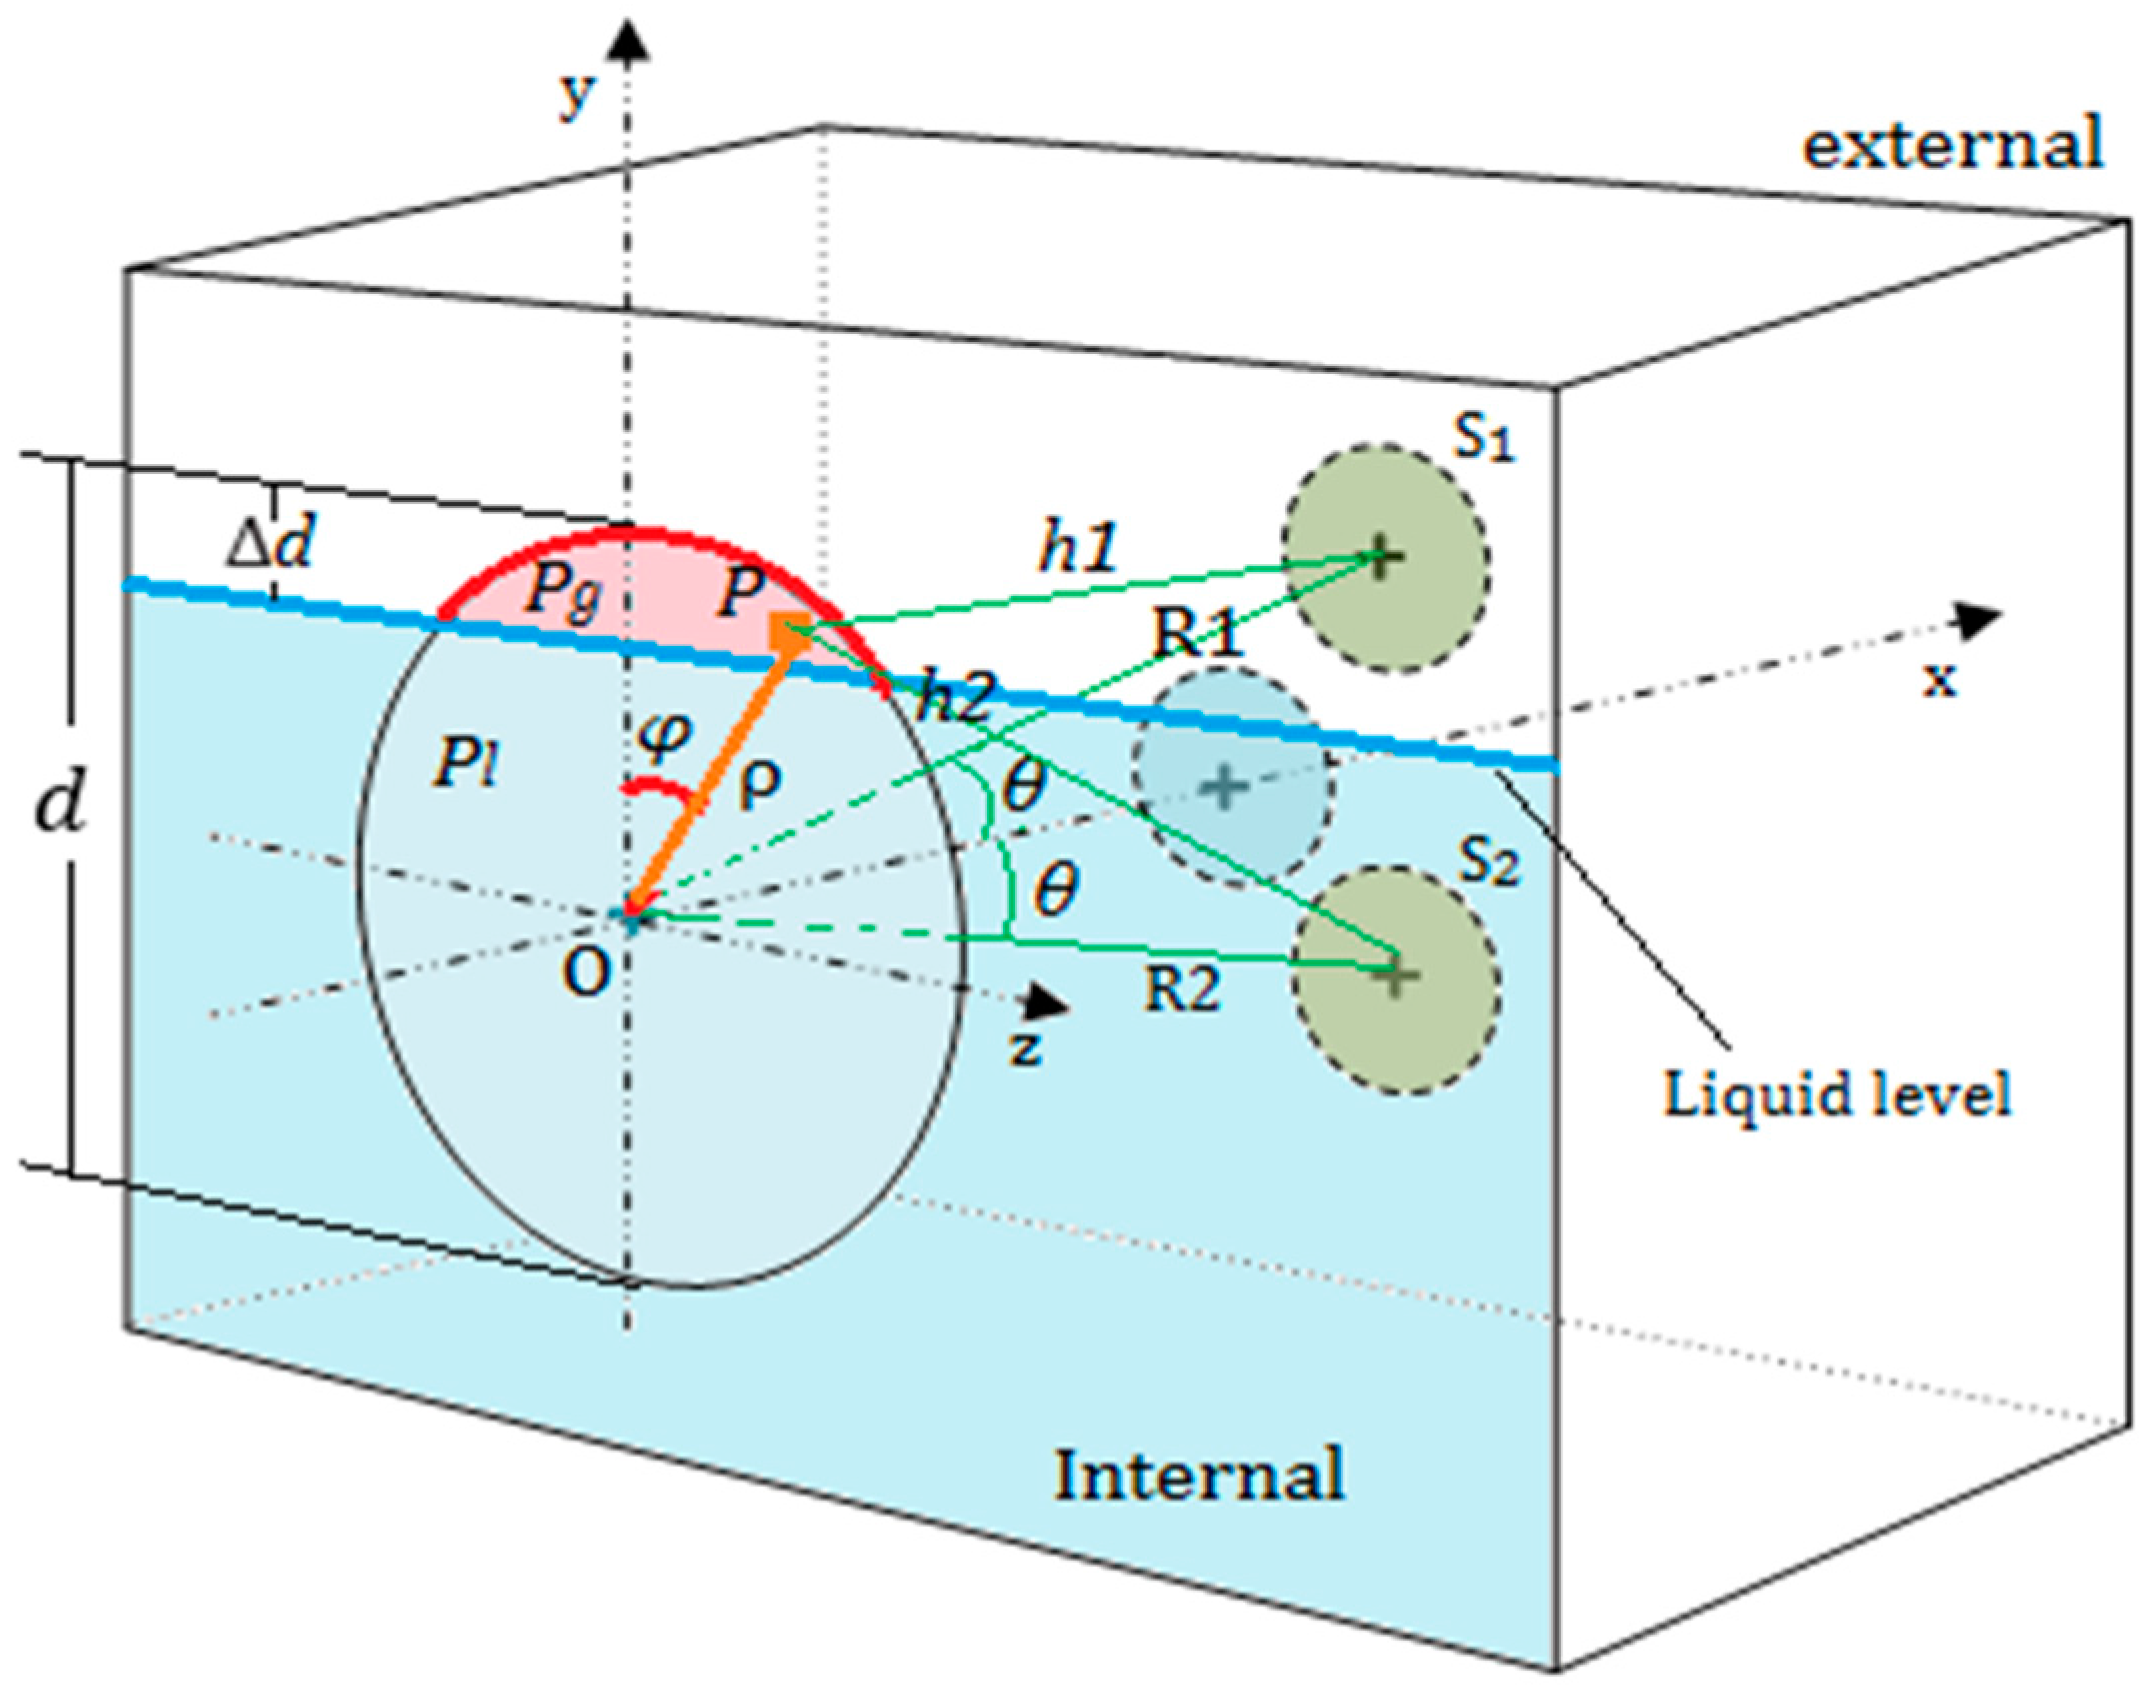
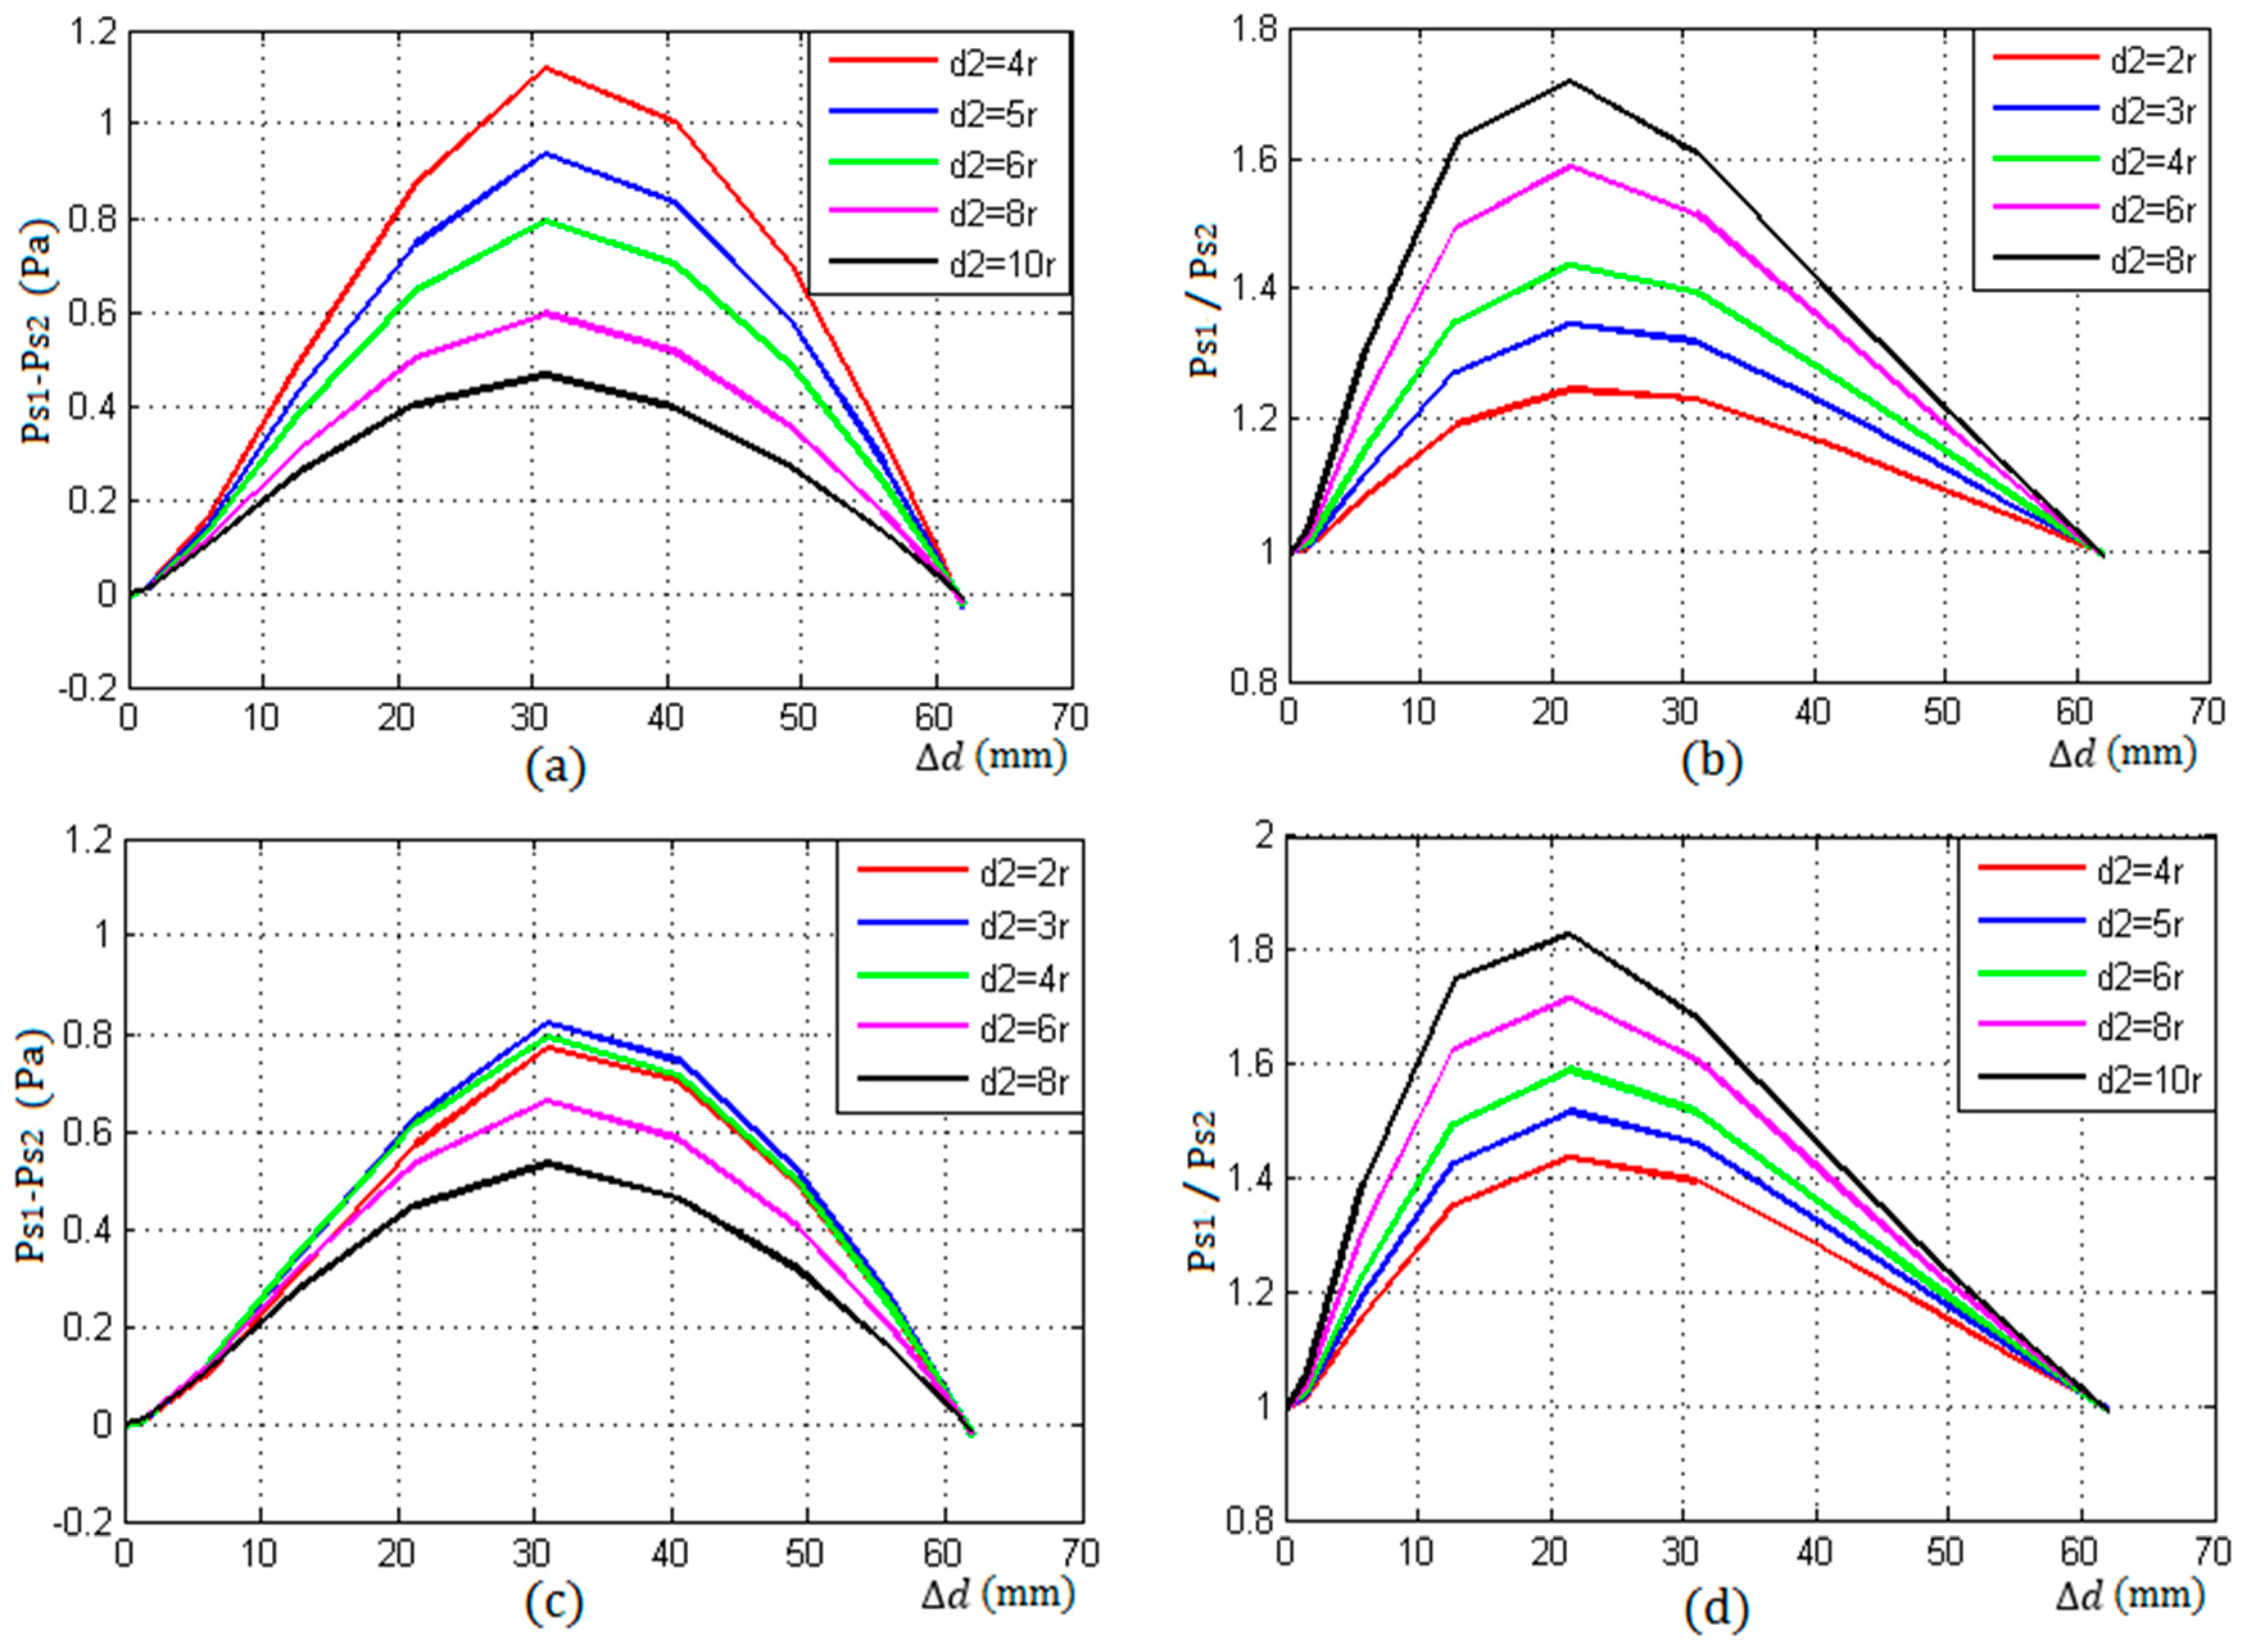
2.2. Sound Pressure Distribution at Any Point outside the Axis
2.3. Analysis of Echo Energy
3. Experimental Results
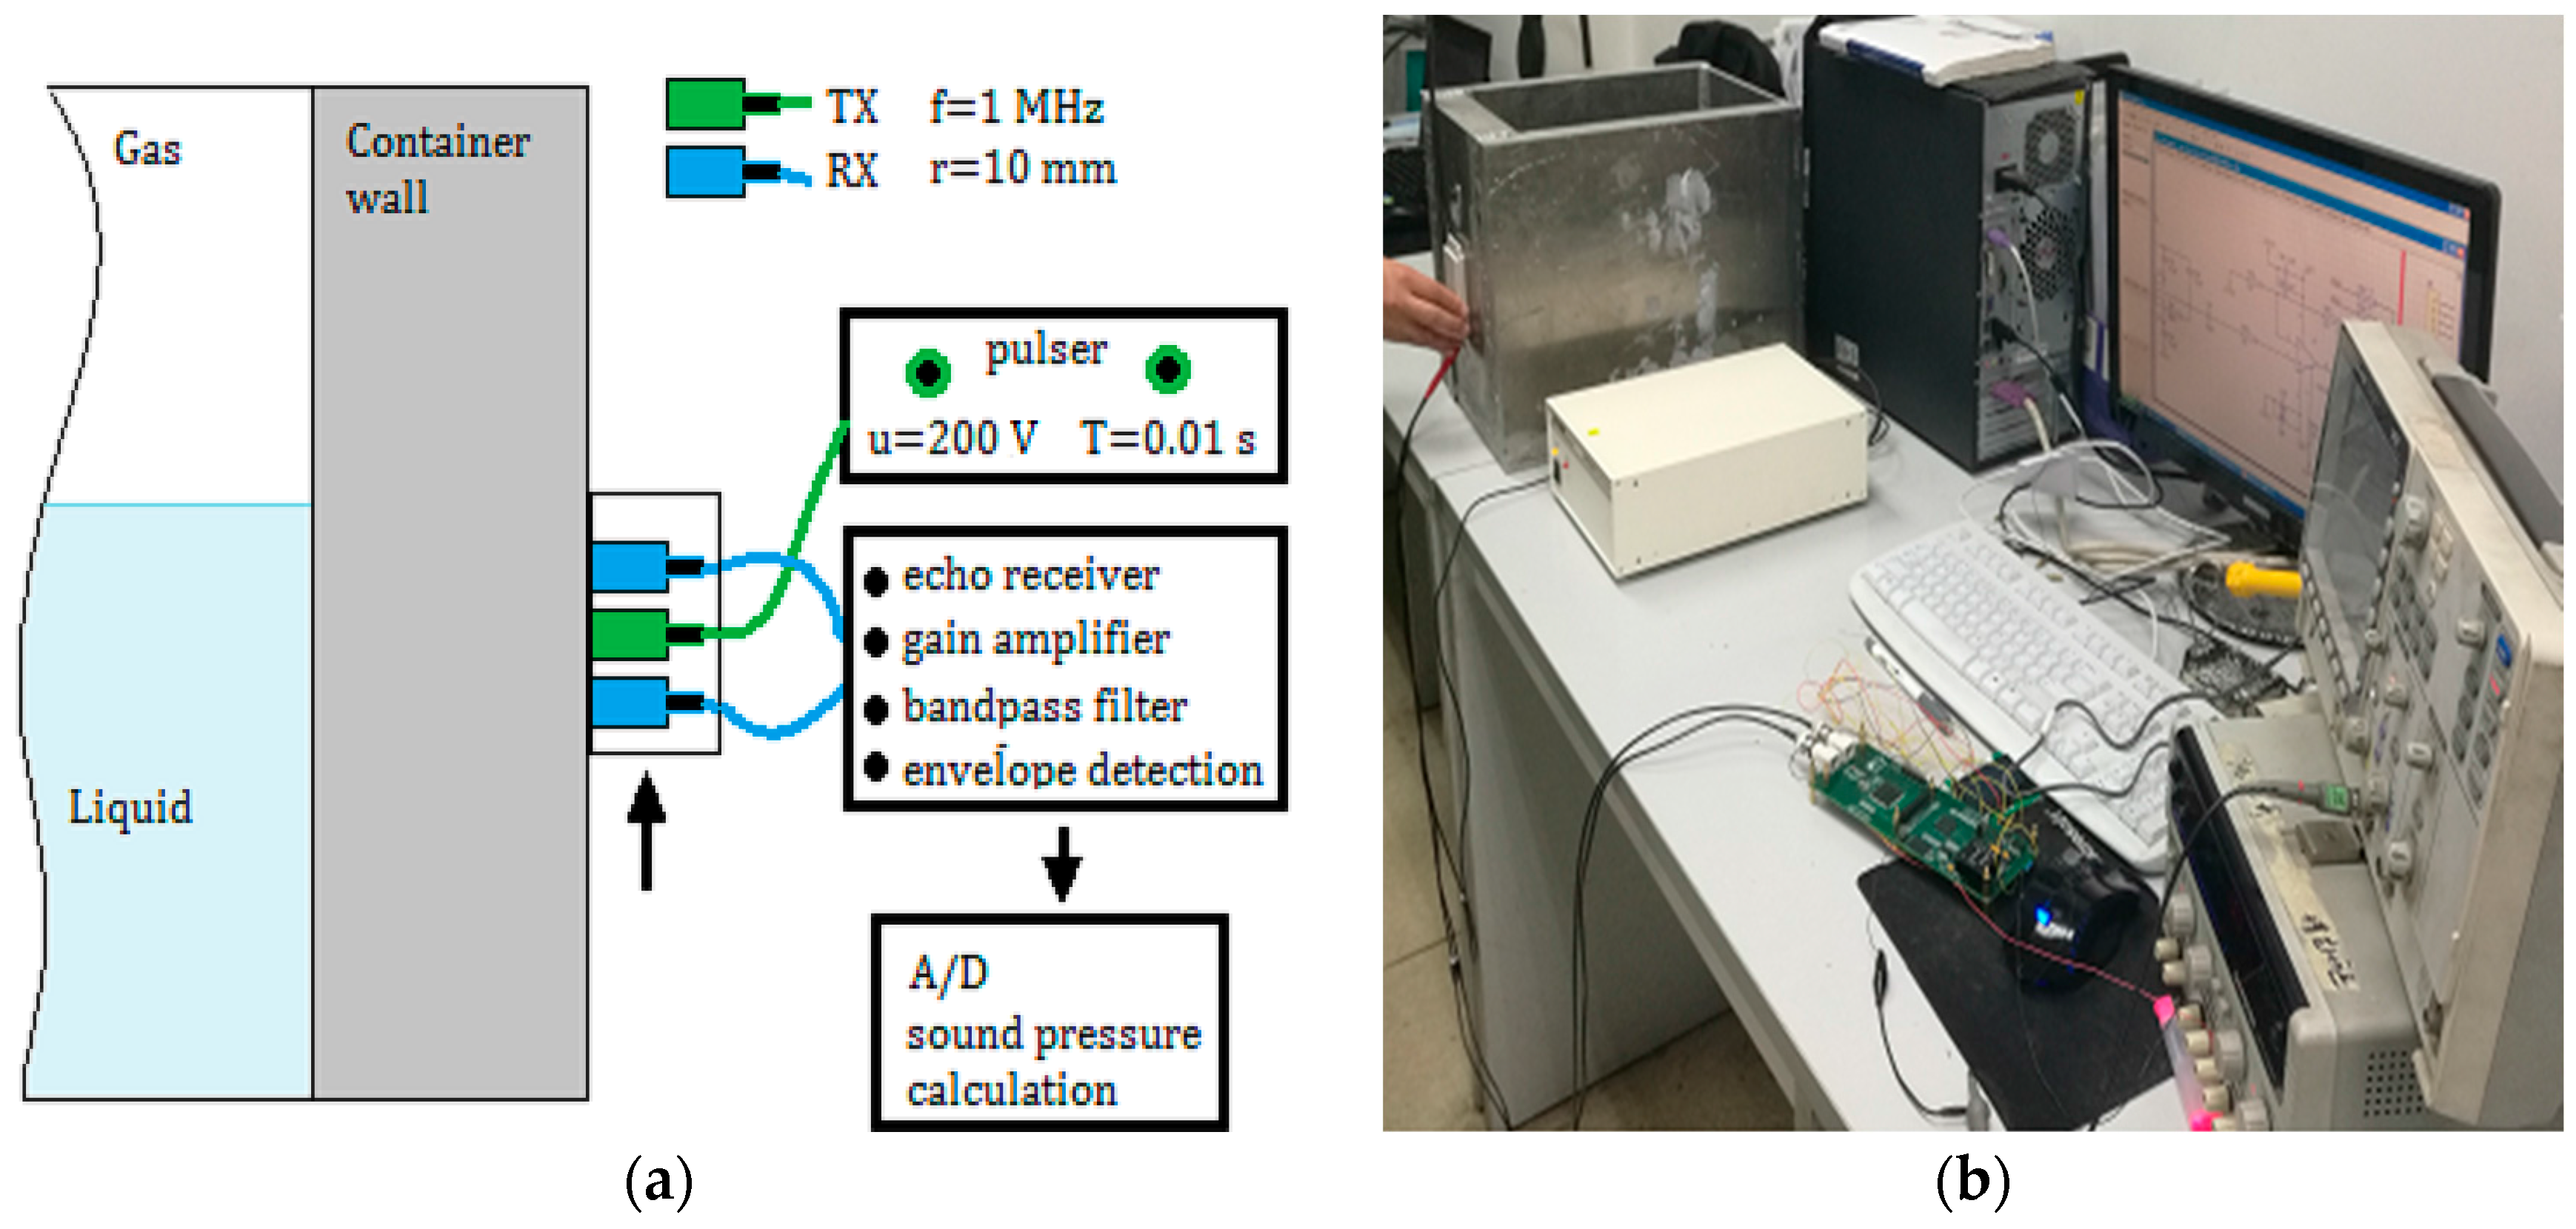
3.1. Measurement System and Initial Conditions
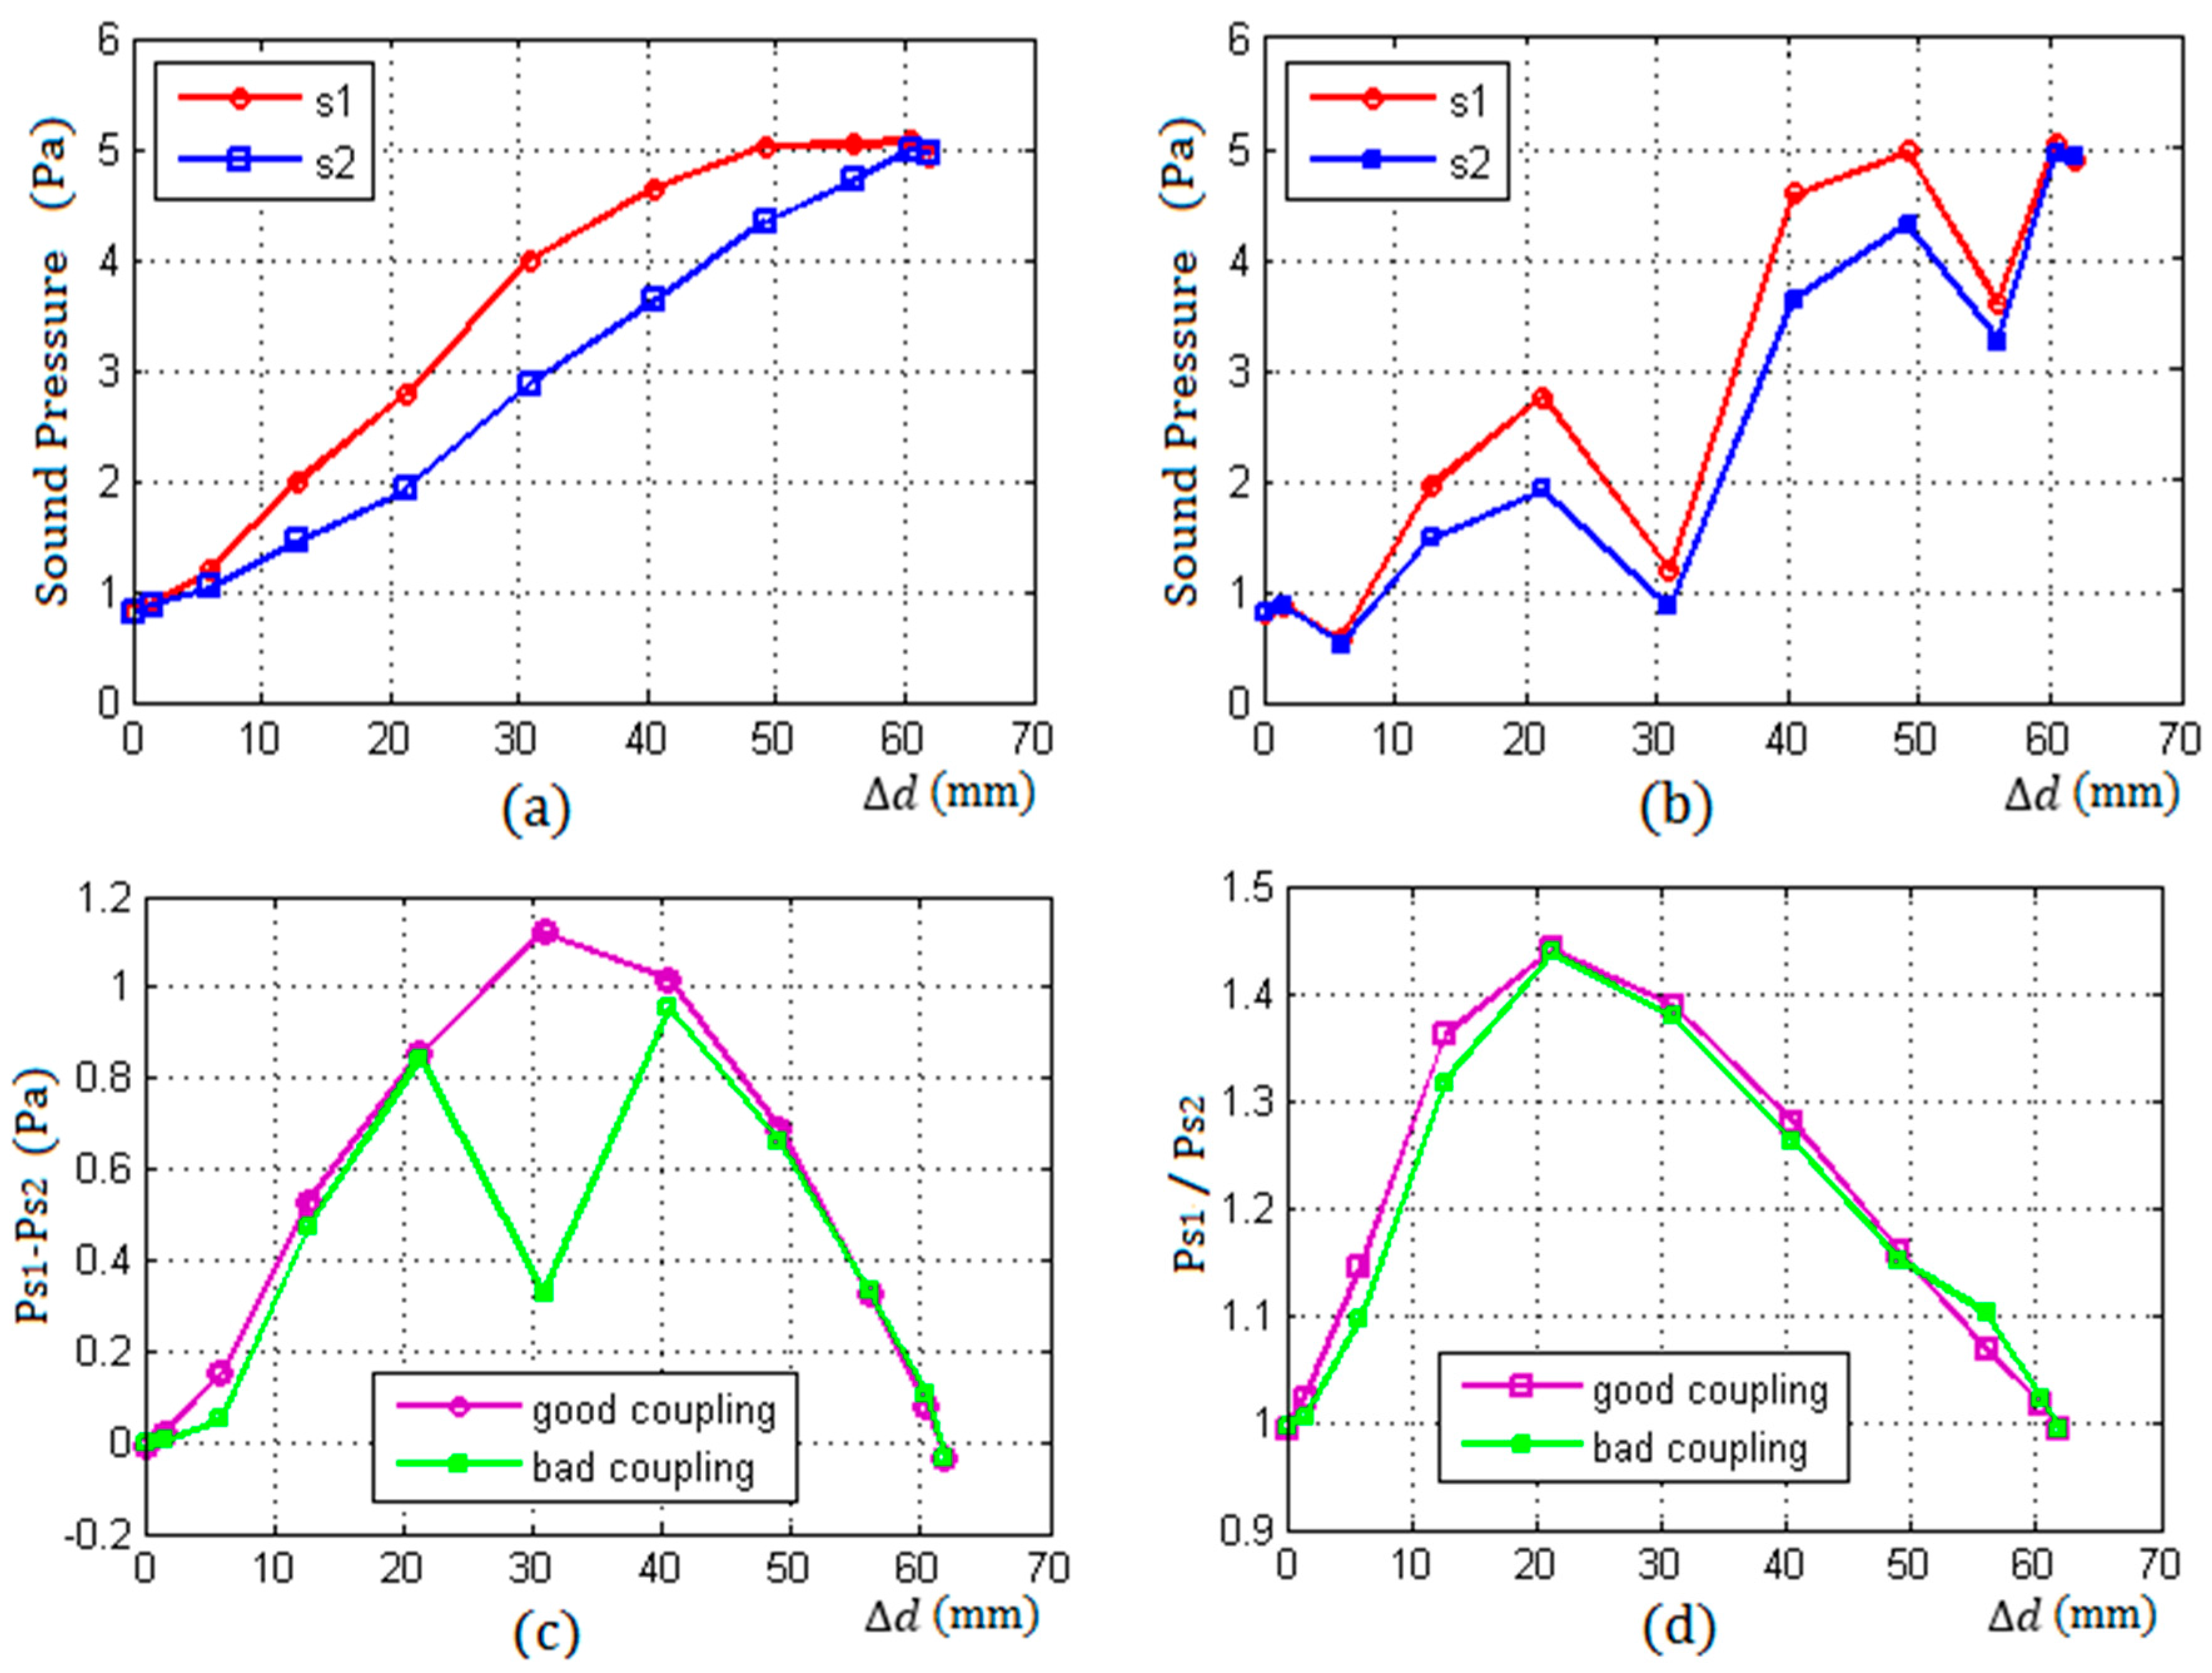
3.2. Results of Experiment
3.2.1. Comparison of Echo Energy under Different Coupling
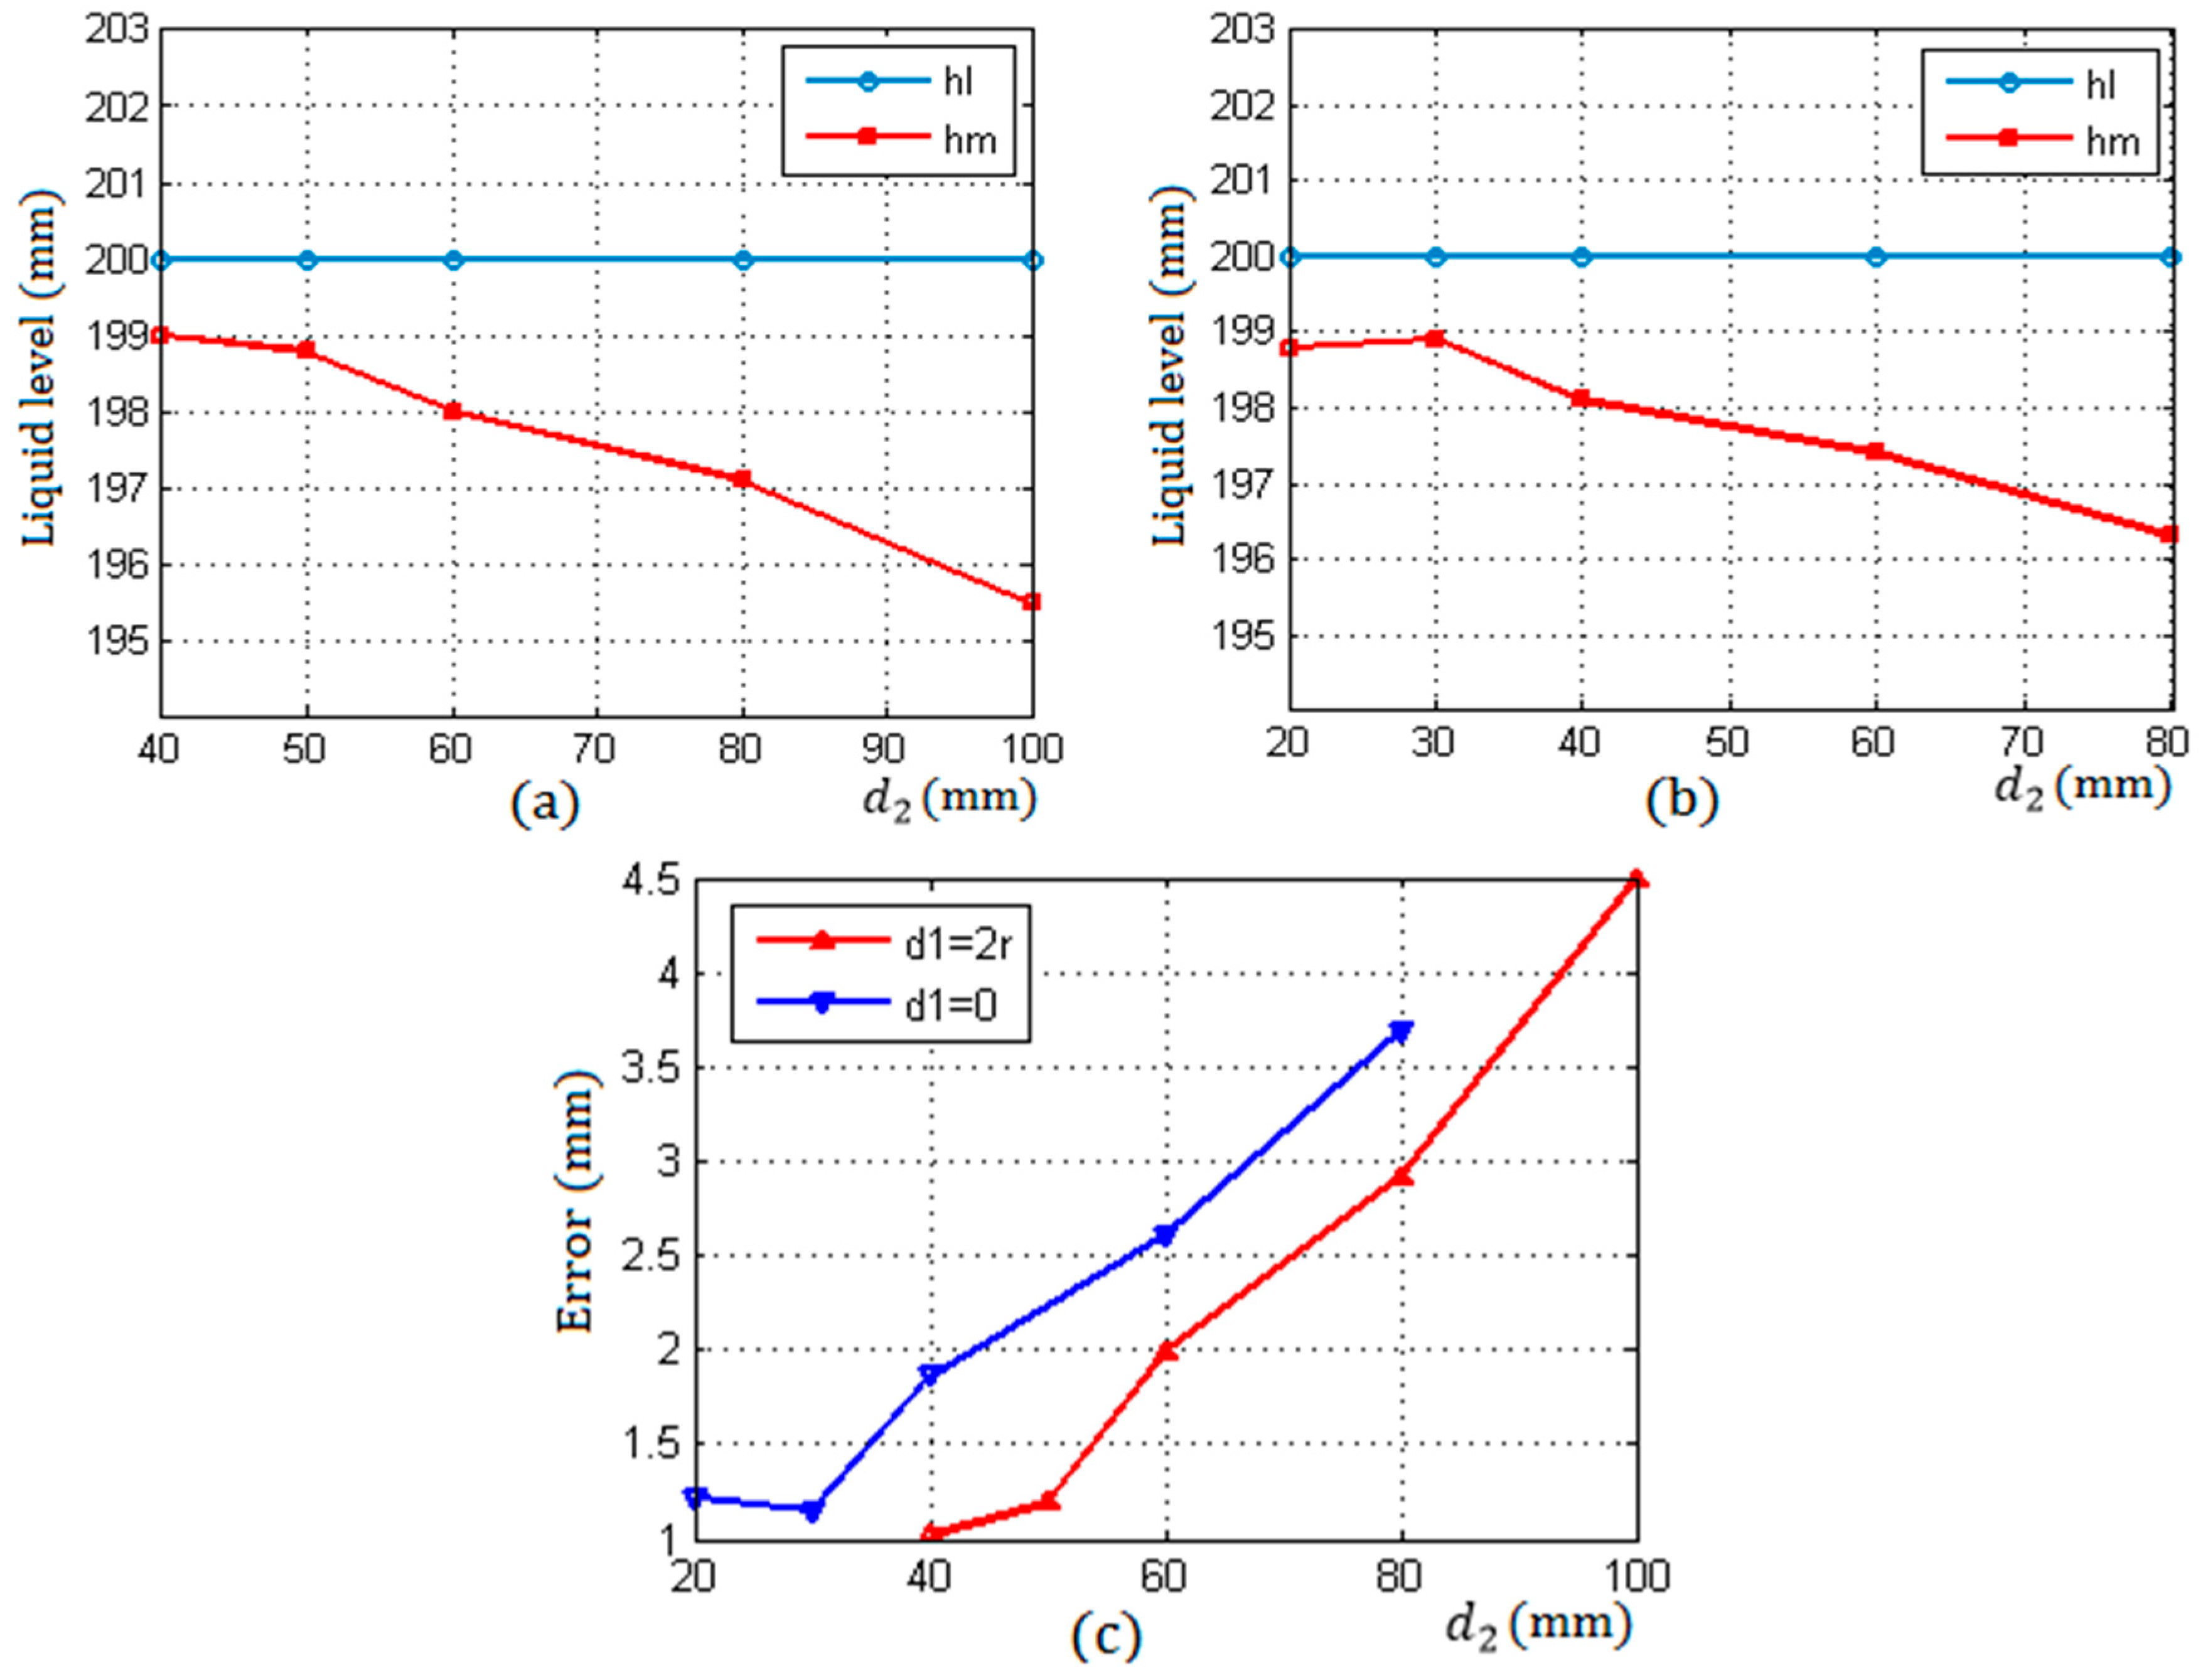
3.2.2. Results under Two Different Arrangements of Sensors
4. Discussion
5. Conclusions
Acknowledgments
Author Contributions
Conflicts of Interest
References
- Zhang, B.; Wei, Y.-J.; Liu, W.-Y.; Zhang, Y.-J.; Yao, Z.; Zhao, L.-H.; Xiong, J.-J. A Liquid Level Measurement Technique outside a Sealed Metal Container Based on Ultrasonic Impedance and Echo Energy. Sensors 2017, 17, 185. [Google Scholar] [CrossRef] [PubMed]
- Hao, H.H.; Xiong, J.Q. A Method of Liquid Level Measurement Based on Ultrasonic Echo Characteristics. In Proceedings of the 2010 International Conference on Computer Application and System Modeling (ICCASM 2010), Taiyuan, China, 22–24 October 2010. [Google Scholar]
- McCulloch, R.W. Measurement of liquid level in demanding environments using thermal differential technology. Proc. Adv. Instrum. 1990, 45, 1859–1867. [Google Scholar]
- He, X.P.; Zhang, F.; Li, B.; Zhang, D. The calculation of the echo energy transmission coefficient in ultrasonic liquid level testing. J. Shaanxi Norm. Univ. 2008, 36, 49. [Google Scholar]
- Sakharova, V.E.; Kuznetsova, S.A.; Zaitsevb, B.D.; Kuznetsovab, I.E.; Josh, S.G. Liquid level sensor using ultrasonic Lamb waves. Ultrasonics 2003, 41, 319–322. [Google Scholar] [CrossRef]
- Joshi, S.G.; Jin, Y. Propagation of ultrasonic Lamb waves in piezoelectric plates. J. Appl. Phys. 1991, 70, 4113–4120. [Google Scholar] [CrossRef]
- Schmerr, L.W. Fundamentals of Ultrasonic Nondestructive Evaluation: A Modeling Approach; Plenum Press: New York, NY, USA, 1998. [Google Scholar]
- Schmerr, L.W.; Sedov, A. An Elastodynamic Model for Compressional and Shear Wave Transducers. J. Acoust. Soc. Am. 1989, 86, 1988–1999. [Google Scholar] [CrossRef]
- Vezzeti, D.J. Propagation of Bounded Ultrasonic Beams in Anisotropic Media. J. Acoust. Soc. Am. 1985, 78, 1103–1108. [Google Scholar] [CrossRef]
- Roa-Prada, S.; Scarton, H.A.; Saulnier, G.J.; Shoudy, D.A.; Ashdown, J.D.; Das, P.K.; Gavens, A.J. An Ultrasonic Through-Wall Communication (UTWC) System Model. J. Vibr. Acoust. 2013, 135. [Google Scholar] [CrossRef]
- Jeong, H.; Schmerr, L.W., Jr. Ultrasonic Beam Propagation in Highly Anisotropic Materials Simulated by Multi-Gaussian Beams. J. Mech. Sci. Technol. 2007, 21, 1184–1190. [Google Scholar] [CrossRef]
- Kim, H.-J.; Park, J.-S.; Song, S.-J. Modeling Angle Beam Ultrasonic Testing Using Multi-Gaussian Beams. J. Nondestruct. Eval. 2004, 23, 81–93. [Google Scholar] [CrossRef]
- Spies, M. Ultrasonic field modeling for immersed components using Gaussian beam superposition. Ultrasonics 2007, 46, 138–147. [Google Scholar] [CrossRef] [PubMed]
- Bass, R. Diffractions Effects in the Ultrasonic Field of a Piston Source. J. Acoust. Soc. Am. 1958, 30, 602–605. [Google Scholar] [CrossRef]
- Eaton, D.W. Backscattering from spherical elastic inclusions and accuracy of the kirchhoff approximation for curved interfaces. Geophys. J. Int. 2006, 166, 1249–1258. [Google Scholar] [CrossRef]
- Hargreaves, J.A.; Lam, Y.W. An energy interpretation of the Kirchhoff-Helmholtz boundary integral equation and its application to sound field synthesis. Acta Acust. Unit. Acust. 2014, 100, 912–920. [Google Scholar] [CrossRef]
- Kohei, Y.; Yasuhiro, O. Optically visualized sound field reconstruction using Kirchhoff-Helmholtz equation. Acoust. Sci. Technol. 2015, 36, 351–354. [Google Scholar]


| Parameters Meaning | Initial Values |
|---|---|
| the thickness of the container wall | L = 8 mm, 25 mm, 40 mm, 50 mm |
| the impedance of the metal container | |
| the impedance of gas media in the container | |
| the impedance of liquid media in the container | |
| the reflection coefficient between the inner wall and gas | |
| the reflection coefficient between the inner wall and liquid | |
| the reflection coefficient between the outer wall and air | |
| the center frequency of the transmitting transducer | |
| the repetition frequency of a pulse | |
| the repetition period of a pulse | |
| the excitation voltage | |
| the operating temperature range of sensors | (−10~80) °C |
| the diameter of the sensors | |
| the ultrasonic attenuation coefficient in the container wall. |
| L | r1,r2 | N | d | d1 | d2 | |||
|---|---|---|---|---|---|---|---|---|
| 50 | 10 | 12.5 | 61.93 | 0 | 4r | 198.99 | 200 | 1.02 |
| 50 | 10 | 12.5 | 61.93 | 0 | 5r | 198.82 | 200 | 1.19 |
| 50 | 10 | 12.5 | 61.93 | 0 | 6r | 198.01 | 200 | 1.99 |
| 50 | 10 | 12.5 | 61.93 | 0 | 8r | 197.08 | 200 | 2.92 |
| 50 | 10 | 12.5 | 61.93 | 0 | 10r | 195.52 | 200 | 4.49 |
| 50 | 10 | 12.5 | 61.93 | 2r | 2r | 198.78 | 200 | 1.22 |
| 50 | 10 | 12.5 | 61.93 | 2r | 3r | 198.85 | 200 | 1.15 |
| 50 | 10 | 12.5 | 61.93 | 2r | 4r | 198.14 | 200 | 1.86 |
| 50 | 10 | 12.5 | 61.93 | 2r | 6r | 197.39 | 200 | 2.61 |
| 50 | 10 | 12.5 | 61.93 | 2r | 8r | 196.31 | 200 | 3.69 |
© 2017 by the authors. Licensee MDPI, Basel, Switzerland. This article is an open access article distributed under the terms and conditions of the Creative Commons Attribution (CC BY) license (http://creativecommons.org/licenses/by/4.0/).
Share and Cite
Zhang, B.; Wei, Y.-J.; Liu, W.-Y.; Zhang, Y.-J.; Yao, Z.; Zhang, L.; Xiong, J.-J. A Novel Ultrasonic Method for Liquid Level Measurement Based on the Balance of Echo Energy. Sensors 2017, 17, 706. https://doi.org/10.3390/s17040706
Zhang B, Wei Y-J, Liu W-Y, Zhang Y-J, Yao Z, Zhang L, Xiong J-J. A Novel Ultrasonic Method for Liquid Level Measurement Based on the Balance of Echo Energy. Sensors. 2017; 17(4):706. https://doi.org/10.3390/s17040706
Chicago/Turabian StyleZhang, Bin, Yue-Juan Wei, Wen-Yi Liu, Yan-Jun Zhang, Zong Yao, Liang Zhang, and Ji-Jun Xiong. 2017. "A Novel Ultrasonic Method for Liquid Level Measurement Based on the Balance of Echo Energy" Sensors 17, no. 4: 706. https://doi.org/10.3390/s17040706
APA StyleZhang, B., Wei, Y.-J., Liu, W.-Y., Zhang, Y.-J., Yao, Z., Zhang, L., & Xiong, J.-J. (2017). A Novel Ultrasonic Method for Liquid Level Measurement Based on the Balance of Echo Energy. Sensors, 17(4), 706. https://doi.org/10.3390/s17040706