Article

Design of Novel FBG-Based Sensor of Differential Pressure with Magnetic Transfer

1
Research Center for Fiber Optic Sensing Technology National Local Joint Engineering, Electronic Engineering College, Heilongjiang University, Harbin 150080, China
2
Physics Department, Harbin Institute of Technology, Harbin 150001, China
3
College of Information Science and Technology, Heilongjiang University, Harbin 150080, China
*
Author to whom correspondence should be addressed.
Sensors 2017, 17(2), 375; https://doi.org/10.3390/s17020375
Submission received: 14 December 2016 / Revised: 7 February 2017 / Accepted: 9 February 2017 / Published: 15 February 2017
(This article belongs to the Special Issue Recent Advances in Fiber Bragg Grating Sensing)

Abstract

:
In this paper, a differential pressure sensor with magnetic transfer is proposed, in which the non-electric measurement based on the fiber Bragg grating (FBG) with the position limiting mechanism is implemented without the direct contact of the sensing unit with the measuring fluid. The test shows that the designed sensor is effective for measuring differential pressure in the range of 0~10 kPa with a sensitivity of 0.0112 nm/kPa, which can be used in environments with high temperature, strong corrosion and high overload measurements.

1. Introduction

The differential pressure sensor has been widely used in differential pressure signal measurements of fluid. When the fluid flows through the point to be measured, the tiny pressure difference between the two sampling points can be measured by the sensor [1]. Traditional electronic sensors are vulnerable to electromagnetic interference and are not suitable for applications in flammable and explosive places. In recent years, with the development of sensing technology, FBG has become one of the candidates to replace those traditional electronic sensors [2,3,4,5]. For example, different strategies have been adopted successfully in order to obtain feasible and reliable temperature sensing [6].
Figure 1 describes the typical structure of a differential pressure sensor including the FBG. In differential pressure sensing, a pressure-transferring diaphragm is required to have contact with the medium in both directions. Usually the sensing unit should be immersed in the measured fluid, which may result in interference to the measurement. In order to guarantee the sensitivity and durability of the sensor, special approaches should be taken in real measurement environments with high temperatures, high pressures, overload [7,8] and corrosion [9,10].
It should be pointed out that an FBG-sensitive element must be protected effectively, although it is extremely hard to encapsulate the FBG in a sensor in reality. In a real design, the advantage over traditional sensors and the effective protection of the FBG should be taken into account.

2. Designs of Differential Pressure Sensor with Magnetic Transfer

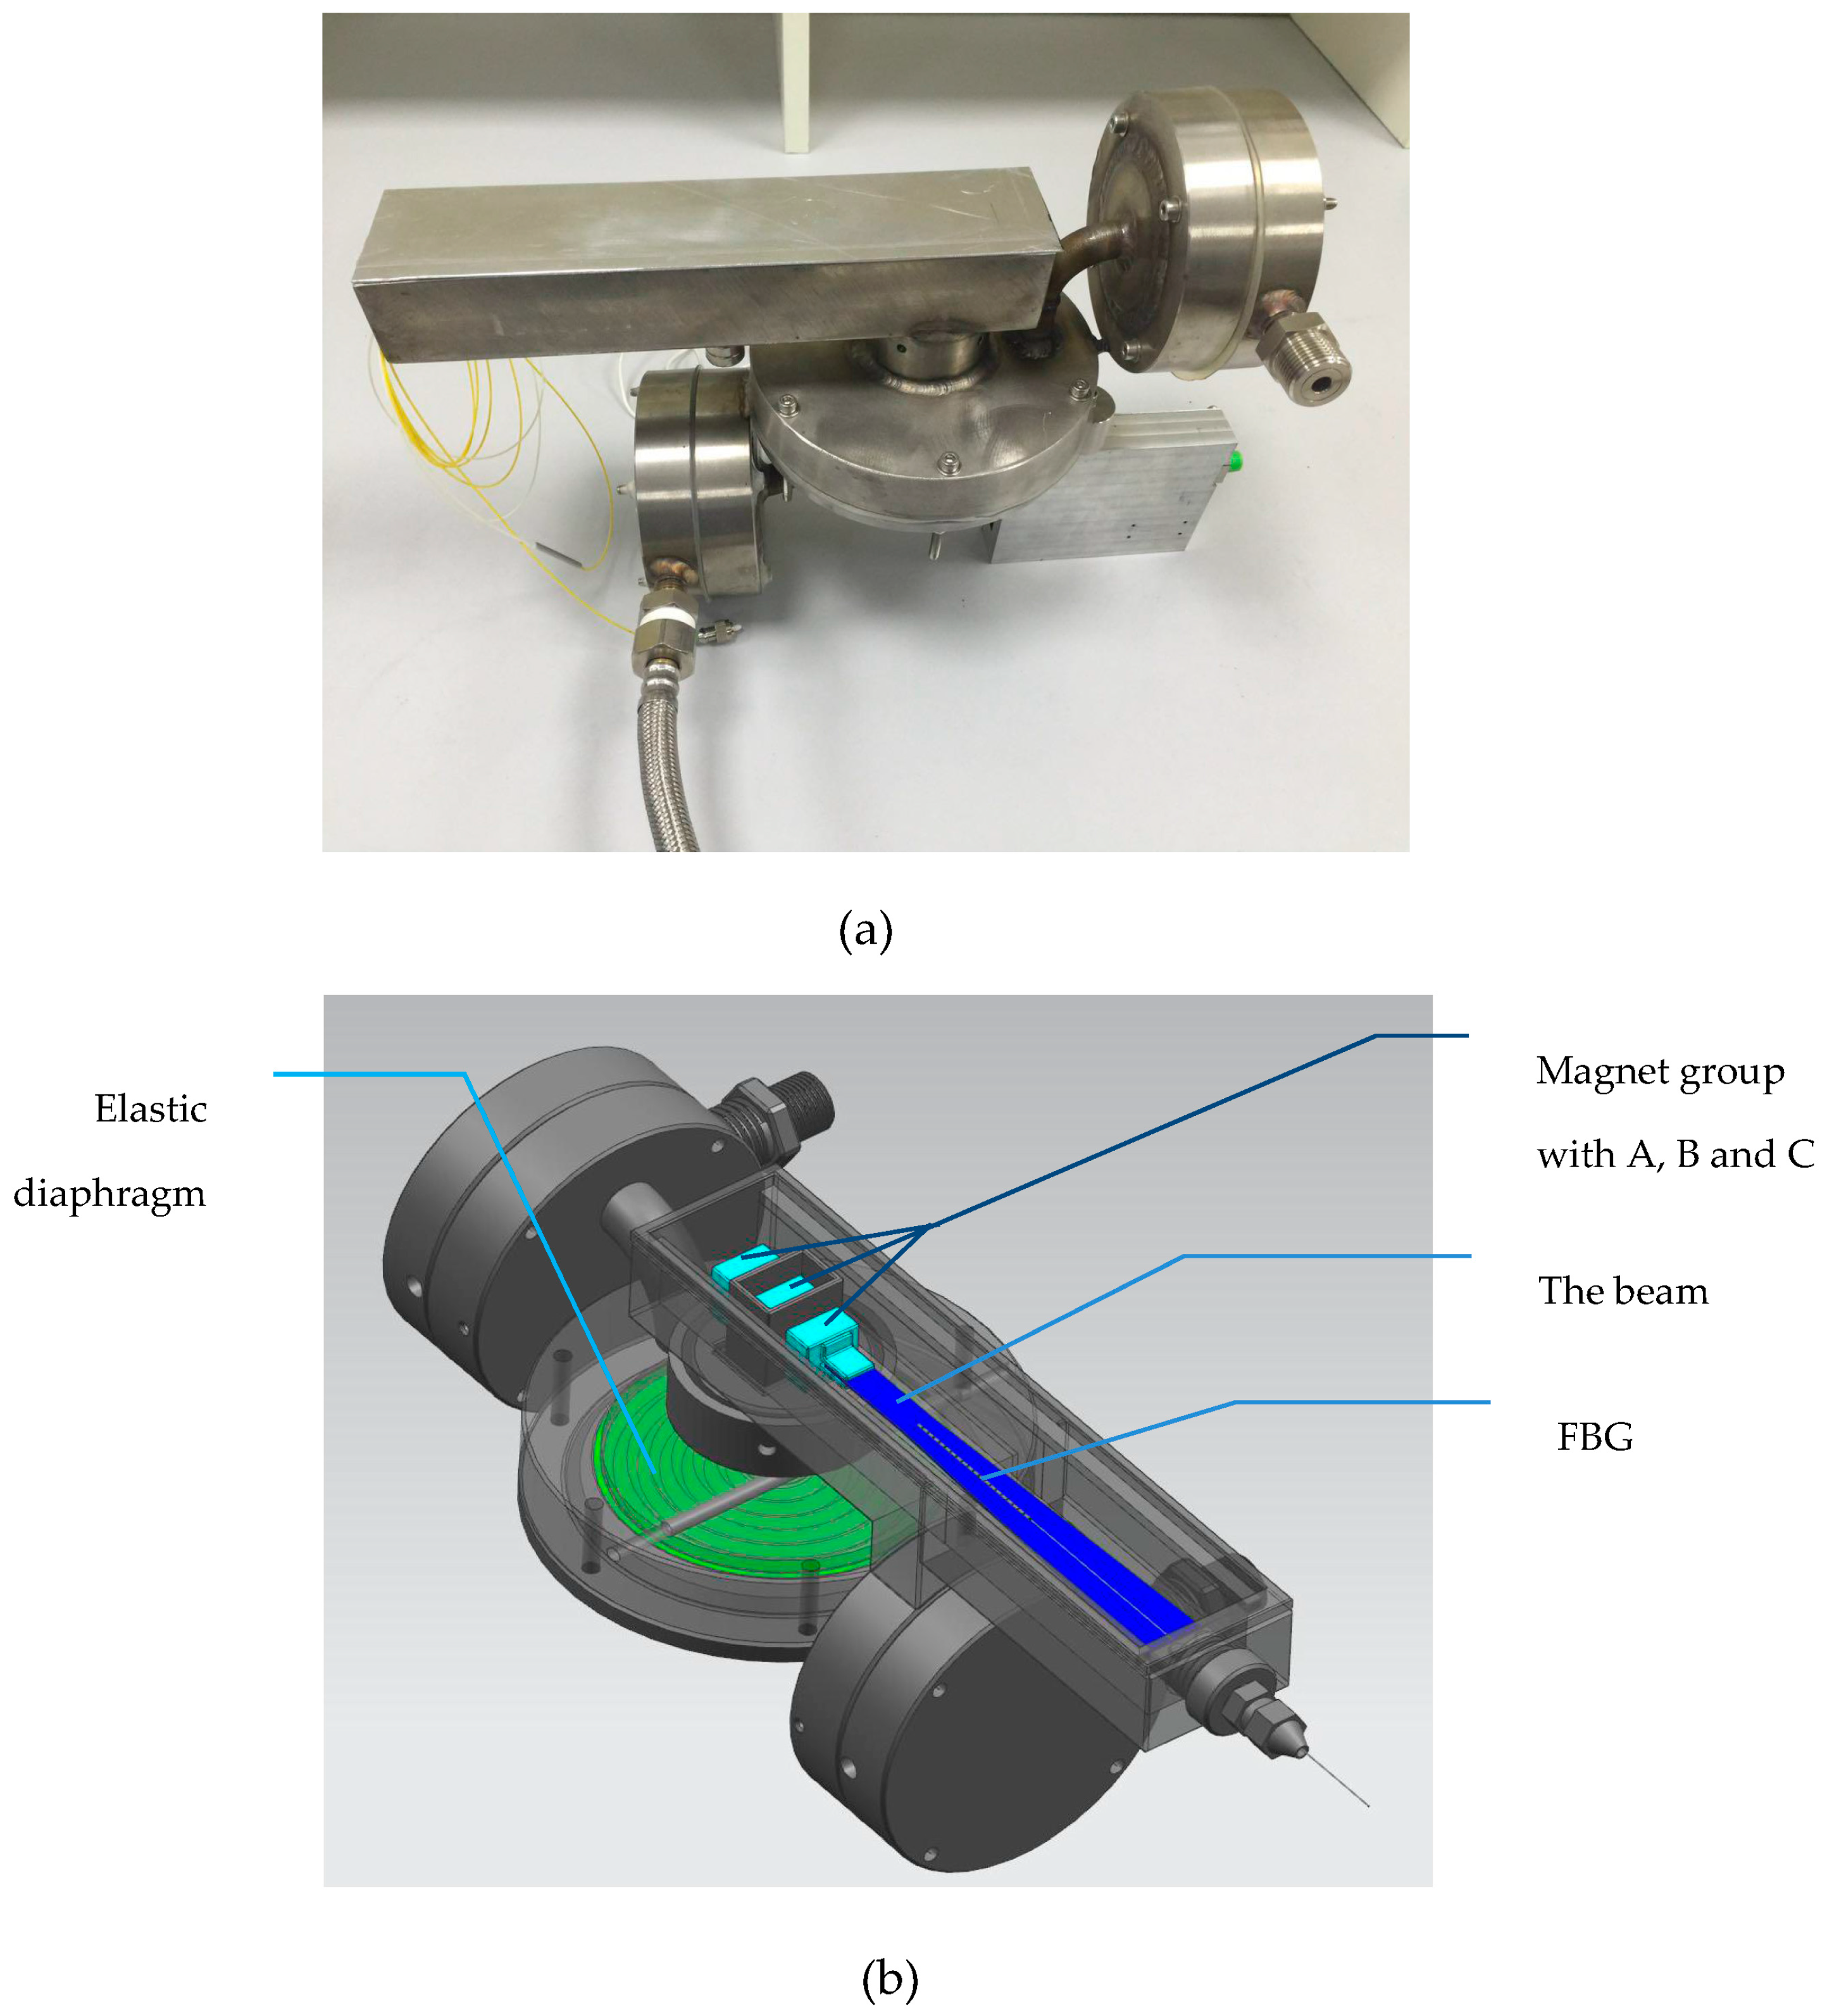
2.1. The Overall Design

In order to sense the differential pressure effectively and to protect the sensor from invalidity caused by the contact of the FBG with the fluid to be measured, we propose a sensor structure with a magnetic transfer mechanism. As seen in Figure 2, four parts are included in this sensor structure as follows: the pressure-transferring part comprised of three strong magnets and an elastic corrugated diaphragm; the input part for differential pressure with a high pressure input channel and a low pressure input channel; the part in which a triangle cantilever beam is used to convert the differential pressure to the wavelength shift of the FBG; and a limiting mechanism which is used for resisting overload [11]. A structure design for insulating the fluid and FBG is the most critical aspect.

2.2. Sensing Principle of a Cantilever Beam of Uniform Strength

Figure 3 presents a structure of a triangle cantilever beam as an elastic sensitive element with the right end fixed and the other end movable, on which an FBG is fixed.
As shown in Figure 3, when a force F acts on the point O near the free end, which is just the top point of the triangle and located at a distance of l from the fixed end of the beam, the deformation ε of the beam caused by the force can be expressed as:
ε ( x ) = 6 ( l x ) E h A F
where E, h and A indicate the elastic modulus, thickness of the beam and transverse section area, which is a product of the width bx and thickness h of a certain position x with respect to O, the top point of triangle. From Equation (1), the deformation is a function of x .
Therefore, A can be expressed as:
A ( x ) = h b x = h b 0 l x l
where b0 denotes the beam width at the fixed end, l means the height of the triangle. Substituting Equation (2) into Equation (1), one can obtain:
ε = 6 l E b 0 h 2 F
From Equation (3), the deformation is equal everywhere when the point O at the movable end of the beam is applied a force F; therefore, the requirement for the position to fix the FBG is released. It should be pointed out that the force F must be applied on the point O which is the intersection between the two hypotenuses of the triangle.
The deflection D of the movable end of the beam is [12]
D = 6 l 3 E b 0 h 3 F
From the Bragg conditions we have:
λ B = 2 n e f f Λ
where n e f f , Λ represent the effective refractive index and grating period of the FBG. The Bragg wavelength changes with the effective refractive index and the grating period. When a force is applied to the movable end of the beam, the FBG pasted on the surface of the beam may convert the deformation of the beam to the shift of the central wavelength of the FBG. After controlling the temperature or compensating for the effect of the temperature on the FBG (the temperature compensation design of the sensor will be introduced in a later section), the relationship between the deformation and the wavelength of the FBG can be simplified as:
Δ λ B = K ε ε
where Kε is a coefficient. Combining Equations (3) and (4) into Equation (6), we obtain:
D = Δ λ B l 2 K ε h
As seen in Equation (7), the deflection of the movable beam end D is proportional to the wavelength shift Δ λ B of the FBG.

2.3. Structure Design of Magnetic Transfer

Usually, it is not easy to separate the FBG from the measured fluid. In order to solve this problem, we introduced a special mechanism with magnetic transfer to isolate the FBG from the measured fluid, where three identical strong magnets are used, described as A, B and C, respectively, in Figure 4a. Magnet A is fixed, and the S pole of A faces the N pole of B. While magnets B and C are movable, magnet B is linked rigidly with the center of the elastic corrugated diaphragm; the S pole of B faces the N pole of C, and magnet C is fixed to the movable end of the beam. A, B and C are attracted to each other and must keep equal distances of about 3~5 mm between each other. Actually, among them there must be an isolating structure (such as a polymer spacer) to prevent them from close contact. The FBG is fixed on a beam of uniform strength. It is insulated between the top and bottom surfaces of the diaphragm. When there is a difference in the pressure between the top and bottom surfaces of the diaphragm, the center of the diaphragm moves up or down, leading the movement of magnet B through the rigid link, therefore synchronously driving magnet C by means of the magnetic force. The side of the S pole of magnet C is connected to the movable end of the cantilever beam; therefore, the difference of the pressure is transferred to the FBG.

2.4. The Position Limiting Mechanism

In the real design, we enabled the sensor to resist overload by introducing a position limiting mechanism [13]. In our structure, two points are needed in the careful design, as seen in Figure 5; one is for magnet B to move and the other is for the elastic corrugated diaphragm. The two points are limited to prevent the damage of the diaphragm and magnet and to avoid the invalidity of the sensor.

2.5. The Temperature Compensation

When a force is applied to the beam, its upper surface experiences a stretching, corresponding negative deformation, while the lower surface is compressed and experiences positive deformation, but the deformation of the upper and lower surfaces is equal in absolute value. Therefore, when two FBGs with the same temperature sensitivity coefficient are pasted on the upper and lower surfaces of the beam, respectively, the wavelength shifts of the two gratings change to the opposite direction with an identical value of the shifts. It should be pointed out that two fiber gratings are located in the same temperature environment, and the difference between the shifts of two gratings will be kept unchanged, although the change of the temperature may cause an individual shift for each grating. That means the temperature effect on the grating is eliminated and the grating gets a compensation in temperature.

3. Simulations of Pressure Corrugated Diaphragm and Test of Sensor

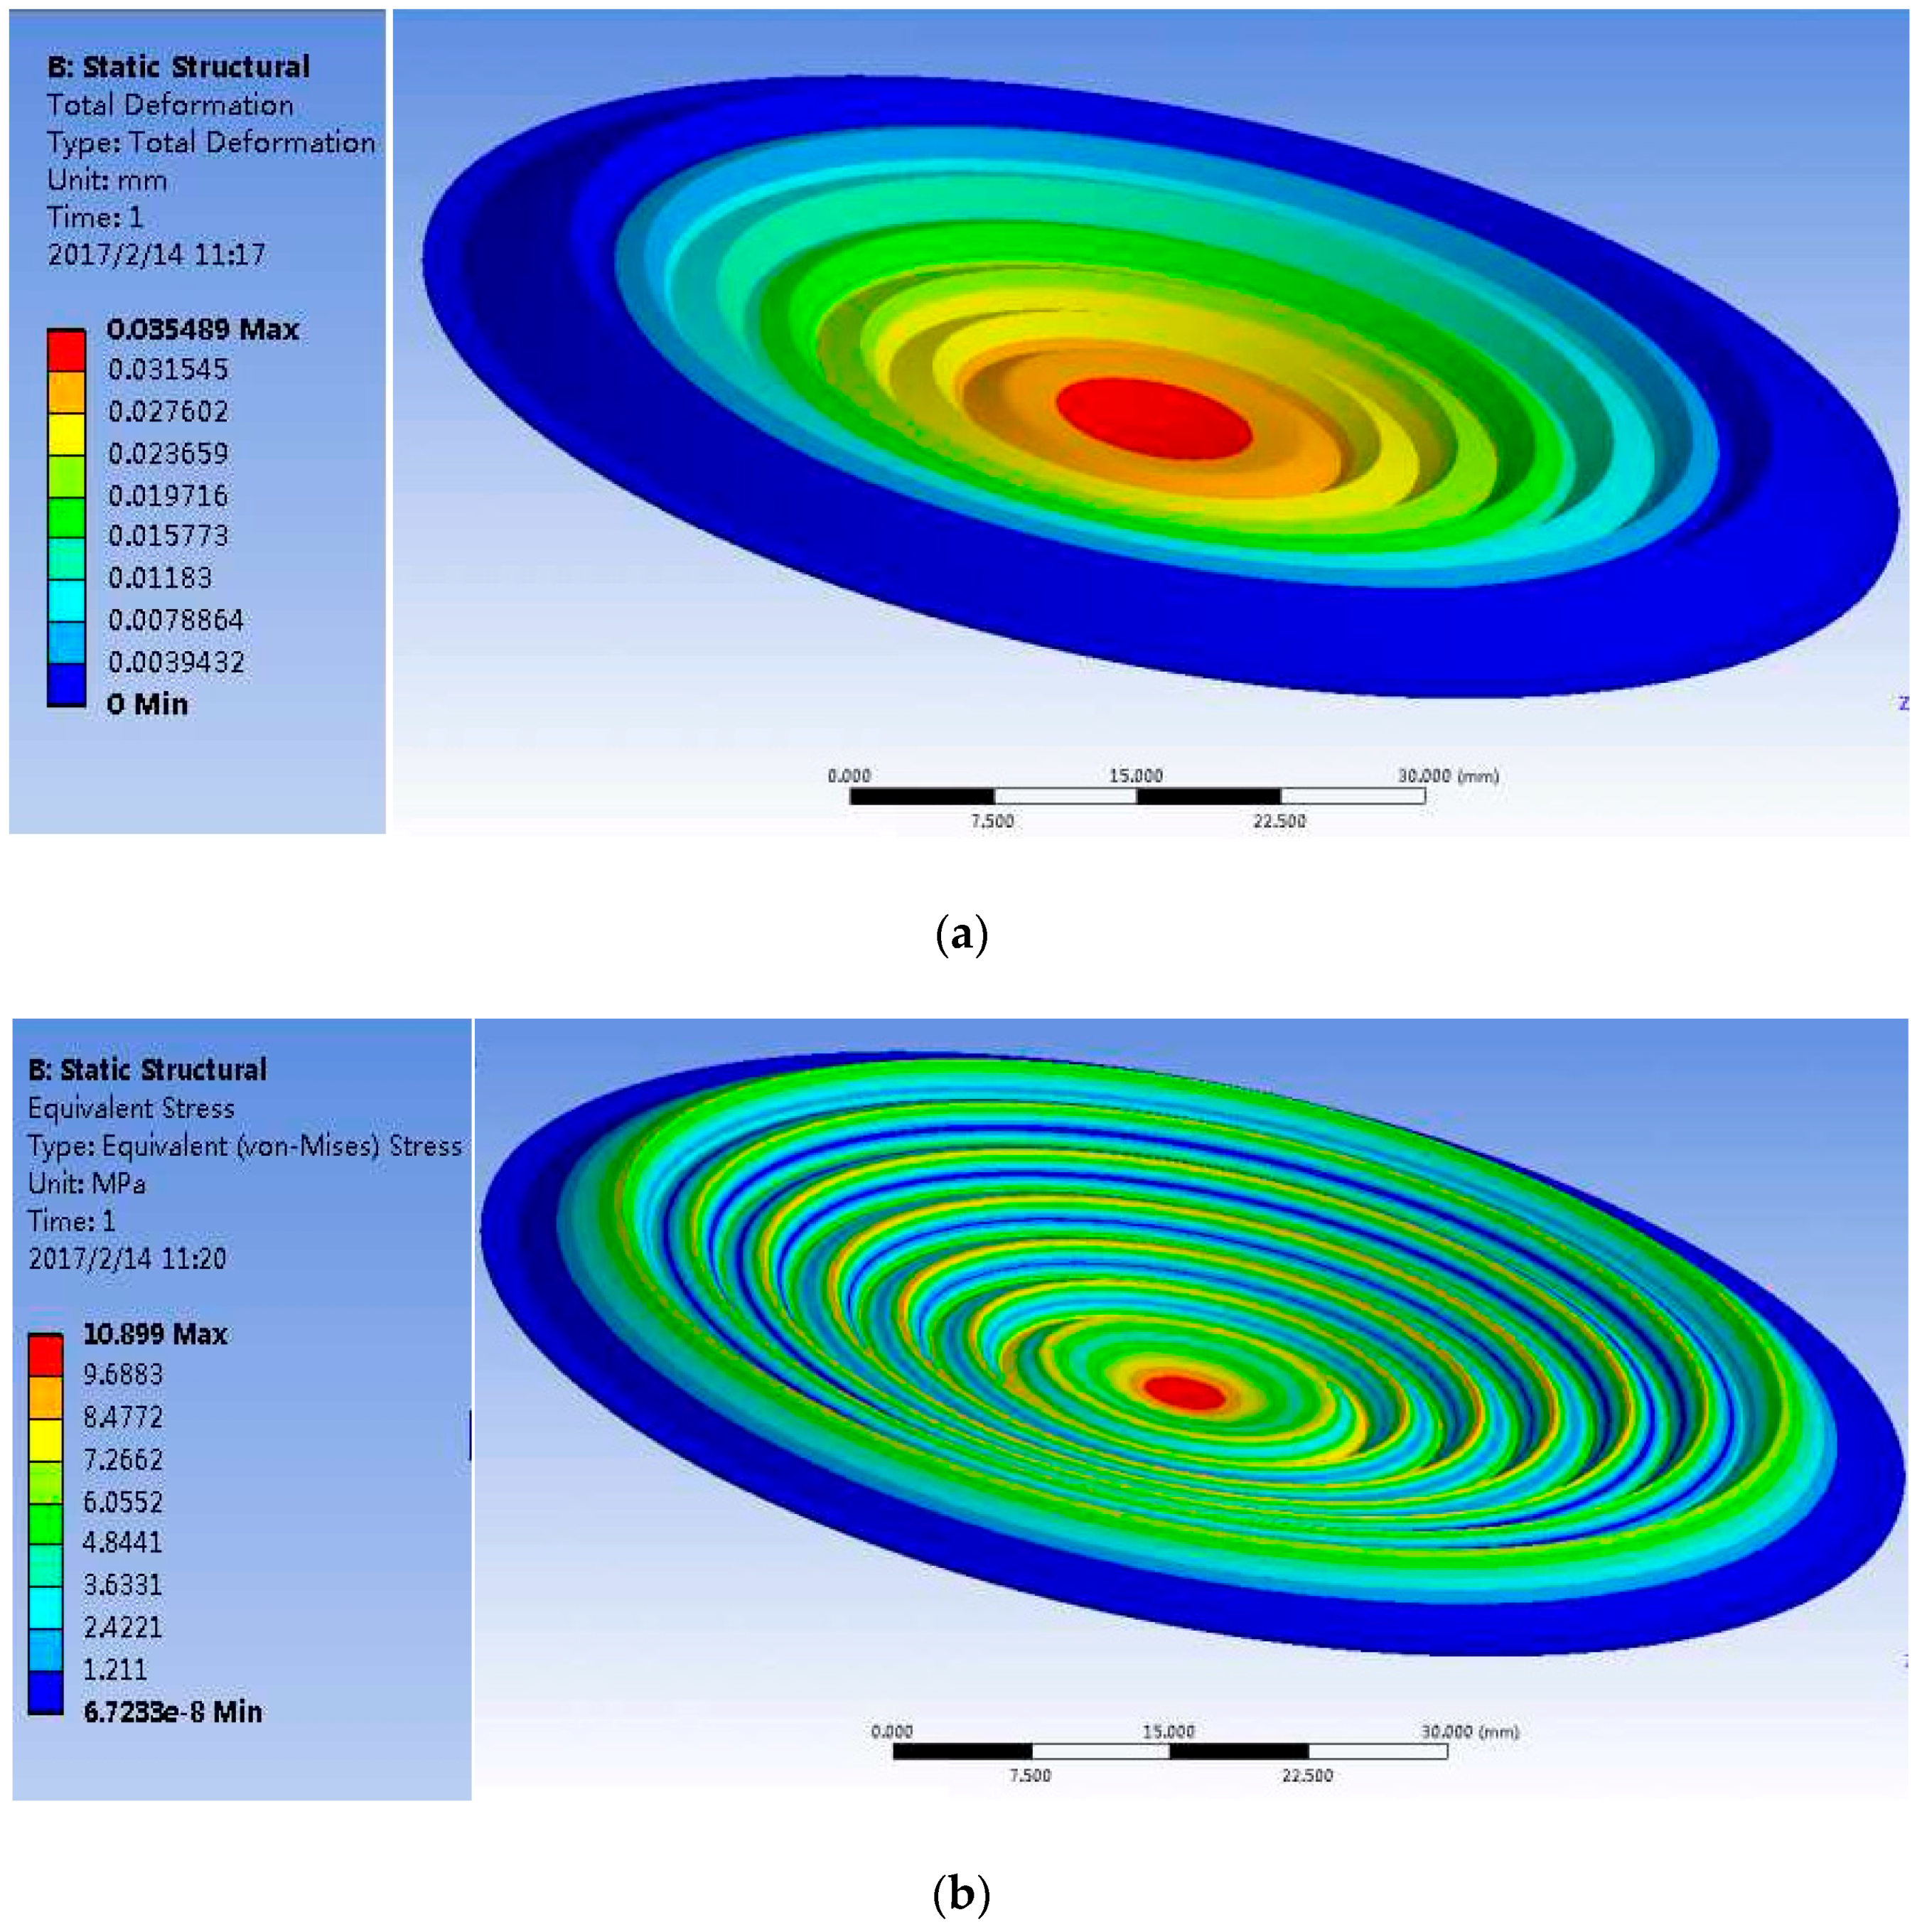
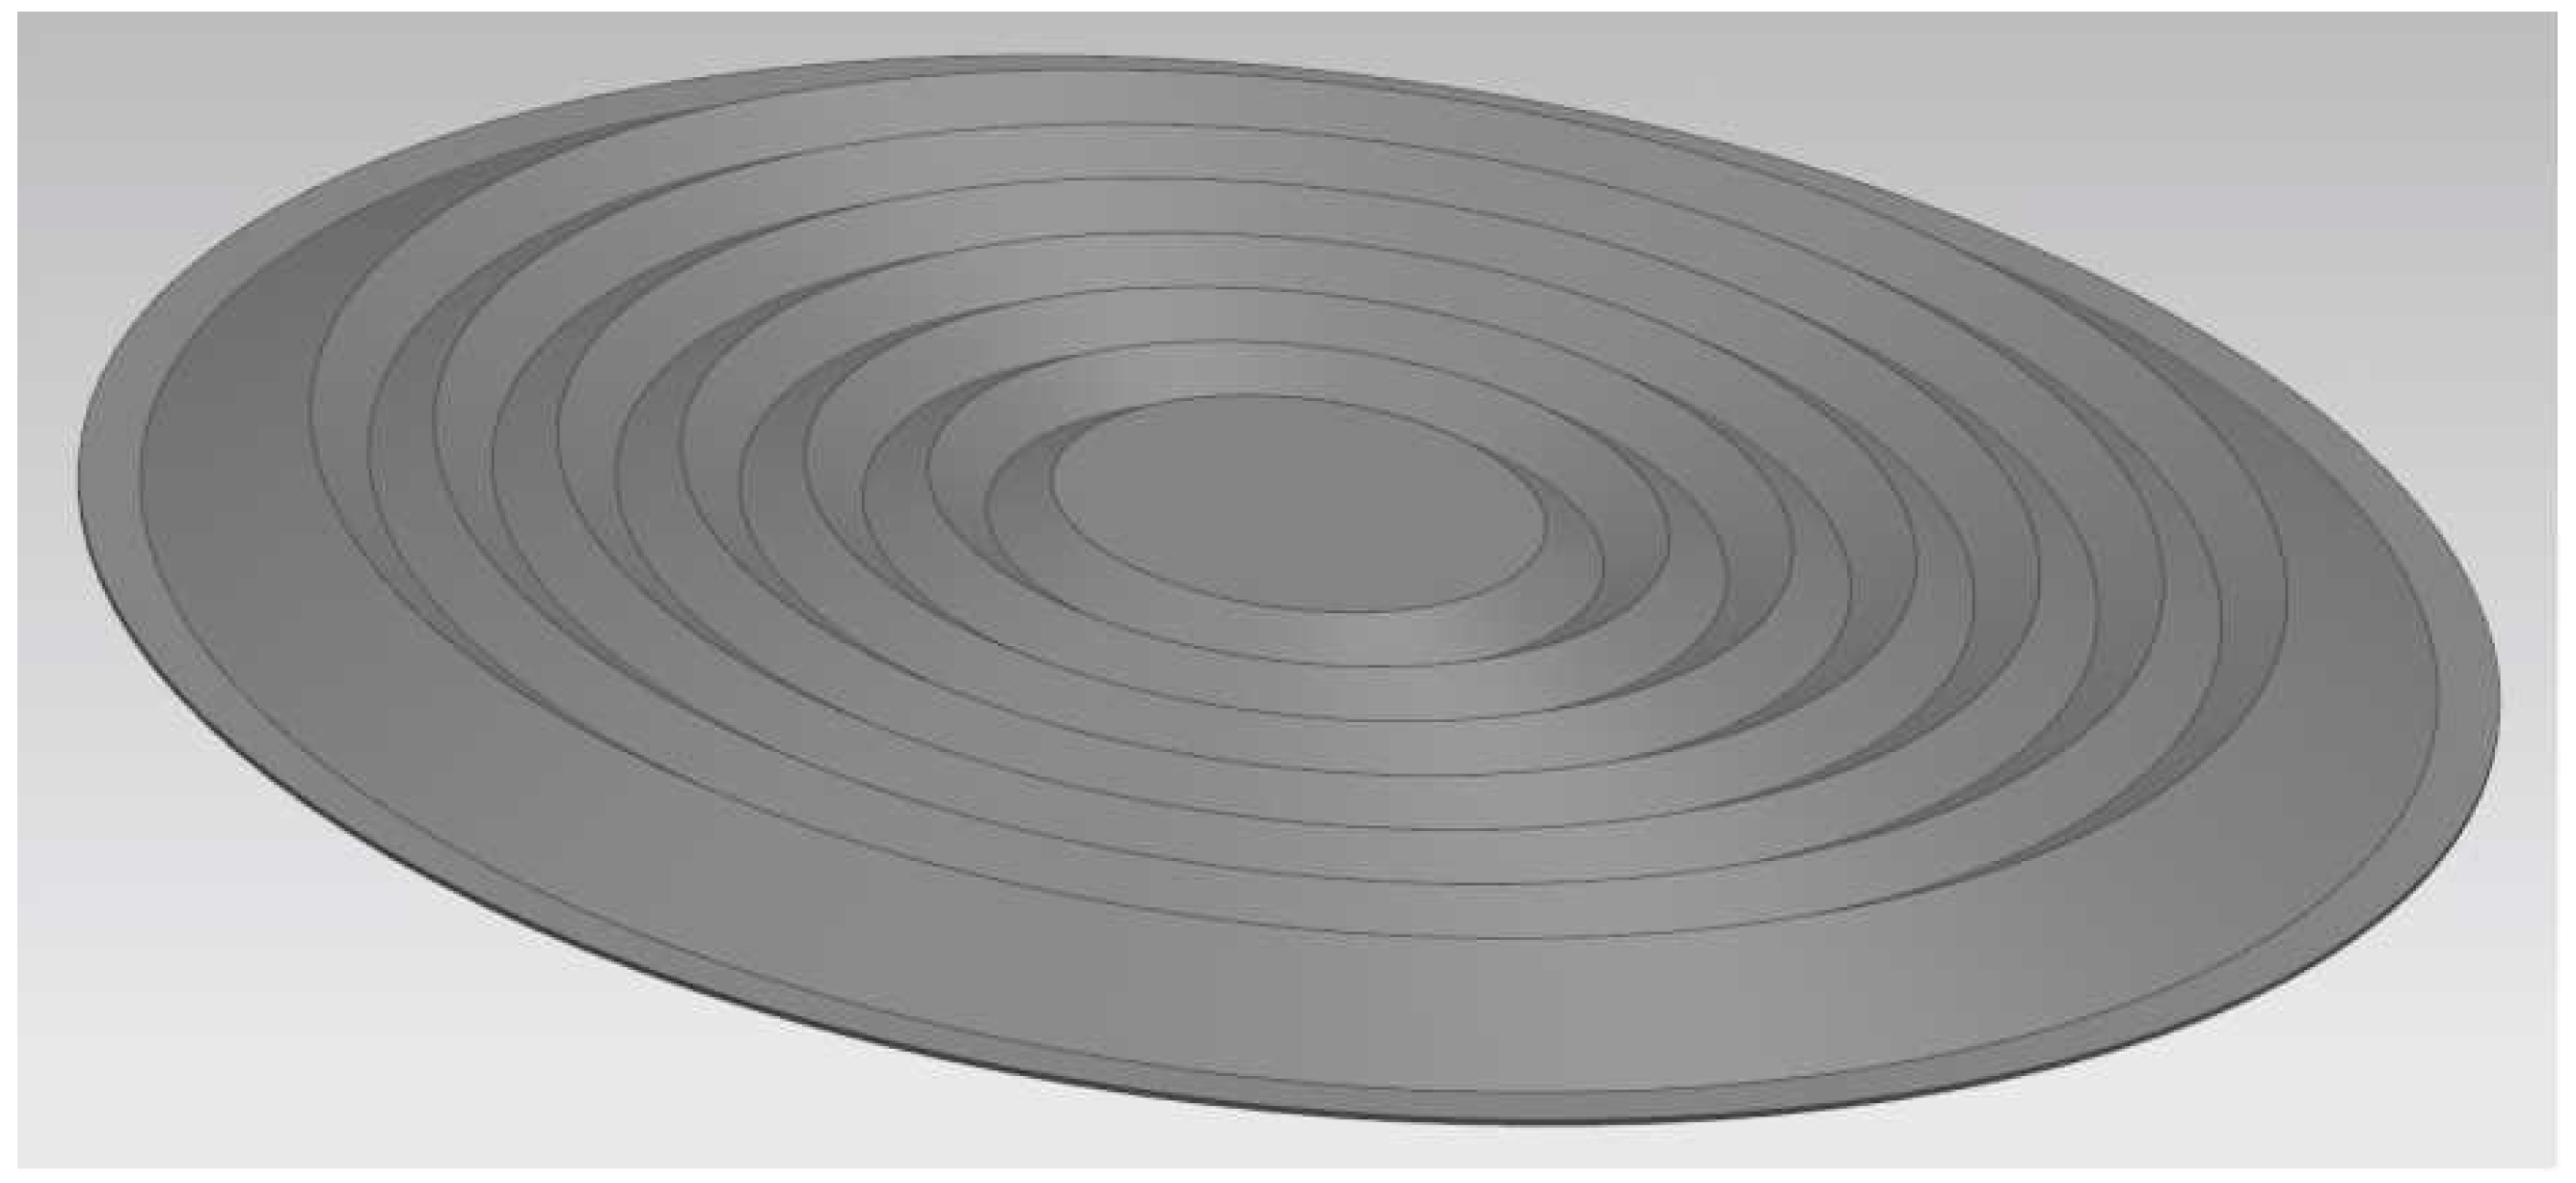
3.1. The Simulations of the Elastic Corrugated Diaphragm

To obtain the optimal parameters of the diaphragm and to verify the consistency of the diaphragm design with the actual case, we adopted ANSYS 14.0 (ANSYS Inc., Pittsburgh, PA, USA) to simulate the pressure diaphragm. ANSYS is a general analysis software based on the finite element method which allows us to carry out the study of the structure with heat, sound, fluid and electromagnetic fields.
The 1:1-scale three-dimensional (3D) model of the elastic corrugated diaphragm is imported into ANSYS at first, as shown in Figure 6. In this figure, the diameter of the full-size diaphragm is 100 mm, and the corrugation type is chosen as “triangle waveform” (6 rings) with a corrugation depth of 2 mm. The material of the diaphragm is stainless steel film. And the parameters of the diaphragm are listed in Table 1.
Then we simulated its mechanical property in a certain range of pressure differences (0~10 kPa). As an example, Figure 7 gives the deformation and force distribution of the diaphragm under a differential pressure of 10 kPa when the thickness is 0.2 mm, where the pressure difference may be reflected through stress at the center of the diaphragm.
In the real design, the edge of a diaphragm of 2 mm is reserved in advance to link with the other part of the sensor and to isolate the fluids at both sides of the diaphragm. That means the force distribution at the edge is kept unchanged.
In order to get the best diaphragm thickness, we simulated diaphragms with thicknesses of 0.2 mm, 0.1 mm, 0.05 mm, 0.025 mm, and 0.0125 mm, respectively. The simulation results are listed in Table 2.
The simulation results indicate a tradeoff between the thickness of the diaphragm and the measurement range. When the diaphragm is thick, the sensitivity of the diaphragm is low, which leads to an enlarged range of measurement with a lower resolution. When the diaphragm is too thin, despite the enhanced sensitivity, the measurement range is reduced and results in a degradation in endurance to the impact of a high pressure difference, even resulting in damage to the diaphragm. According to the measurement range and resolution, we chose a diaphragm that is 0.15 mm thick to fabricate and conduct tests. Figure 8 presents the real picture of the sensor.

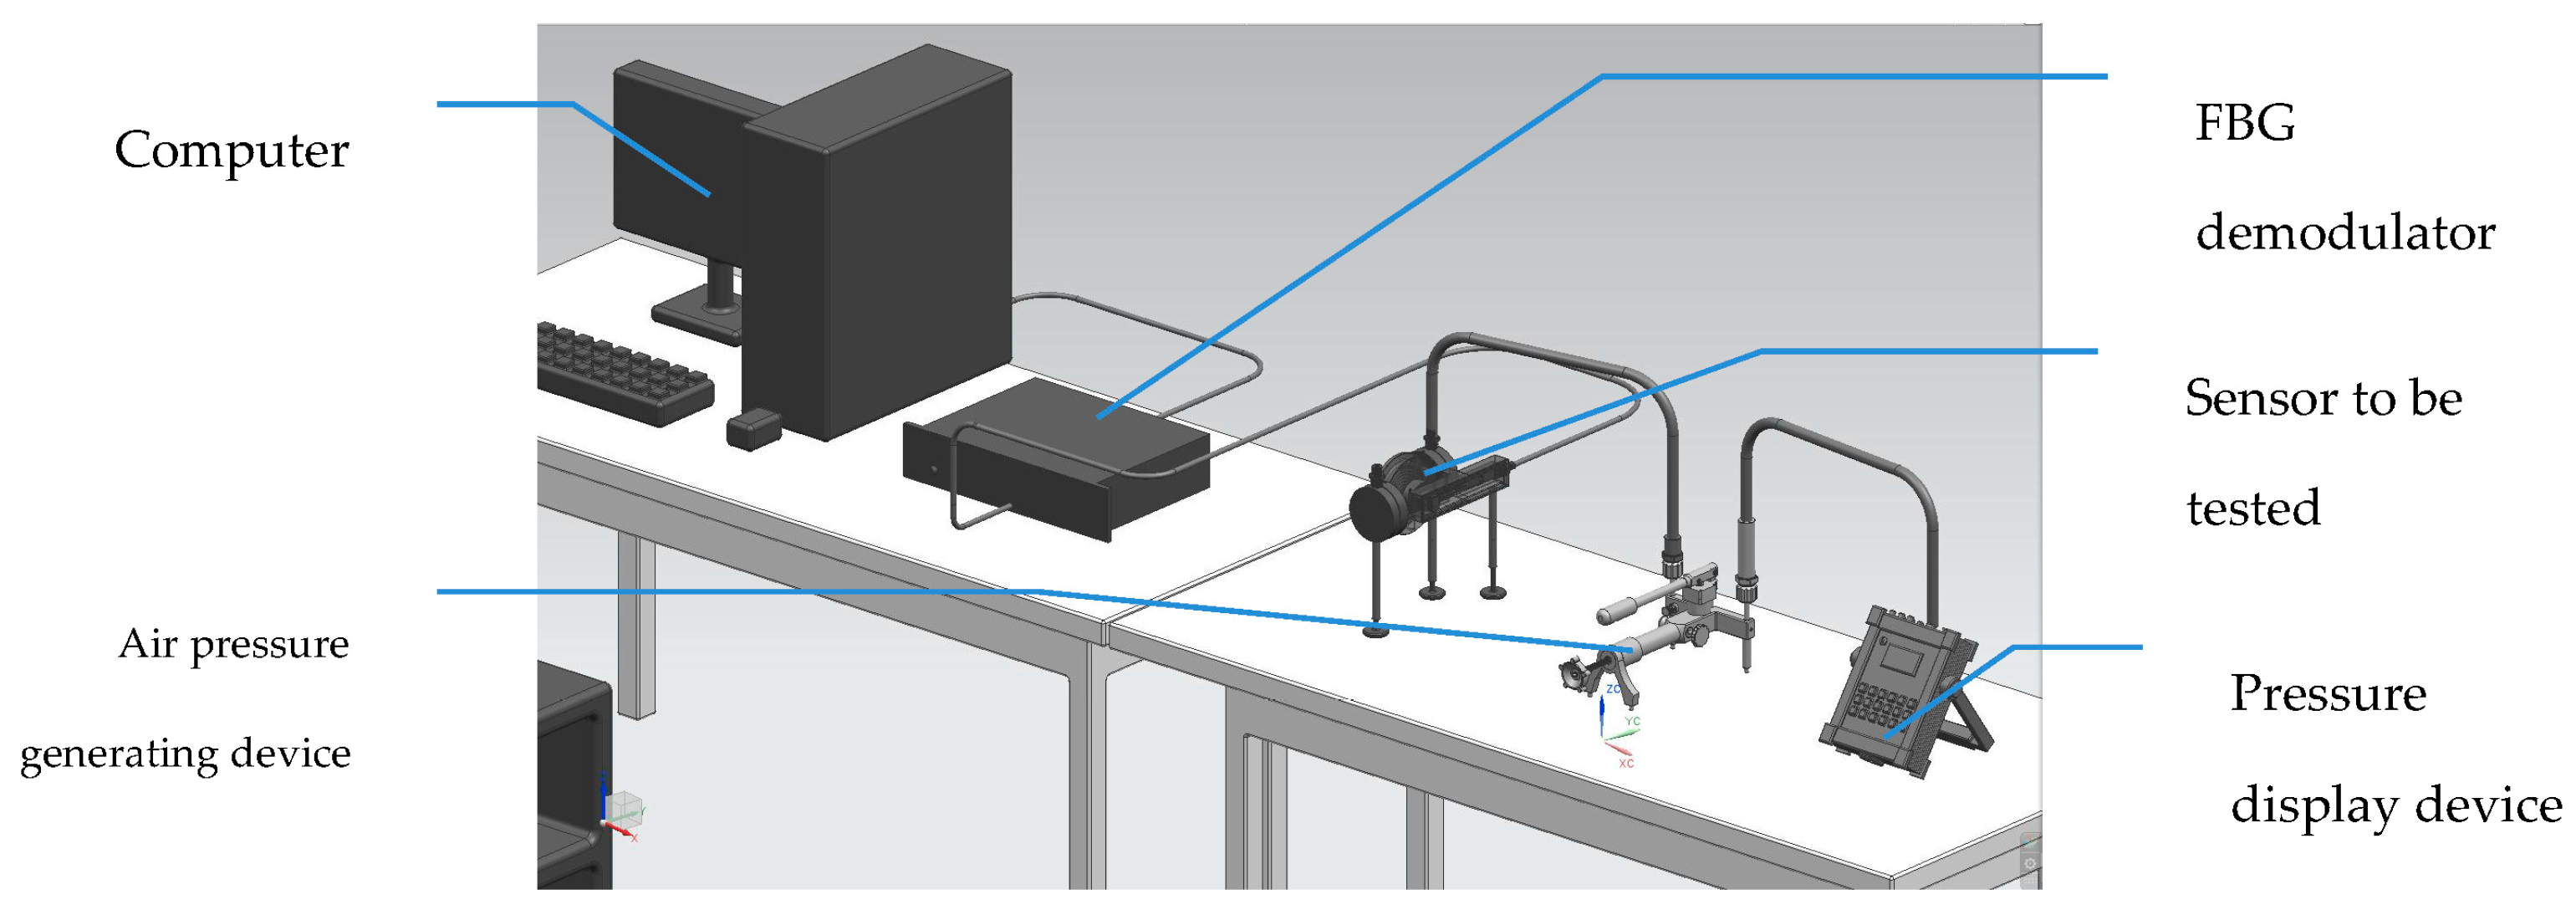
3.2. Test System of the Sensor
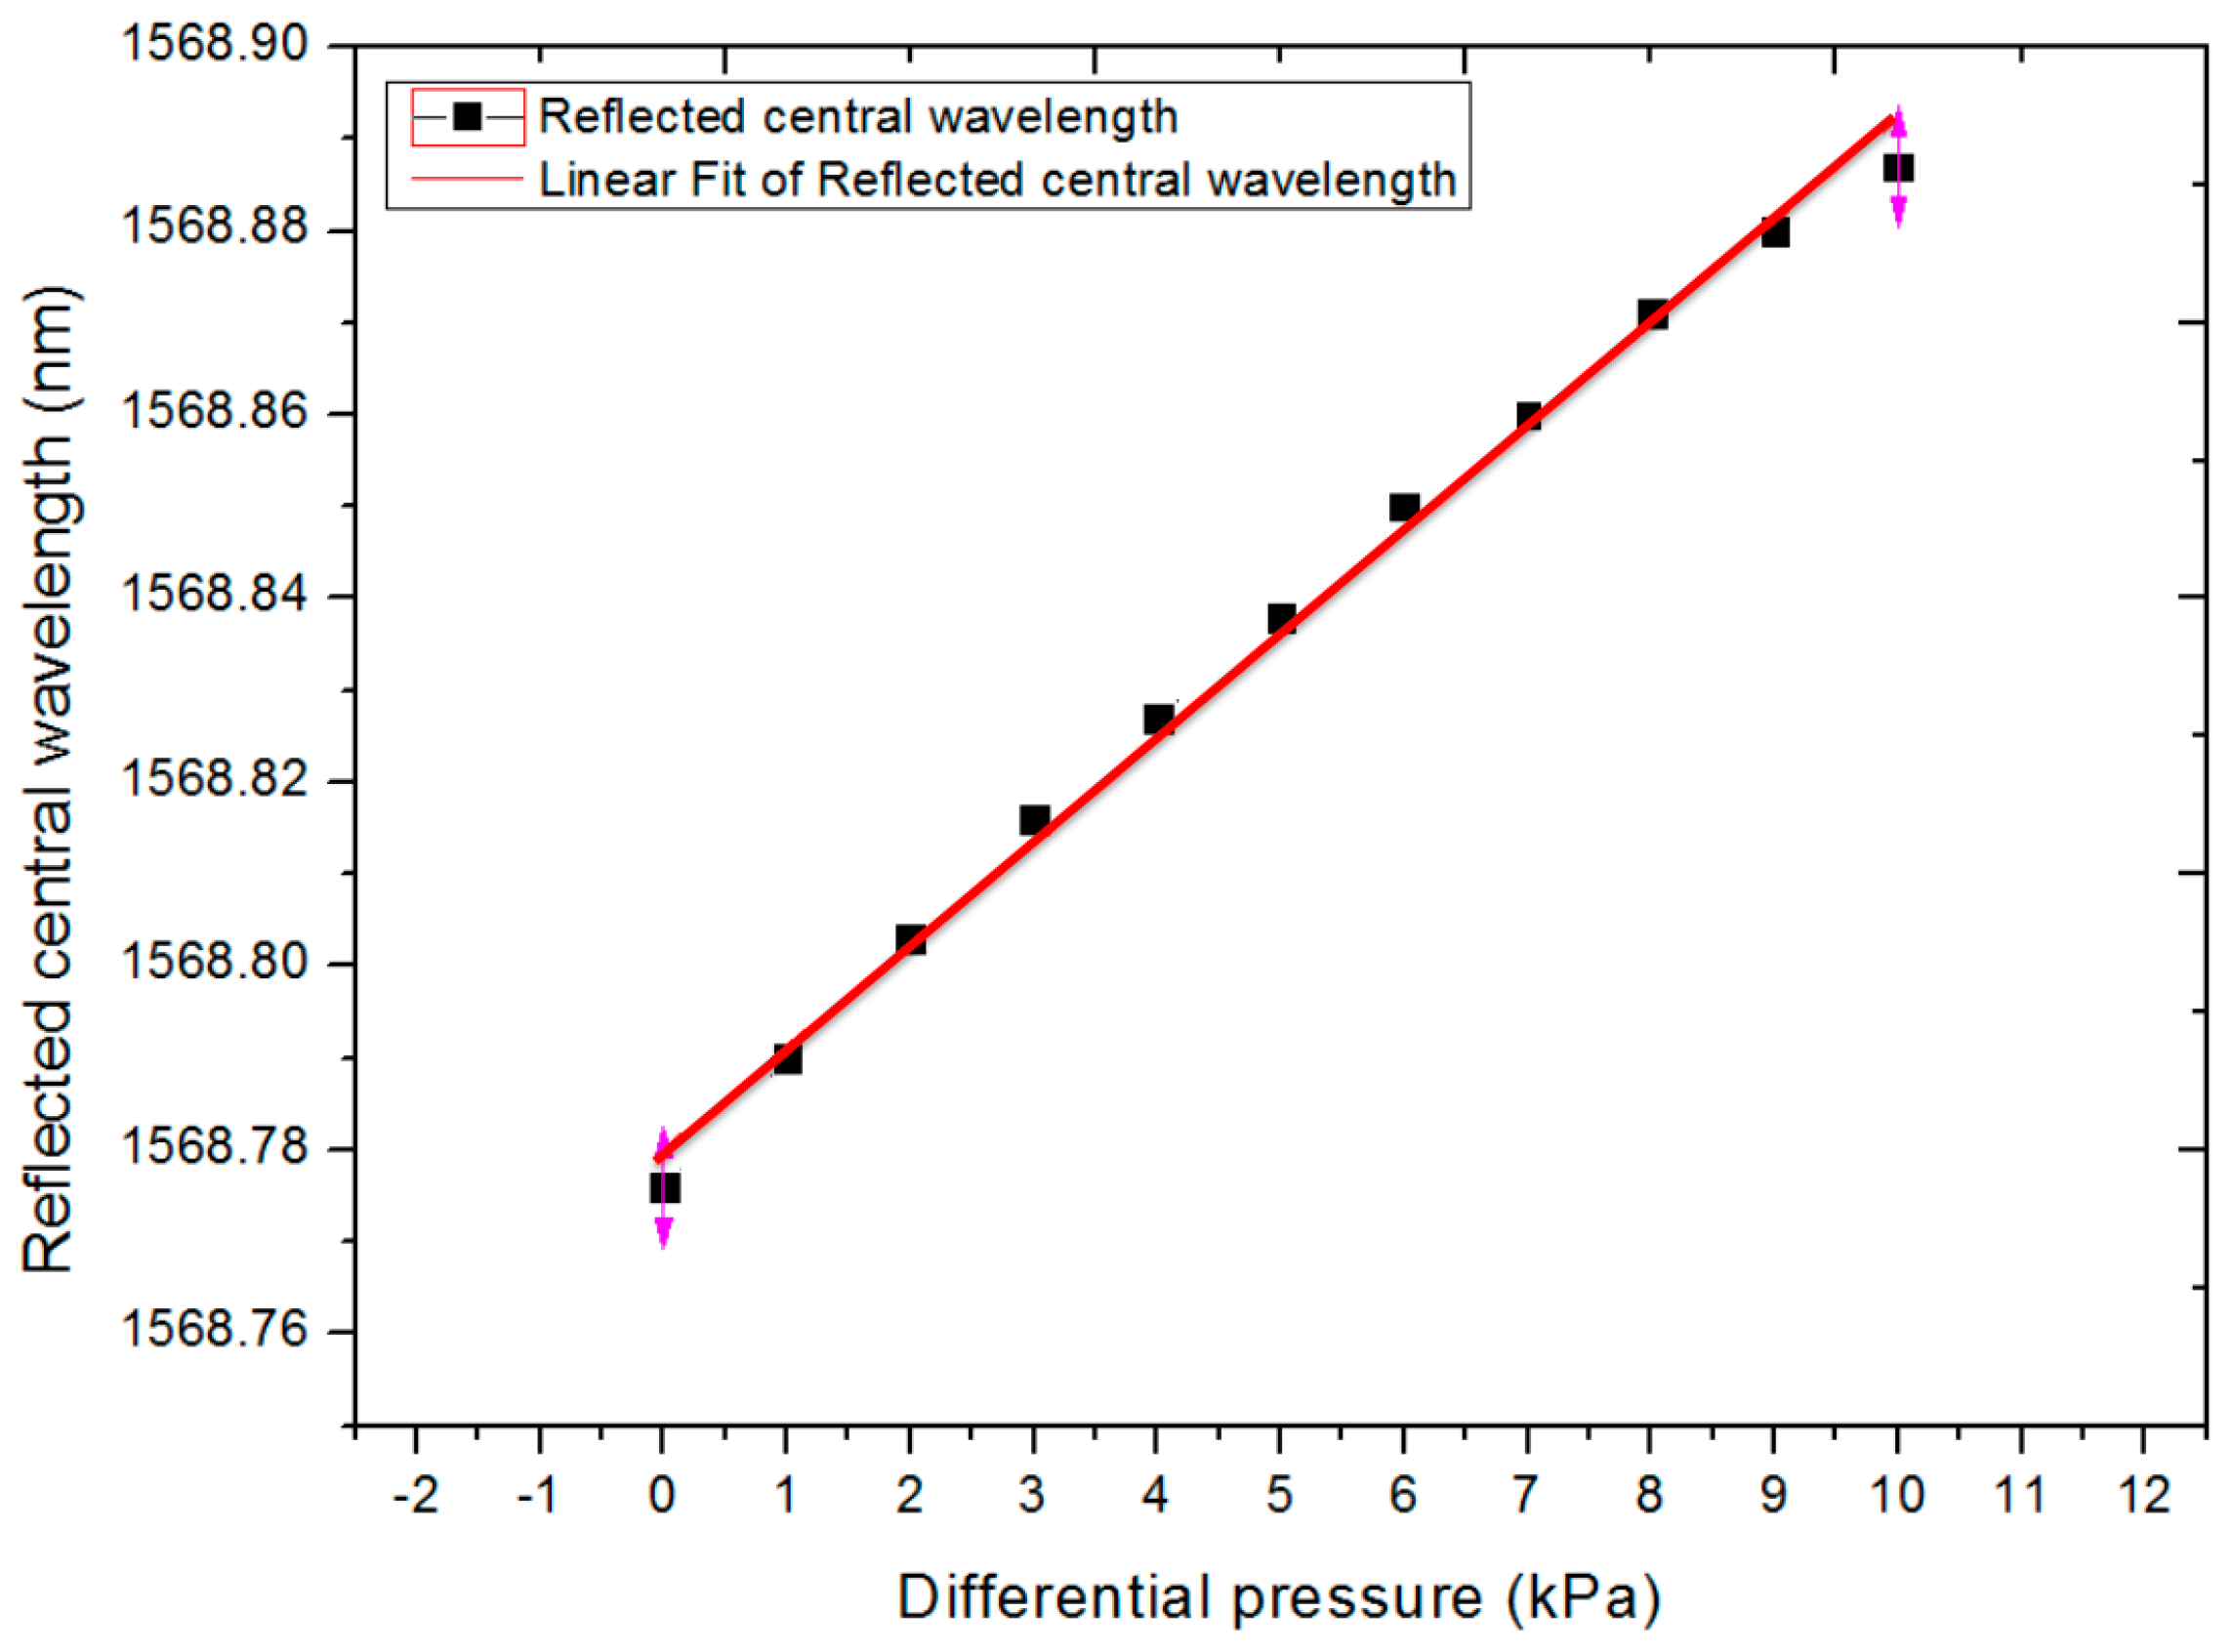
A test system was used to evaluate the linearity of the sensor, as shown in Figure 9.
The test system included the air pressure difference–generating device, the air pressure display device, a computer, an FBG demodulator and the sensor to be tested. The air pressure–generating device was made of stainless steel, which can provide an accurate and stable pressure source. The sensor to be tested was mounted on an interface of the pressure source, and the calibrated pressure meter was mounted on another interface of the source. The value of the calibrated pressure meter was displayed as a reference value. The light signal from the sensor was analyzed by the demodulator and displayed on the PC.
Two independent pressure-generating devices are supposed to be used generally: one produces high pressure and the other produces low pressure at the same time. However, in this test, we only used one generator to provide high pressure, while the low pressure was fixed to simplify the test system. It was easy to generate differential pressure ranging from 0 to 10 kPa.

4. Results

The test results (the calibration curve) are shown in Figure 10. We have fitted the data to a straight line with λB = 0.0112 × P + 1568.780, with a linear correlation coefficient of 0.994, and we obtained the sensitivity of the sensor as 0.0112 nm/kPa. The relations between the central wavelength shift of the FBG and the differential pressure were almost linear.

5. Conclusions

In this paper, a differential pressure sensor with magnetic transfer was proposed, and a non-electric measurement method based on an FBG was introduced, which can avoid the direct contact of the sensing unit with the measuring fluid. In this design, the position limiting mechanism and temperature compensation design were also considered. The test results demonstrated that the sensor is effective to measure differential pressure in the range of 0~10 kPa with a sensitivity of 0.0112 nm/kPa, and it can operate in high temperature, strong corrosion and high overload conditions.

Acknowledgments

The research is supported in part by the Science and Technology Project of Hei Long Jiang Province Science and Technology Department (GZ11A306). Project (1252CGZ-H11) in the Hei Long Jiang Province Department of Education, Harbin Technology Bureau. Project (2013AE1BW050), released by the Chinese Patent Office: Patent (No. 2014105889286) and (2014105889286).

Author Contributions

G.L. and X.J. conceived and designed the experiments; G.C. and K.W. performed the experiments; J.L., Y.H. and L.G. analyzed the data; G.C. contributed analysis tools; K.W. and X.J. wrote the paper.

Conflicts of Interest

The authors declare no conflict of interest.

References

  1. Hu, H.; Zhong, L.; Zhou, Q. The present situation and the development of differential pressure sensor technology. Mach. Tool Hydraul. 2013, 11, 187–190. [Google Scholar]
  2. Tong, C.; Yang, J.; Liu, Z.; Yuan, L. Double spring tube fiber differential pressure sensors. Acta Photon. Sin. 2004, 10, 1172–1176. [Google Scholar]
  3. Dong, G.; Li, D.; Hao, R. Study on Micro Differential Pressure Sensor Based on Ferrofluid. Chin. J. Sens. Actuators 2009, 1, 13–16. [Google Scholar]
  4. Tong, W.; Li, X. The application of differential pressure sensors in liquid level measurement. Sci. Technol. Wizard 2010, 29, 50–54. [Google Scholar]
  5. Xu, G.; Xiong, D. Fiber Bragg grating sensing technology application in engineering. Chin. Opt. 2013, 3, 306–313. [Google Scholar]
  6. Scarcia, W.; Palma, G.; Falconi, M.C.; de Leonardis, F.; Passaro, V.M.N.; Prudenzano, F. Electromagnetic Modelling of Fiber Sensors for Low-Cost and High Sensitivity Temperature Monitoring. Sensors 2015, 15, 29855–29870. [Google Scholar] [CrossRef] [PubMed]
  7. Tang, H.; Sun, H.; Liu, H.; Zheng, D.; Zhang, G.; Chen, X.; Zheng, Y. Diffusion silicon multifunctional integration differential pressure sensor. Instrum. Tech. Sens. 2004, 7, 6–8. [Google Scholar]
  8. You, C.; Zhang, W.; Wang, W. A piezoresistive micro differential pressure sensor design and stress free. Instrum. Tech. Sens. 2009, 4, 105–107. [Google Scholar]
  9. Li, P.; Cao, Y.; Fan, Y. Semiconductor research application of differential pressure sensor. J. Data Acquis. Process. 1992, 3, 202–209. [Google Scholar]
  10. Chen, B.; Hu, X.; Sun, H. Capacitance differential pressure sensor is designed based on AD7745. Transducer Microsyst. Technol. 2011, 6, 71–76. [Google Scholar]
  11. Fu, W. Three differential pressure sensor center diaphragm structure design of the diaphragm. Instrum. Tech. Sens. 1997, 2, 35–38. [Google Scholar]
  12. Wang, Q.; Yan, N. Design and Study of Fiber Sensor Based on Cantilever Beam of Uniform Strength. Microcomput. Inf. 2010, 4, 107–108. [Google Scholar]
  13. Liu, J.; Li, Y.; Liu, B.; Zhang, N.; Zhang, Z.; Liu, Q. The improvement of the two-way overload differential pressure sensor error. Instrum. Tech. Sens. 2009, 2, 94–96. [Google Scholar]
Figure 1. The typical structure of a differential pressure sensor in which an FBG may be used.
Sensors 17 00375 g001
Figure 2. The structure of the FBG-based differential pressure sensor with magnetic transfer.
Sensors 17 00375 g002
Figure 3. Structure of the triangle cantilever beam.
Sensors 17 00375 g003
Figure 4. (a) The structure of sensitive unit with magnetic transfer; (b) the relationship of magnets A, B and C.
Sensors 17 00375 g004
Figure 5. The position limiting mechanism of the sensor.
Sensors 17 00375 g005
Figure 6. The 1:1 scale 3D model of the elastic corrugated diaphragm.
Sensors 17 00375 g006
Figure 7. (a) Deformation of diaphragm; (b) Force distribution of diaphragm.
Sensors 17 00375 g007
Figure 8. (a) The real sensor; (b) The structure inside the sensor.
Sensors 17 00375 g008
Figure 9. The test system of sensor.
Sensors 17 00375 g009
Figure 10. The differential pressure sensor linearity curve.
Sensors 17 00375 g010
Table 1. Parameters of the diaphragm.
ParametersValue
Diameter of full size100 mm
Edge width2 mm
Number of corrugation6
Depth of corrugation2 mm
Spacing of corrugation6 mm
materialstainless steel
Table 2. The simulation results.
Diaphragm ThicknessMaximum Deformation of DiaphragmMaximum Pressure on the Center of Diaphragm
0.200 mm0.035 mm10.899 MPa
0.100 mm0.094 mm26.495 MPa
0.050 mm0.172 mm35.854 MPa
0.025 mm0.300 mm69.720 MPa
0.0125 mm0.300 mm136.830 MPa

