Integrated Display and Simulation for Automatic Dependent Surveillance–Broadcast and Traffic Collision Avoidance System Data Fusion

Abstract
:1. Introduction
2. ADS-B Minimum System Design
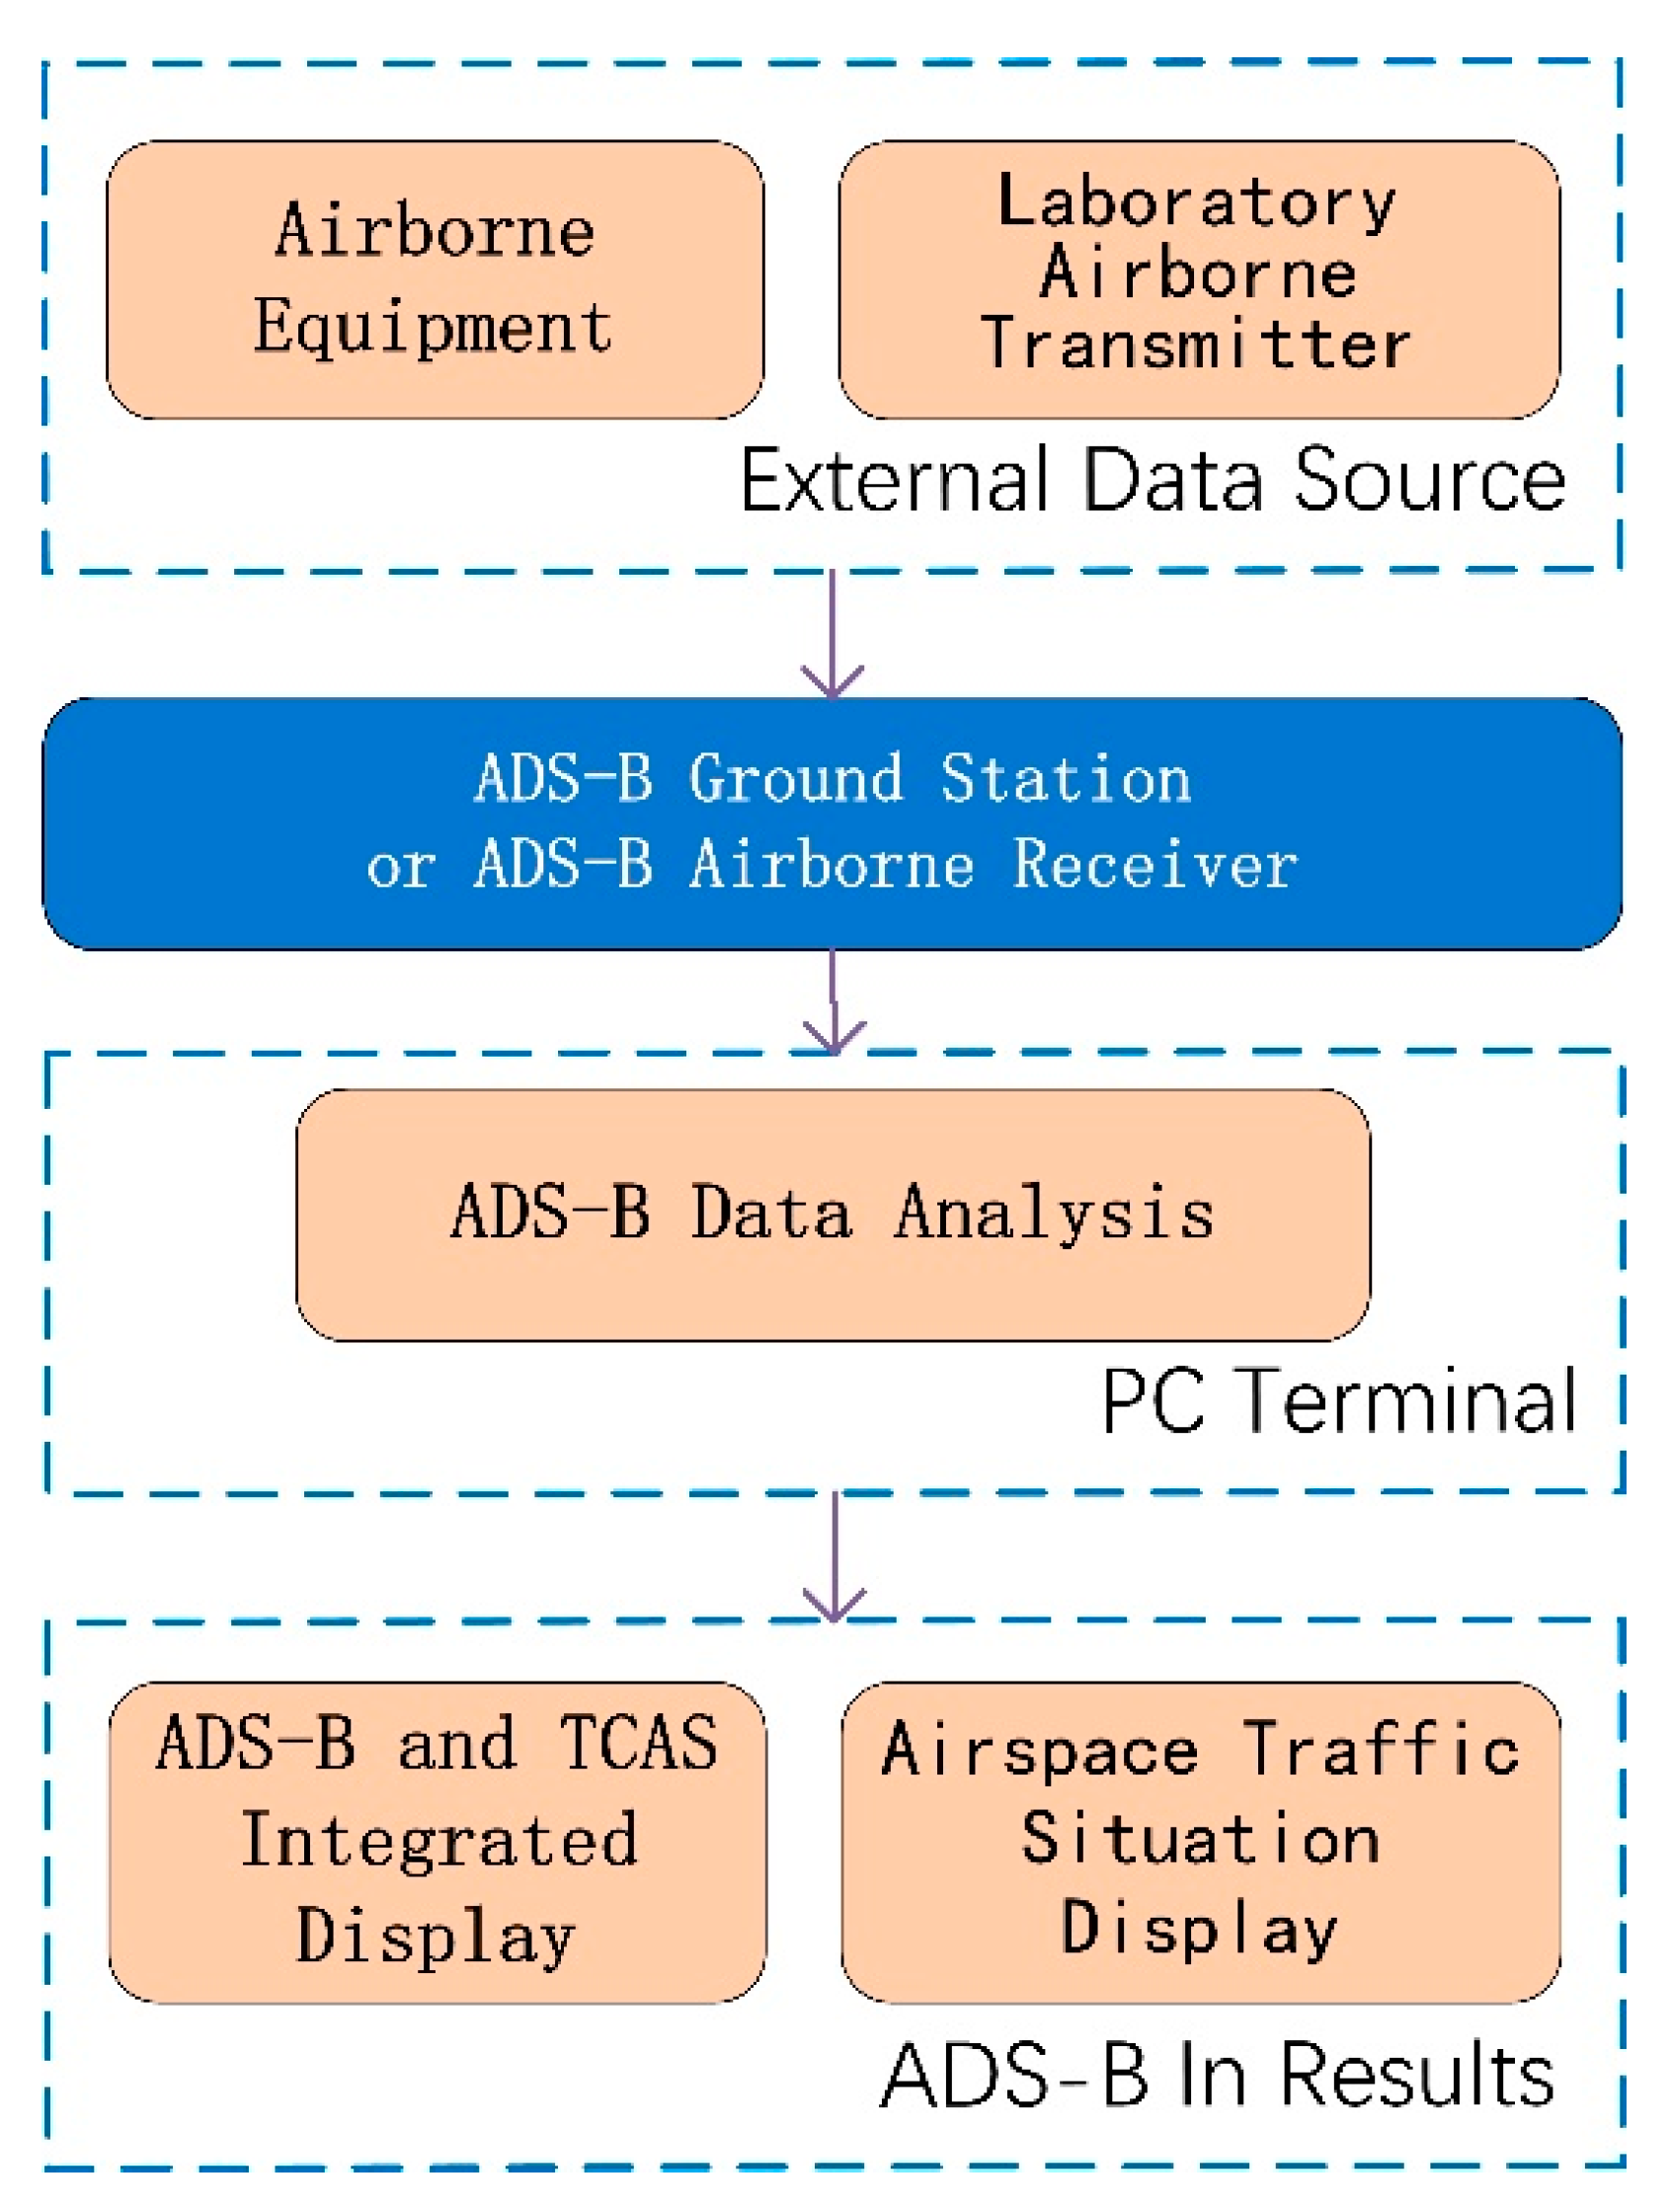
2.1. ADS-B In Minimum System Design
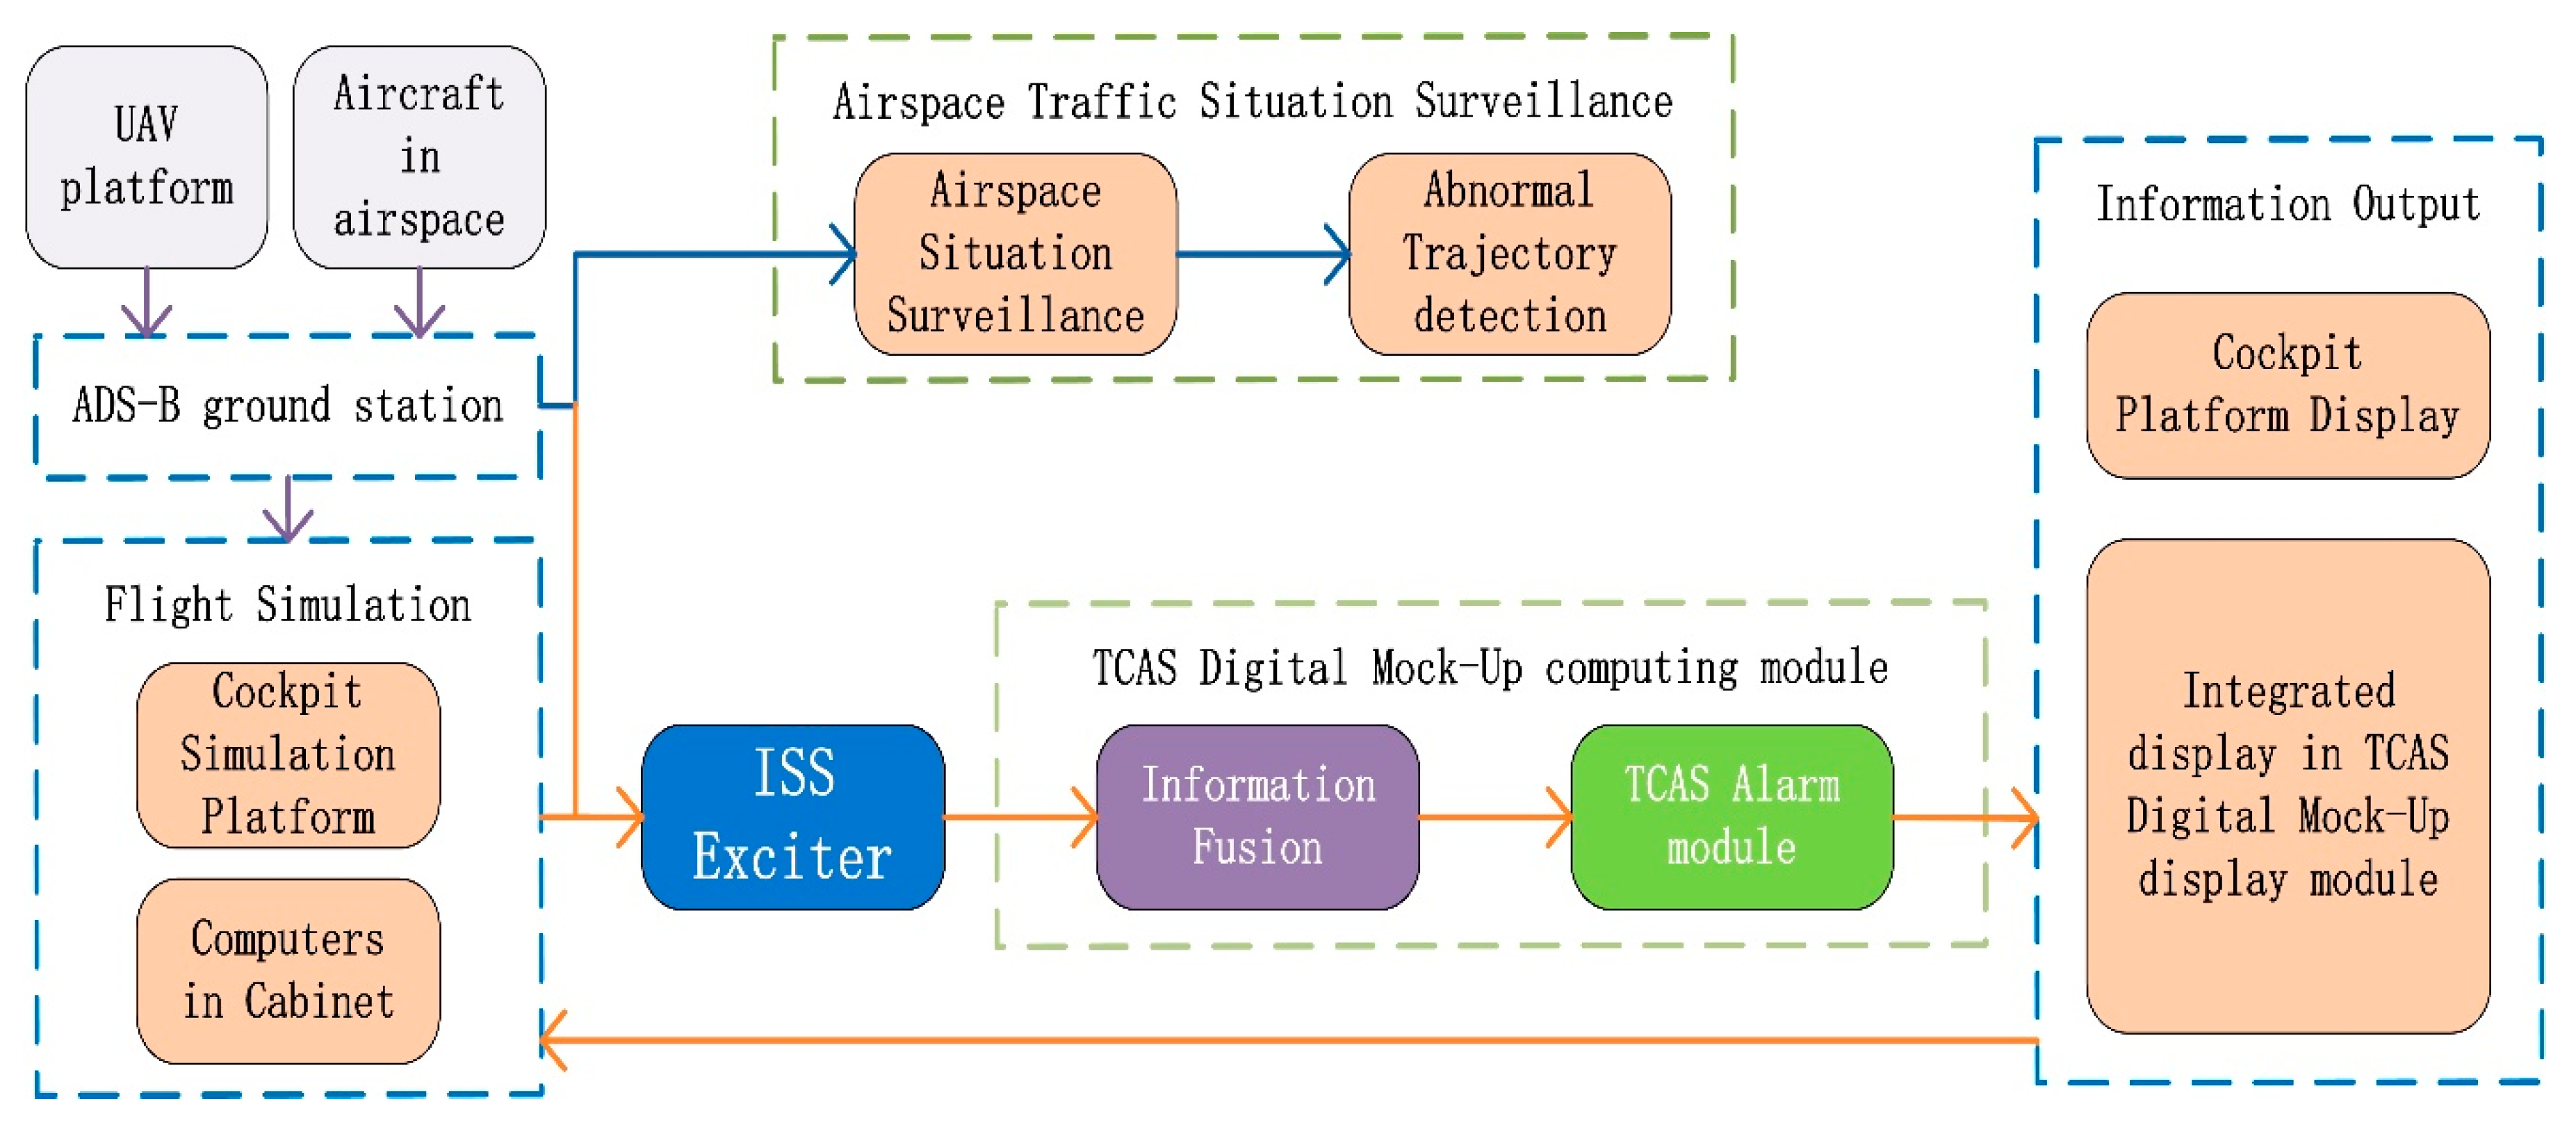
2.1.1. ADS-B and TCAS Integrated Display Development
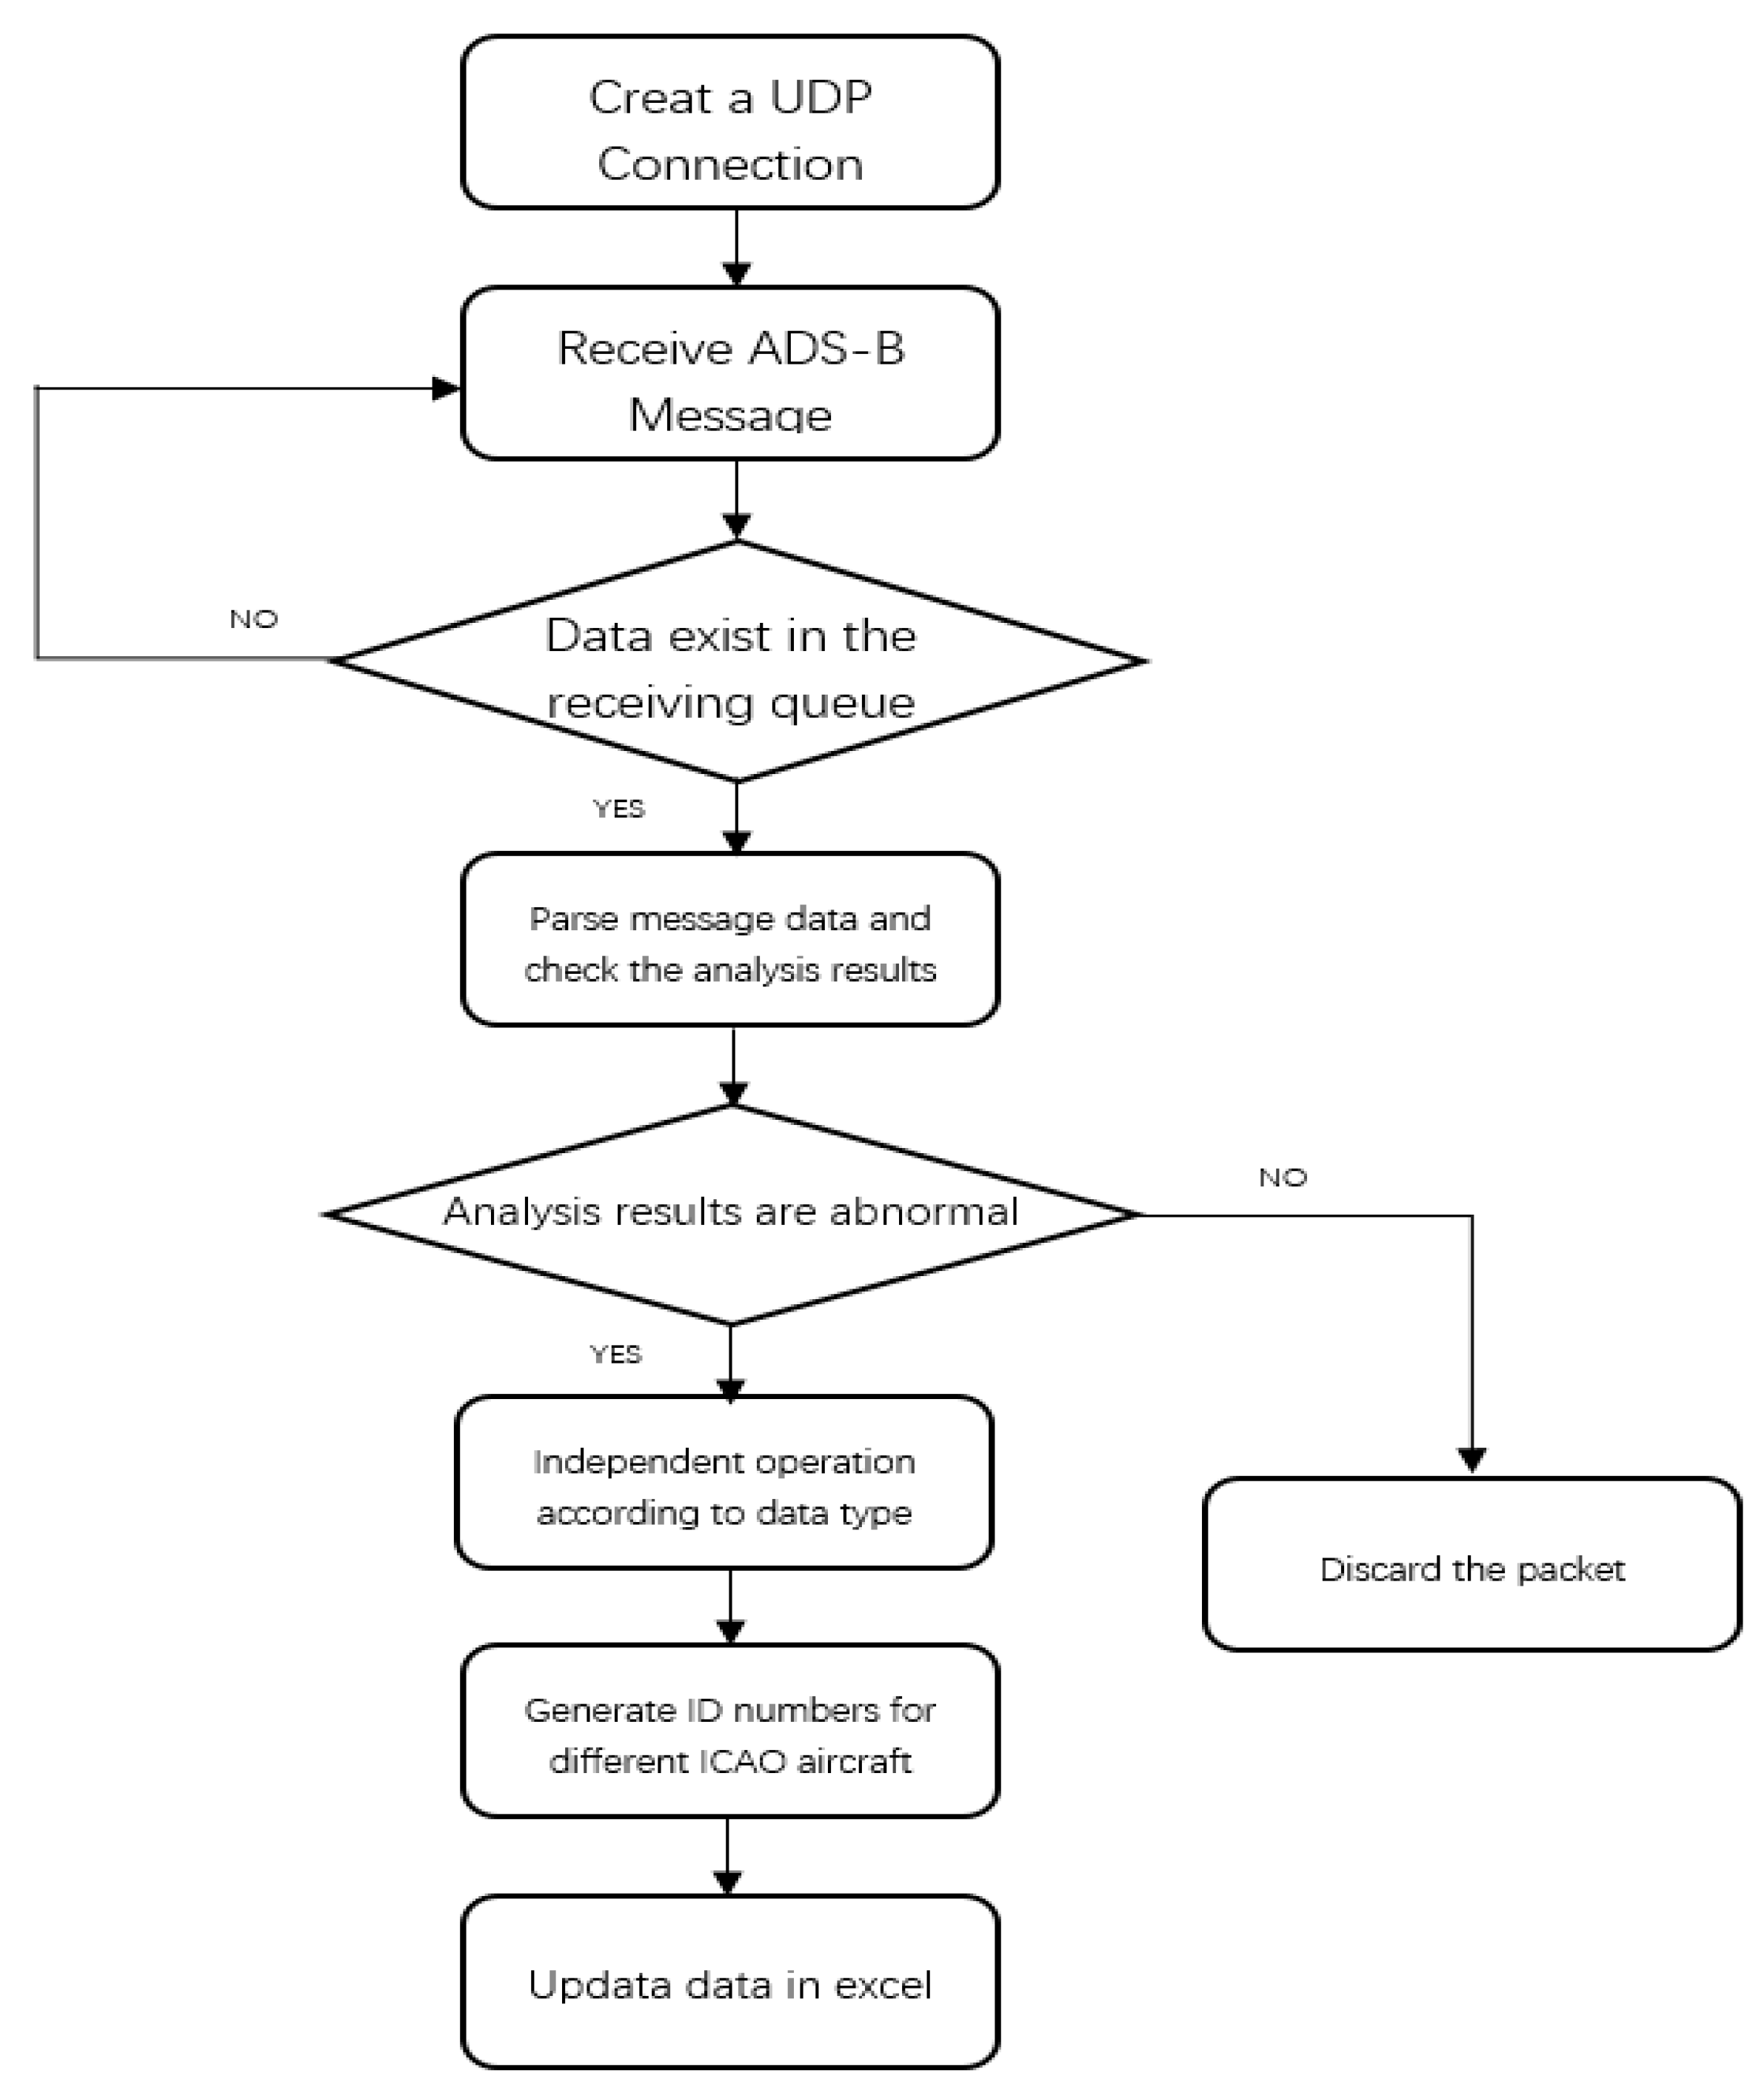
2.1.2. Airspace Traffic Situation Display Development
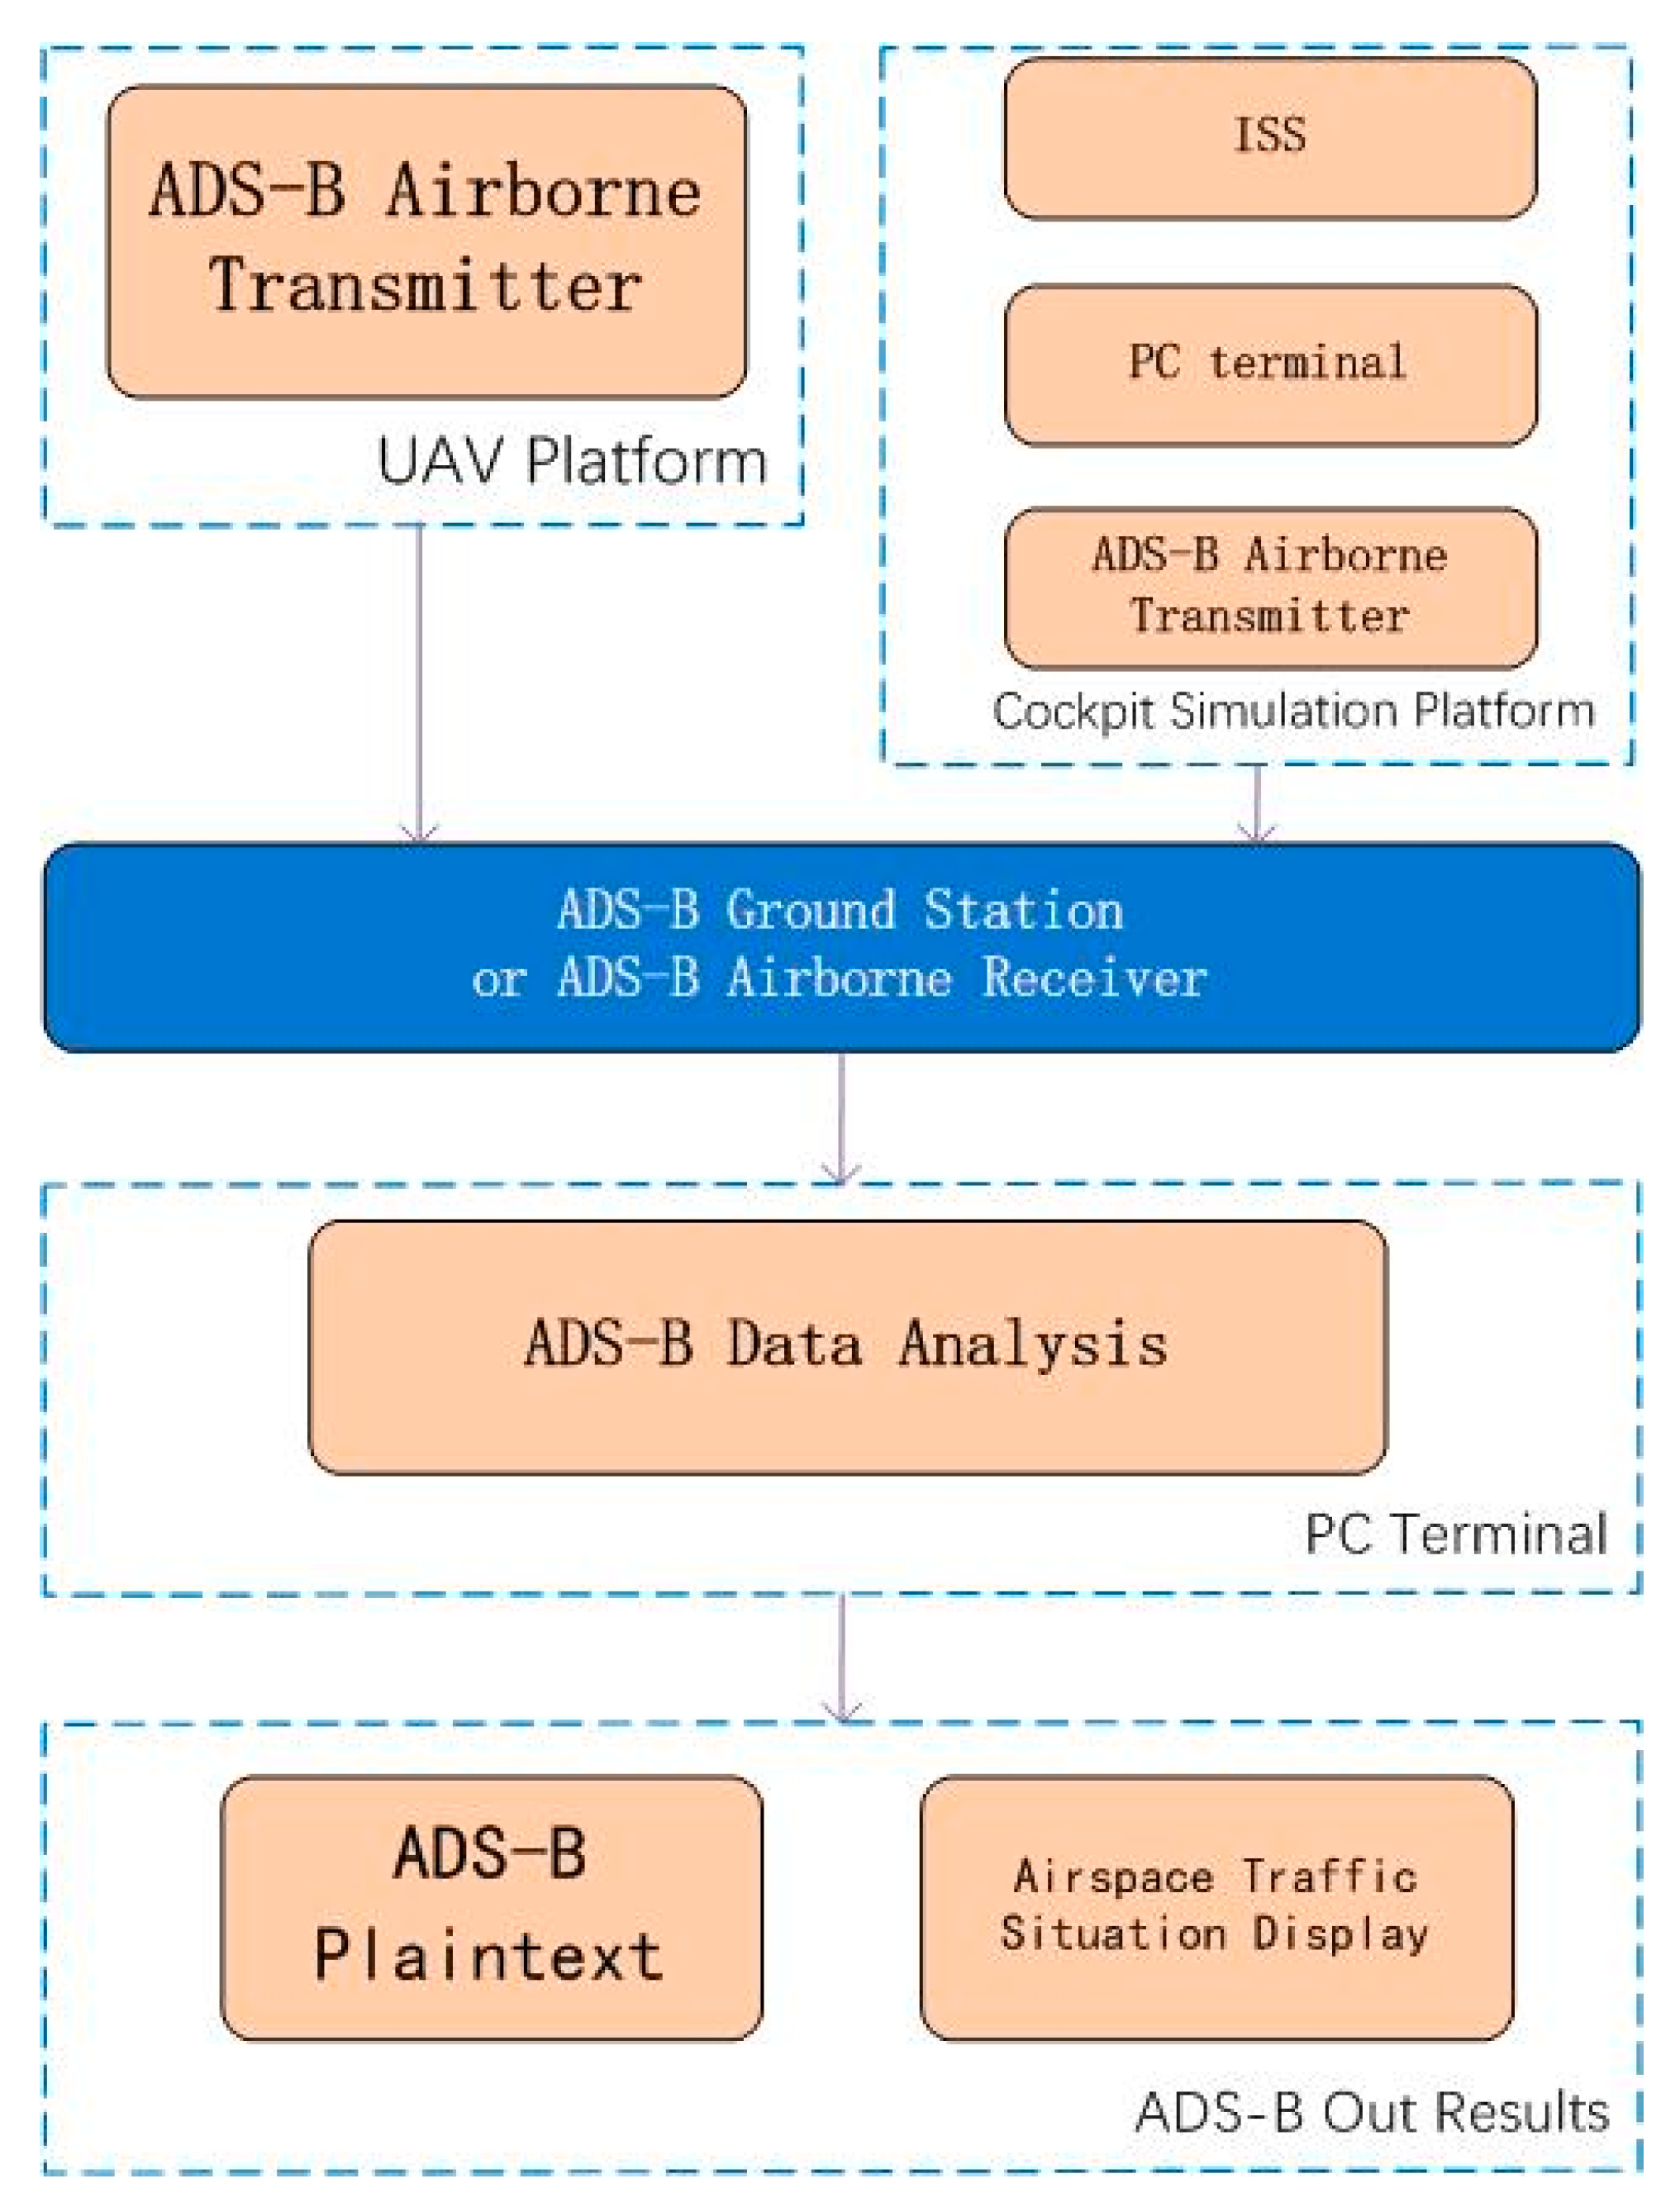
2.2. ADS-B Out Minimum System Design
2.2.1. ADS-B Out Data Transmission Based on a Simulation Cockpit Platform
2.2.2. ADS-B Out Data Transmission Based on an UAV Platform
3. ADS-B Minimum System Implementation
3.1. ADS-B In Minimum System Implementation
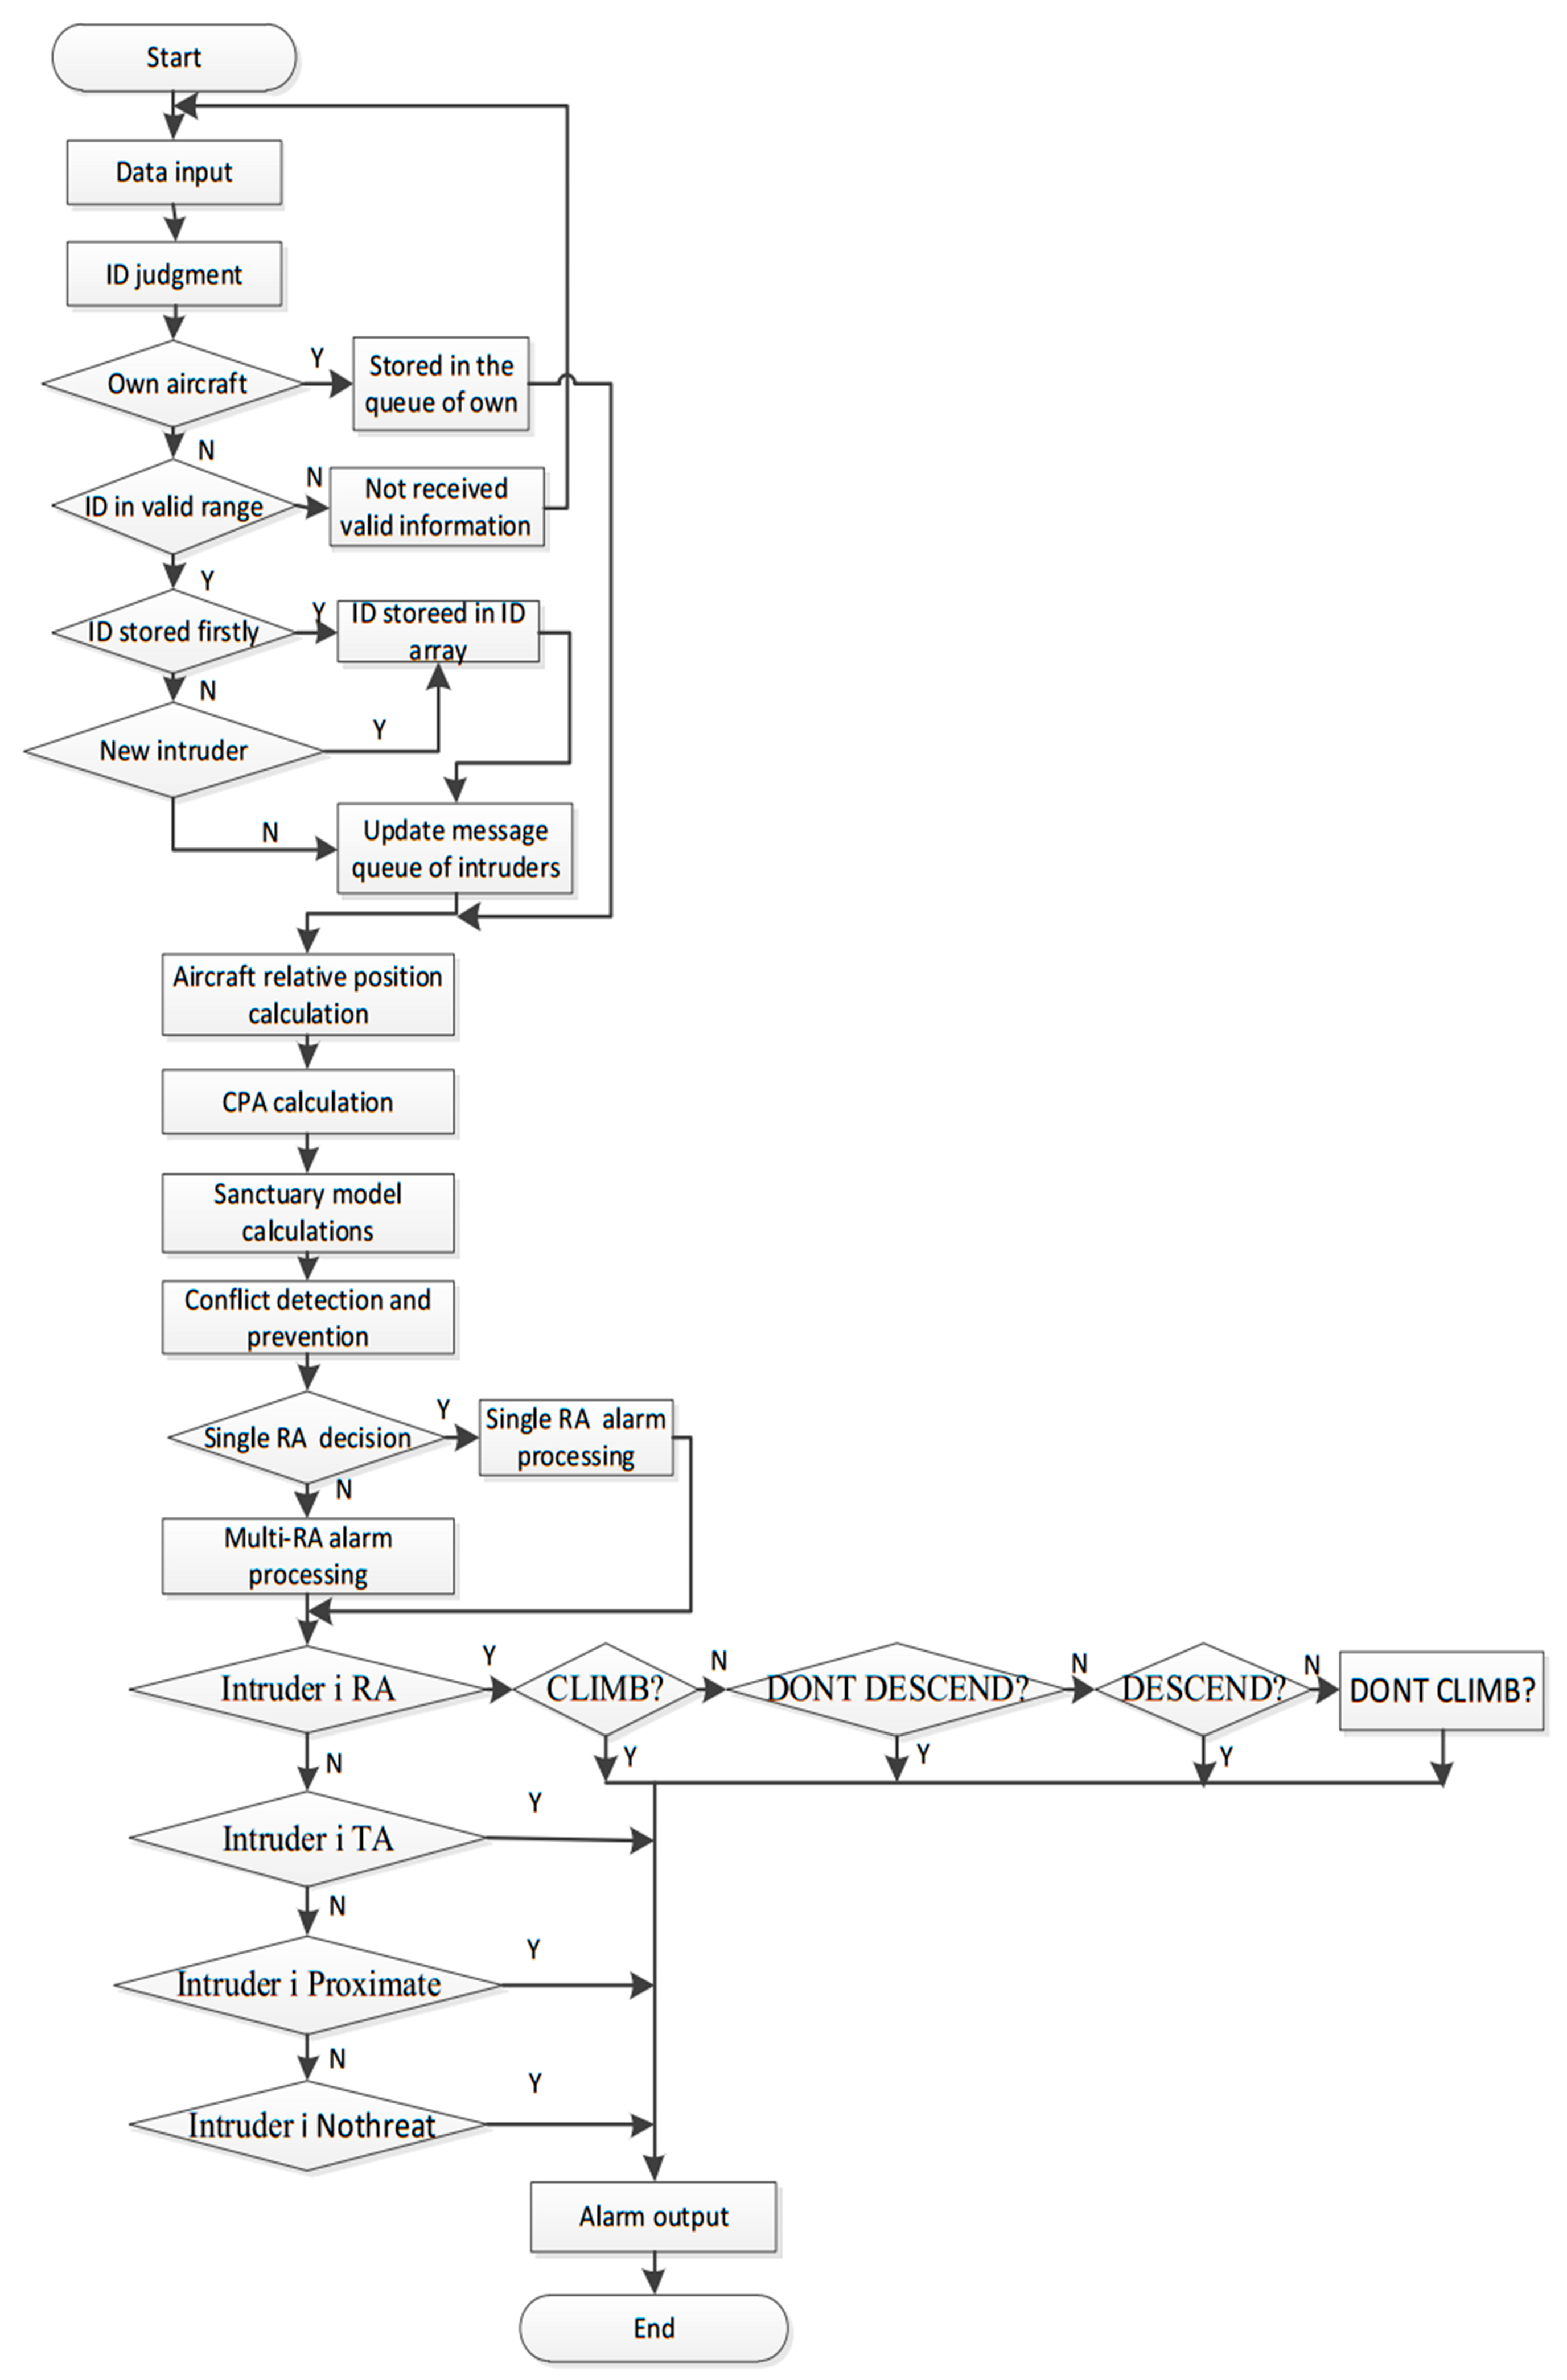
3.1.1. ADS-B and TCAS Integrated Display
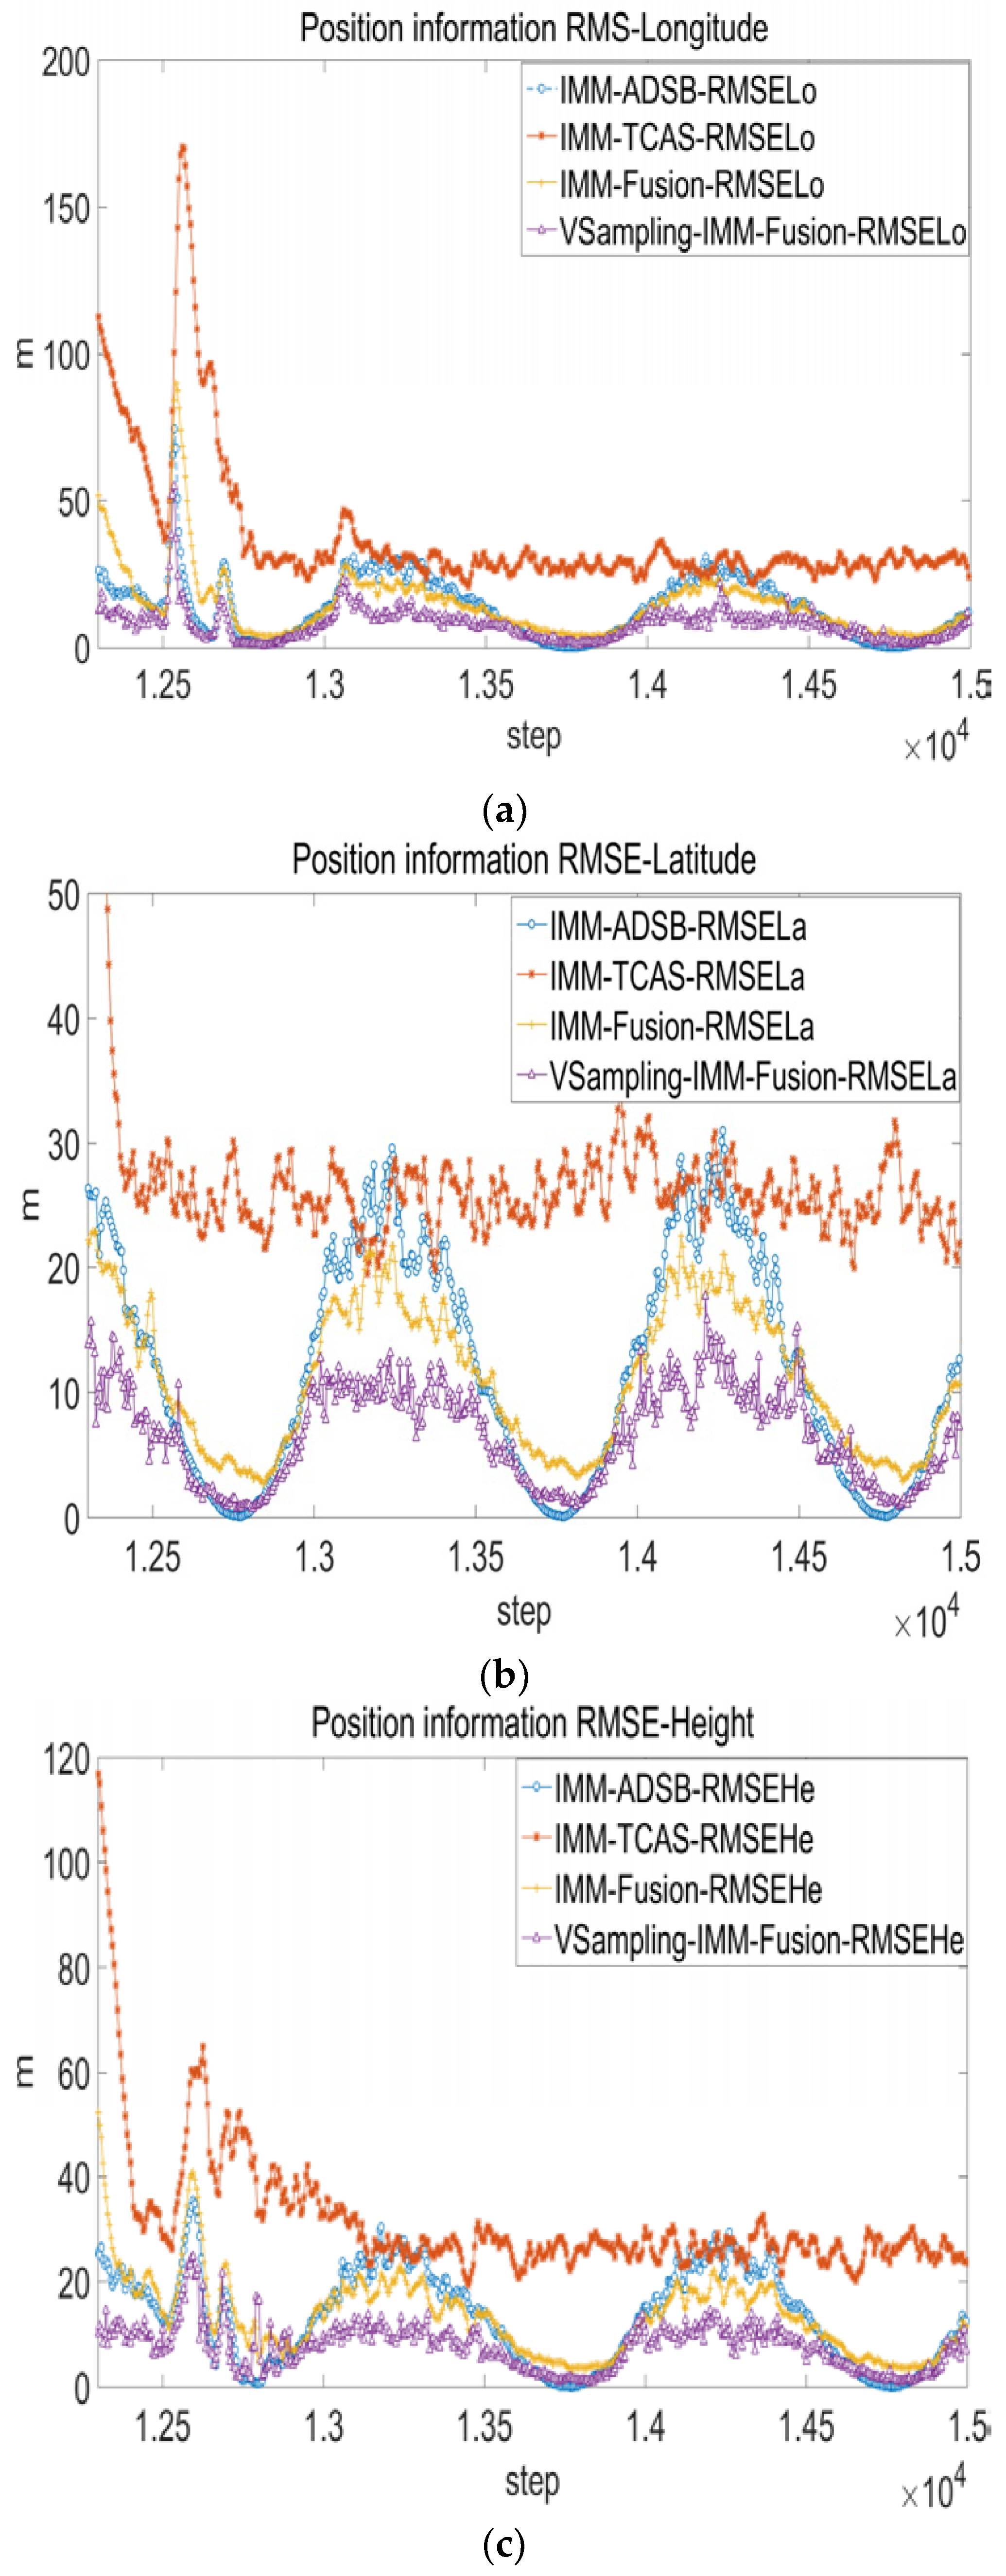
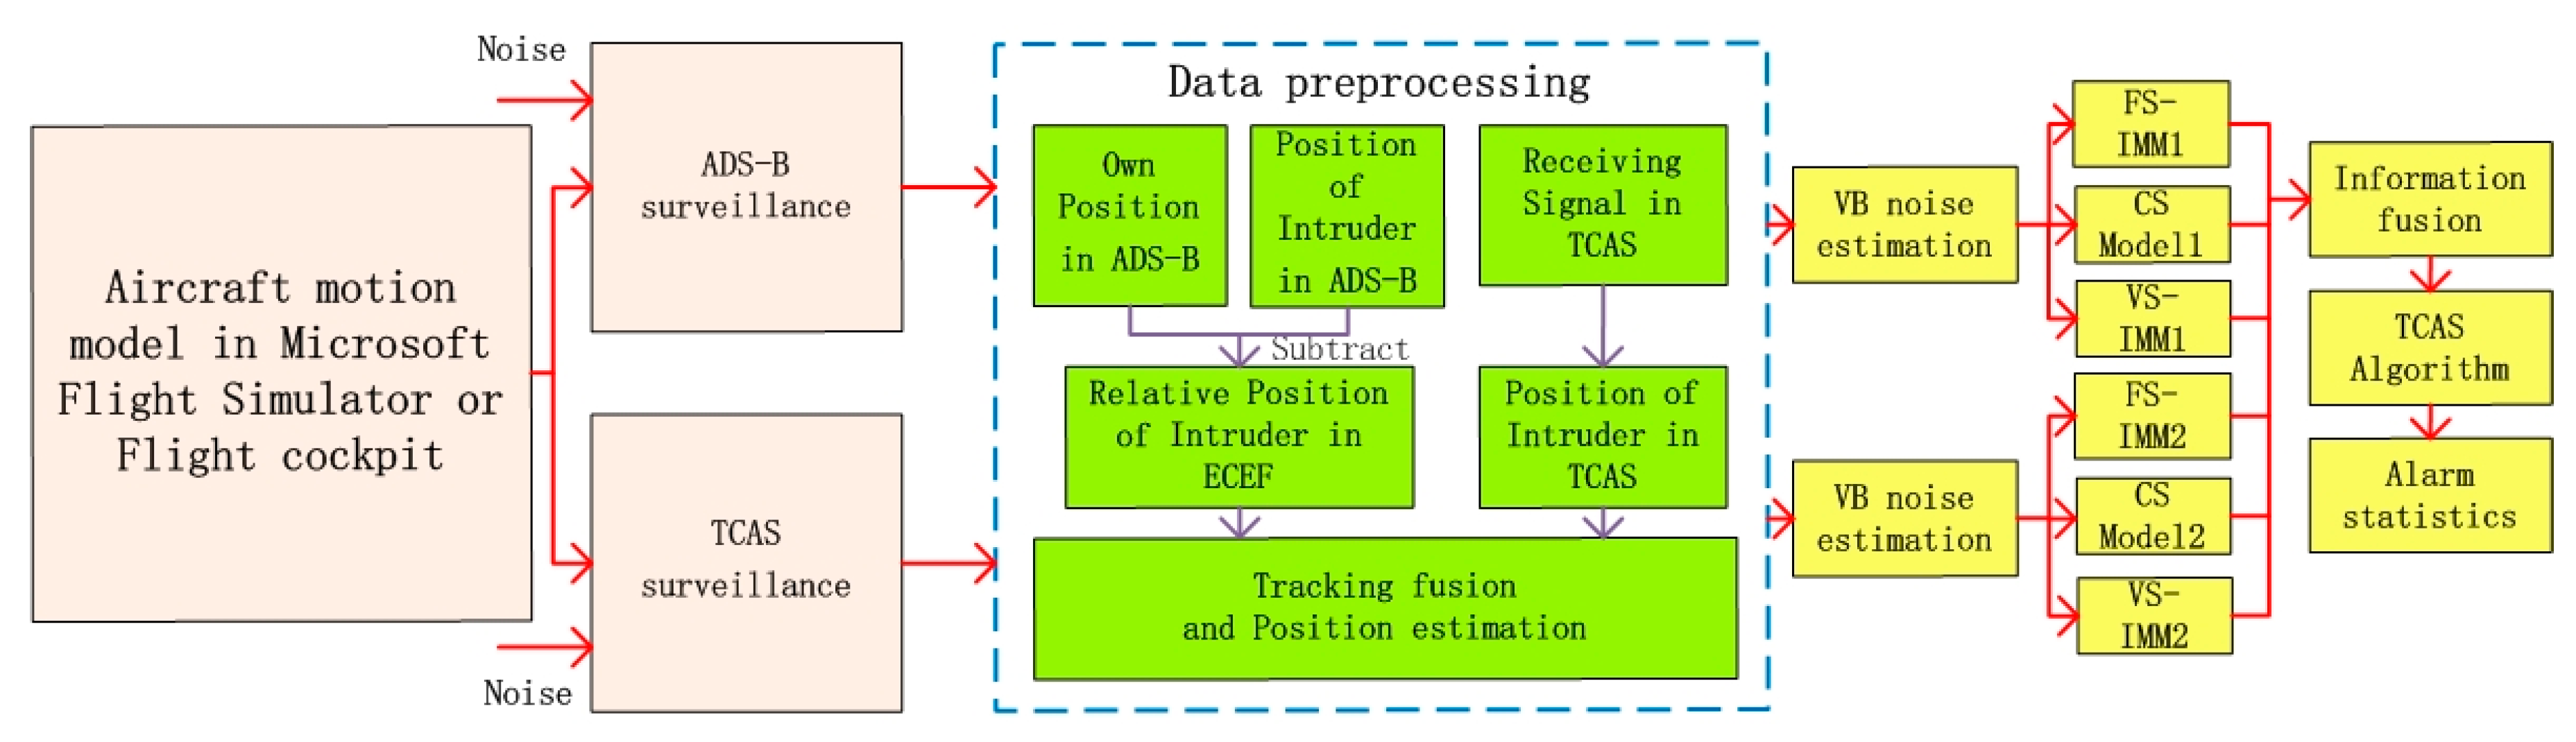
Simulation Results of Fusion Model Based on VB-IMM Algorithm
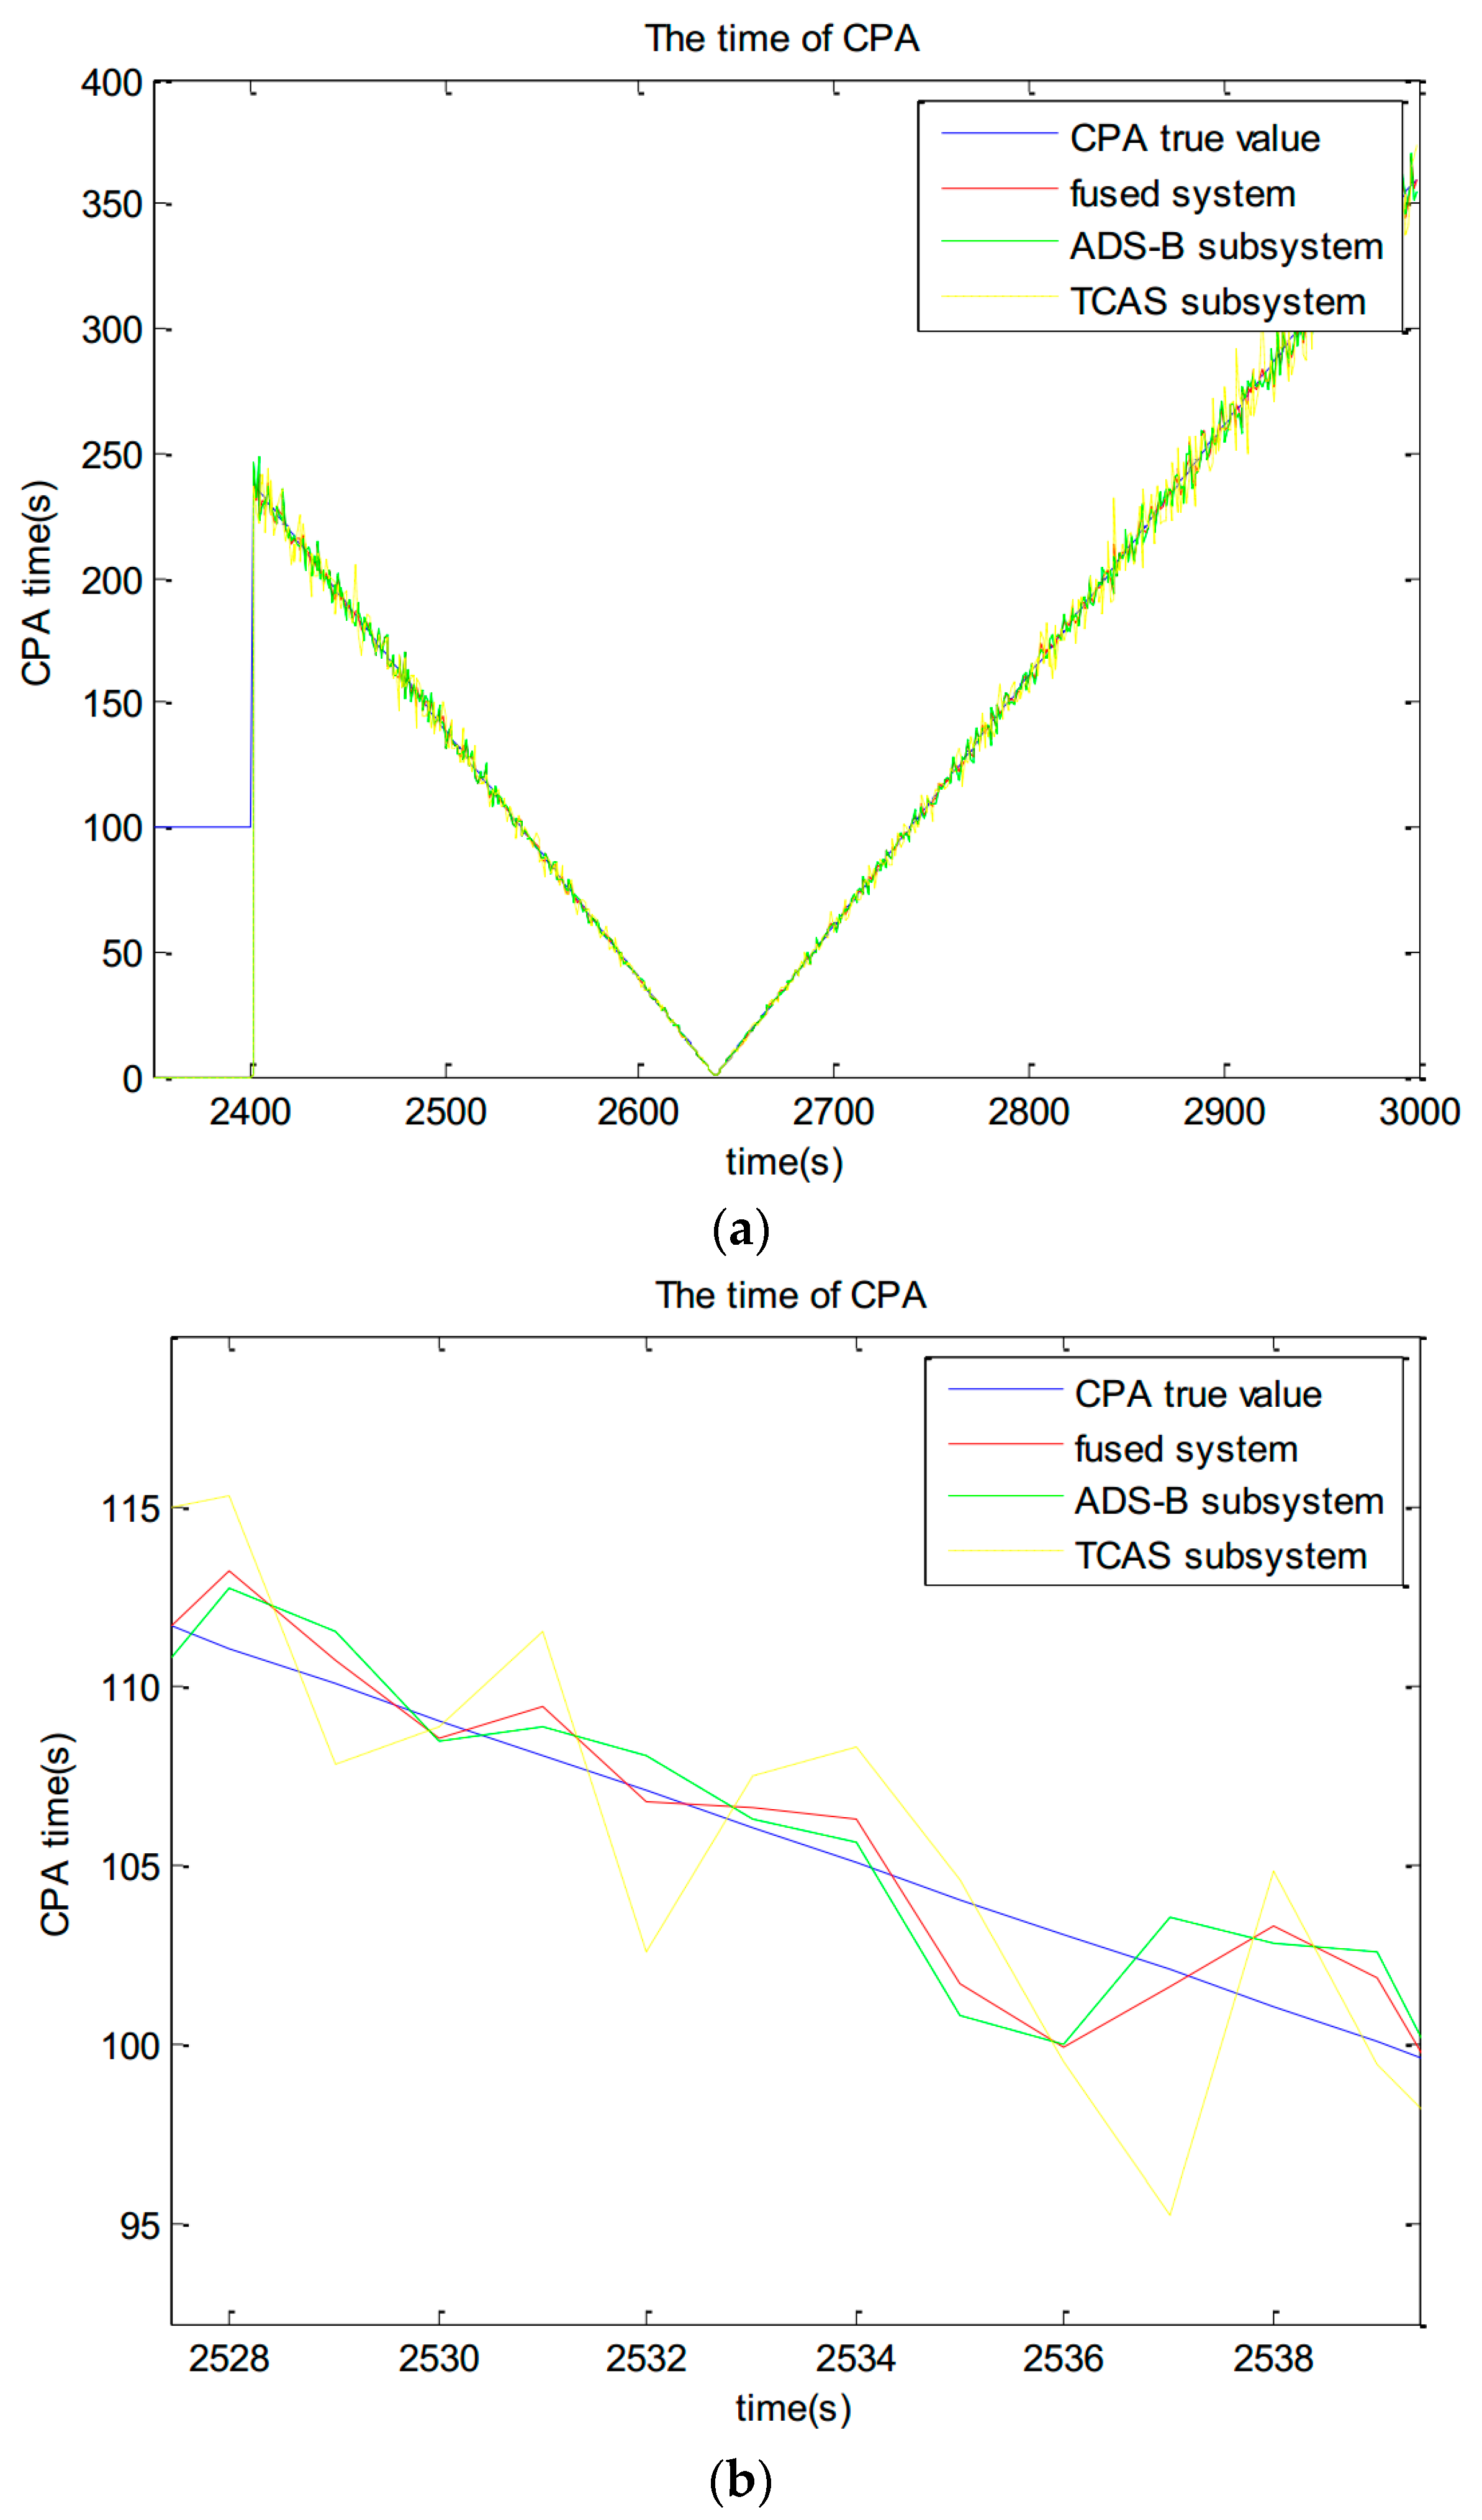
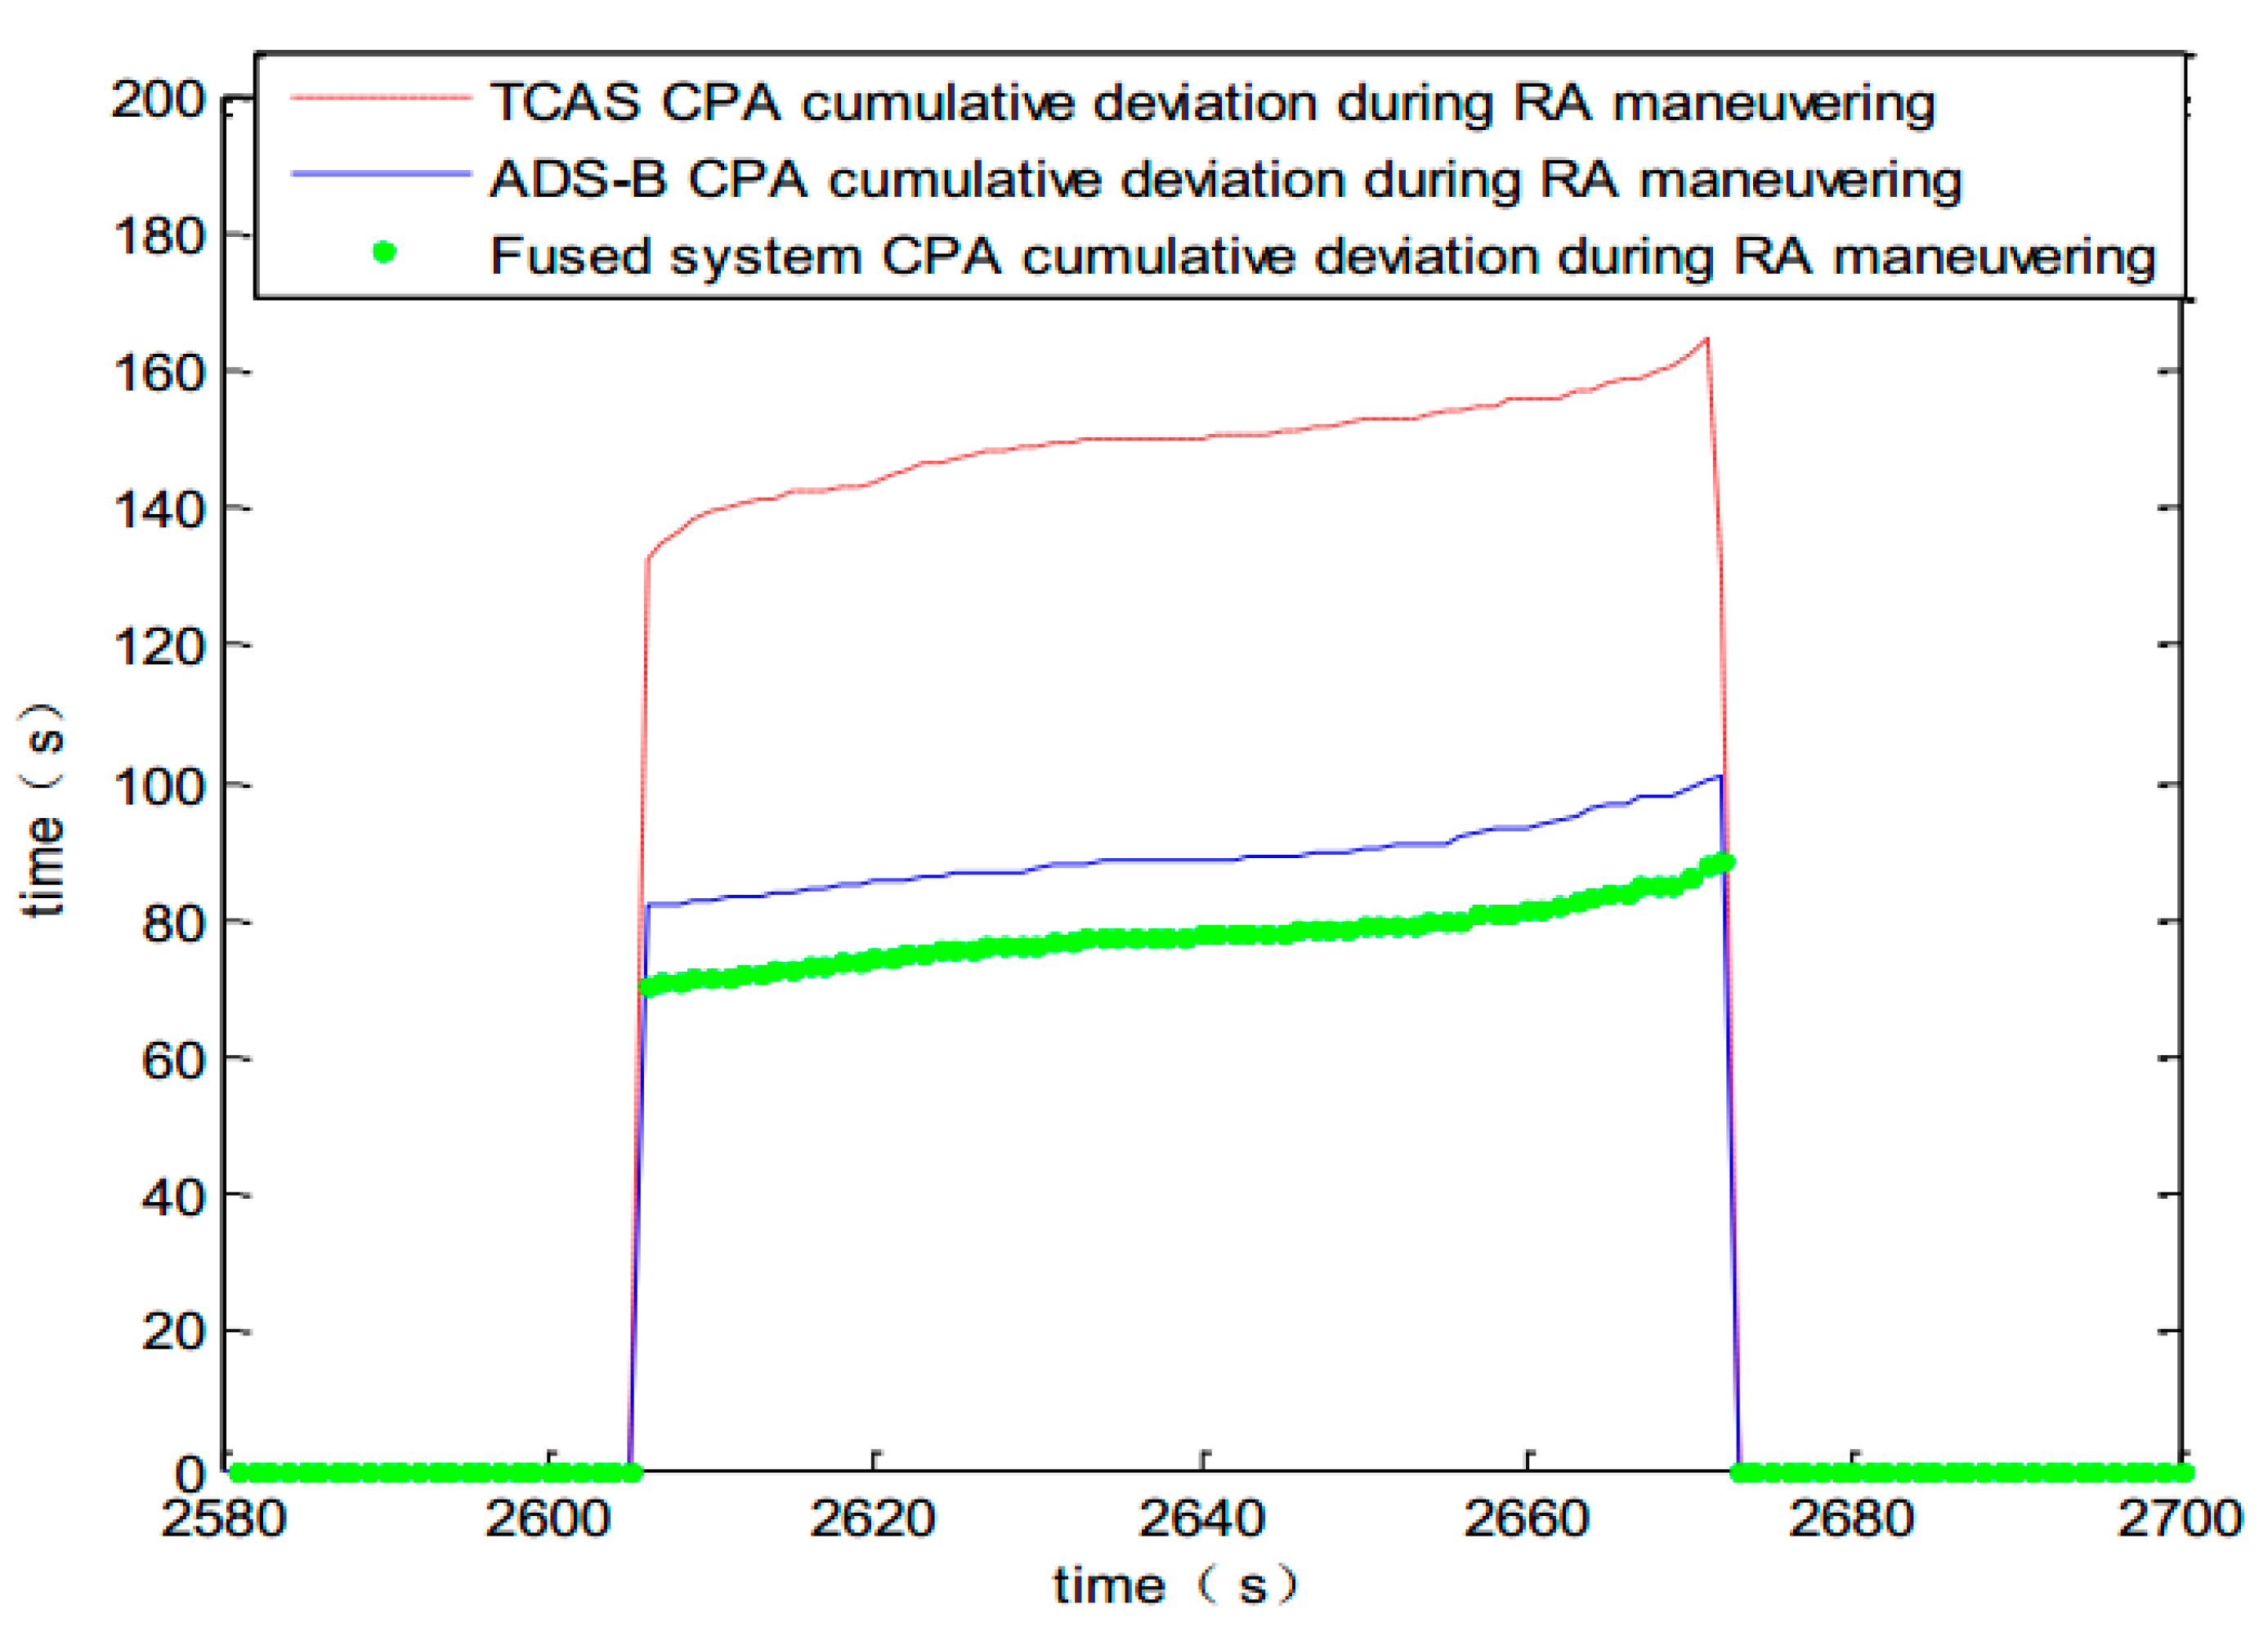
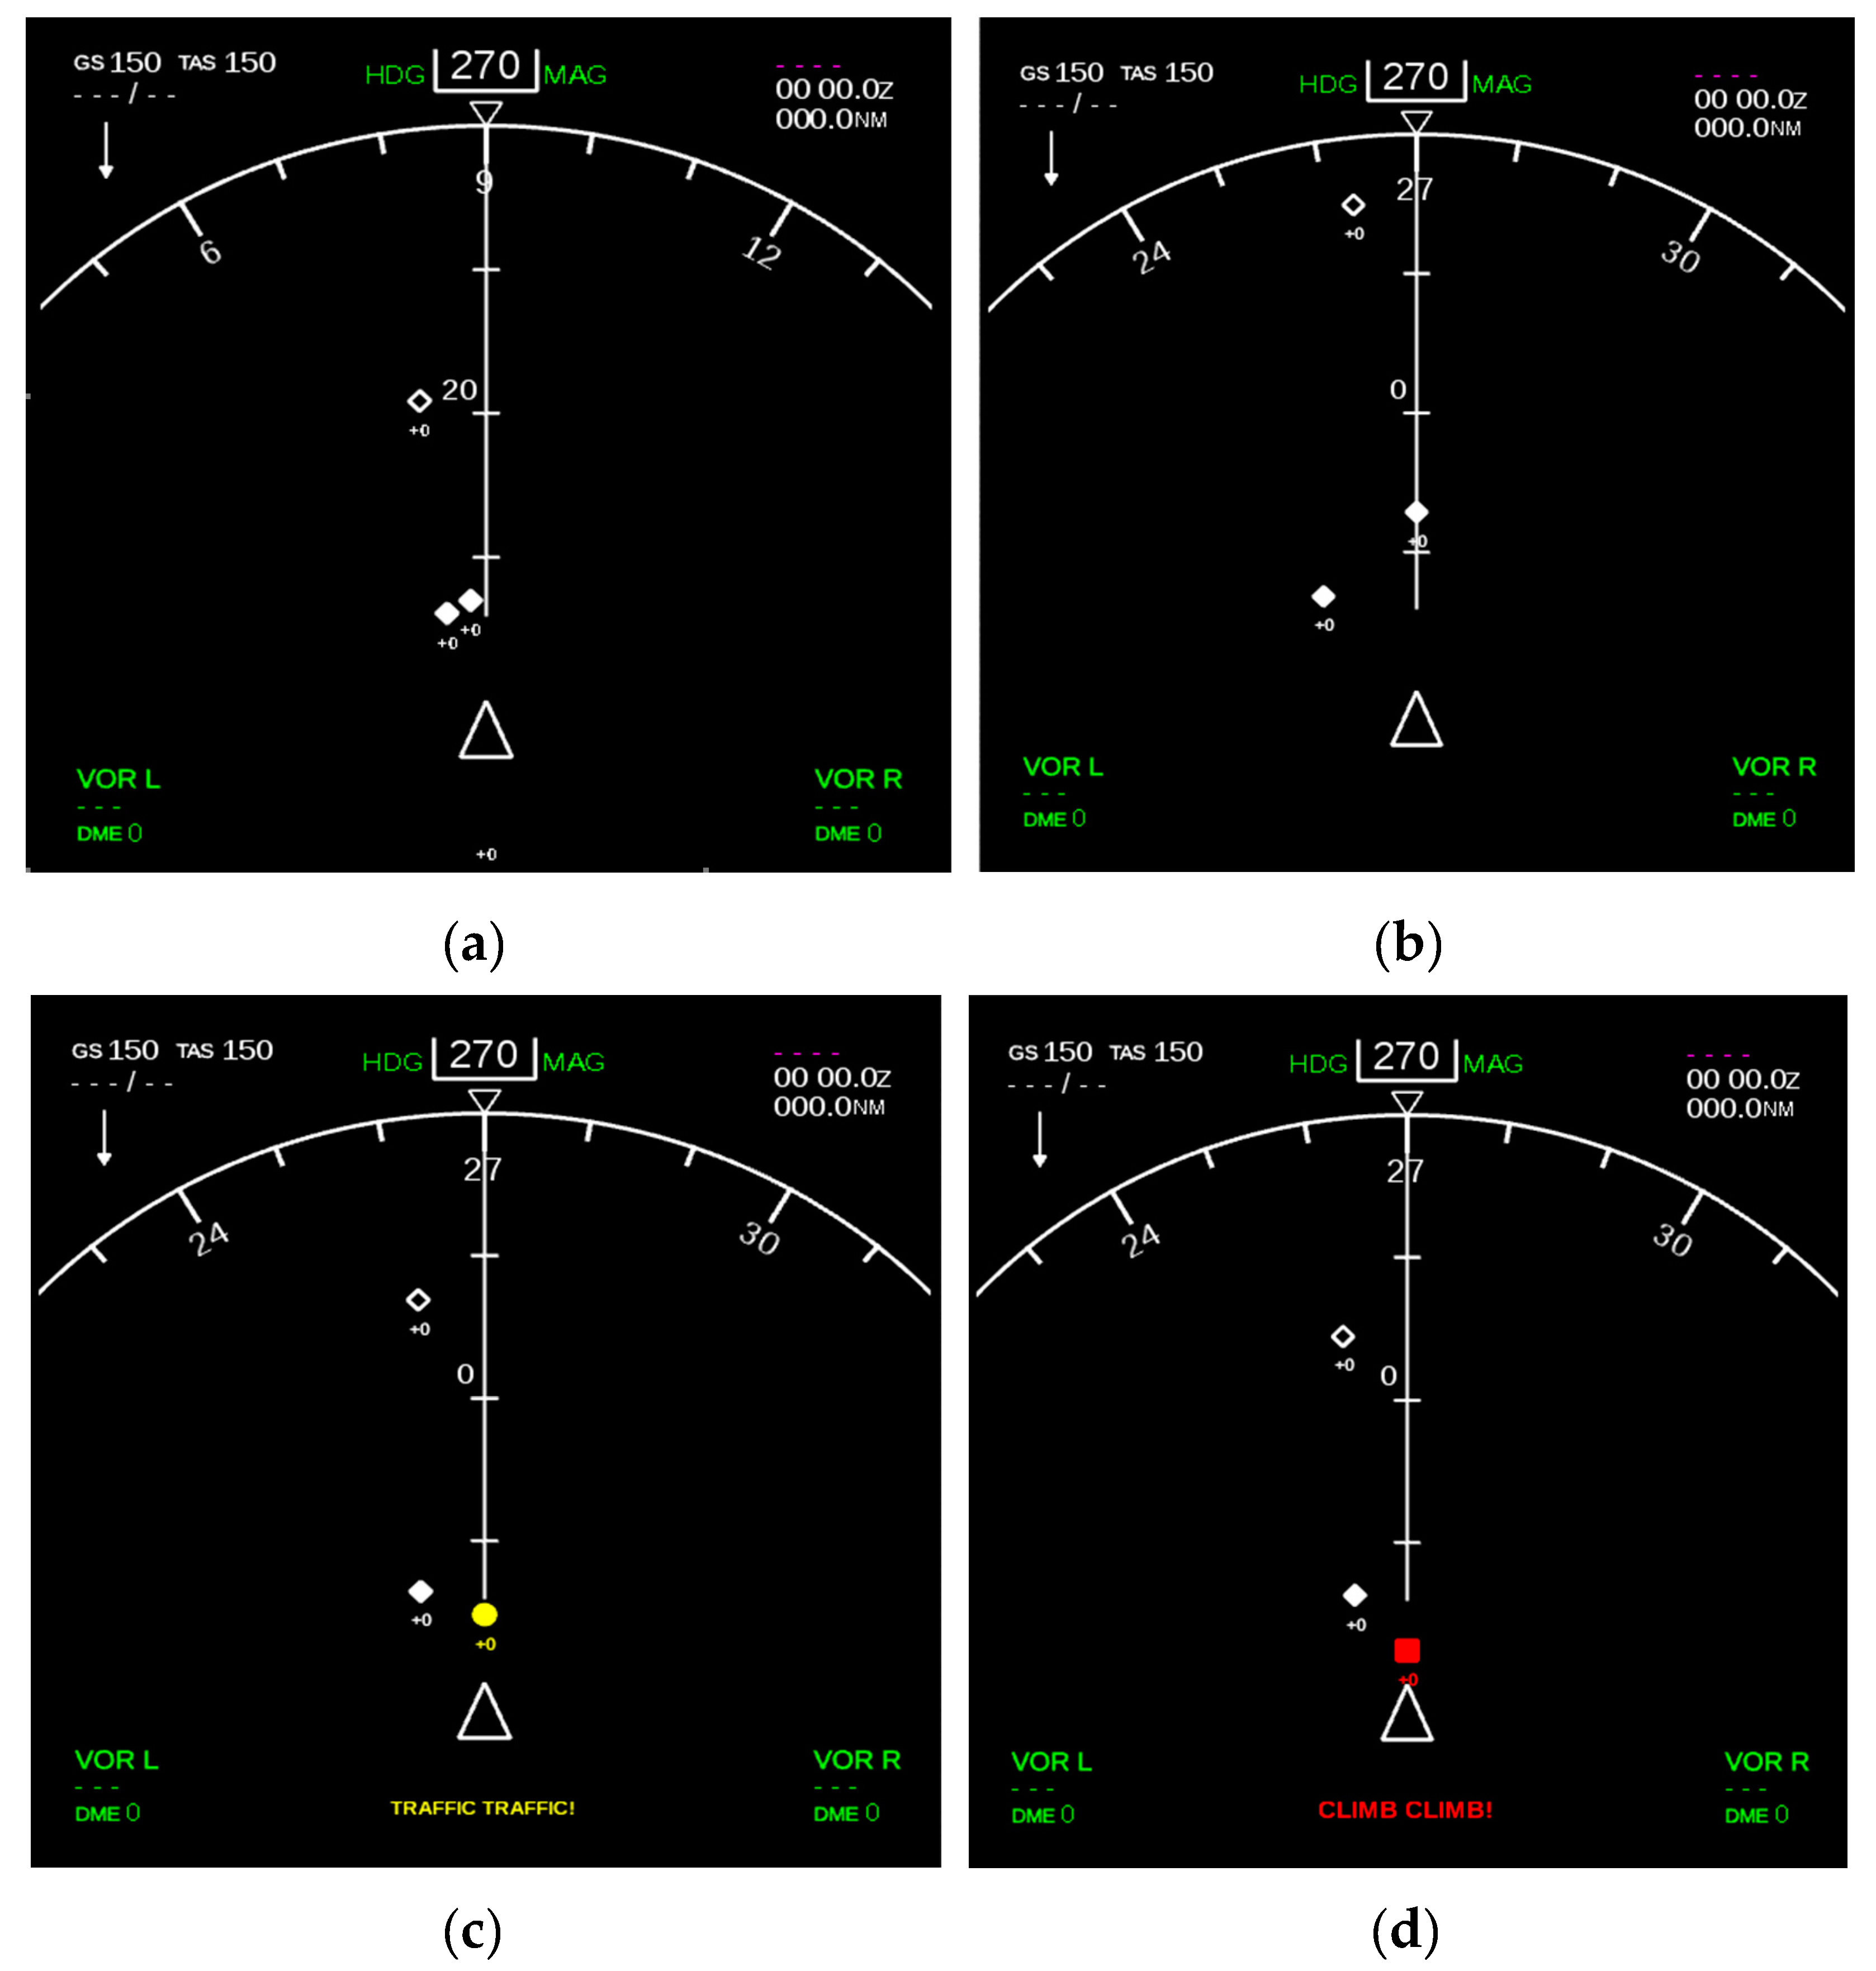
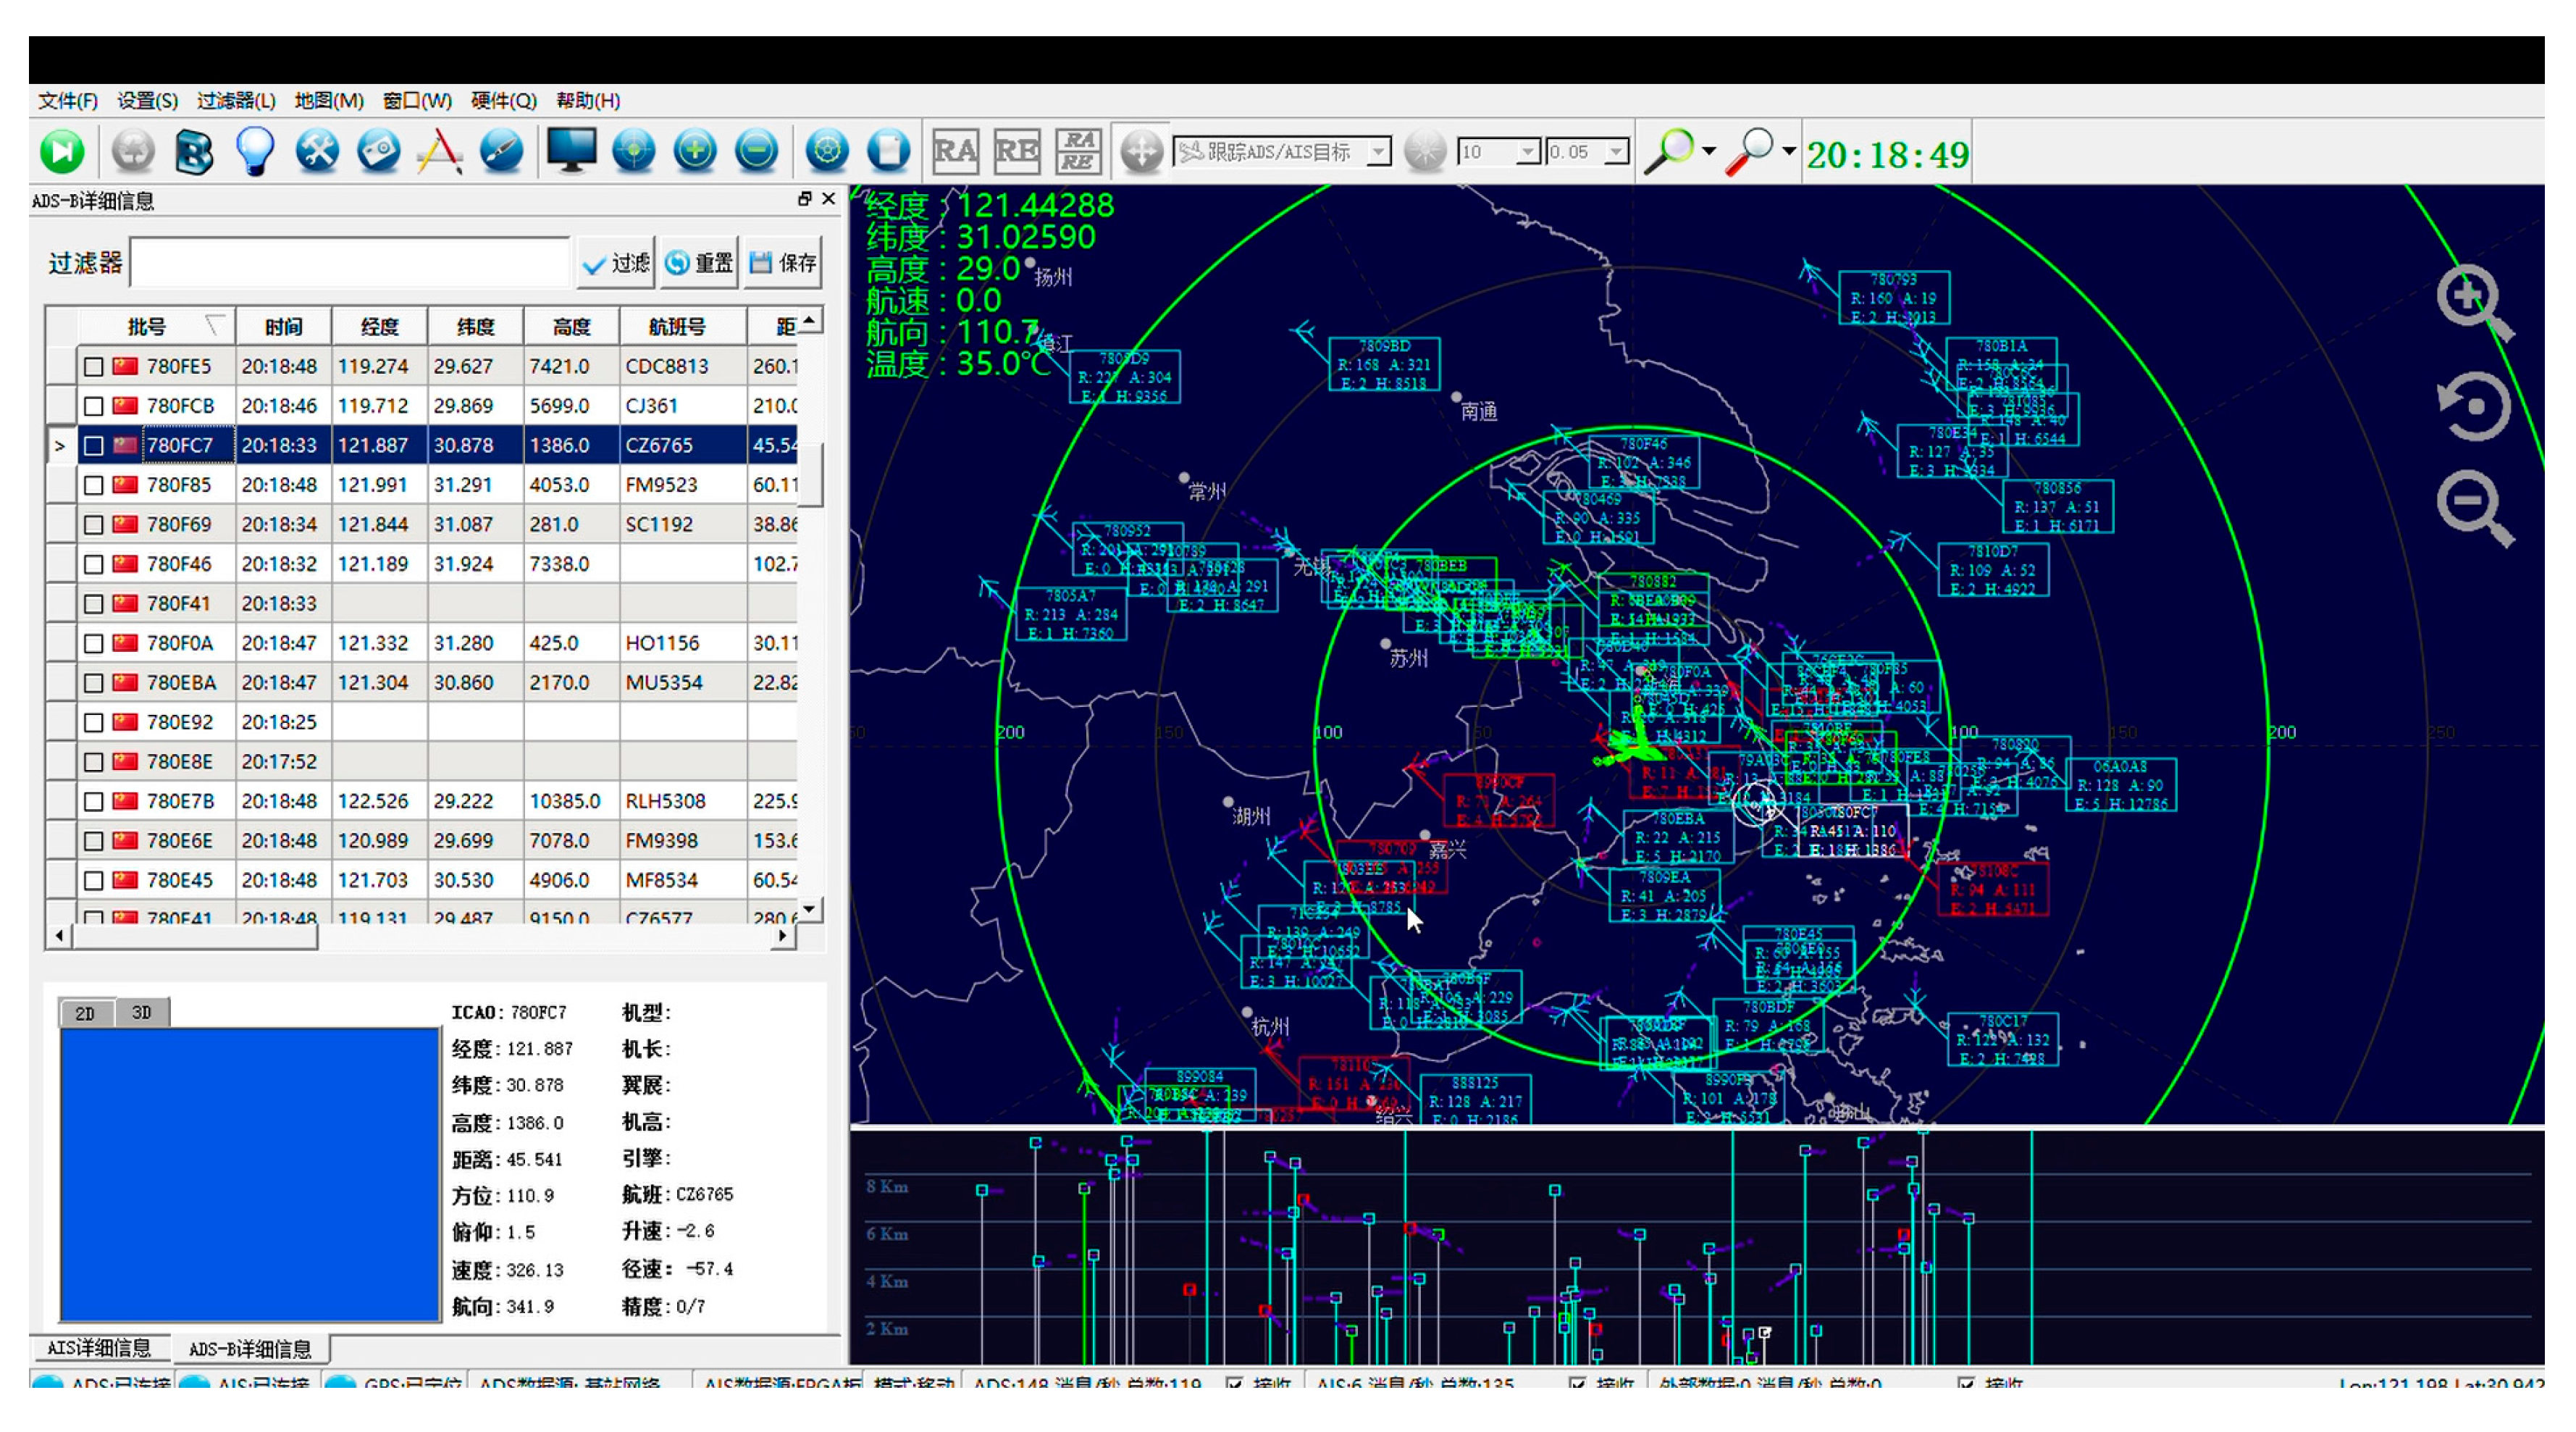
Application of ADS-B and TCAS Integrated Display
3.1.2. Display Interface Development
3.2. ADS-B Out Minimum System Implementation
3.2.1. ADS-B Out Data Transmission Based On Simulation Cockpit Platform
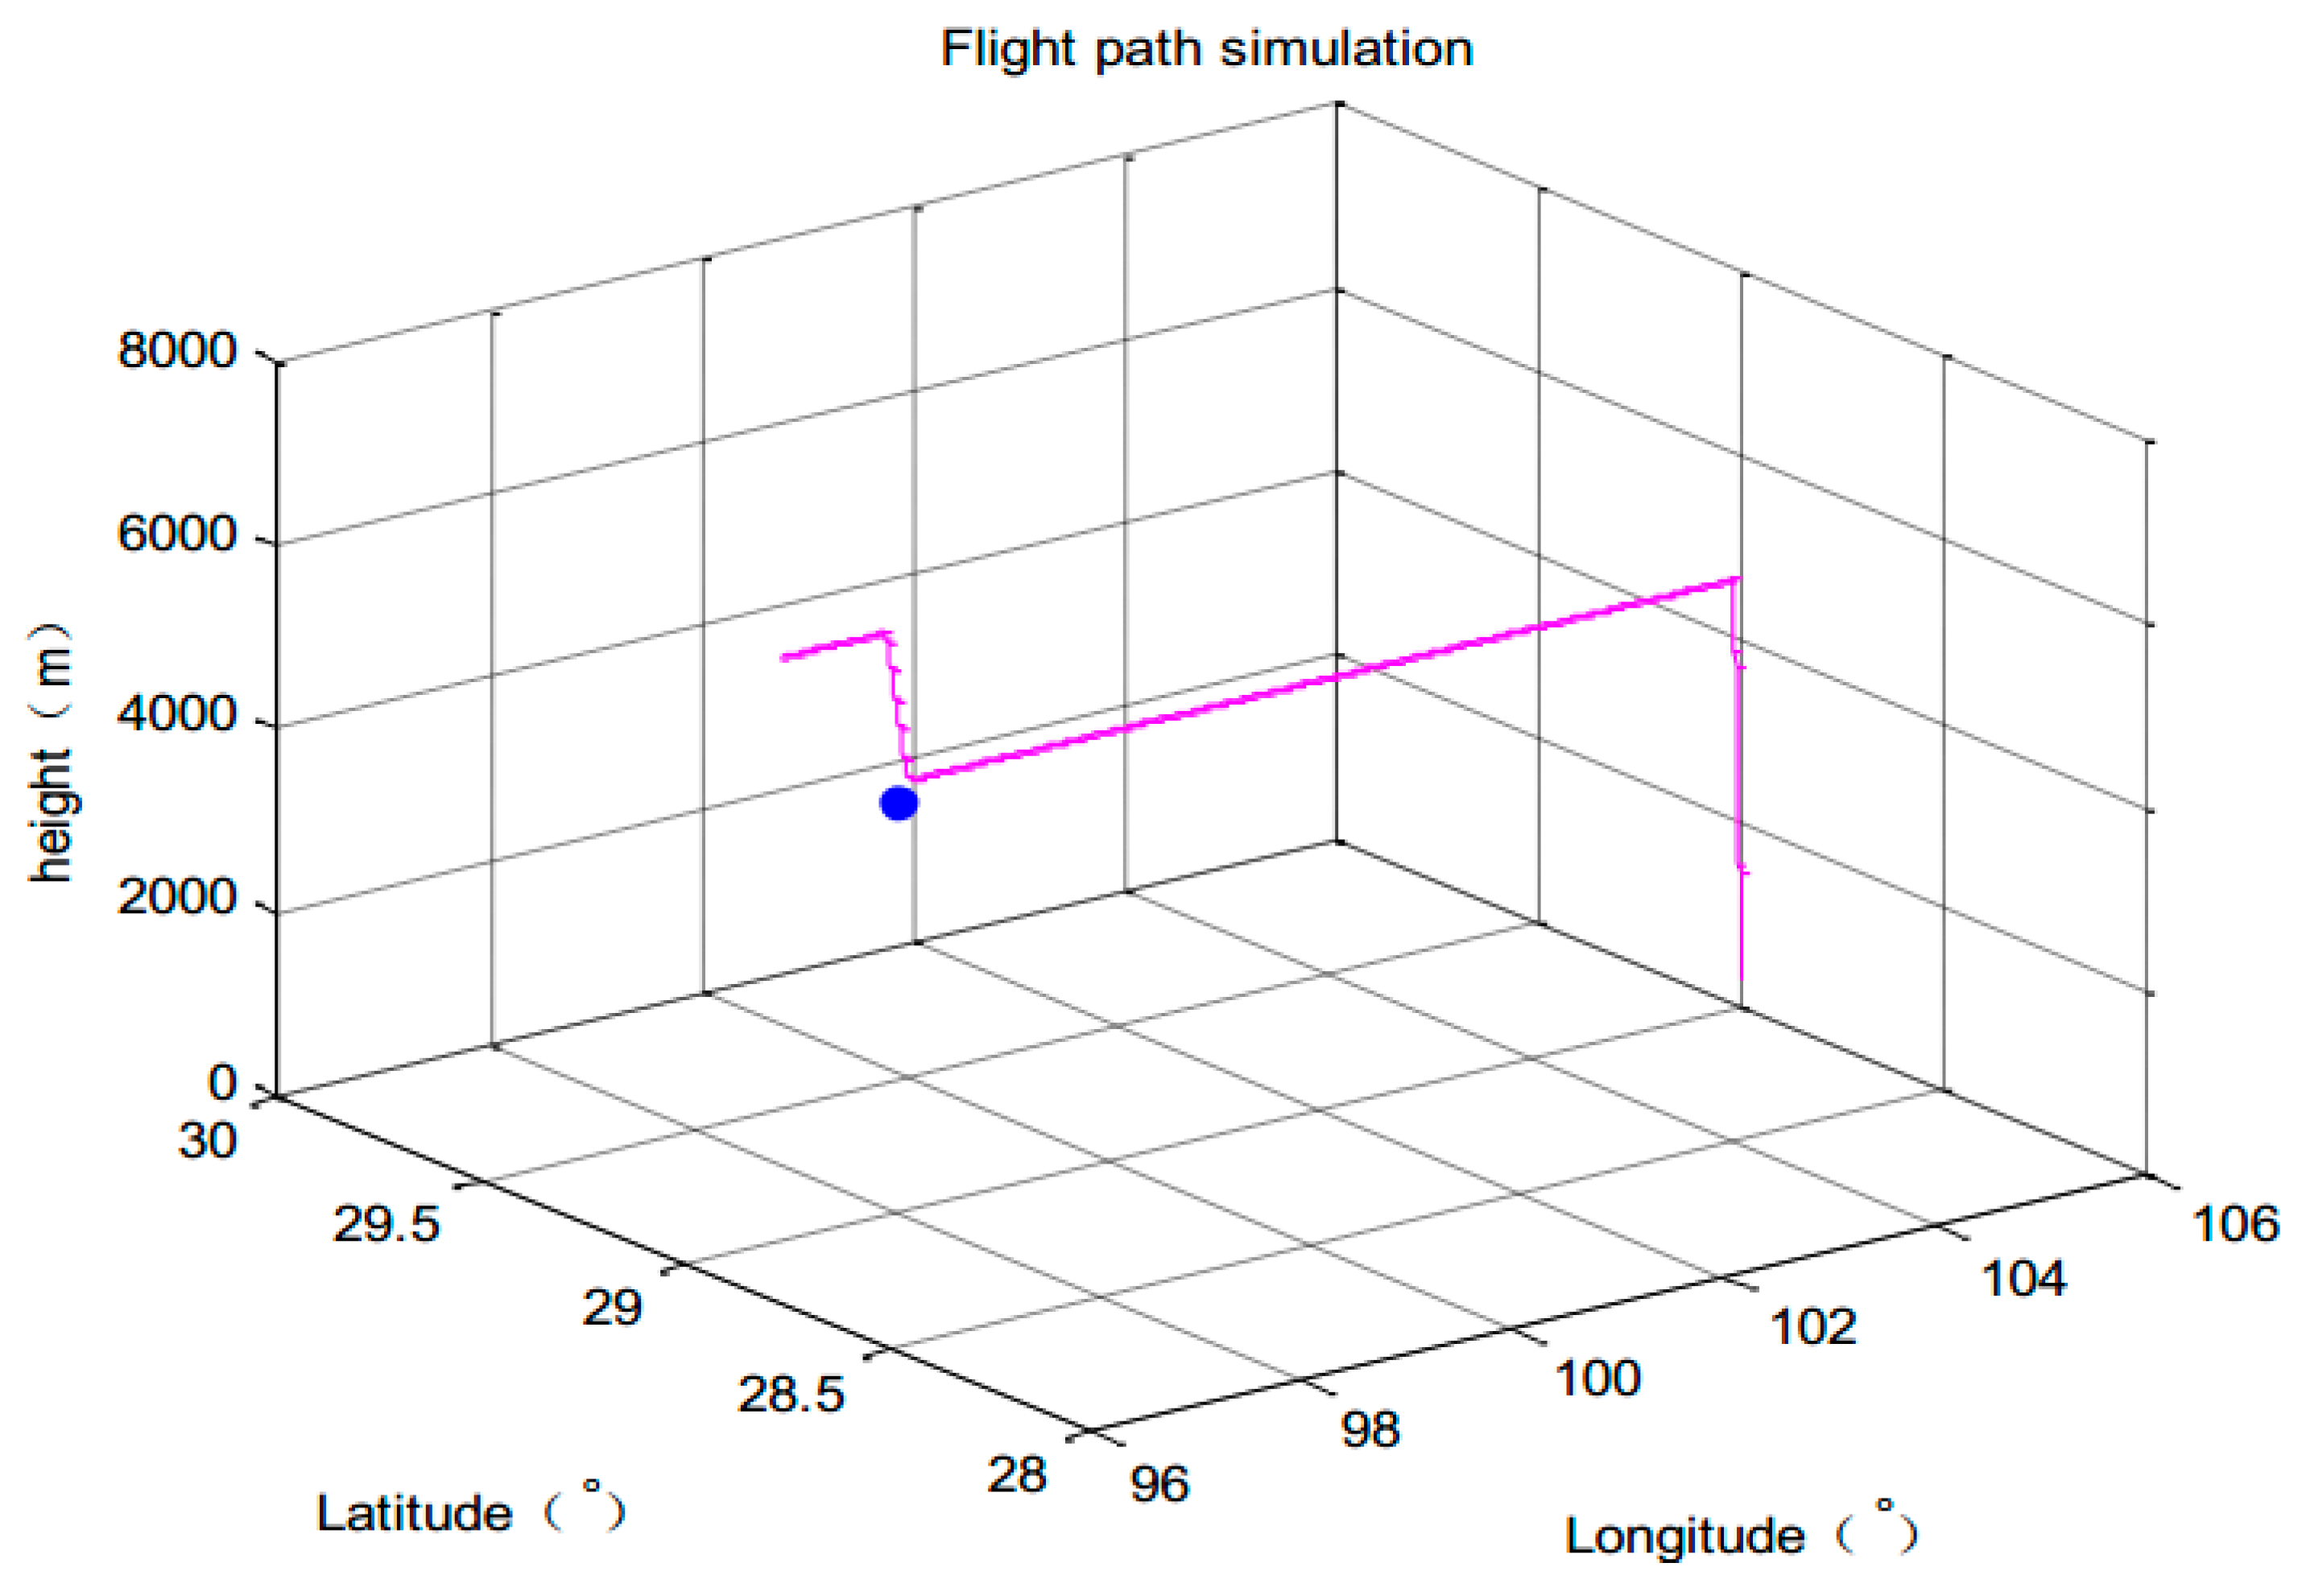
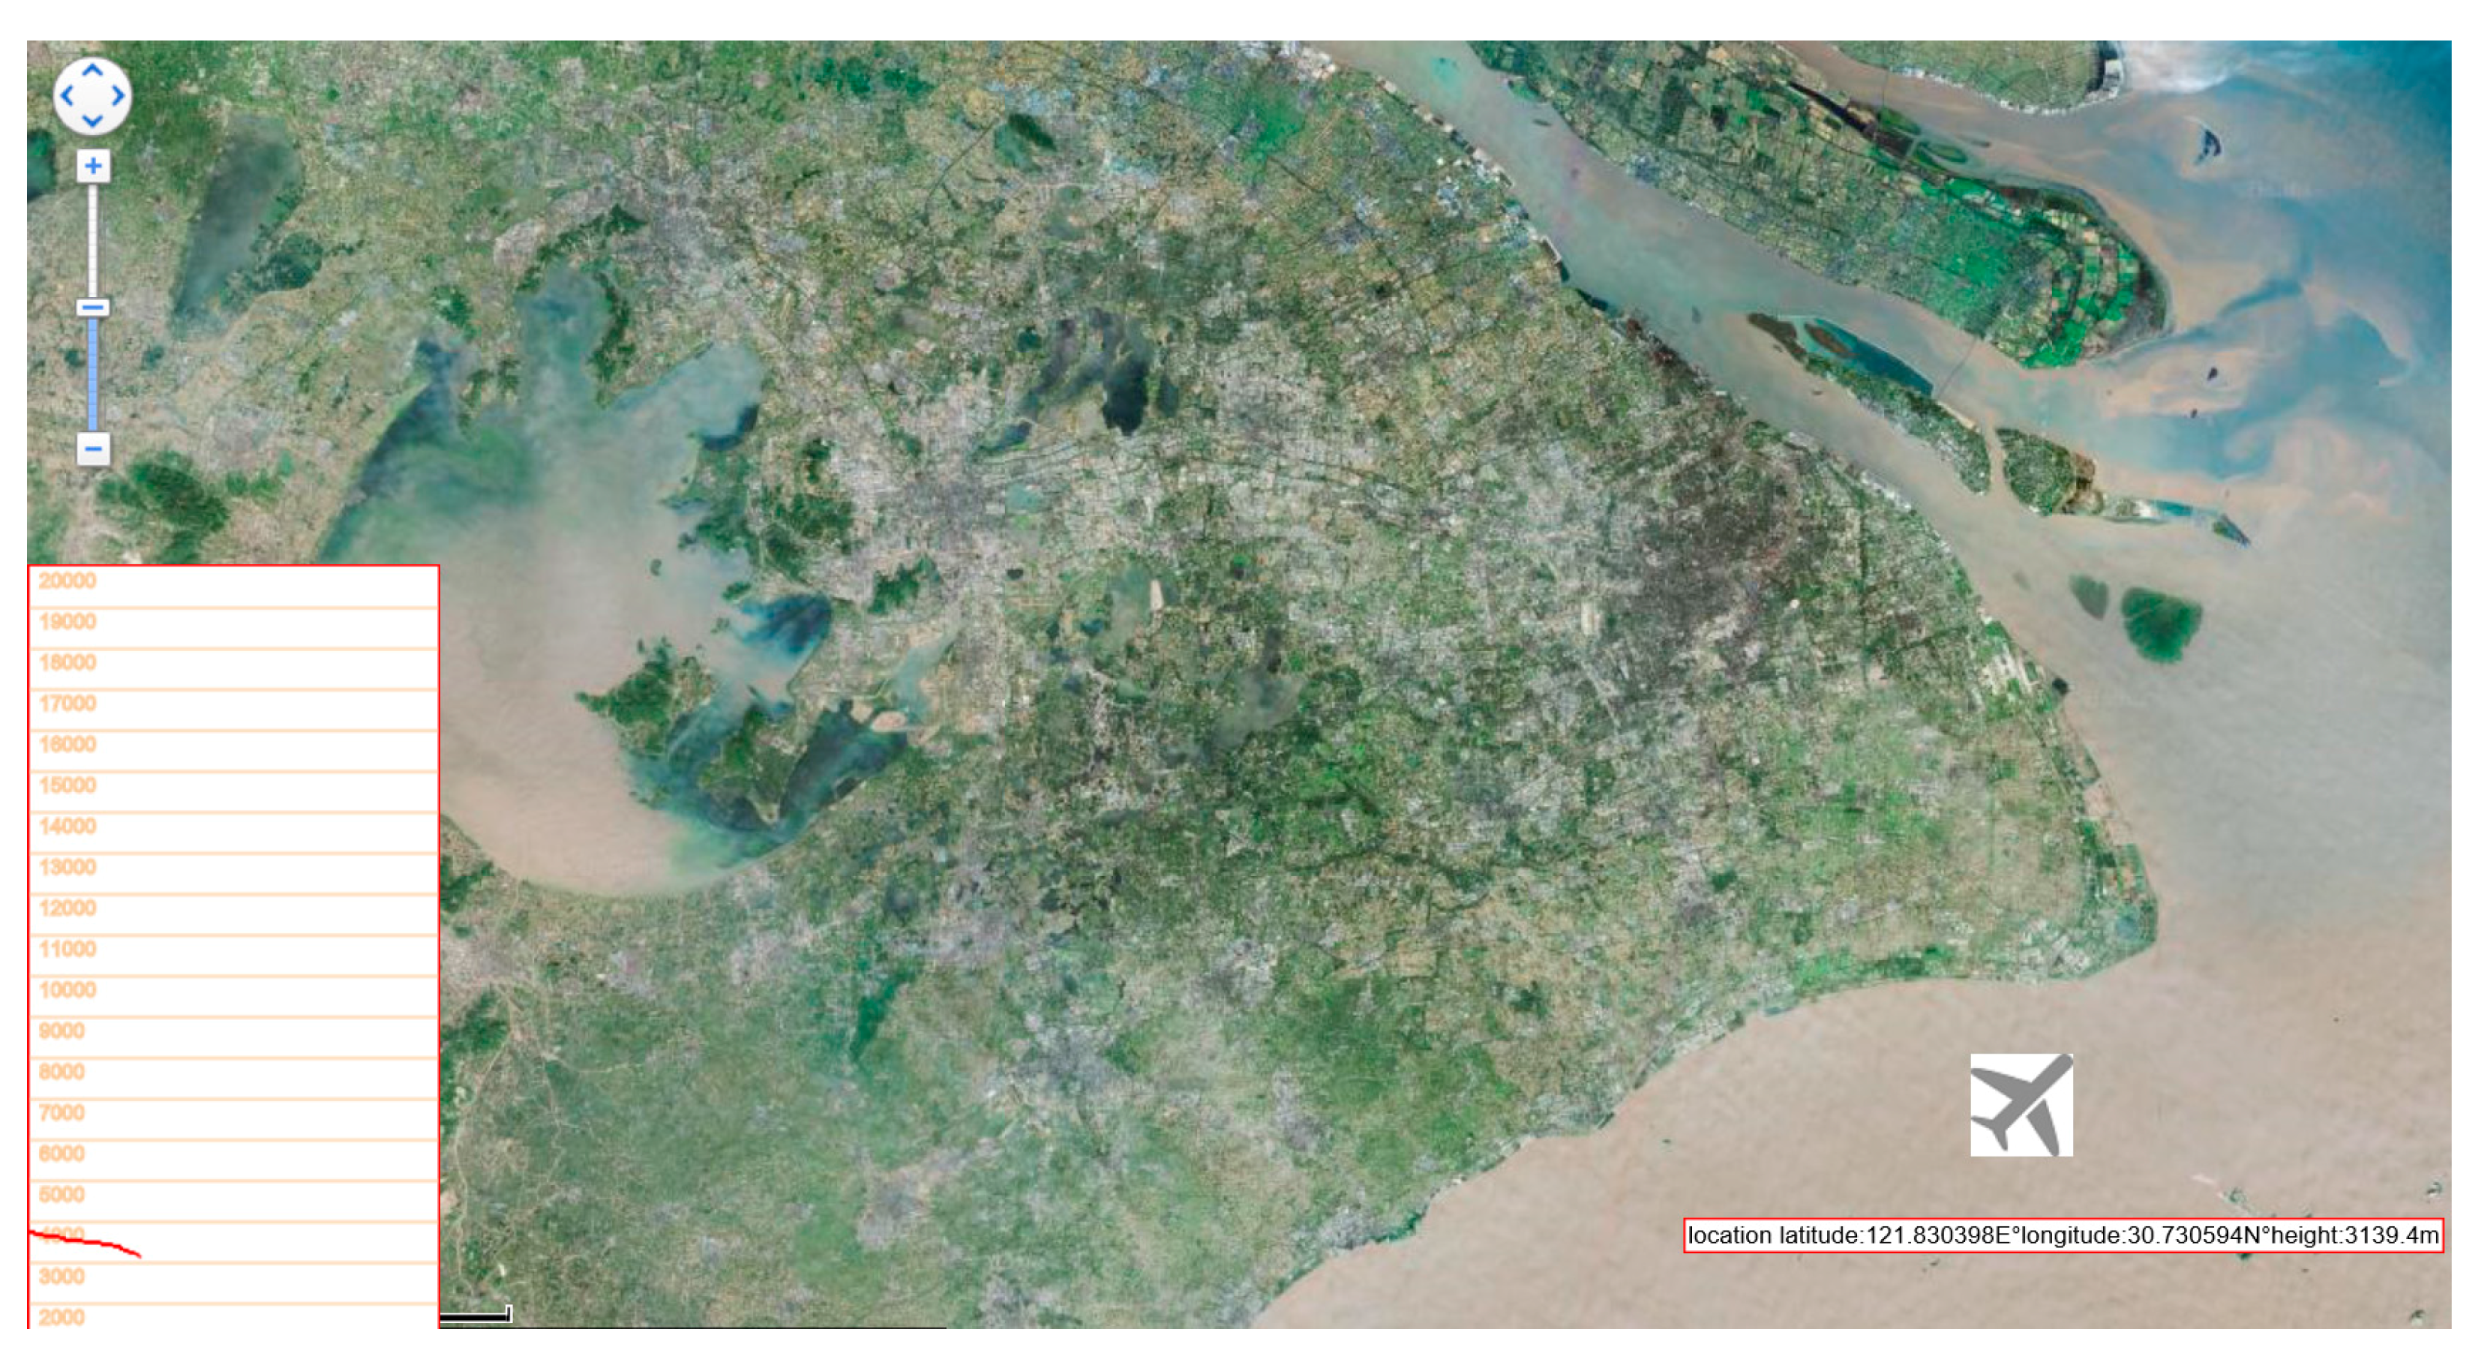
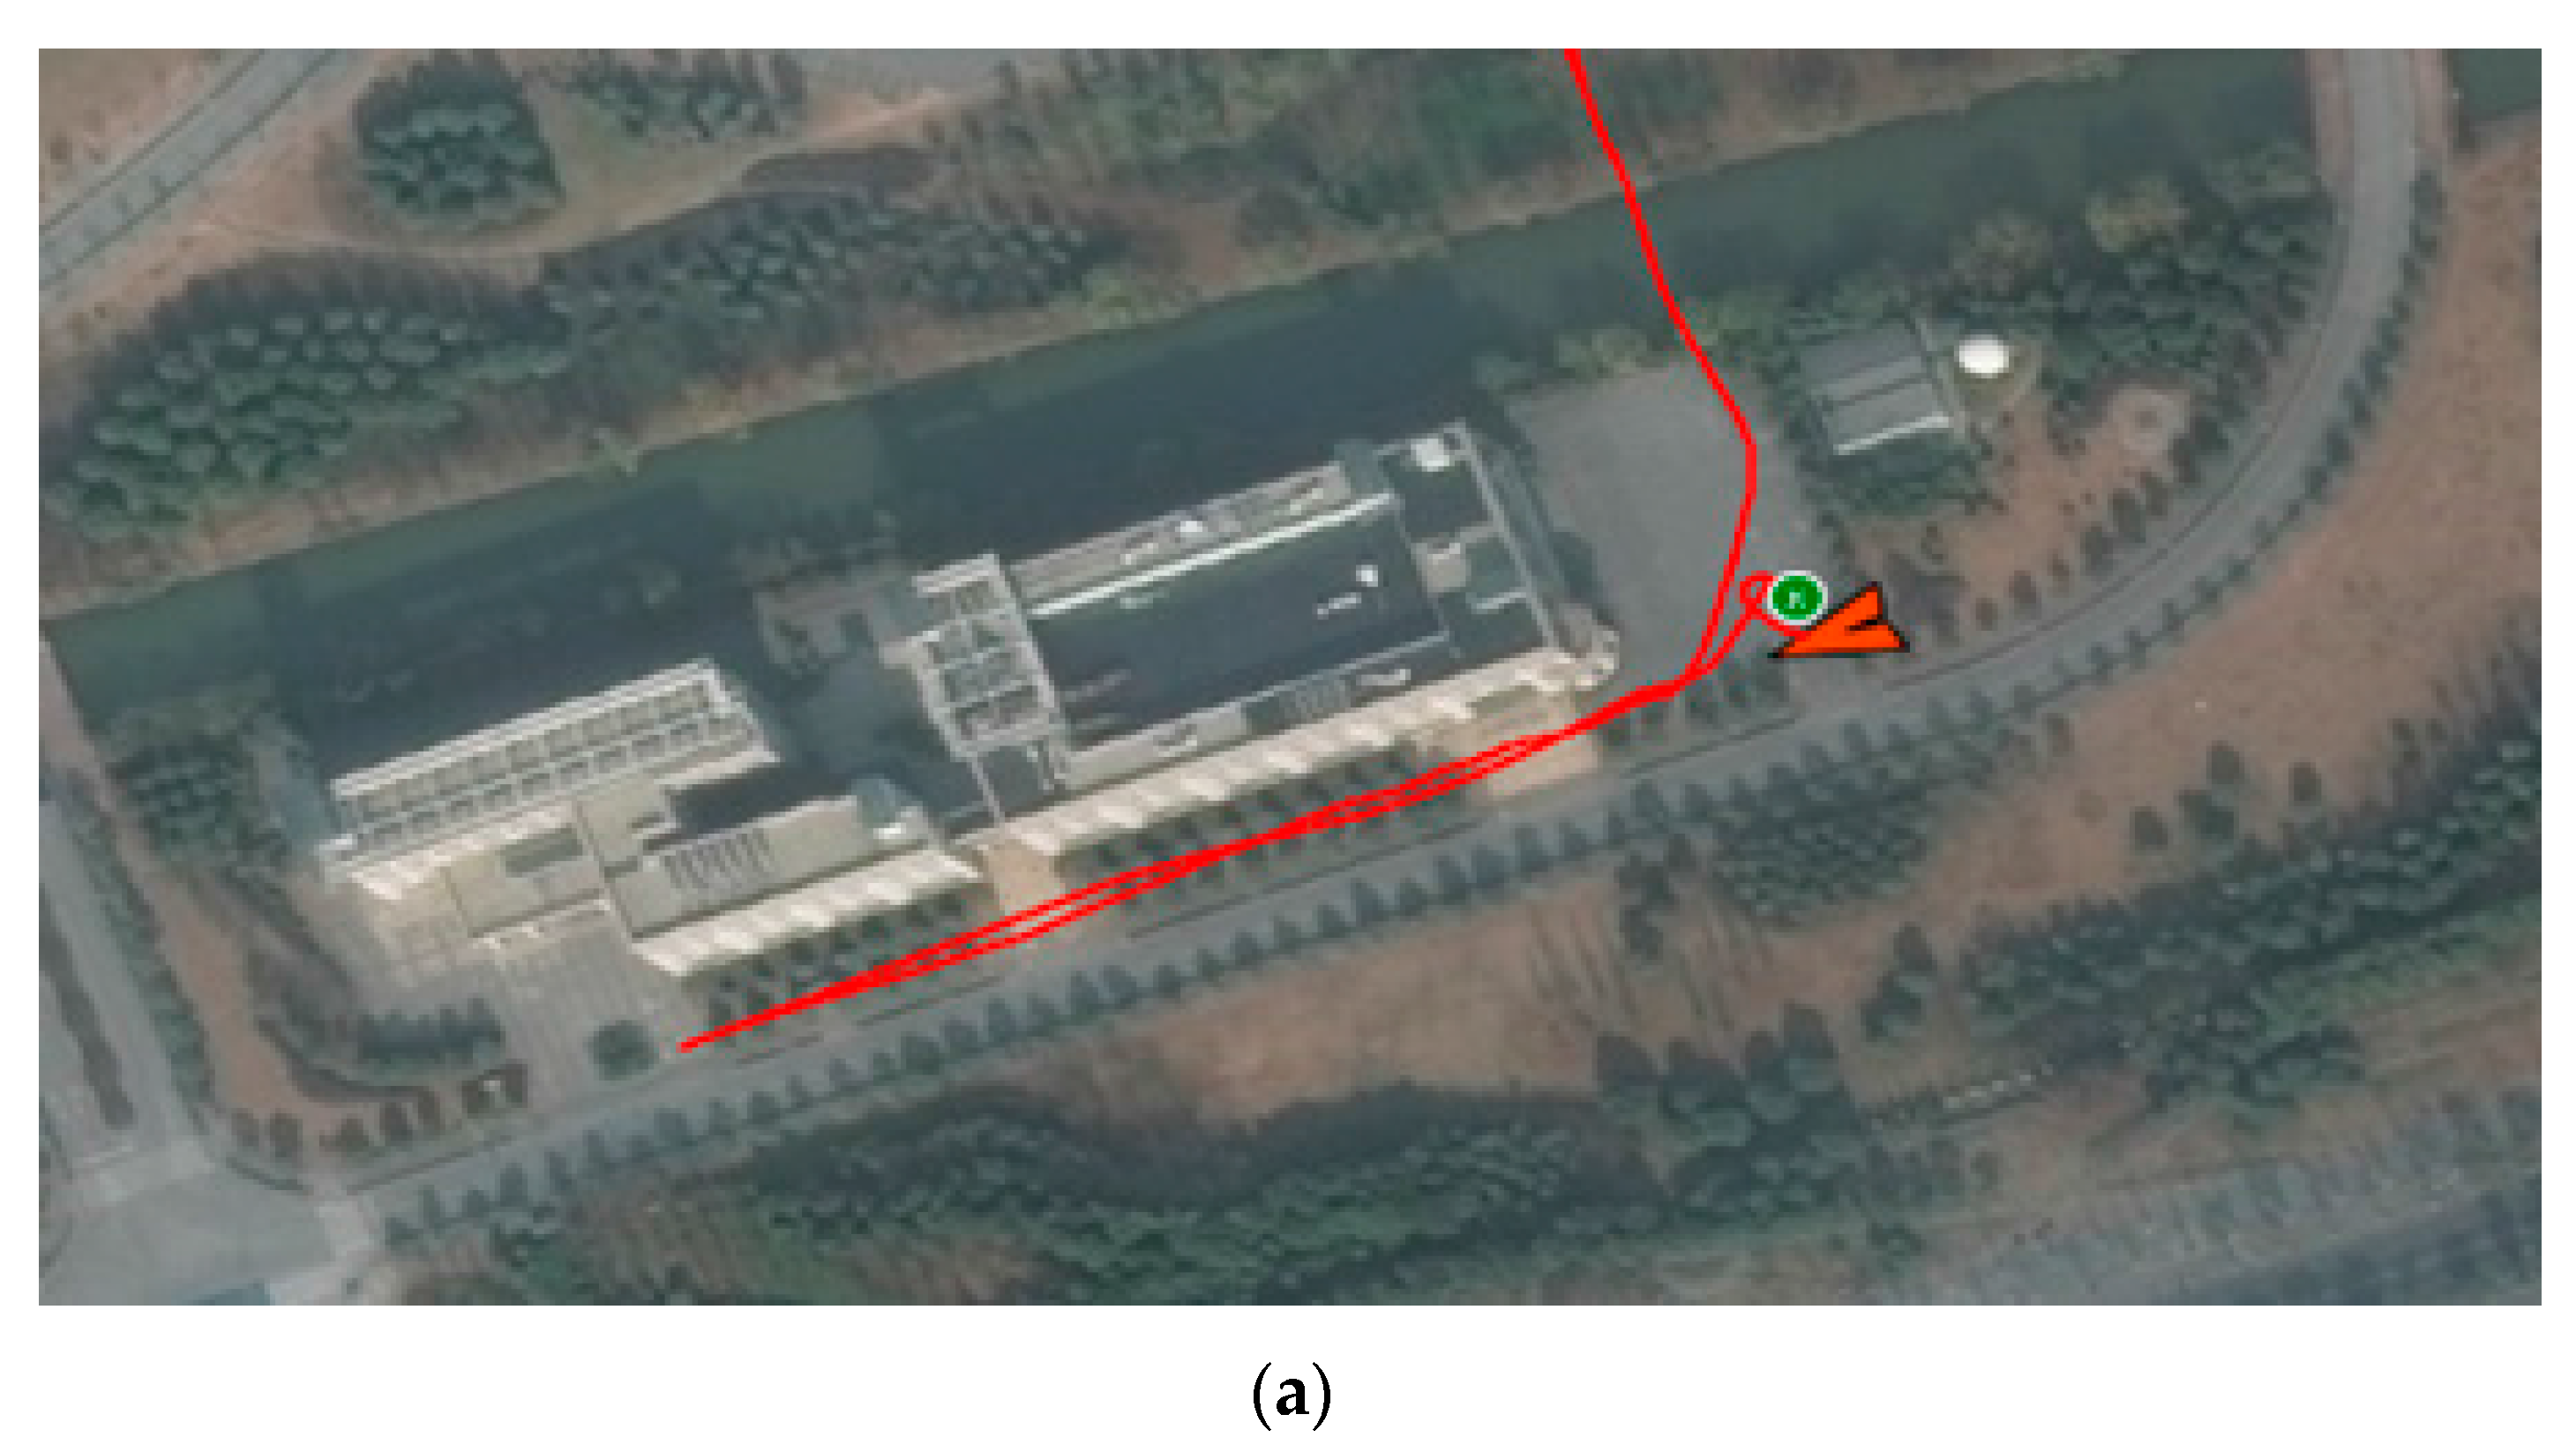
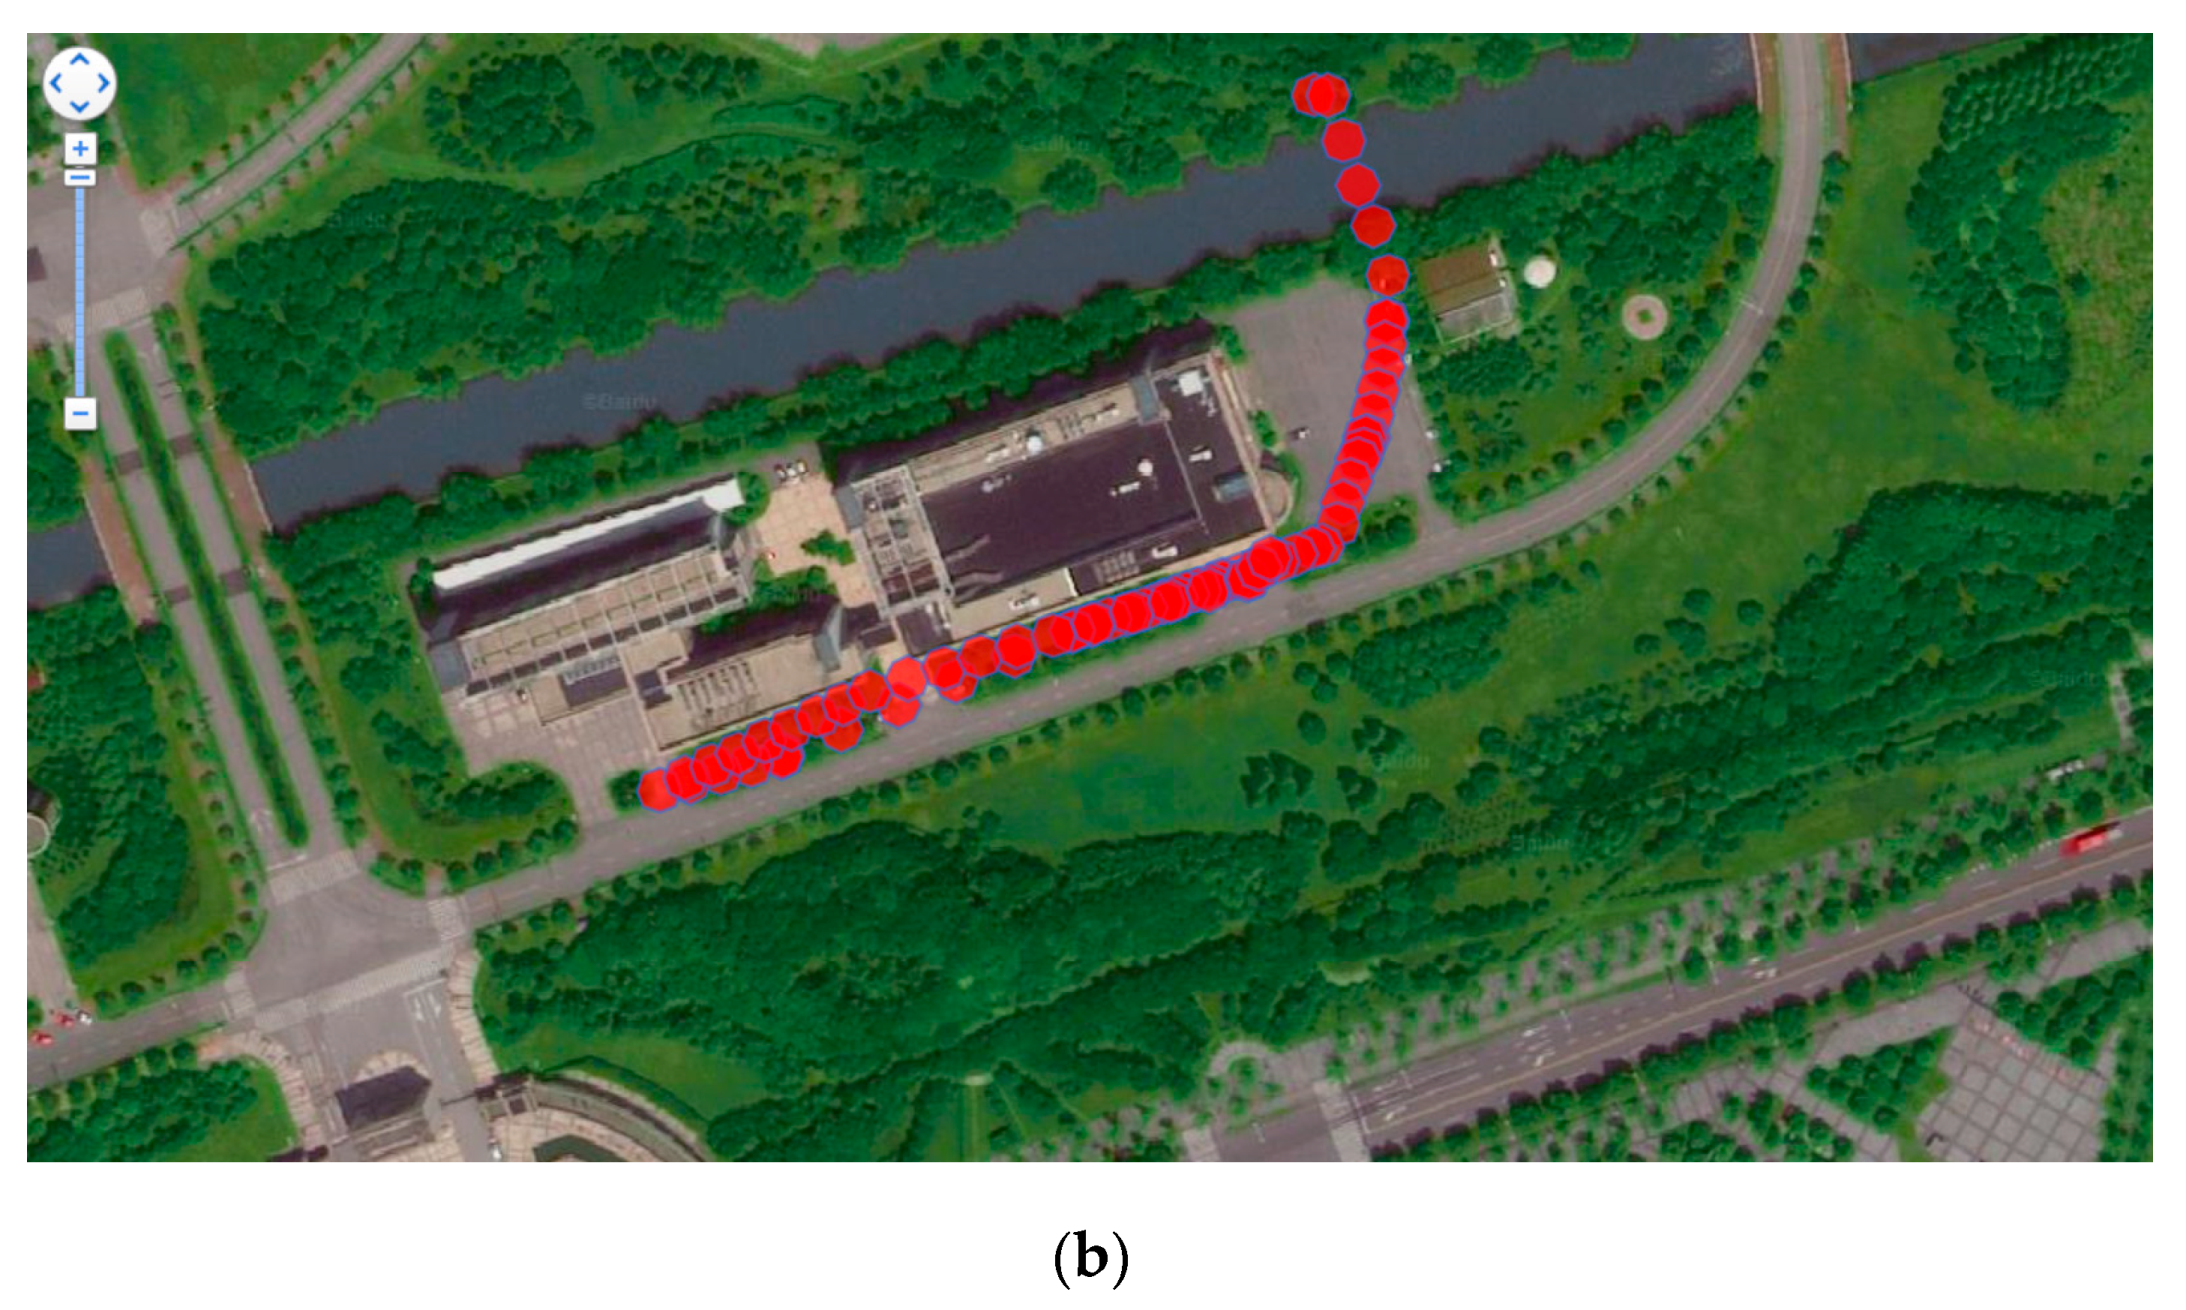
3.2.2. ADS-B Out Data Transmit Based On UAV Platform
4. Conclusions
Acknowledgments
Author Contributions
Conflicts of Interest
References
- Aeronautics, R.T.C.F. Minimum Aviation System Performance Standards for Automatic Dependent Surveillance Broadcast (ADS-B); RTCA-DO-242A; RTCA Incorporated: Washington, DC, USA, 2006. [Google Scholar]
- Aeronautics, R.T.C.F. Minimum Operational Performance Standards for Traffic Alert and Collision Avoidance System II (TCAS II); RTCA-DO-185B; RTCA Incorporated: Washington, DC, USA, 2009. [Google Scholar]
- Kunzi, F. ADS-B Benefits to General Aviation and Barriers to Implementation. Ph.D. Dissertation, Massachusetts Institute of Technology, Cambridge, MA, USA, 2011. [Google Scholar]
- Kuchar, J.; Drumm, A.C. The traffic alert and collision avoidance system. Linc. Lab. J. 2007, 16, 277. [Google Scholar]
- Dai, Z.Y.; Xiao, G.; He, F.; Xie, J.H. An adaptive sampling VB-IMM based on ADS-B for TCAS Data fusion with benefit analysis. J. Aeronaut. Astronaut. Aviat. 2017, 49, 11–24. [Google Scholar]
- Wang, X.G. The Design and Implementation of Air Traffic Control System Based on ADS-B Technology. Master’s Thesis, University of Electronic Science and Technology of China, Chengdu, China, 2014. [Google Scholar]
- Mccallie, D.; Butts, J.; Mills, R. Security analysis of the ADS-B implementation in the next generation air transportation system. Int. J. Crit. Infrastruct. Prot. 2011, 4, 78–87. [Google Scholar] [CrossRef]
- Mueller, K.T.; Krozel, J. Aircraft ADS-B intent verification based on a Kalman tracking filter. In Proceedings of the AIAA Guidance, Navigation and Control Conference, Dever, CO, USA, 14–17 August 2000. [Google Scholar]
- Peng, L.F.; Zhang, C.; Liu, Z.G.; Lin, Y.S. The CPR algorithm of 1090es automatic dependent surveillance—Broadcast (ADS-B) system. J. Civ. Aviat. China 2010, 28, 33–37. [Google Scholar]
- Purton, L.; Abbass, H.; Alam, S. Identification of ADS-B System Vulnerabilities and Threats; Australian Transport Research Forum: Canberra, Australia, 2010; pp. 1–16. [Google Scholar]
- Ni, Y.D.; Ma, Y.S.; Liu, P. Research on ADS-B and TCAS II data fusion algorithm. Comput. Eng. Appl. 2015, 51, 218–221. [Google Scholar]
- Xu, X.J.; He, G.P. Data fusion algorithm of TCAS and ADS-B combined monitoring system based on current statistical model. Telecommun. Technol. 2013, 53, 1154–1157. [Google Scholar]
- Ramasamy, S.; Sabatini, R.; Gardi, A. Avionics sensor fusion for small size unmanned aircraft sense-and-avoid. In Proceedings of the 2014 IEEE Metrology for Aerospace (MetroAeroSpace), Benevento, Italy, 29–30 May 2014; pp. 271–276. [Google Scholar]
- Sabatini, R.; Gardi, A.; Ramasamy, S. A laser obstacle warning and avoidance system for unmanned aircraft sense-and-avoid. Appl. Mech. Mater. 2014, 629, 355. [Google Scholar] [CrossRef]
- Chen, R.H.; Gevorkian, A.; Fung, A.; Chen, W.-Z.; Raska, V. Multi-sensor data integration for autonomous sense and avoid. In Proceedings of the AIAA Infotech@Aerospace Technical Conference, St. Louis, MO, USA, 29–31 March 2011. [Google Scholar]
- Mazor, E.; Averbuch, A.; Bar-Shalom, Y.; Dayan, J. Interacting multiple model methods in target tracking: A survey. IEEE Trans. Aerosp. Electron. Syst. 1998, 34, 103–123. [Google Scholar] [CrossRef]
- Lu, Y.; Liu, C.; Liu, P. An improved tracking method based on data mining in ADS-B for surface surveillance. In Proceedings of the 2012 9th International Conference on Fuzzy Systems and Knowledge Discovery (FSKD), Chongqing, China, 29–31 May 2012; pp. 1466–1470. [Google Scholar]
- Jaakkola, T. 10 tutorial on variational approximation methods. In Advanced Mean Field Methods: Theory and Practice; MIT Press: Cambridge, MA, USA, 2001; p. 129. [Google Scholar]
- Beal, M.J. Variational Algorithms for Approximate Bayesian Inference. Ph.D. Thesis, University of London, London, UK, 2003. [Google Scholar]
- Sarkka, S.; Nummenmaa, A. Recursive noise adaptive kalman filtering by variational bayesian approximations. IEEE Trans. Autom. Control 2009, 54, 596–600. [Google Scholar] [CrossRef]
- Jin, X.-B.; Du, J.-J.; Jia, B. Maneuvering target tracking by adaptive statistics model. J. China Univ. Posts Telecommun. 2013, 20, 108–114. [Google Scholar] [CrossRef]
- Fu, X.; Jia, Y.; Du, J.; Yu, F. New interacting multiple model algorithms for the tracking of the manoeuvring target. IET Control Theory Appl. 2010, 4, 2184–2194. [Google Scholar] [CrossRef]
- Song, G.; Jiang, S.; Lin, L. Information fusion Kalman filter with complex coloured noise for descriptor systems. Chin. J. Sci. Instrum. 2013, 34, 1195–1200. [Google Scholar]
- Zhou, H. Maneuvering Target Tracking; National Defense Industry Press: Beijing, China, 1991; pp. 48–70. [Google Scholar]
- Li, B.; Wang, Z. An improved target tracking algorithm based on the “current” statistical model. J. Proj. Rockets Missiles Guid. 2008, 2, 026. [Google Scholar]
- Mbalawata, I.S.; Särkkä, S.; Vihola, M.; Haario, H. Adaptive metropolis algorithm using variational bayesian adaptive kalman filter. Comput. Stat. Data Anal. 2015, 83, 101–115. [Google Scholar] [CrossRef]
- Bar-Shalom, Y.; Challa, S.; Blom, H.A. Imm estimator versus optimal estimator for hybrid systems. IEEE Trans. Aerosp. Electron. Syst. 2005, 41, 986–991. [Google Scholar] [CrossRef]
- Mallick, M.; La Scala, B.F. IMM estimator for ground target tracking with variable measurement sampling intervals. In Proceedings of the 2006 9th International Conference on Information Fusion, Florence, Italy, 10–13 July 2006; pp. 1–8. [Google Scholar]
- Hempe, D. Airworthiness Approval of Automatic Dependent Surveillance-Broadcast (ADS-B) Out Systems; AC-20-165B; US Department of Transportation Federal Aviation Administration: Washington, DC, USA, 2010.
- Gu, B. The Simulation Algorithm of Civil Aircraft’s Air Traffic Collision Avoidance System. Master’s Thesis, Shanghai Jiaotong University, Shanghai, China, 2012; pp. 41–44. [Google Scholar]


| Horizontal Accuracy Bound | Simulation Sampling Period | |
|---|---|---|
| 0 | EPU ≥ 18.52 km (10 nm) | 1 s |
| 1 | EPU < 18.52 km (10 nm) | 1 s |
| 2 | EPU < 7.408 km (4 nm) | 1 s |
| 3 | EPU < 7.408 km (4 nm) | 1 s |
| 4 | EPU < 1852 m (1 nm) | 1 s |
| 5 | EPU < 926 m (0.5 nm) | 0.8 s |
| 6 | EPU < 926 m (0.5 nm) | 0.6 s |
| 7 | EPU < 185.2 m (0.1 nm) | 0.6 s |
| 8 | EPU < 92.6 m (0.05 nm) | 0.6 s |
| 9 | EPU < 30 m | 0.8 s |
| 10 | EPU < 10 m | 1 s |
| 11 | EPU < 3 m | 1 s |
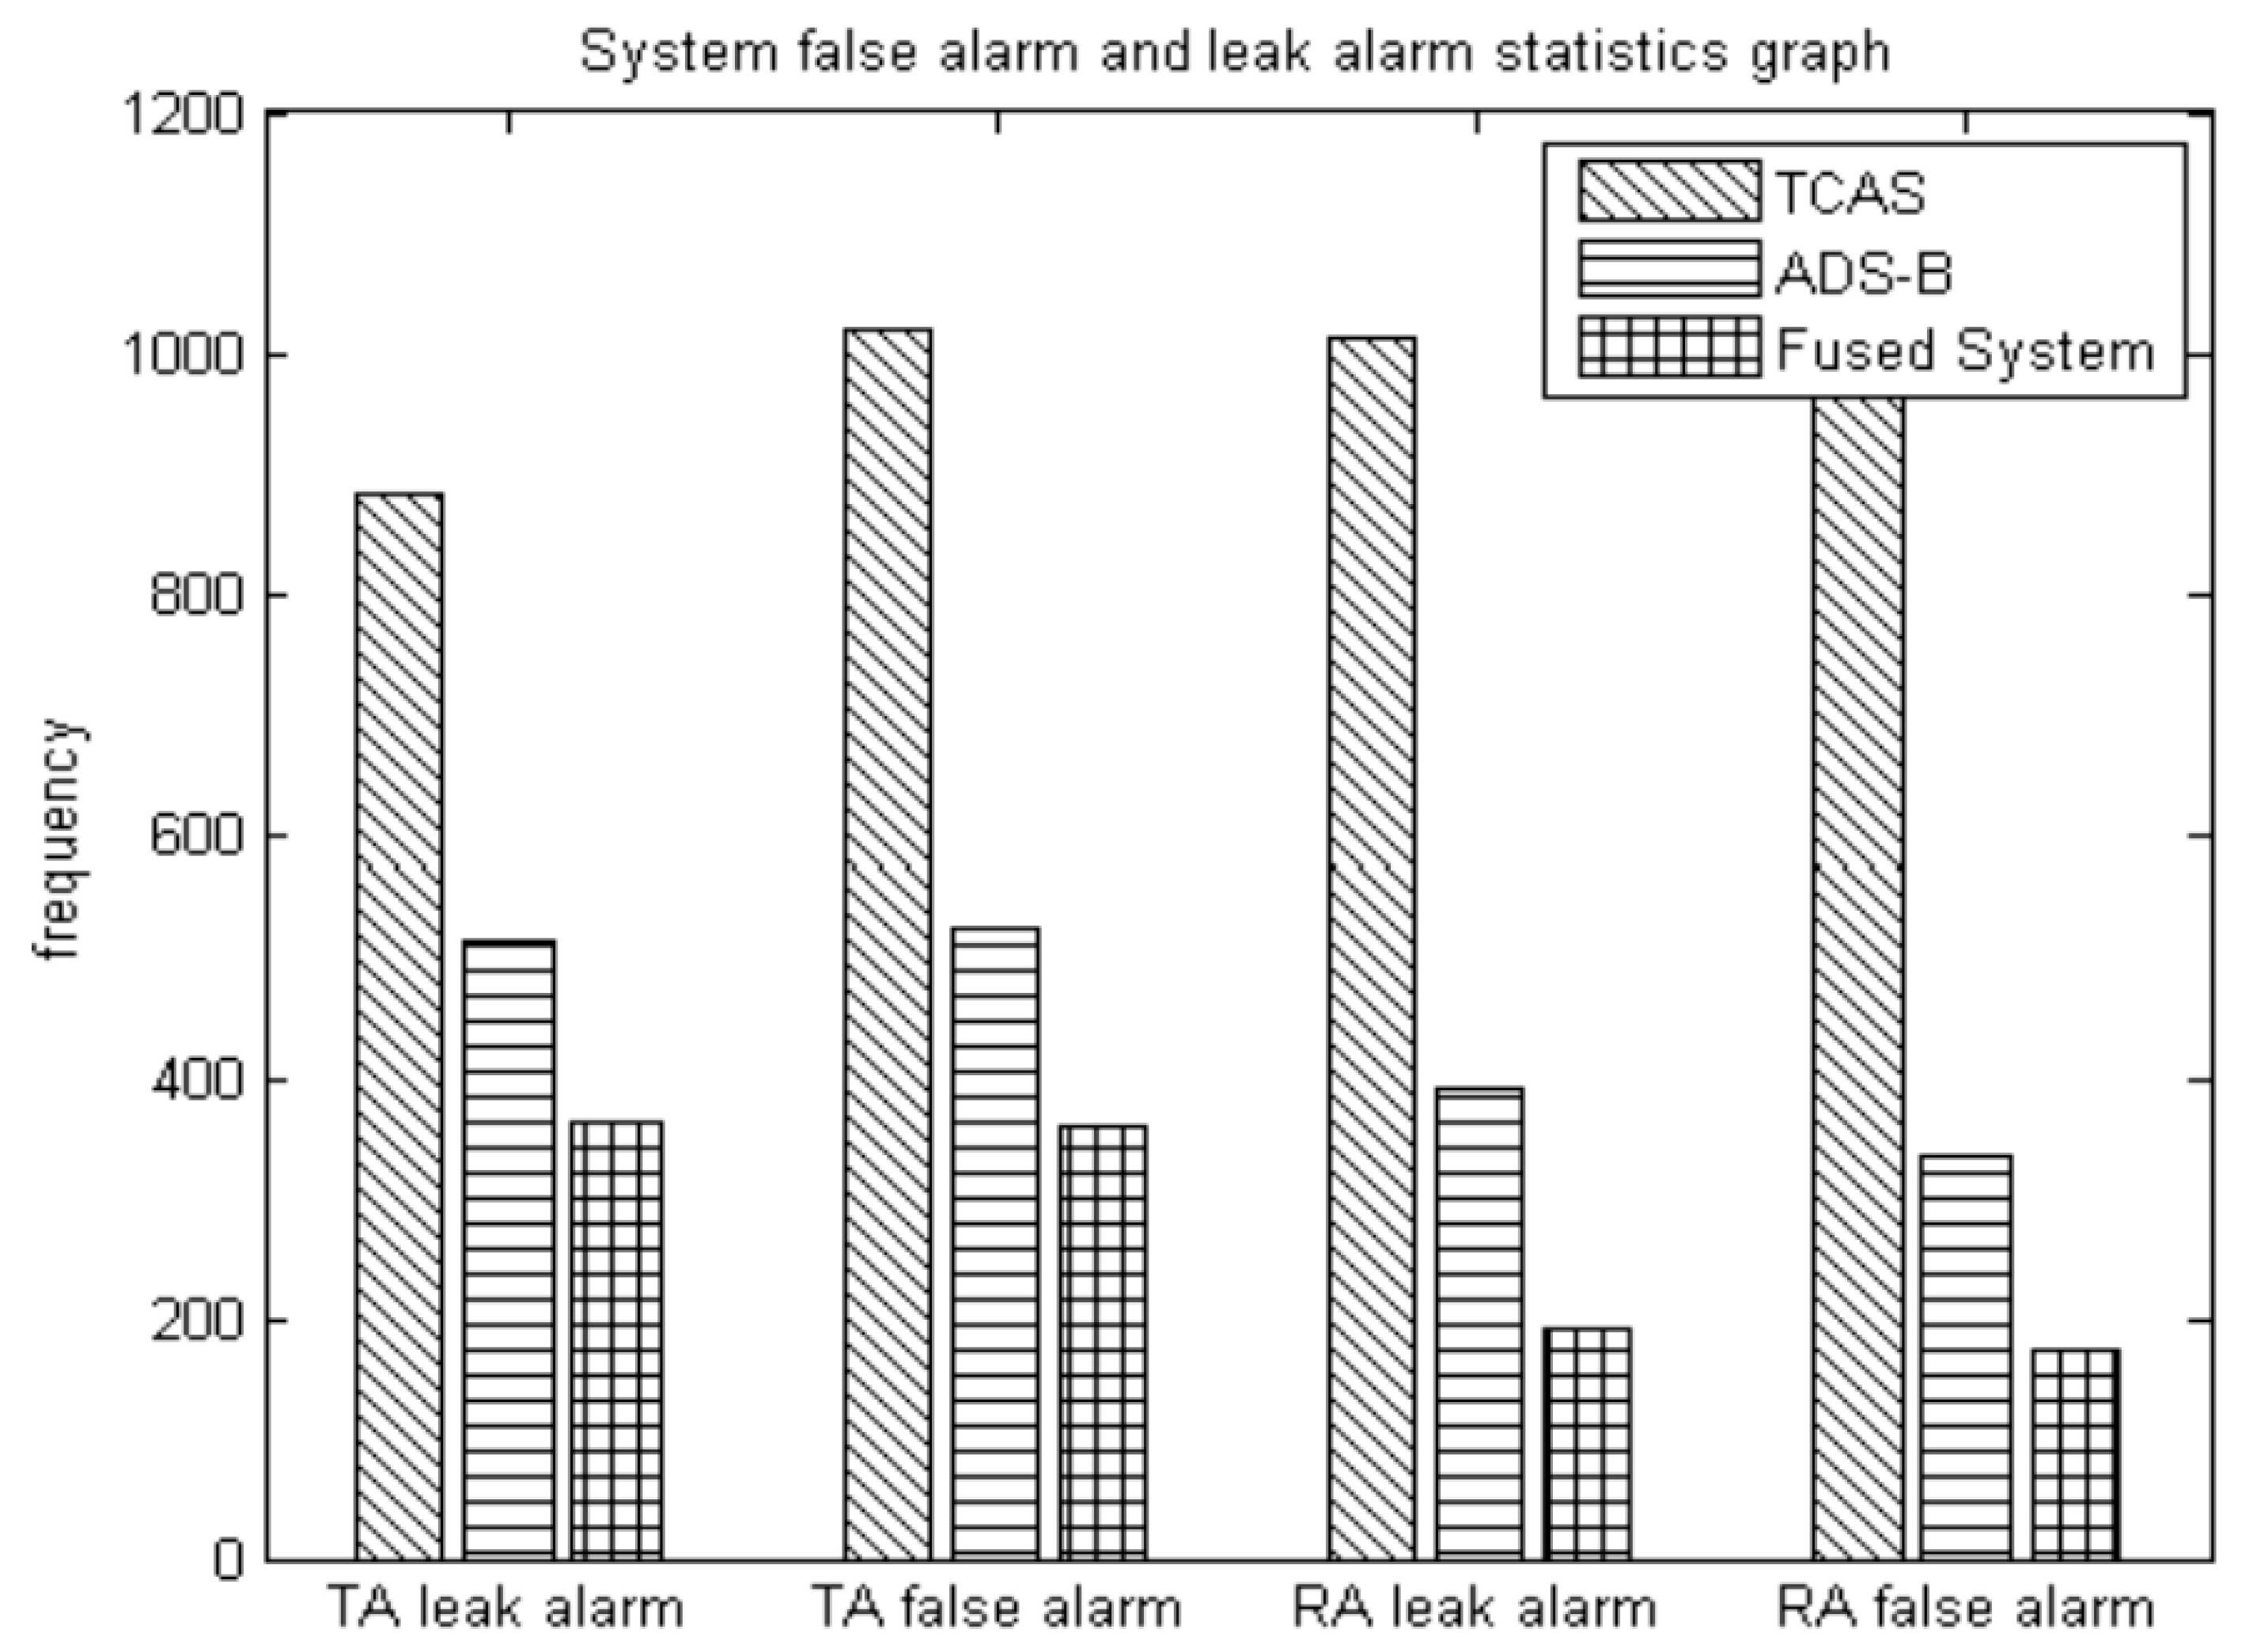
| Alarm Type | System Categories | ||
|---|---|---|---|
| TCAS | ADS-B | Fused System | |
| False alarm (TA) (frequency) | 1018 | 524 | 361 |
| Leak alarm (TA) (frequency) | 883 | 513 | 362 |
| False alarm (RA) (frequency) | 1104 | 334 | 172 |
| Leak alarm (RA) (frequency) | 1014 | 390 | 192 |
| ID | Latitude | Longitude | Altitude | Speed North | Speed West | Speed Vertical |
|---|---|---|---|---|---|---|
| 1 | 31.3268 | 122.629 | 4236.72 | −45.2266 | −312.967 | −1728 |
| 2 | 31.3854 | 122.902 | 6156.96 | −80.2507 | −364.945 | −1216 |
| 3 | 30.4038 | 121.241 | 4899.66 | 321.002 | 34.9823 | 64 |
| 4 | 30.6787 | 121.279 | 4038.6 | 351.002 | 36.9813 | −1408 |
| 5 | 30.1474 | 121.154 | 5212.08 | 308.041 | 163.924 | 0 |
| 6 | 31.0127 | 122.763 | 7734.3 | 26.3675 | 477.98 | 1408 |
| 7 | 31.4885 | 123.445 | 7467.6 | −76.2423 | −351.948 | 64 |
| 8 | 29.8201 | 120.952 | 6454.14 | 355.048 | 191.911 | −192 |
| 9 | 31.4381 | 123.173 | 7132.32 | −82.2482 | −362.944 | −1088 |
| 10 | 31.0003 | 122.692 | 6156.96 | 0.335254 | 421 | 1792 |
| 11 | 30.2619 | 121.207 | 2834.64 | 263.014 | 87.9569 | 1088 |
| 12 | 31.7112 | 119.996 | 5394.96 | −369.053 | 205.905 | −2880 |
| 13 | 29.9003 | 121.456 | 3916.68 | −13.2618 | −336.99 | 1664 |
| 14 | 29.7201 | 122.295 | 8648.7 | −94.3169 | 456.935 | 64 |
| 15 | 31.3854 | 122.902 | 6156.96 | −80.2507 | −364.945 | −1216 |
© 2017 by the authors. Licensee MDPI, Basel, Switzerland. This article is an open access article distributed under the terms and conditions of the Creative Commons Attribution (CC BY) license (http://creativecommons.org/licenses/by/4.0/).
Share and Cite
Wang, Y.; Xiao, G.; Dai, Z. Integrated Display and Simulation for Automatic Dependent Surveillance–Broadcast and Traffic Collision Avoidance System Data Fusion. Sensors 2017, 17, 2611. https://doi.org/10.3390/s17112611
Wang Y, Xiao G, Dai Z. Integrated Display and Simulation for Automatic Dependent Surveillance–Broadcast and Traffic Collision Avoidance System Data Fusion. Sensors. 2017; 17(11):2611. https://doi.org/10.3390/s17112611
Chicago/Turabian StyleWang, Yanran, Gang Xiao, and Zhouyun Dai. 2017. "Integrated Display and Simulation for Automatic Dependent Surveillance–Broadcast and Traffic Collision Avoidance System Data Fusion" Sensors 17, no. 11: 2611. https://doi.org/10.3390/s17112611
APA StyleWang, Y., Xiao, G., & Dai, Z. (2017). Integrated Display and Simulation for Automatic Dependent Surveillance–Broadcast and Traffic Collision Avoidance System Data Fusion. Sensors, 17(11), 2611. https://doi.org/10.3390/s17112611