All-Solid-State Sodium-Selective Electrode with a Solid Contact of Chitosan/Prussian Blue Nanocomposite


Abstract
:
1. Introduction
2. Materials and Methods
2.1. Reagents and Instruments
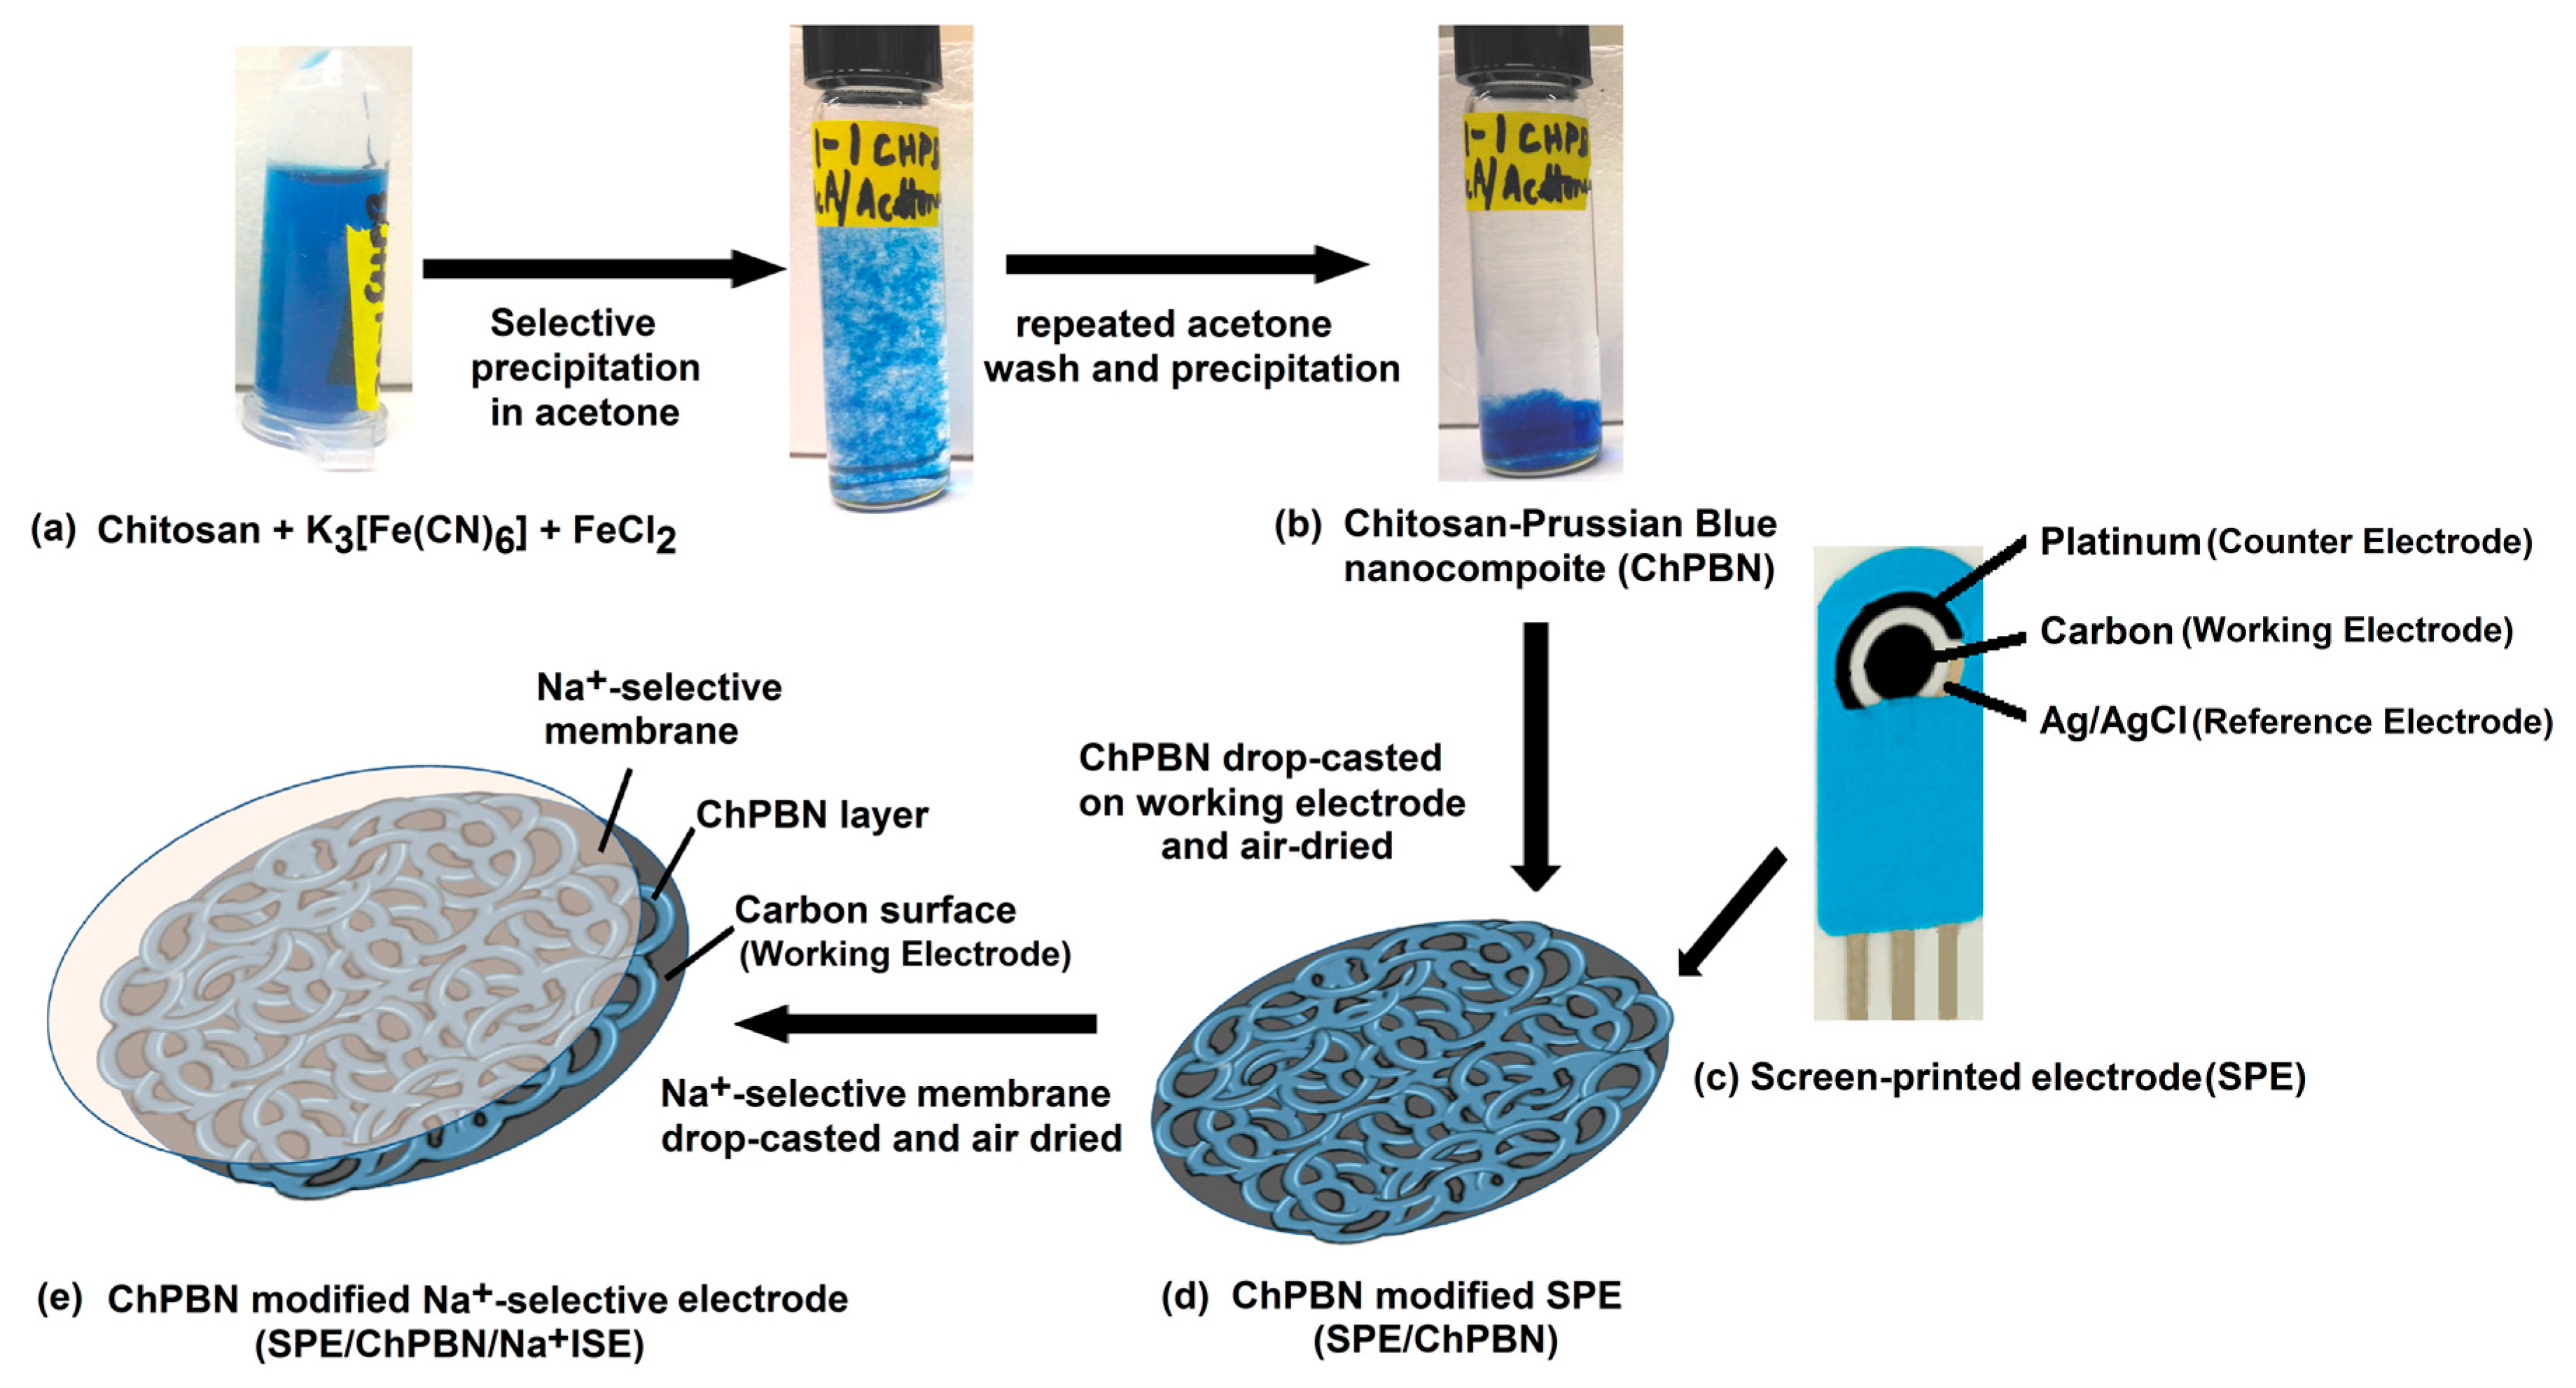
2.2. Synthesis of Chitosan-Prussian Blue Nanocomposite
2.3. Preparation of Solid State-Na+ Ion-Selective Electrode
3. Results and Discussion
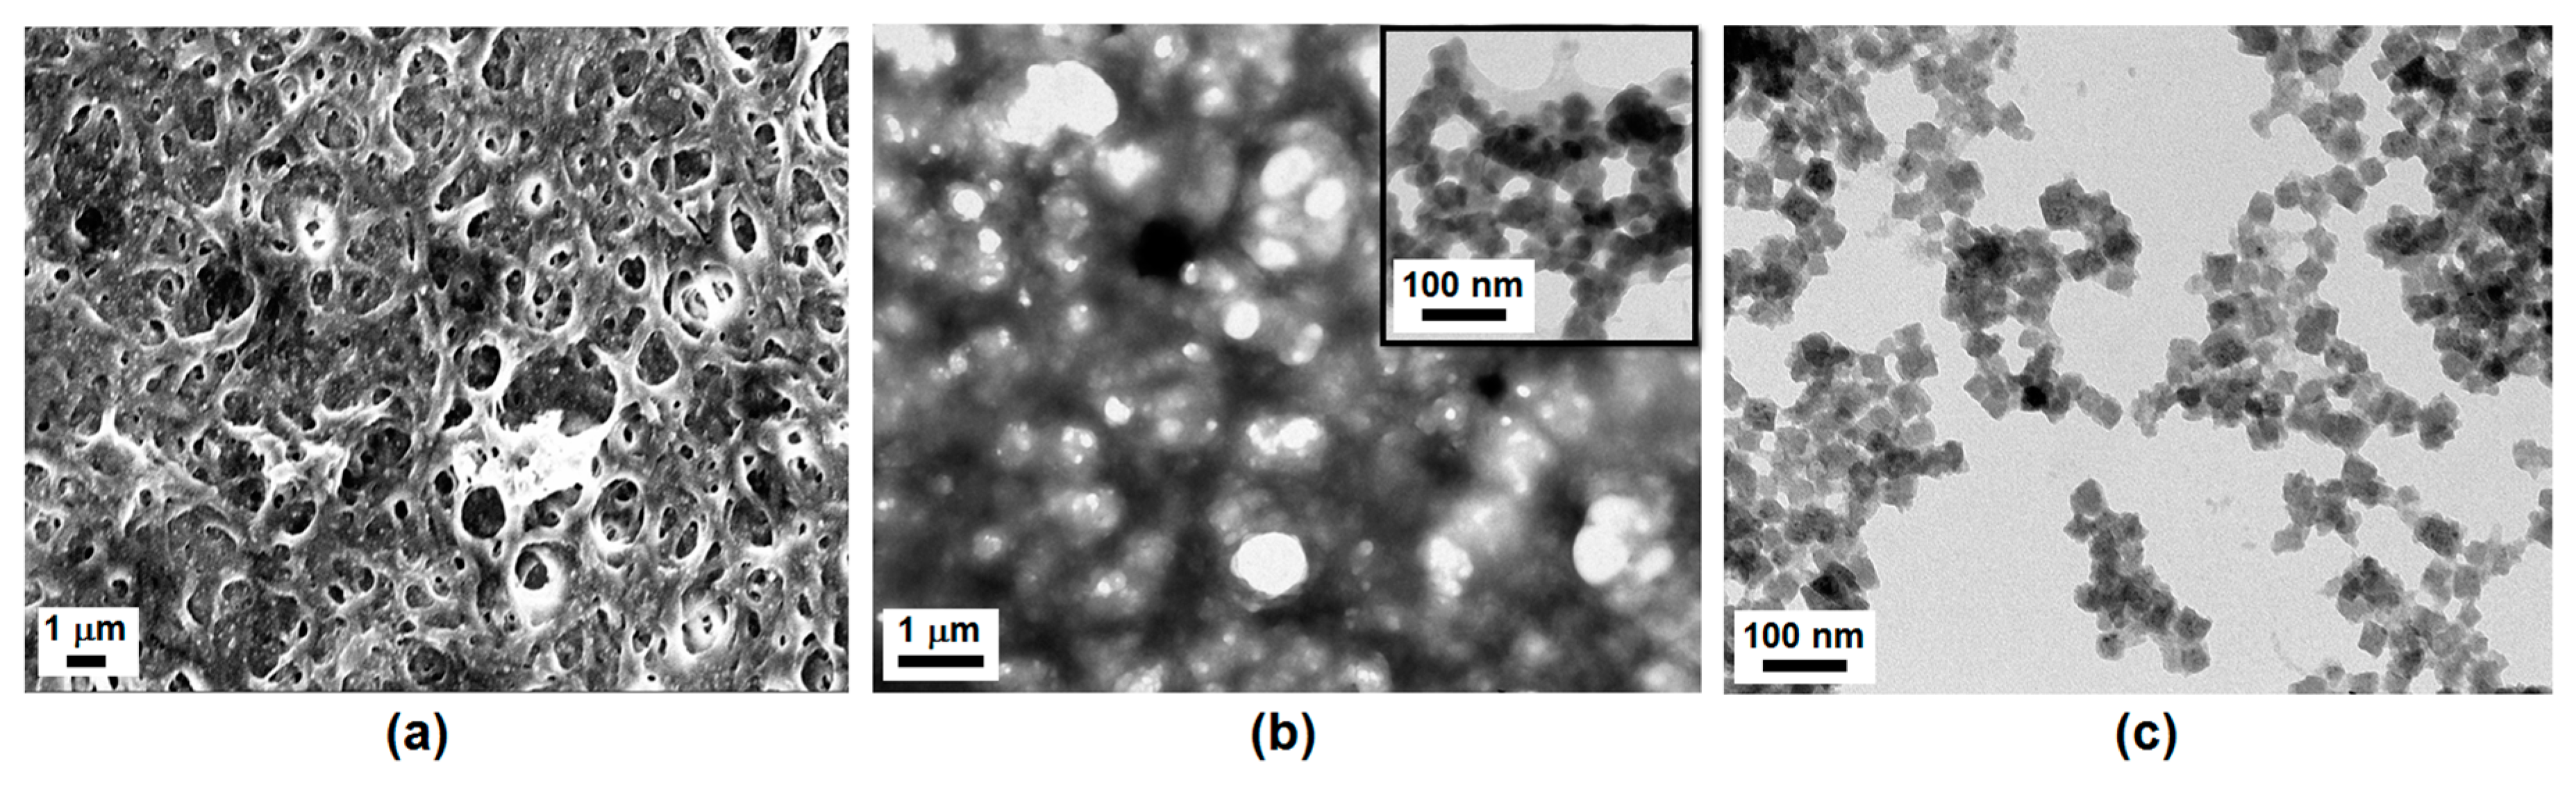
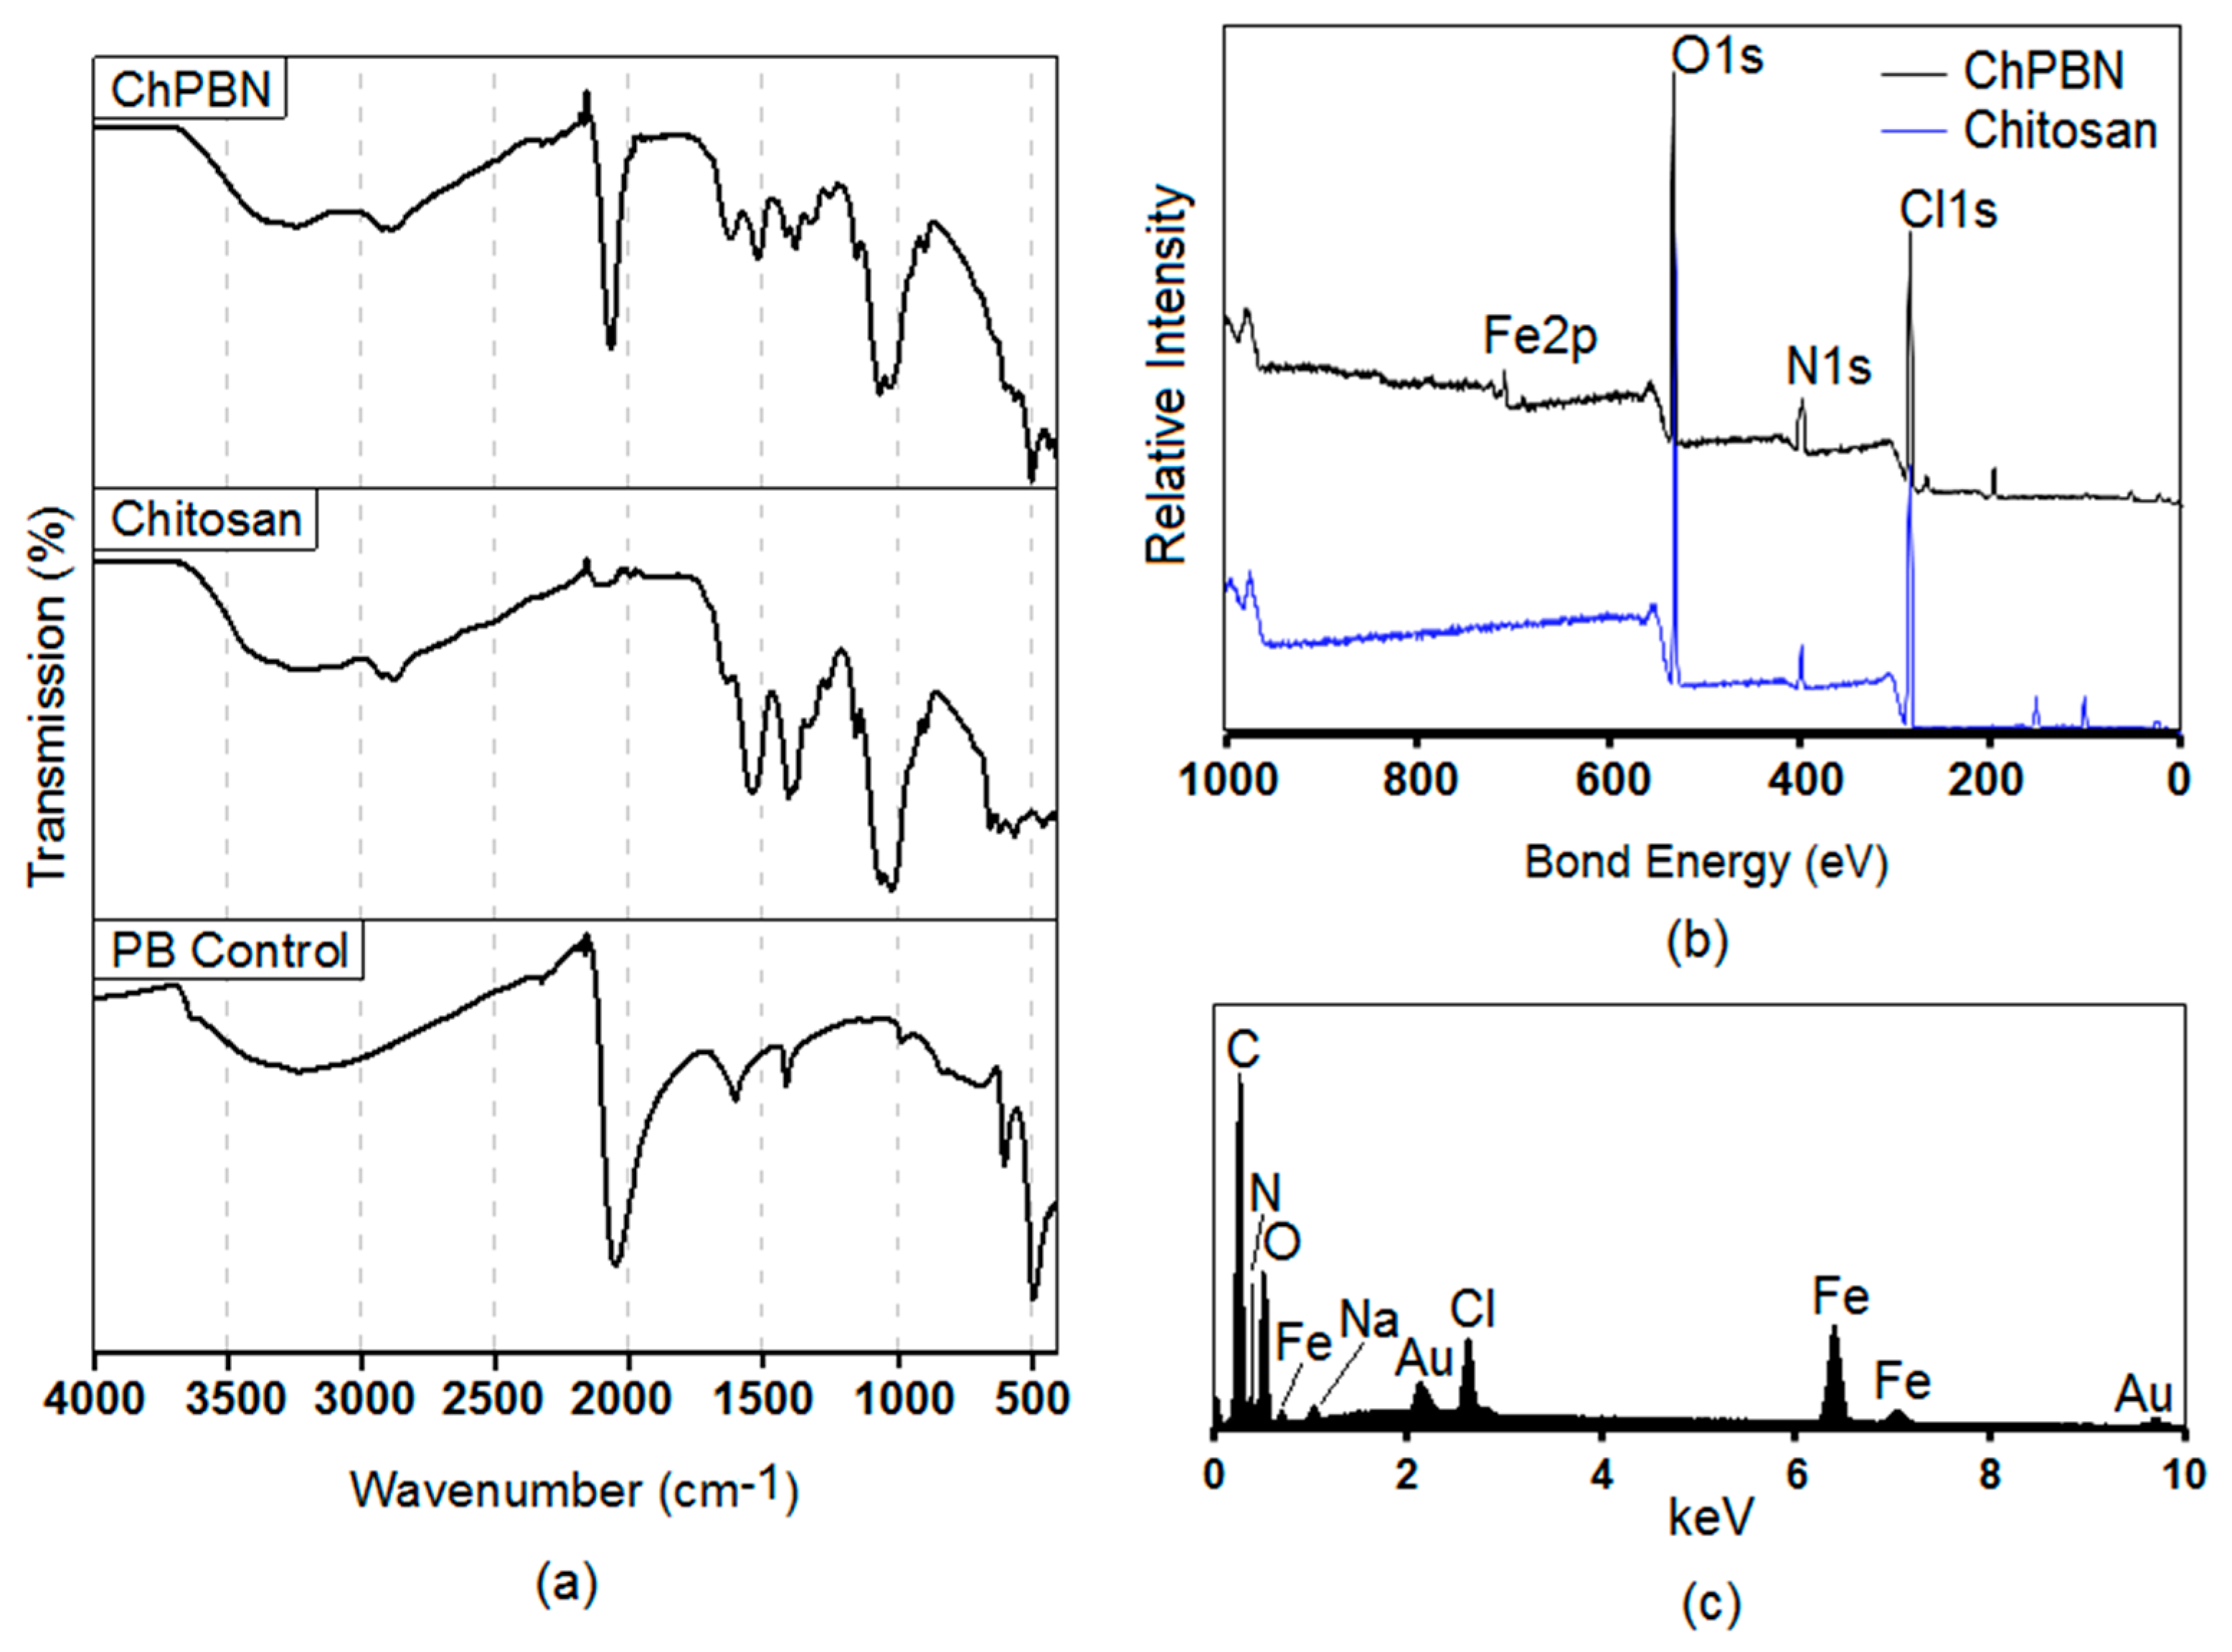
3.1. Characterization of ChPBN
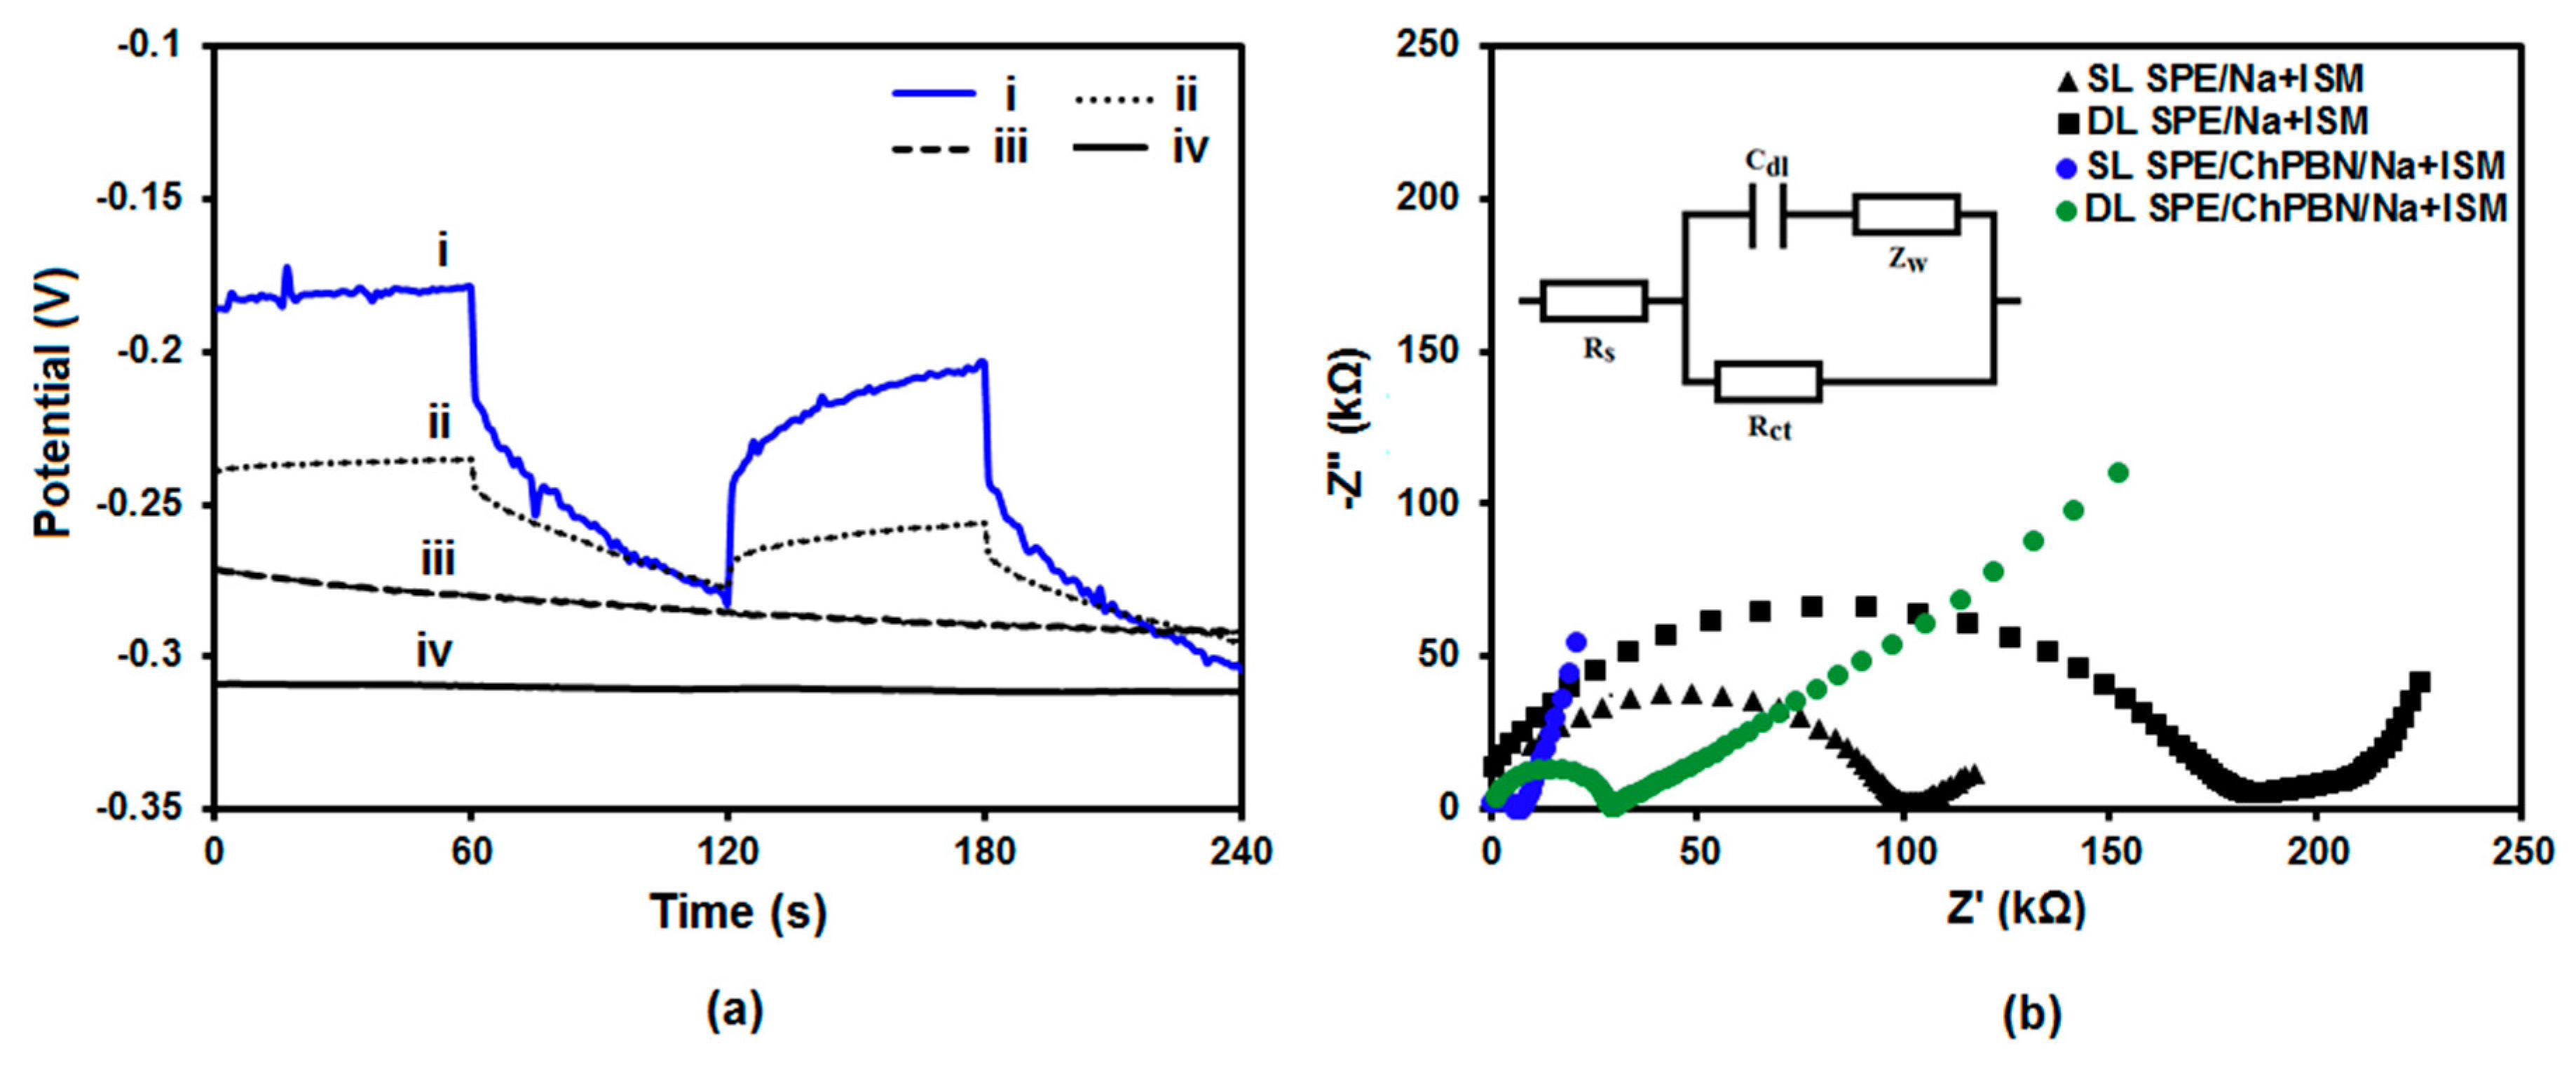
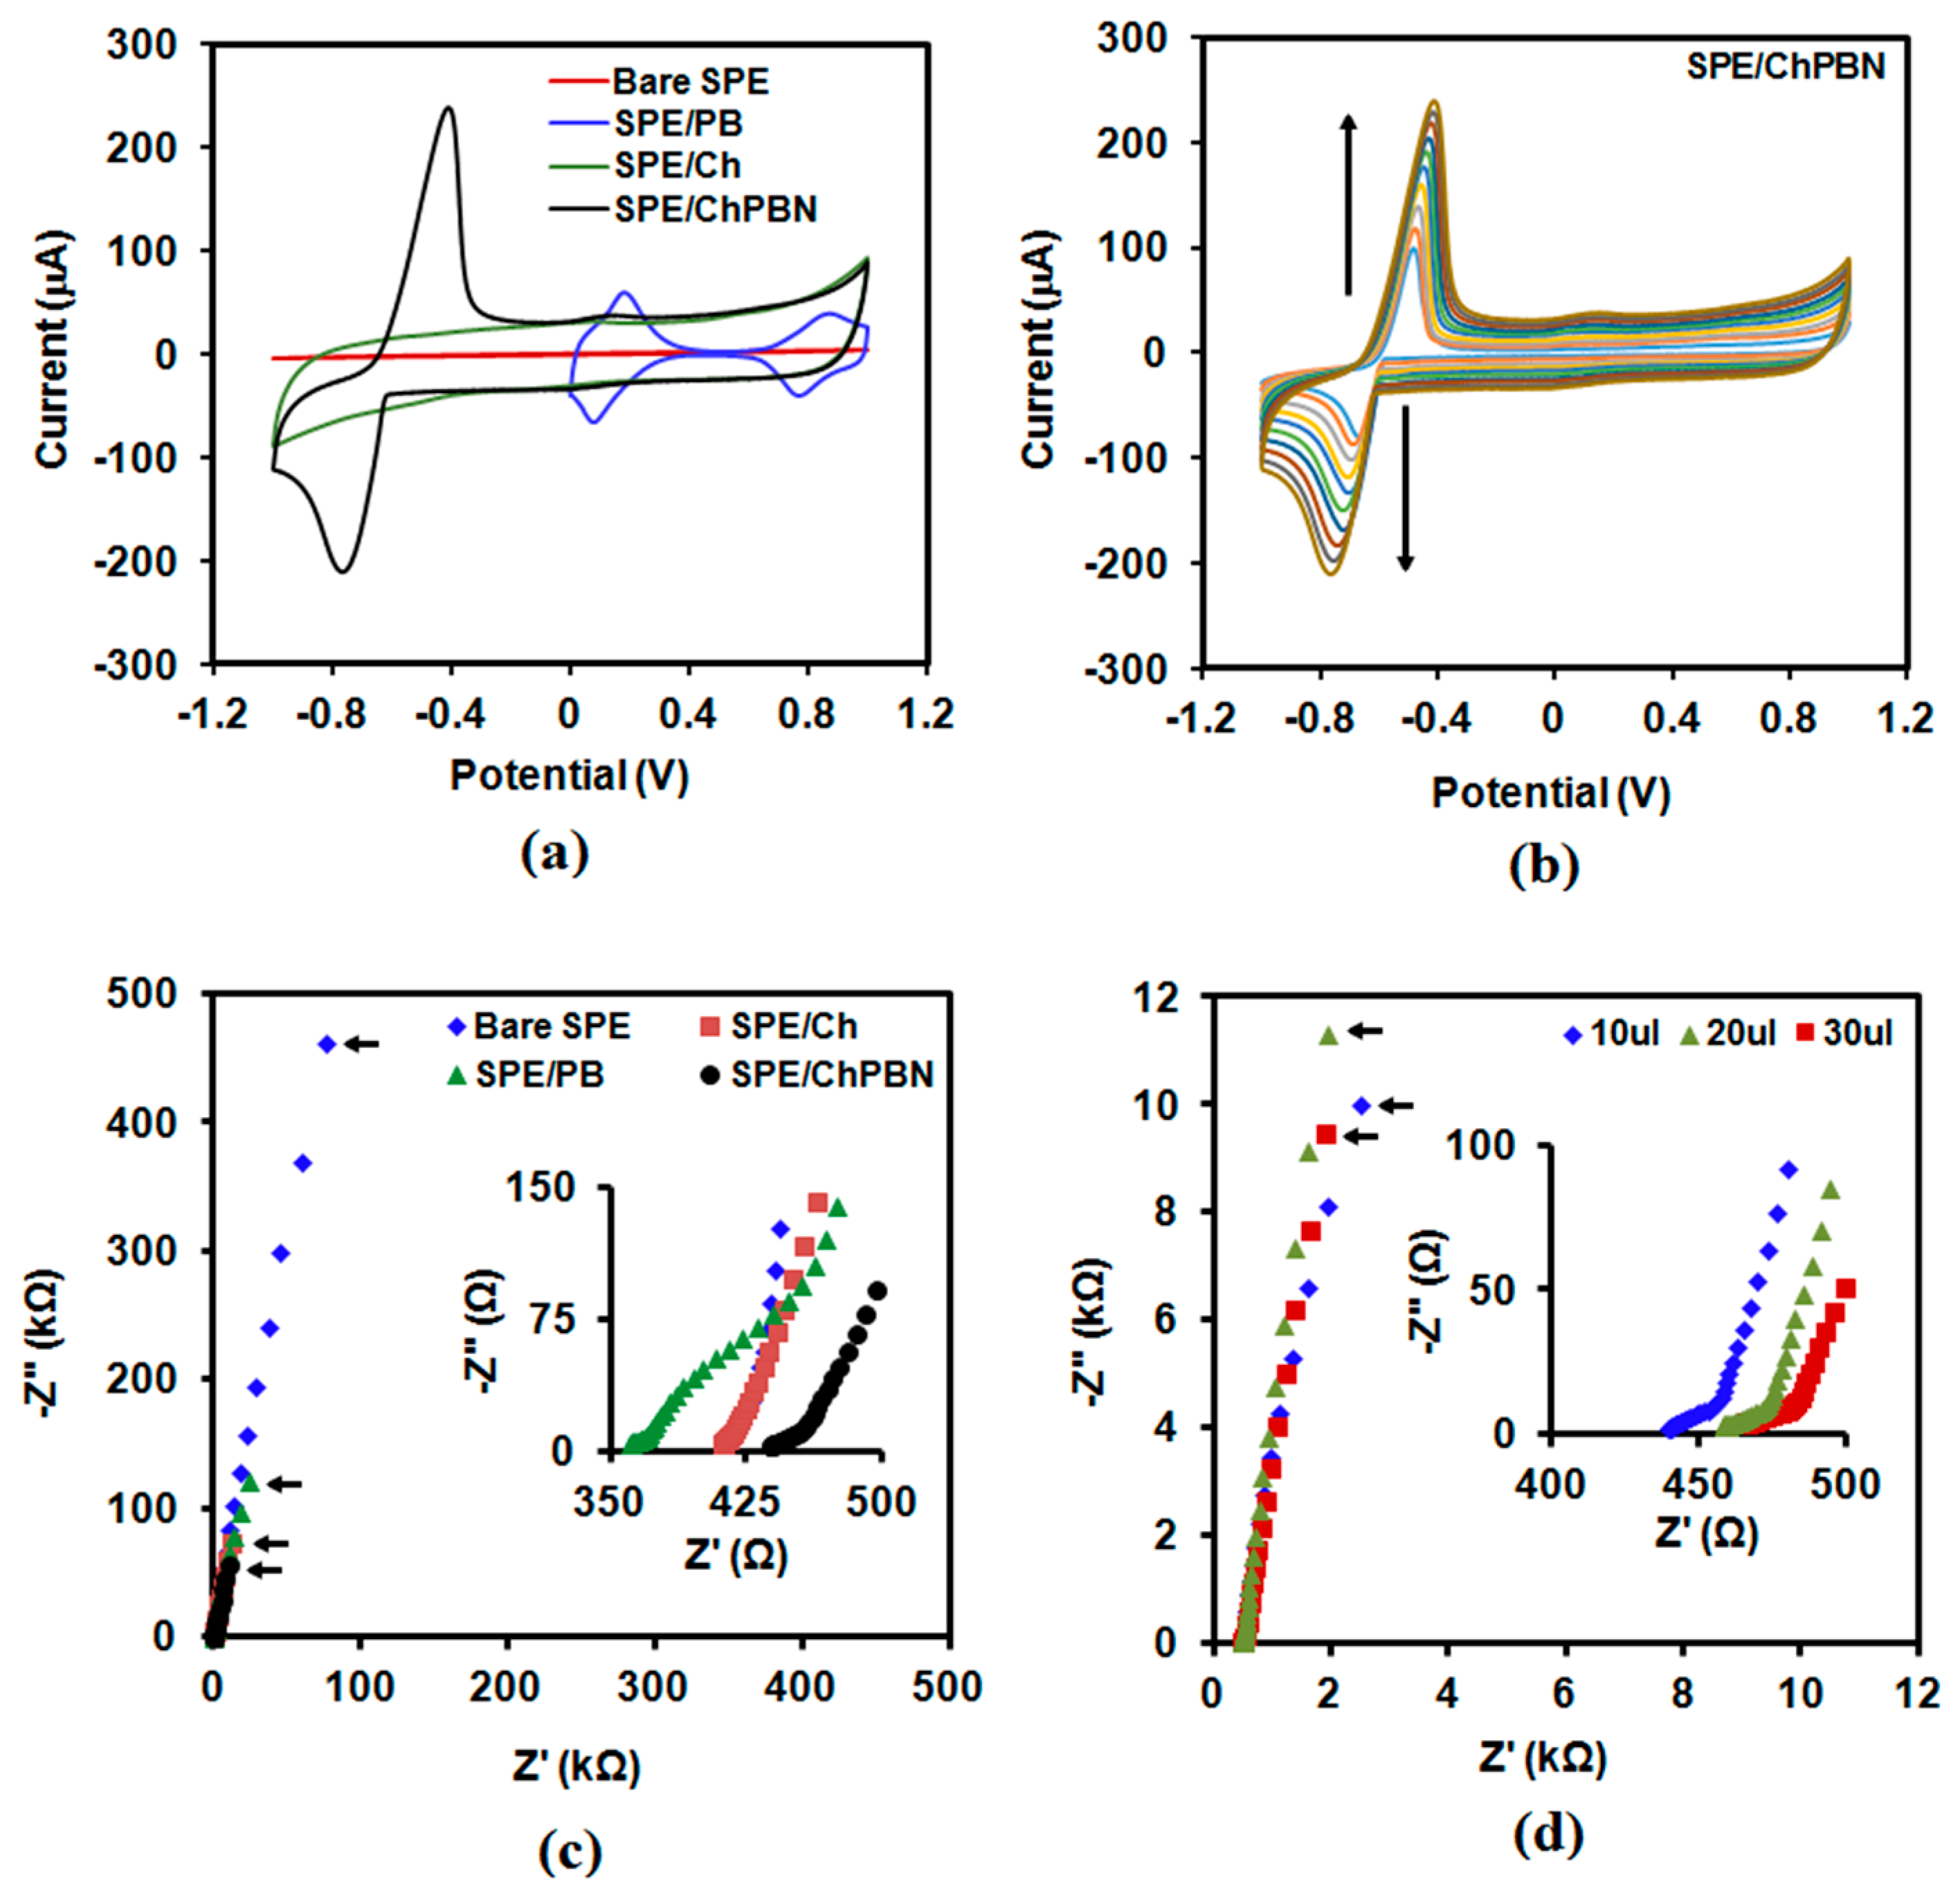
3.2. Electrochemical Characterization of Electrodes with ChPBN Solid Contact
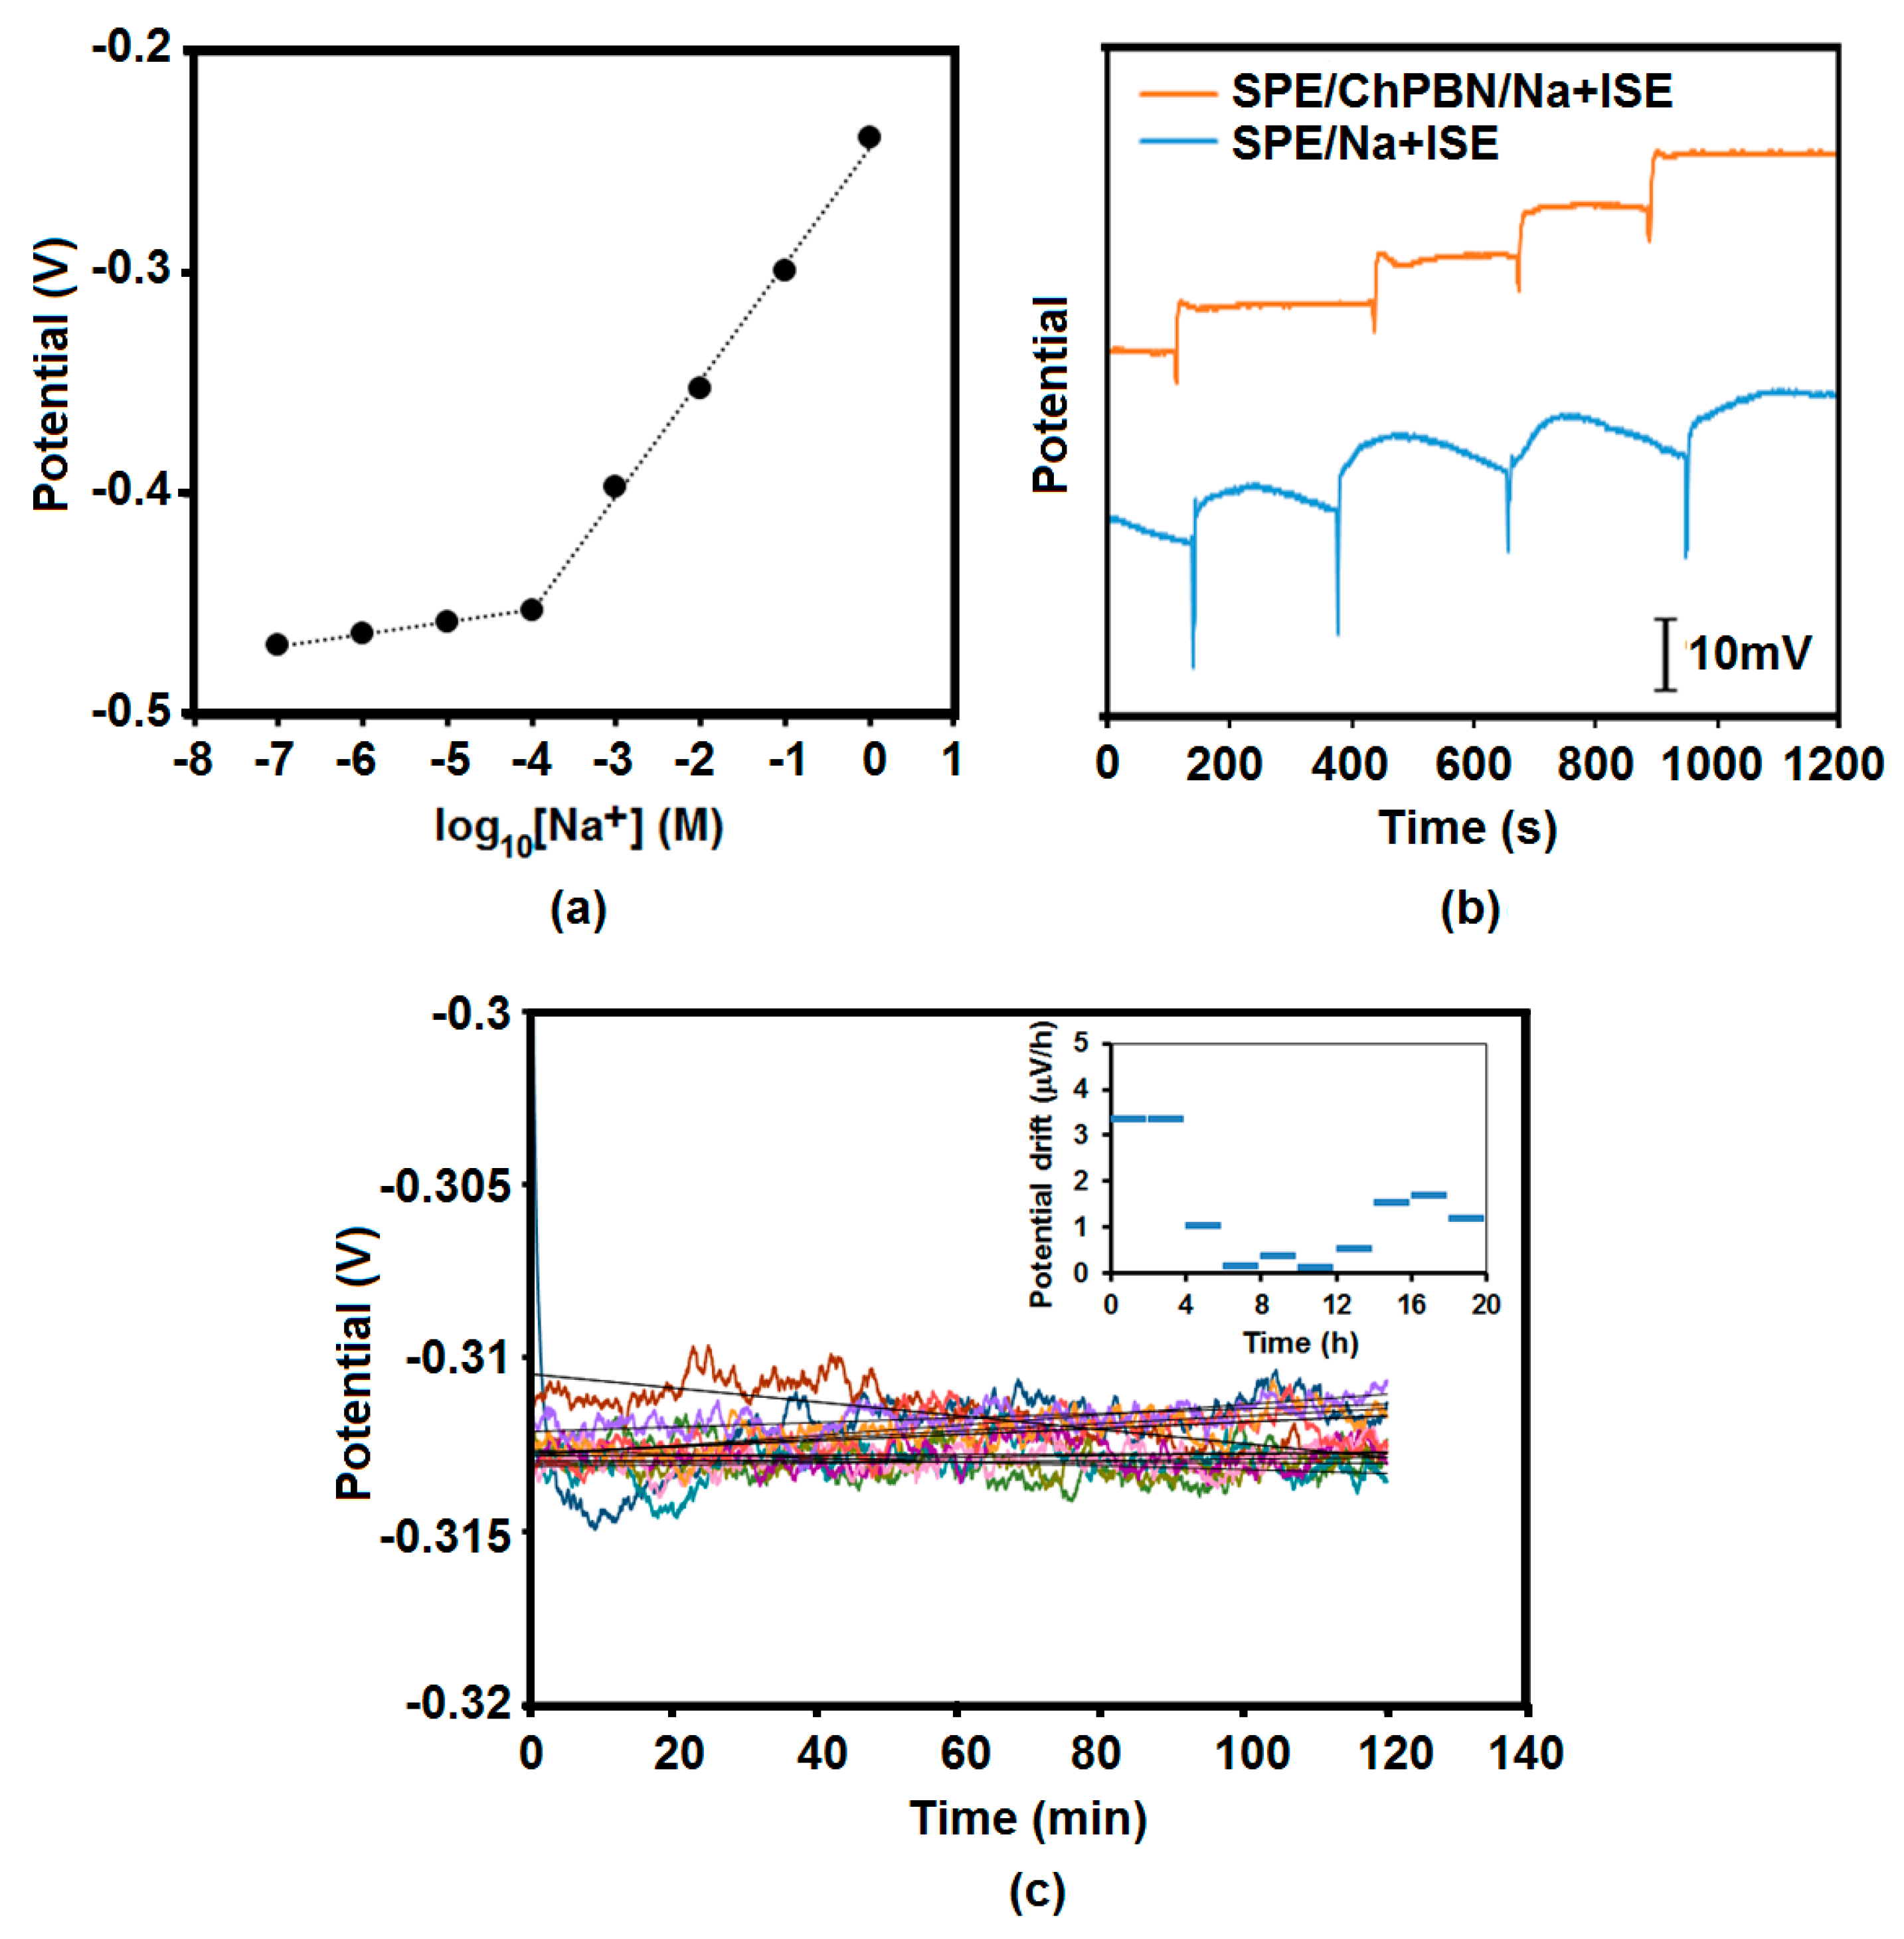
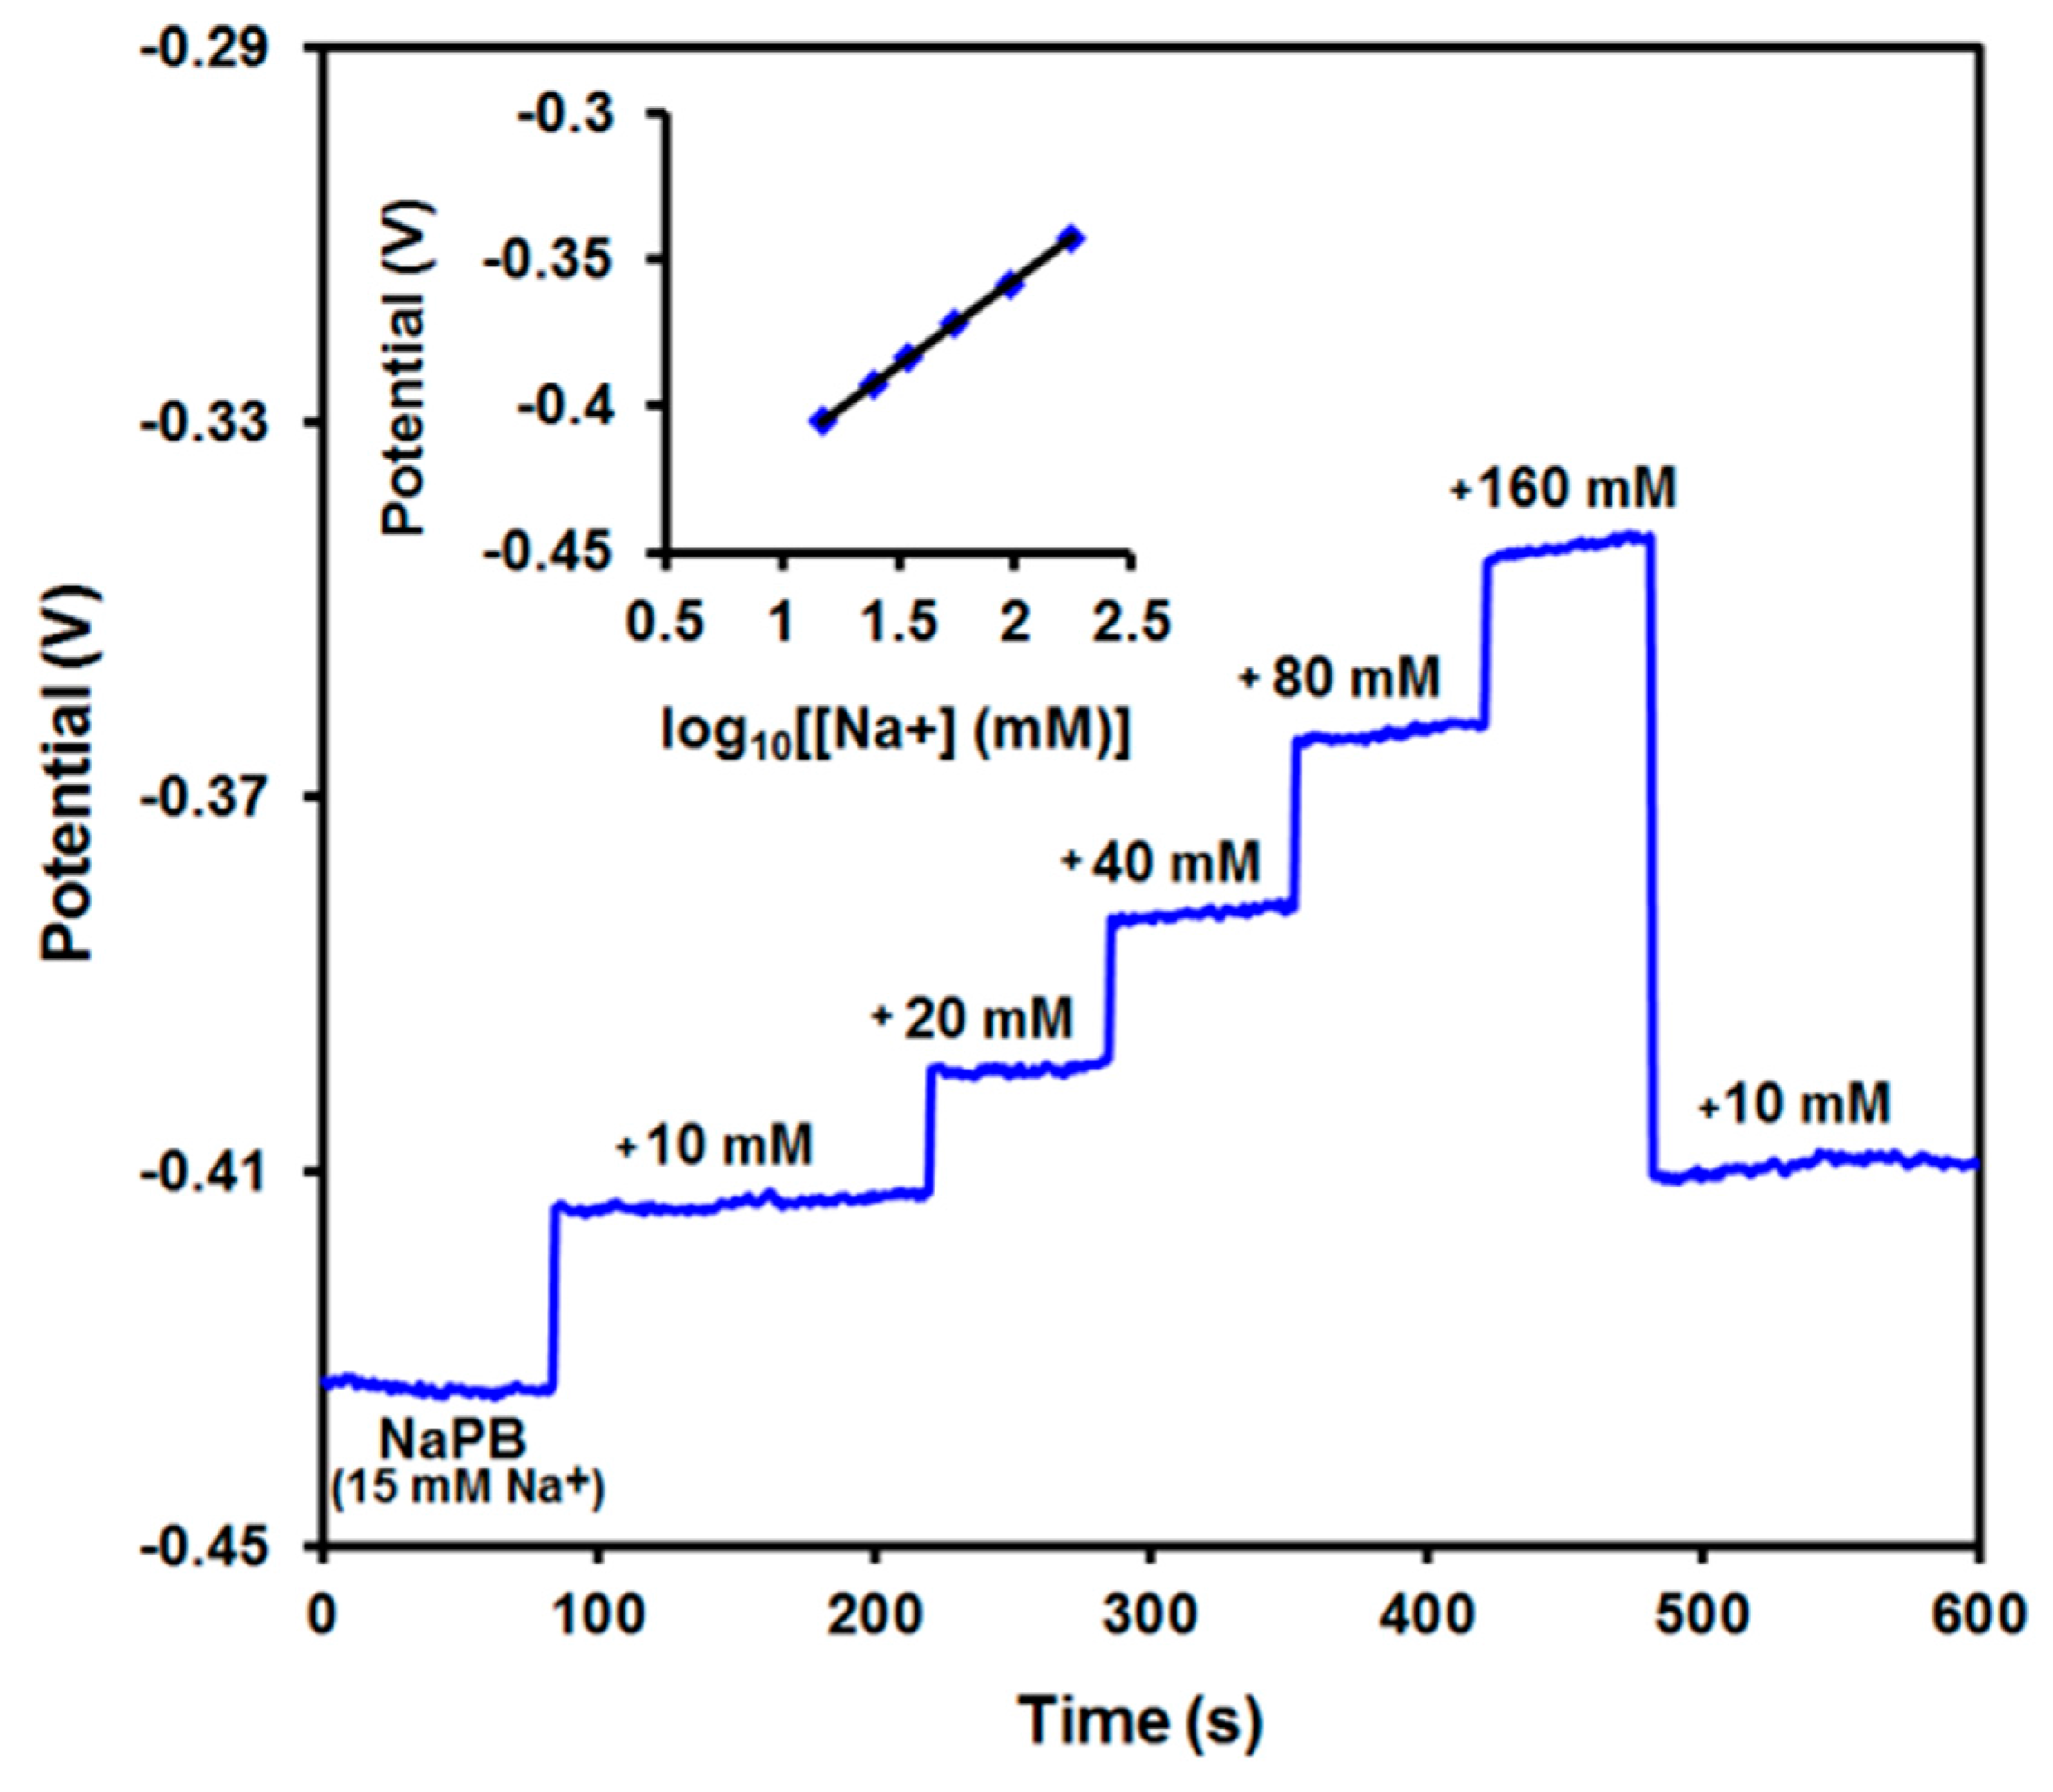
3.3. Potential Response and Stability of SPE/ChPBN/Na+ISE
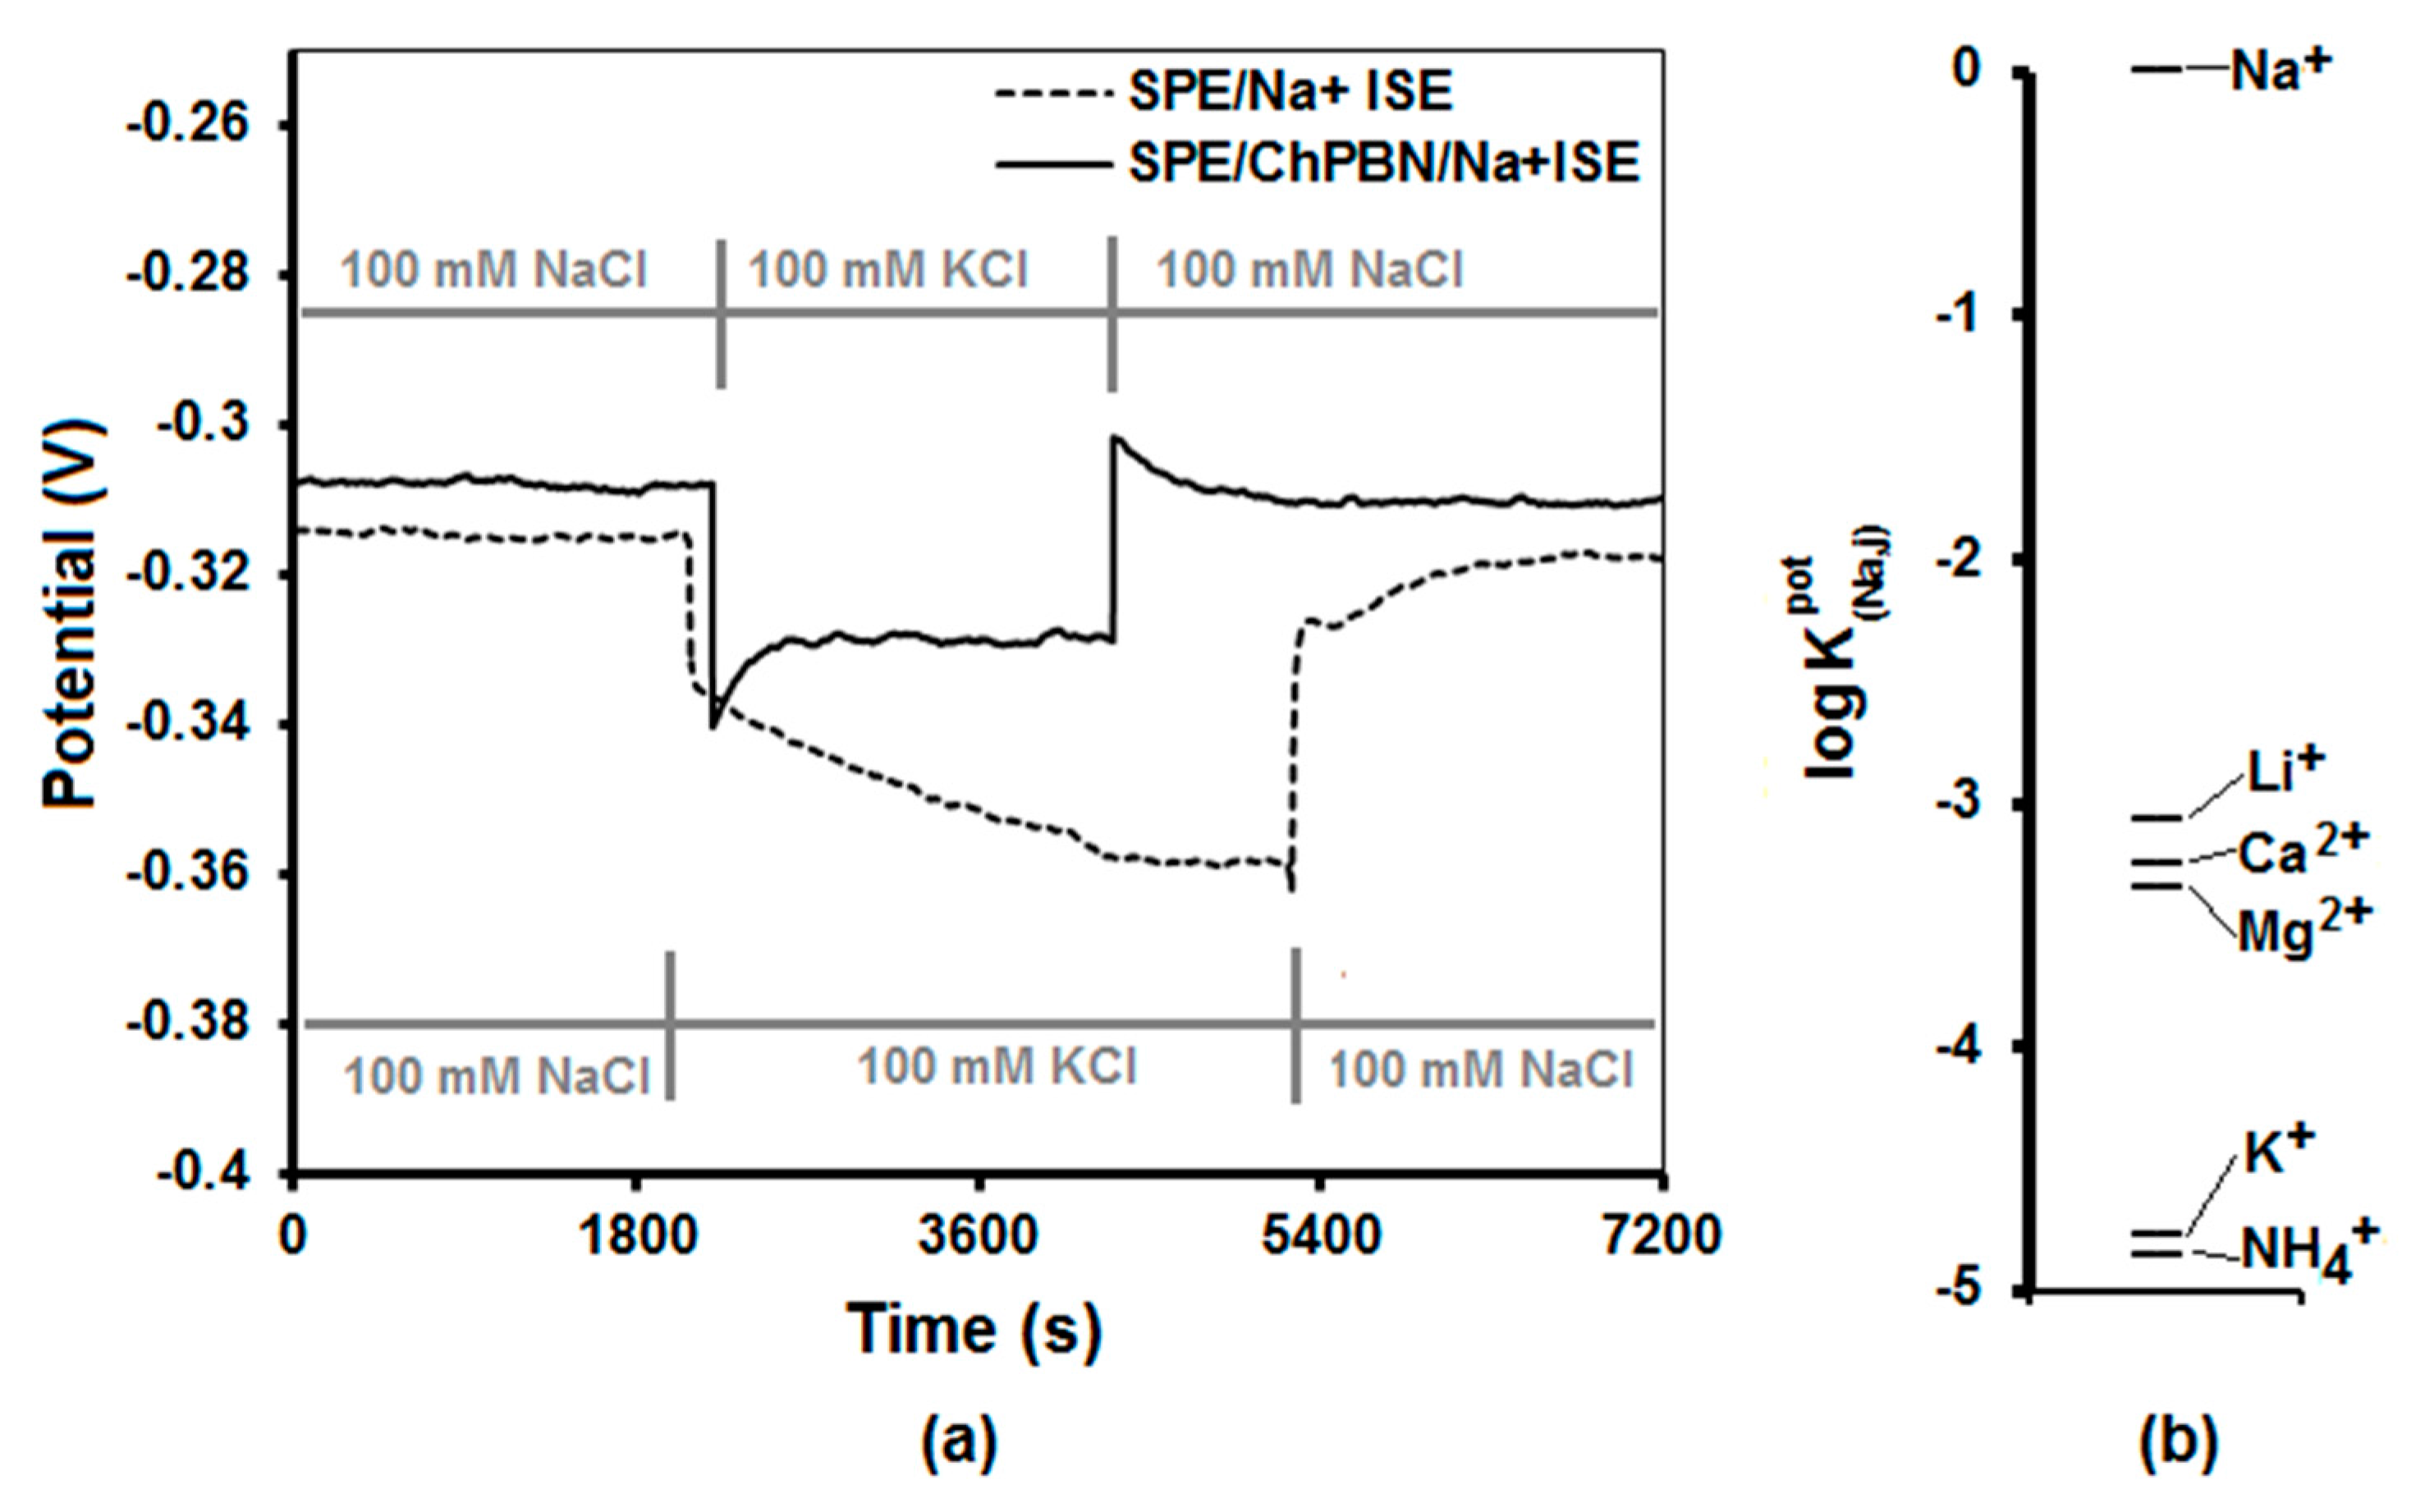
3.4. Water Layer Test and Selectivity Test
4. Conclusions
Supplementary Materials
Acknowledgments
Author Contributions
Conflicts of Interest
References
- Bobacka, J.; Ivaska, A.; Lewenstam, A. Potentiometric ion sensors. Chem. Rev. 2008, 108, 329–351. [Google Scholar] [CrossRef] [PubMed]
- Lindner, E.; Gyurcsányi, R.E. Quality control criteria for solid-contact, solvent polymeric membrane ion-selective electrodes. J. Solid State Electrochem. 2009, 13, 51–68. [Google Scholar] [CrossRef]
- Cattrall, R.; Freiser, H. Coated wire ion-selective electrodes. Anal. Chem. 1971, 43, 1905–1906. [Google Scholar] [CrossRef]
- Hirata, H.; Dato, K. Copper(i) sulphide-impregnated silicone rubber membranes as selective electrodes for copper(ii) ions. Talanta 1970, 17, 883–887. [Google Scholar] [CrossRef]
- Bobacka, J. Conducting polymer-based solid-state ion-selective electrodes. Electroanalysis 2006, 18, 7–18. [Google Scholar] [CrossRef]
- Yin, T.; Qin, W. Applications of nanomaterials in potentiometric sensors. Trends Anal. Chem. 2013, 51, 79–86. [Google Scholar] [CrossRef]
- Lindner, E.; Umezawa, Y. Performance evaluation criteria for preparation and measurement of macro-and microfabricated ion-selective electrodes (iupac technical report). Pure Appl. Chem. 2008, 80, 85–104. [Google Scholar] [CrossRef]
- Cadogan, A.; Gao, Z.; Lewenstam, A.; Ivaska, A.; Diamond, D. All-solid-state sodium-selective electrode based on a calixarene ionophore in a poly (vinyl chloride) membrane with a polypyrrole solid contact. Anal. Chem. 1992, 64, 2496–2501. [Google Scholar] [CrossRef]
- Bobacka, J.; McCarrick, M.; Lewenstam, A.; Ivaska, A. All solid-state poly (vinyl chloride) membrane ion-selective electrodes with poly (3-octylthiophene) solid internal contact. Analyst 1994, 119, 1985–1991. [Google Scholar] [CrossRef]
- Bobacka, J.; Lindfors, T.; McCarrick, M.; Ivaska, A.; Lewenstam, A. Single-piece all-solid-state ion-selective electrode. Anal. Chem. 1995, 67, 3819–3823. [Google Scholar] [CrossRef]
- Bobacka, J. Potential stability of all-solid-state ion-selective electrodes using conducting polymers as ion-to-electron transducers. Anal. Chem. 1999, 71, 4932–4937. [Google Scholar] [CrossRef] [PubMed]
- Pławińska, Ż.; Michalska, A.; Maksymiuk, K. Optimization of capacitance of conducting polymer solid contact in ion-selective electrodes. Electrochim. Acta 2016, 187, 397–405. [Google Scholar] [CrossRef]
- Lindfors, T.; Ivaska, A. Ph sensitivity of polyaniline and its substituted derivatives. J. Electroanal. Chem. 2002, 531, 43–52. [Google Scholar] [CrossRef]
- Lindfors, T.; Ivaska, A. Stability of the inner polyaniline solid contact layer in all-solid-state k+-selective electrodes based on plasticized poly (vinyl chloride). Anal. Chem. 2004, 76, 4387–4394. [Google Scholar] [CrossRef] [PubMed]
- Veder, J.-P.; De Marco, R.; Patel, K.; Si, P.; Grygolowicz-Pawlak, E.; James, M.; Alam, M.T.; Sohail, M.; Lee, J.; Pretsch, E. Evidence for a surface confined ion-to-electron transduction reaction in solid-contact ion-selective electrodes based on poly (3-octylthiophene). Anal. Chem. 2013, 85, 10495–10502. [Google Scholar] [CrossRef] [PubMed]
- Lai, C.-Z.; Fierke, M.A.; Stein, A.; Bühlmann, P. Ion-selective electrodes with three-dimensionally ordered macroporous carbon as the solid contact. Anal. Chem. 2007, 79, 4621–4626. [Google Scholar] [CrossRef] [PubMed]
- Crespo, G.A.; Macho, S.; Rius, F.X. Ion-selective electrodes using carbon nanotubes as ion-to-electron transducers. Anal. Chem. 2008, 80, 1316–1322. [Google Scholar] [CrossRef] [PubMed]
- Fouskaki, M.; Chaniotakis, N. Fullerene-based electrochemical buffer layer for ion-selective electrodes. Analyst 2008, 133, 1072–1075. [Google Scholar] [CrossRef] [PubMed]
- Li, J.; Yin, T.; Qin, W. An all-solid-state polymeric membrane pb 2+-selective electrode with bimodal pore c 60 as solid contact. Anal. Chim. Acta 2015, 876, 49–54. [Google Scholar] [CrossRef] [PubMed]
- Ping, J.; Wang, Y.; Wu, J.; Ying, Y. Development of an all-solid-state potassium ion-selective electrode using graphene as the solid-contact transducer. Electrochem. Commun. 2011, 13, 1529–1532. [Google Scholar] [CrossRef]
- Hernández, R.; Riu, J.; Bobacka, J.; Vallés, C.; Jiménez, P.; Benito, A.M.; Maser, W.K.; Rius, F.X. Reduced graphene oxide films as solid transducers in potentiometric all-solid-state ion-selective electrodes. J. Phys. Chem. C 2012, 116, 22570–22578. [Google Scholar] [CrossRef]
- Li, F.; Ye, J.; Zhou, M.; Gan, S.; Zhang, Q.; Han, D.; Niu, L. All-solid-state potassium-selective electrode using graphene as the solid contact. Analyst 2012, 137, 618–623. [Google Scholar] [CrossRef] [PubMed]
- Miller, P.R.; Xiao, X.; Brener, I.; Burckel, D.B.; Narayan, R.; Polsky, R. Microneedle-based transdermal sensor for on-chip potentiometric determination of k+. Adv. Healthc. Mater. 2014, 3, 876–881. [Google Scholar] [CrossRef] [PubMed]
- Hu, J.; Zou, X.U.; Stein, A.; Bühlmann, P. Ion-selective electrodes with colloid-imprinted mesoporous carbon as solid contact. Anal. Chem. 2014, 86, 7111–7118. [Google Scholar] [CrossRef] [PubMed]
- Ye, J.; Li, F.; Gan, S.; Jiang, Y.; An, Q.; Zhang, Q.; Niu, L. Using sp 2-c dominant porous carbon sub-micrometer spheres as solid transducers in ion-selective electrodes. Electrochem. Commun. 2015, 50, 60–63. [Google Scholar] [CrossRef]
- Fibbioli, M.; Bandyopadhyay, K.; Liu, S.-G.; Echegoyen, L.; Enger, O.; Diederich, F.; Bühlmann, P.; Pretsch, E. Redox-active self-assembled monolayers as novel solid contacts for ion-selective electrodes. Chem. Commun. 2000, 339–340. [Google Scholar]
- Fibbioli, M.; Bandyopadhyay, K.; Liu, S.-G.; Echegoyen, L.; Enger, O.; Diederich, F.; Gingery, D.; Bühlmann, P.; Persson, H.; Suter, U.W. Redox-active self-assembled monolayers for solid-contact polymeric membrane ion-selective electrodes. Chem. Mater. 2002, 14, 1721–1729. [Google Scholar] [CrossRef]
- Grygołowicz-Pawlak, E.; Wyglądacz, K.; Sęk, S.; Bilewicz, R.; Brzózka, Z.; Malinowska, E. Studies on ferrocene organothiol monolayer as an intermediate phase of potentiometric sensors with gold inner contact. Sens. Actuators B. Chem. 2005, 111, 310–316. [Google Scholar] [CrossRef]
- Gabrielli, C.; Hémery, P.; Liatsi, P.; Masure, M.; Perrot, H. An electrogravimetric study of an all-solid-state potassium selective electrode with prussian blue as the electroactive solid internal contact. J. Electrochem. Soc. 2005, 152, H219–H224. [Google Scholar] [CrossRef]
- Zou, X.U.; Cheong, J.H.; Taitt, B.J.; Bühlmann, P. Solid contact ion-selective electrodes with a well-controlled co(ii)/co(iii) redox buffer layer. Anal. Chem. 2013, 85, 9350–9355. [Google Scholar] [CrossRef] [PubMed]
- Zou, X.U.; Zhen, X.V.; Cheong, J.H.; Bühlmann, P. Calibration-free ionophore-based ion-selective electrodes with a co(ii)/co(iii) redox couple-based solid contact. Anal. Chem. 2014, 86, 8687–8692. [Google Scholar] [CrossRef] [PubMed]
- Paczosa-Bator, B.; Pięk, M.; Piech, R. Application of nanostructured tcnq to potentiometric ion-selective k+ and na+ electrodes. Anal. Chem. 2015, 87, 1718–1725. [Google Scholar] [CrossRef] [PubMed]
- Kumar, M.N.R. A review of chitin and chitosan applications. React. Funct. Polym. 2000, 46, 1–27. [Google Scholar] [CrossRef]
- Periayah, M.H.; Halim, A.S.; Saad, A.Z.M. Chitosan: A promising marine polysaccharide for biomedical research. Pharmacogn. Rev. 2016, 10, 39. [Google Scholar] [CrossRef] [PubMed]
- Moghadas, B.; Dashtimoghadam, E.; Mirzadeh, H.; Seidi, F.; Hasani-Sadrabadi, M.M. Novel chitosan-based nanobiohybrid membranes for wound dressing applications. RSC Adv. 2016, 6, 7701–7711. [Google Scholar] [CrossRef]
- Gao, H.; Zhou, W.; Jang, J.H.; Goodenough, J.B. Cross-linked chitosan as a polymer network binder for an antimony anode in sodium-ion batteries. Adv. Energy Mater. 2016, 6, 1502130. [Google Scholar] [CrossRef]
- Sudhakar, Y.; Selvakumar, M. Lithium perchlorate doped plasticized chitosan and starch blend as biodegradable polymer electrolyte for supercapacitors. Electrochim. Acta 2012, 78, 398–405. [Google Scholar] [CrossRef]
- Nagarajan, N.; Zhitomirsky, I. Cathodic electrosynthesis of iron oxide films for electrochemical supercapacitors. J. Appl. Electrochem. 2006, 36, 1399–1405. [Google Scholar] [CrossRef]
- Thakur, V.K.; Thakur, M.K. Recent advances in graft copolymerization and applications of chitosan: A review. ACS Sustain. Chem. Eng. 2014, 2, 2637–2652. [Google Scholar] [CrossRef]
- Darder, M.; Colilla, M.; Ruiz-Hitzky, E. Chitosan–clay nanocomposites: Application as electrochemical sensors. Appl. Clay Sci. 2005, 28, 199–208. [Google Scholar] [CrossRef]
- Yamagata, M.; Soeda, K.; Ikebe, S.; Yamazaki, S.; Ishikawa, M. Chitosan-based gel electrolyte containing an ionic liquid for high-performance nonaqueous supercapacitors. Electrochim. Acta 2013, 100, 275–280. [Google Scholar] [CrossRef]
- Sun, L.; Fu, Y.; Tian, C.; Yang, Y.; Wang, L.; Yin, J.; Ma, J.; Wang, R.; Fu, H. Isolated boron and nitrogen sites on porous graphitic carbon synthesized from nitrogen-containing chitosan for supercapacitors. ChemSusChem 2014, 7, 1637–1646. [Google Scholar] [CrossRef] [PubMed]
- Ling, Z.; Wang, G.; Zhang, M.; Fan, X.; Yu, C.; Yang, J.; Xiao, N.; Qiu, J. Boric acid-mediated b, n-codoped chitosan-derived porous carbons with a high surface area and greatly improved supercapacitor performance. Nanoscale 2015, 7, 5120–5125. [Google Scholar] [CrossRef] [PubMed]
- Hao, P.; Zhao, Z.; Leng, Y.; Tian, J.; Sang, Y.; Boughton, R.I.; Wong, C.; Liu, H.; Yang, B. Graphene-based nitrogen self-doped hierarchical porous carbon aerogels derived from chitosan for high performance supercapacitors. Nano Energy 2015, 15, 9–23. [Google Scholar] [CrossRef]
- Sun, G.; Li, B.; Ran, J.; Shen, X.; Tong, H. Three-dimensional hierarchical porous carbon/graphene composites derived from graphene oxide-chitosan hydrogels for high performance supercapacitors. Electrochim. Acta 2015, 171, 13–22. [Google Scholar] [CrossRef]
- Krishnan, V.; Xidis, A.L.; Neff, V. Prussian blue solid-state films and membranes as potassium ion-selective electrodes. Anal. Chim. Acta 1990, 239, 7–12. [Google Scholar] [CrossRef]
- You, Y.; Yao, H.R.; Xin, S.; Yin, Y.X.; Zuo, T.T.; Yang, C.P.; Guo, Y.G.; Cui, Y.; Wan, L.J.; Goodenough, J.B. Subzero-temperature cathode for a sodium-ion battery. Adv. Mater. 2016, 28, 7243–7248. [Google Scholar] [CrossRef] [PubMed]
- Liu, Y.; Qiao, Y.; Zhang, W.; Li, Z.; Ji, X.; Miao, L.; Yuan, L.; Hu, X.; Huang, Y. Sodium storage in na-rich na x fefe (cn) 6 nanocubes. Nano Energy 2015, 12, 386–393. [Google Scholar] [CrossRef]
- Wu, X.; Sun, M.; Guo, S.; Qian, J.; Liu, Y.; Cao, Y.; Ai, X.; Yang, H. Vacancy-free prussian blue nanocrystals with high capacity and superior cyclability for aqueous sodium-ion batteries. ChemNanoMat 2015, 1, 188–193. [Google Scholar] [CrossRef]
- Li, X.-D.; Liang, X.-L.; Ma, F.; Jing, L.-J.; Lin, L.; Yang, Y.-B.; Feng, S.-S.; Fu, G.-L.; Yue, X.-L.; Dai, Z.-F. Chitosan stabilized prussian blue nanoparticles for photothermally enhanced gene delivery. Colloid. Surf. B Biointerfaces 2014, 123, 629–638. [Google Scholar] [CrossRef] [PubMed]
- Wang, Y.; Zhu, J.; Zhu, R.; Zhu, Z.; Lai, Z.; Chen, Z. Chitosan/prussian blue-based biosensors. Meas. Sci. Technol. 2003, 14, 831. [Google Scholar] [CrossRef]
- Zhong, X.; Yuan, R.; Chai, Y.-Q. Synthesis of chitosan-prussian blue-graphene composite nanosheets for electrochemical detection of glucose based on pseudobienzyme channeling. Sens. Actuators B. Chem. 2012, 162, 334–340. [Google Scholar] [CrossRef]
- Sodium Phosphate. Cold Spring Harbor Press. 2006. Available online: http://cshprotocols.cshlp.org/content/2006/1/pdb.rec8303 (accessed on 2 November 2017).
- Zhang, Q.; Zhang, L.; Li, J. Fabrication and electrochemical study of monodisperse and size controlled prussian blue nanoparticles protected by biocompatible polymer. Electrochim. Acta 2008, 53, 3050–3055. [Google Scholar] [CrossRef]
- Cui, L.; Zhu, J.; Meng, X.; Yin, H.; Pan, X.; Ai, S. Controlled chitosan coated prussian blue nanoparticles with the mixture of graphene nanosheets and carbon nanoshperes as a redox mediator for the electrochemical oxidation of nitrite. Sens. Actuators B Chem. 2012, 161, 641–647. [Google Scholar] [CrossRef]
- Guinovart, T.; Crespo, G.A.; Rius, F.X.; Andrade, F.J. A reference electrode based on polyvinyl butyral (pvb) polymer for decentralized chemical measurements. Anal. Chim. Acta 2014, 821, 72–80. [Google Scholar] [CrossRef] [PubMed]
- Gao, W.; Emaminejad, S.; Nyein, H.Y.Y.; Challa, S.; Chen, K.; Peck, A.; Fahad, H.M.; Ota, H.; Shiraki, H.; Kiriya, D. Fully integrated wearable sensor arrays for multiplexed in situ perspiration analysis. Nature 2016, 529, 509–514. [Google Scholar] [CrossRef] [PubMed]
- Cerrai, P.; Guerra, G.D.; Tricoli, M.; Maltinti, S.; Barbani, N.; Petarca, L. Polyelectrolyte complexes obtained by radical polymerization in the presence of chitosan. Macromol. Chem. Phys. 1996, 197, 3567–3579. [Google Scholar] [CrossRef]
- Jabli, M.; Baouab, M.; Sintes-Zydowicz, N.; Hassine, B.B. [dye molecules/copper(ii)/macroporous glutaraldehyde-chitosan] microspheres complex: Surface characterization, kinetic, and thermodynamic investigations. J. Appl. Polym. Sci. 2012, 123, 3412–3424. [Google Scholar] [CrossRef]
- Sheng, Q.; Liu, R.; Zheng, J. Prussian blue nanospheres synthesized in deep eutectic solvents. Nanoscale 2012, 4, 6880–6886. [Google Scholar] [CrossRef] [PubMed]
- Silva, W.C.; Guix, M.; Angeles, G.A.; Merkoçi, A. Compact microcubic structures platform based on self-assembly prussian blue nanoparticles with highly tuneable conductivity. Phys. Chem. Chem. Phys. 2010, 12, 15505–15511. [Google Scholar] [CrossRef] [PubMed]
- Alkire, R.C.; Kolb, D.M.; Lipkowski, J.; Ross, P.N. Chemically Modified Electrodes; John Wiley & Sons: Hoboken, NJ, USA, 2009; p. 22. [Google Scholar]
- Dornbusch, D.A.; Hilton, R.; Gordon, M.J.; Suppes, G.J. Effects of sonication on eis results for zinc alkaline batteries. ECS Electrochem. Lett. 2013, 2, A89–A92. [Google Scholar] [CrossRef]
- Fibbioli, M.; Morf, W.E.; Badertscher, M.; de Rooij, N.F.; Pretsch, E. Potential drifts of solid-contacted ion-selective electrodes due to zero-current ion fluxes through the sensor membrane. Electroanalysis 2000, 12, 1286–1292. [Google Scholar] [CrossRef]
- Paczosa-Bator, B. All-solid-state selective electrodes using carbon black. Talanta 2012, 93, 424–427. [Google Scholar] [CrossRef] [PubMed]
- Umezawa, Y.; Bühlmann, P.; Umezawa, K.; Tohda, K.; Amemiya, S. Potentiometric selectivity coefficients of ion-selective electrodes. Part I. Inorganic cations (technical report). Pure Appl. Chem. 2000, 72, 1851–2082. [Google Scholar] [CrossRef]
- Umezawa, Y.; Umezawa, K.; Sato, H. Selectivity coefficients for ion-selective electrodes: Recommended methods for reporting ka,bpot values (technical report). Pure Appl. Chem. 2009, 67, 507–518. [Google Scholar]


| Electrode Surface Condition | Capacitance (µF) | Electrode/Solution Interface Resistance (Ω) |
|---|---|---|
| Screen-printed carbon (bare SPE) | 3.44 | 417 |
| SPE/chitosan | 116.2 | 414 |
| SPE/PB | 13.1 | 365 |
| SPE/ChPBN | 154.5 | 444 |
| Method | Parameter | SPE/Na+ISE | SPE/ChPBN/Na+ISE |
|---|---|---|---|
| CP (polarized at ±100 nA) | Potential drift (µV/s) | 643 ± 4.55 | 288 ± 2.01 |
| Capacitance (µF) | 457 ± 6.49 | 737 ± 8.51 | |
| Membrane resistance, Rm (kΩ) | 372.31 ± 7.03 | 89.41 ± 4.71 | |
| CP (polarized at ±1 nA) | Potential drift (µV/s) | 57.50 ± 2.36 | 12.60 ± 0.90 |
| EIS | Capacitance (µF) | 3.44 ± 0.35 | 13.10 ± 0.78 |
| Charge transfer resistance, Rct (kΩ) | 88.59 ± 0.38 | 6.21 ± 0.20 |
© 2017 by the authors. Licensee MDPI, Basel, Switzerland. This article is an open access article distributed under the terms and conditions of the Creative Commons Attribution (CC BY) license (http://creativecommons.org/licenses/by/4.0/).
Share and Cite
Ghosh, T.; Chung, H.-J.; Rieger, J. All-Solid-State Sodium-Selective Electrode with a Solid Contact of Chitosan/Prussian Blue Nanocomposite. Sensors 2017, 17, 2536. https://doi.org/10.3390/s17112536
Ghosh T, Chung H-J, Rieger J. All-Solid-State Sodium-Selective Electrode with a Solid Contact of Chitosan/Prussian Blue Nanocomposite. Sensors. 2017; 17(11):2536. https://doi.org/10.3390/s17112536
Chicago/Turabian StyleGhosh, Tanushree, Hyun-Joong Chung, and Jana Rieger. 2017. "All-Solid-State Sodium-Selective Electrode with a Solid Contact of Chitosan/Prussian Blue Nanocomposite" Sensors 17, no. 11: 2536. https://doi.org/10.3390/s17112536
APA StyleGhosh, T., Chung, H.-J., & Rieger, J. (2017). All-Solid-State Sodium-Selective Electrode with a Solid Contact of Chitosan/Prussian Blue Nanocomposite. Sensors, 17(11), 2536. https://doi.org/10.3390/s17112536