1. Introduction
Among the envisioned medium access control (MAC) protocols for the fifth generation of mobile communication, the non-orthogonal multiple access (NOMA) protocol is one of the most promising candidate techniques, as it has been shown to increase cell capacity. To support multiple users, the NOMA protocol allocates two-dimensional time-frequency resources that are superposed and transmitted to multiple users whose channel gain differences are very large. Each receiver node can decode an individual packet from packets that are superposed in the power domain, by using the method of successive interference cancellation (SIC). Consequently, the NOMA protocol can achieve high cell capacity. On the other hand, conventional orthogonal multiple access (OMA) protocols allocate resources to each user either in time or in frequency or in code, which limits the cell capacity.
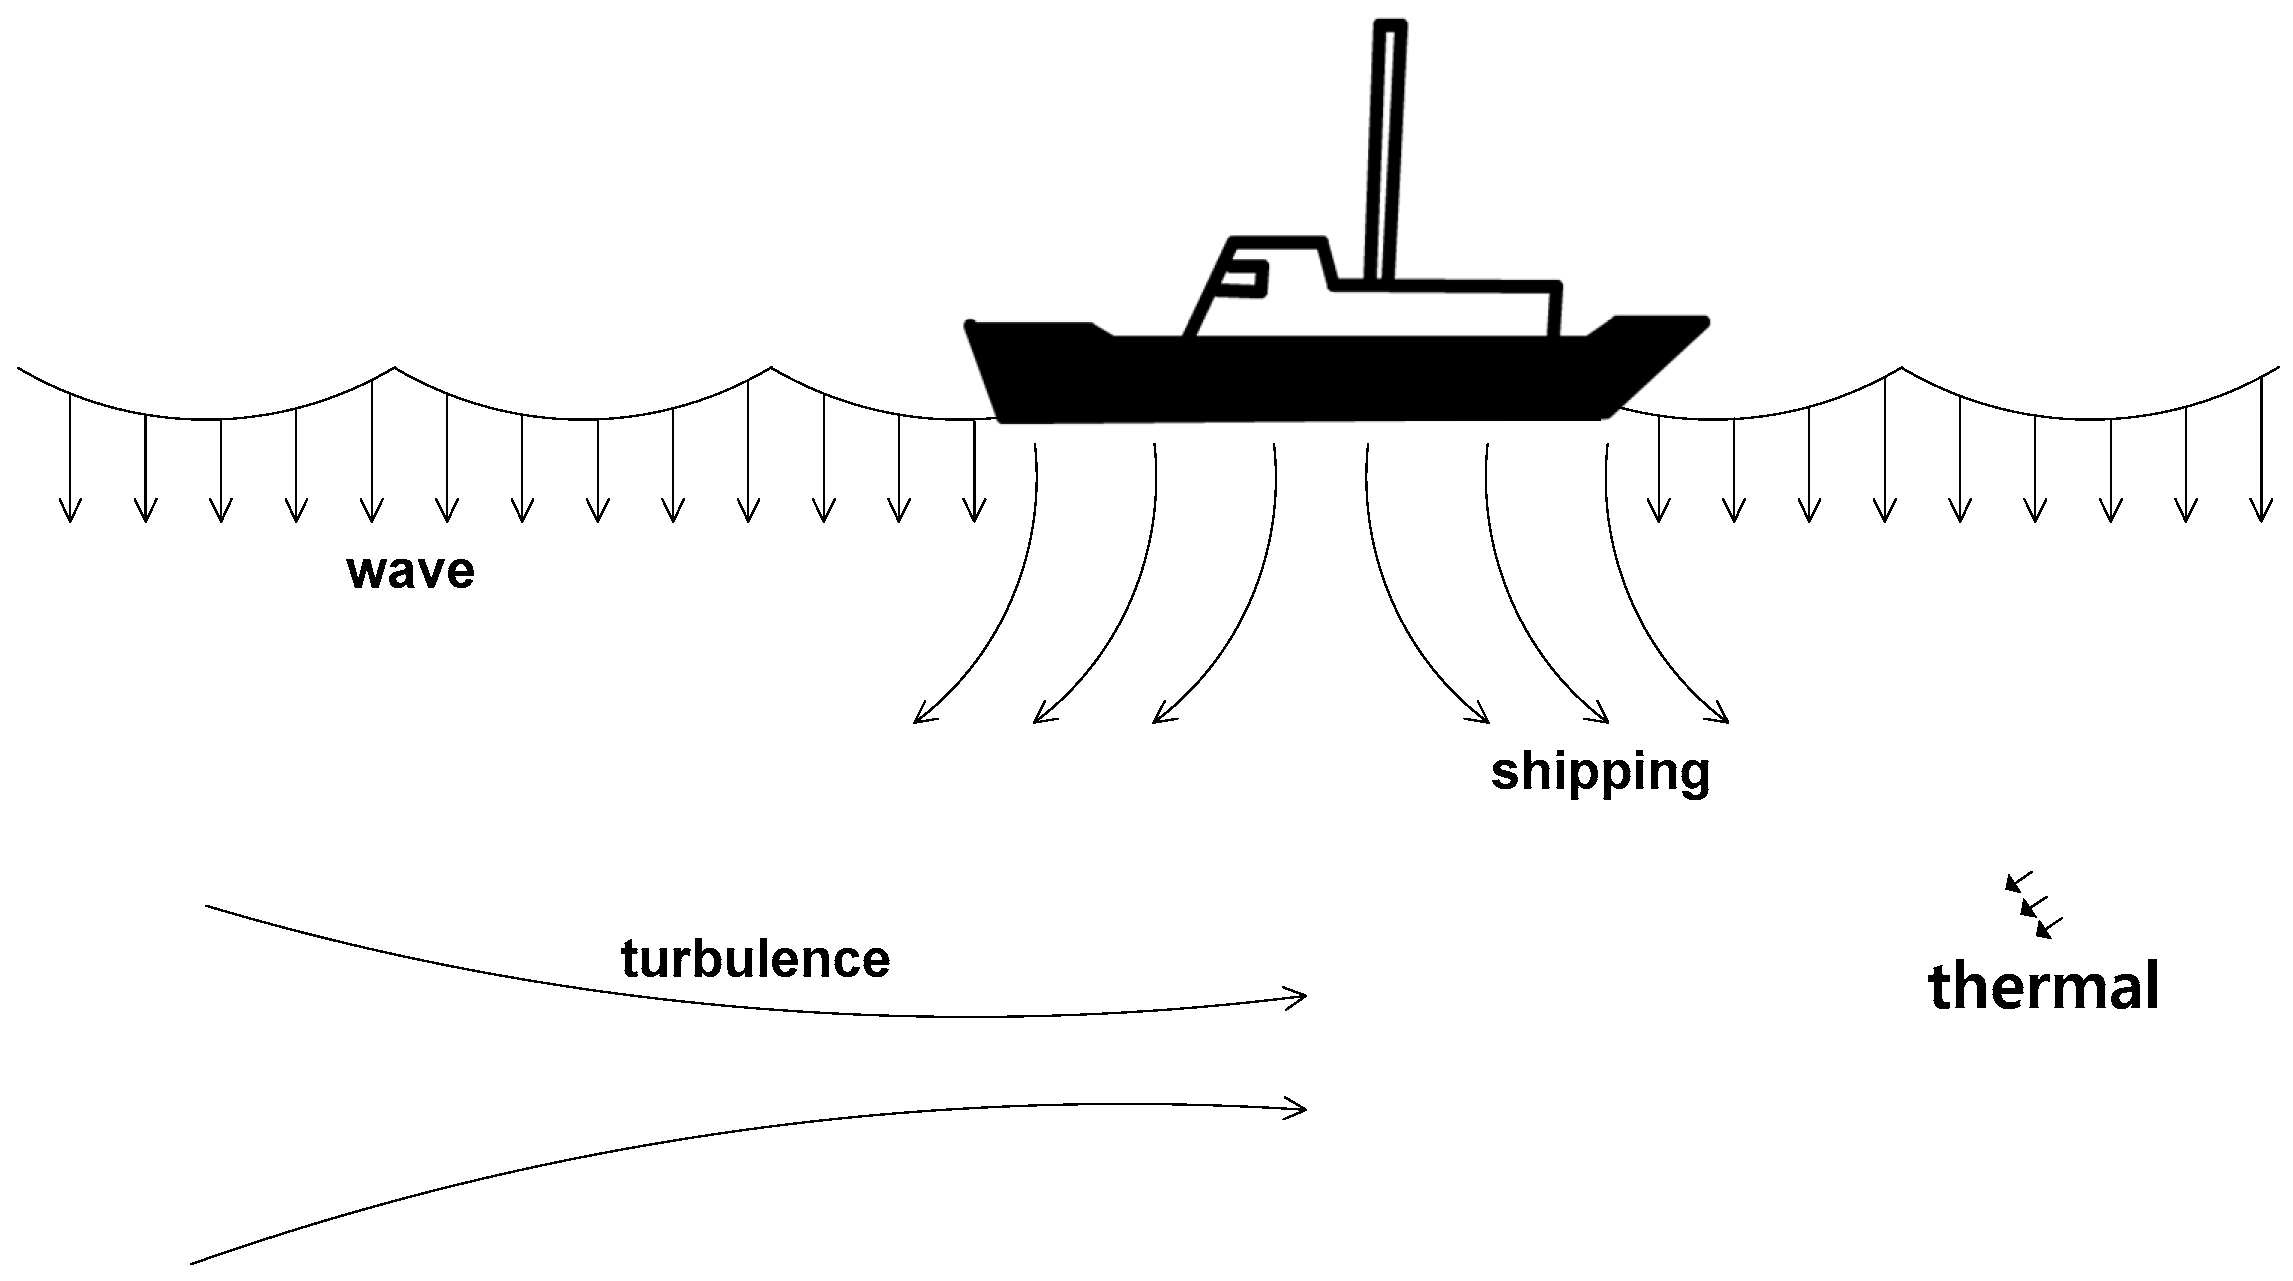
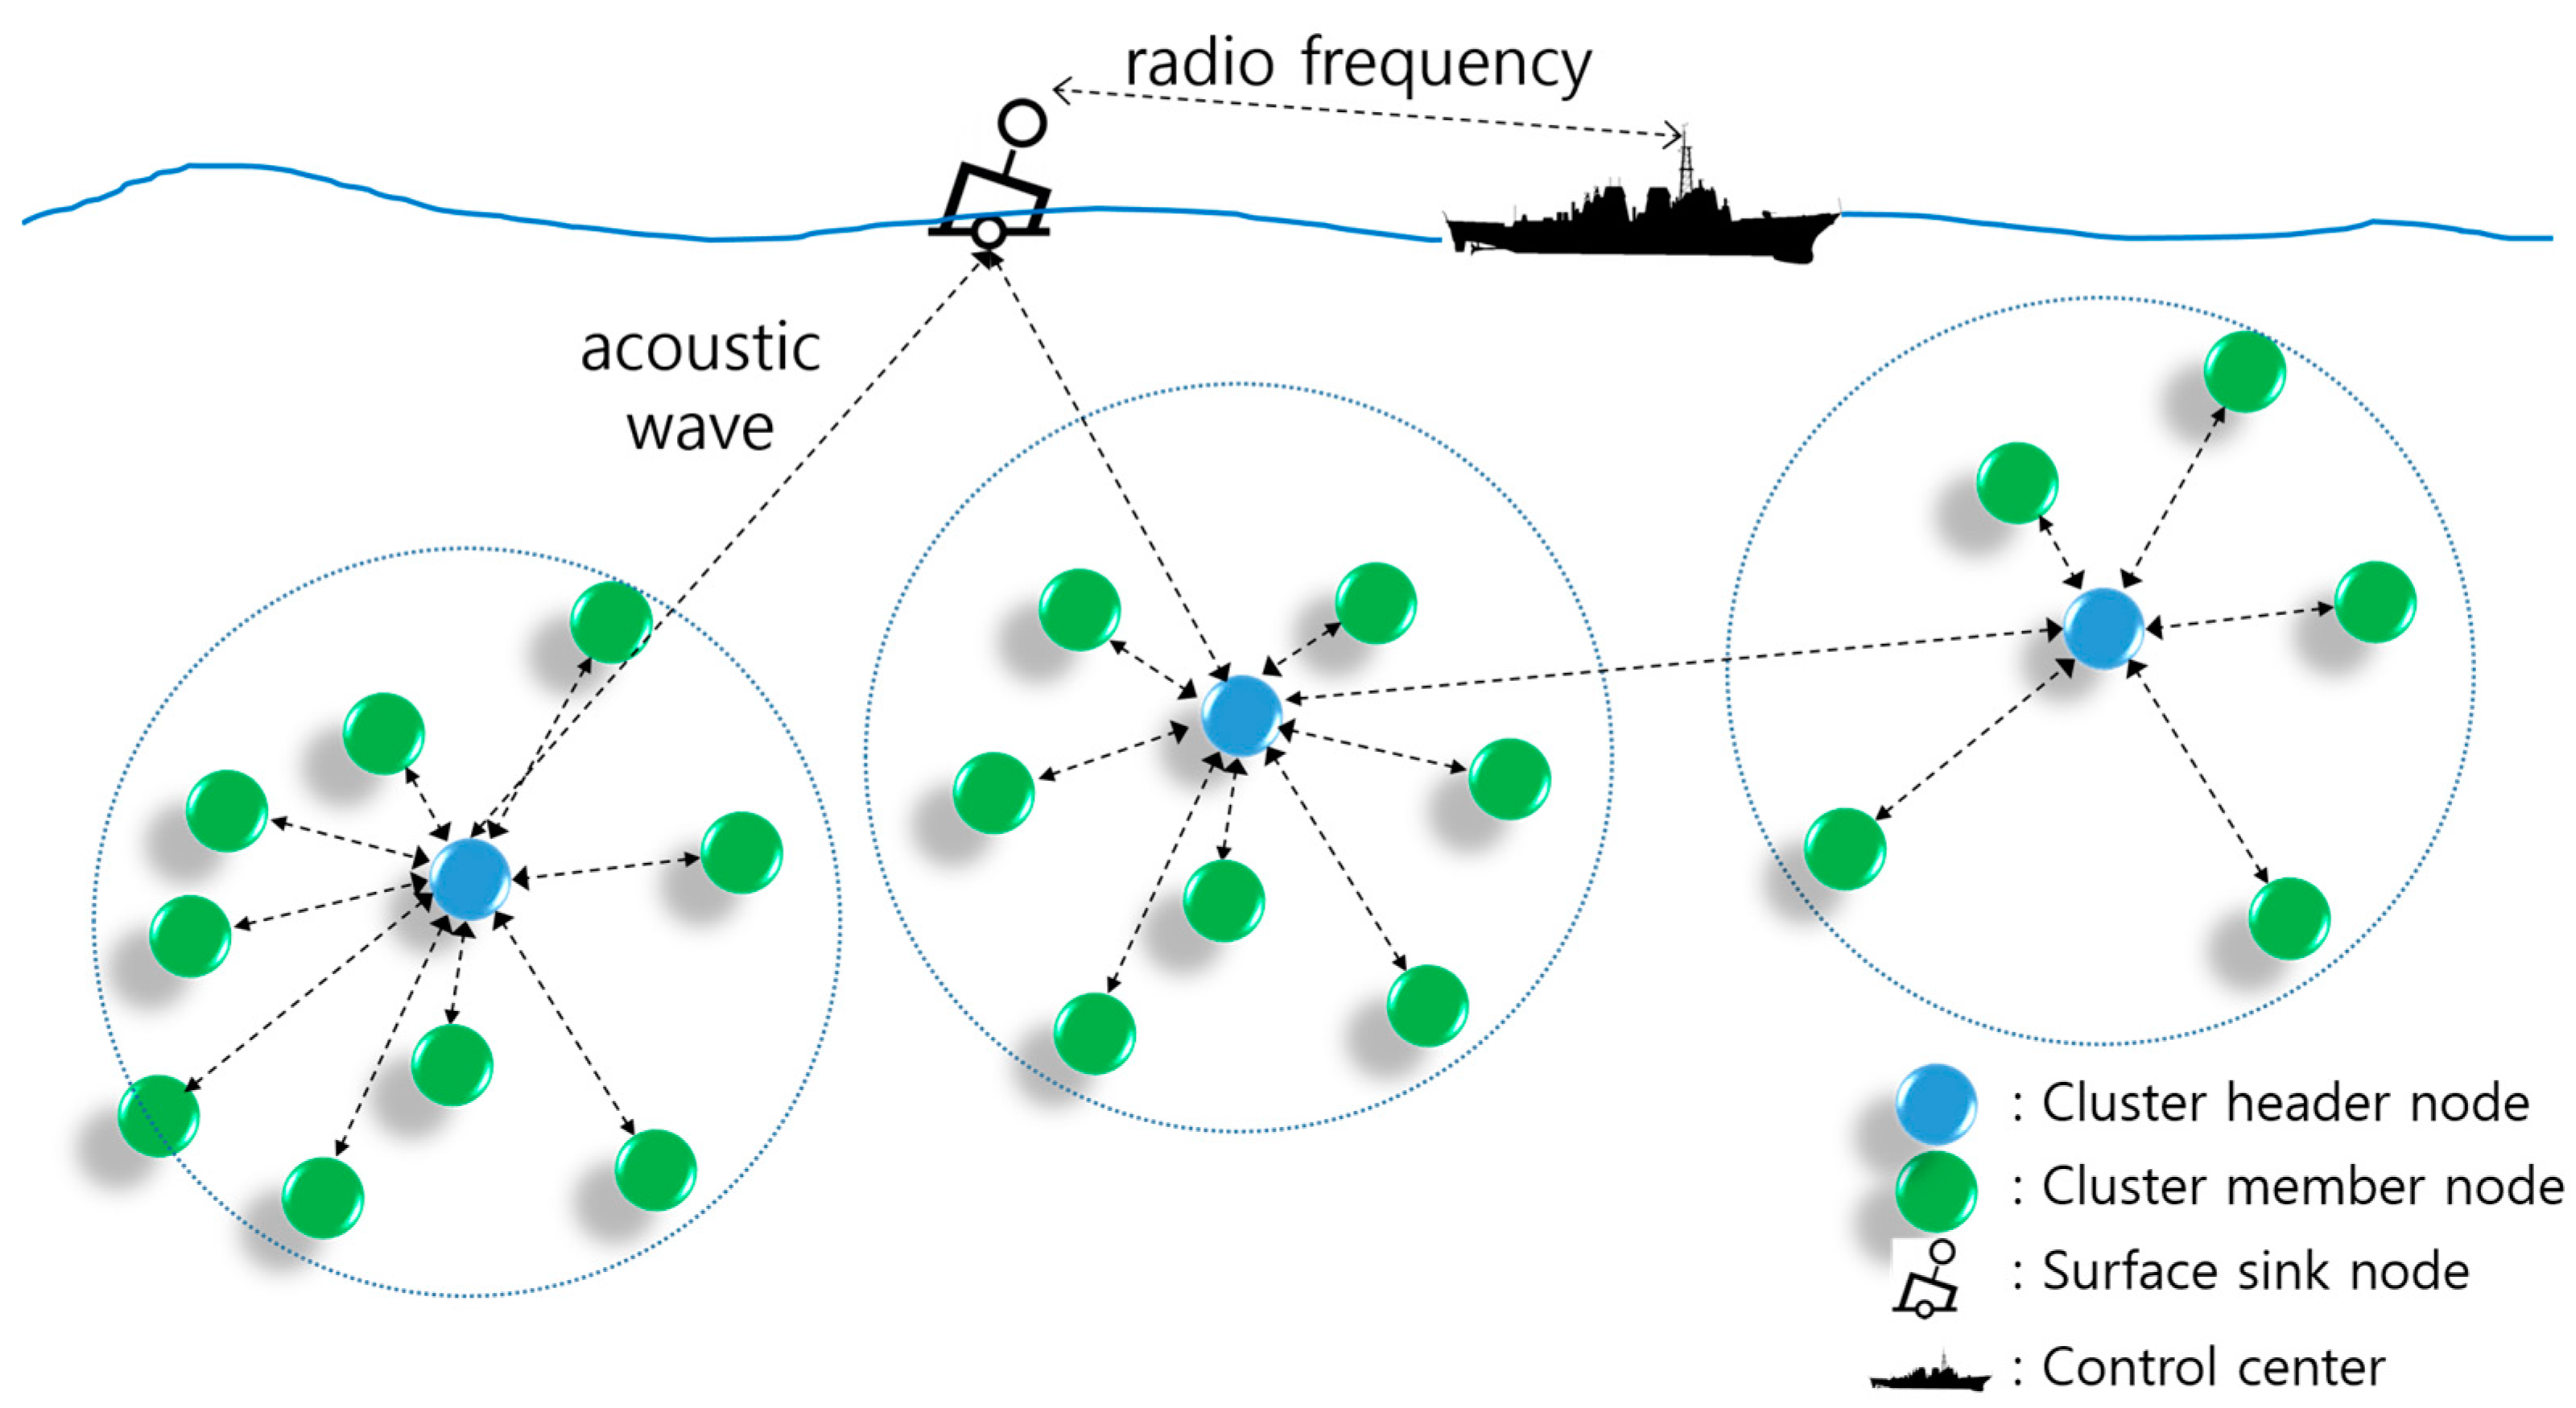
In underwater environments, acoustic waves are used for communications instead of radio frequency (RF) waves due to the absorption and diffusion of RF waves. Additionally, underwater ambient noise is not white noise, i.e., it has frequency-dependent characteristics. Thus, underwater acoustic channels suffer from low propagation speed, narrow frequency bandwidth, and low data rate. These unique channel conditions necessitate the modification of conventional terrestrial MAC protocols before they are applied to underwater acoustic sensor networks (UWASNs).
The paper examines the feasibility of the NOMA protocol in an underwater channel that has distance/frequency-dependent attenuation and frequency-dependent ambient noise. Additionally, the performance degradation issues found in existing sum-rate maximization (SRM) power allocation schemes for downlink underwater NOMA are addressed. Wasteful resources caused by unequal transmission times between NOMA-paired channels may have an adverse effect on the data rate of multiplexed channels. Hence, this paper proposes a new scheme named equal transmission times (ETT) power allocation to eliminate wasteful resources. To guarantee equal transmission times, ETT first calculates the data rate required for each path, based on the number of packets waiting in the sender’s buffer. Subsequently, ETT calculates the transmission power required to achieve the calculated data rate. Equal transmission times are guaranteed, and the proposed ETT can prevent generation of wasteful resources. In terms of the overall sum-rate, which is defined as the mean of the sum of the data rates for two paired channels during a total transmission time, we observe that ETT outperforms existing SRM scheme irrespective of the number of packets for each path in the sender’s buffer.
This paper is organized as follows. First, we provide an overview on the characteristics of the underwater channel and on the clustered UWASNs in
Section 2.
Section 3 gives a brief overview of problems with the existing SRM in underwater environments. The details of the proposed ETT are described in
Section 4. Numerical results are presented in
Section 5. Finally, conclusions are drawn in
Section 6.
3. SRM Power Allocation Scheme in Underwater Channels and Their Issues
The conventional OMA protocols have some weakness when they are applied in the underwater channel. Time division multiple access (TDMA) needs accurate timing synchronization and a guard time to avoid collisions. These degrade the performance of the TDMA because of low channel utilization. Frequency division multiple access (FDMA), which use frequency bands exclusively at the same time, is not suitable for the narrow bandwidth underwater channel. In the case of code division multiple access (CDMA), the near-far problem is one of the major issues. In the near-far problem, the receiver cannot detect the weak signal in the presence of a strong signal. To overcome this issue, the sender node requires an extra overhead for the power control technique to ensure equal received power. In contrast, NOMA exploits the gain difference between the receiver nodes. This characteristic is suitable for the underwater channel that has a severe attenuation.
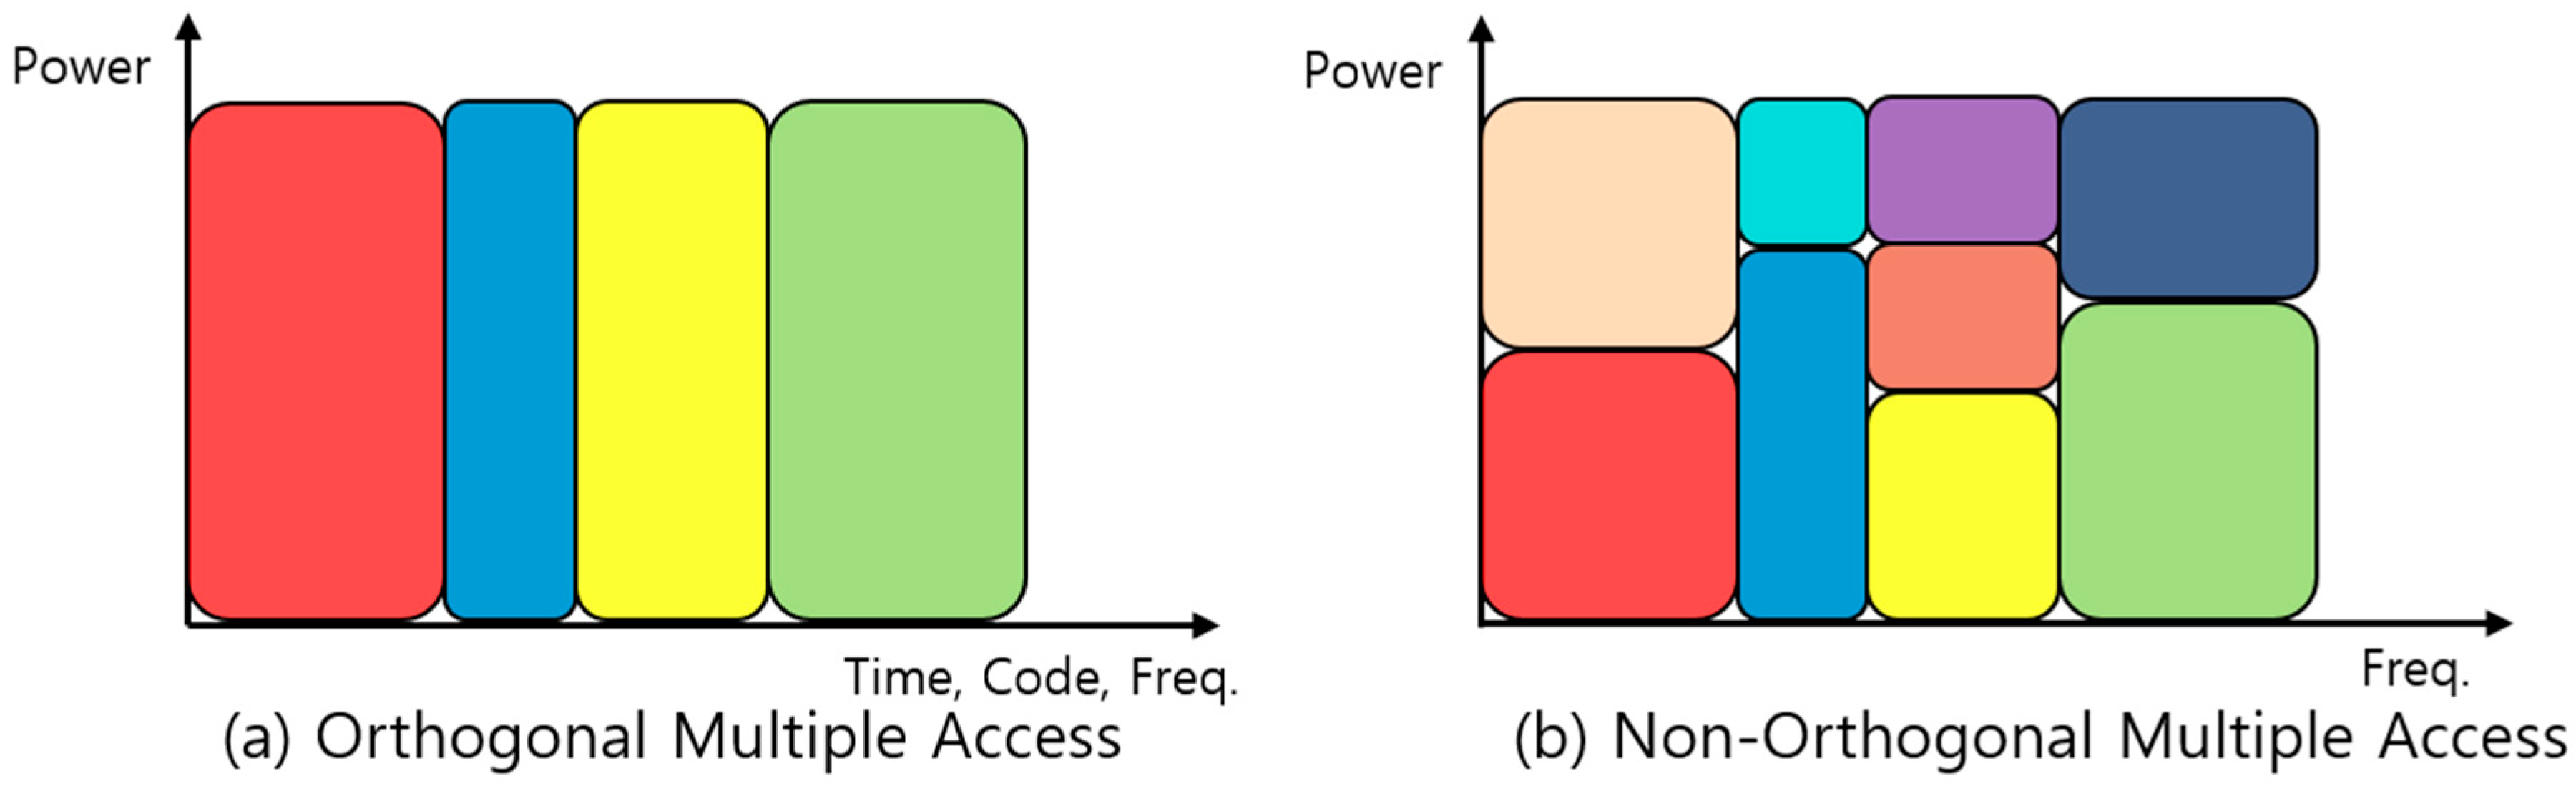
Regarding resource allocation, there is a significant difference between the OMA and NOMA protocol as shown in
Figure 4 where the resource allocated to different user is colored differently. OMA protocols in
Figure 4a exclusively allocate resources such as time, frequency, and code to each user. Theoretically, there is no interference among users so a receiver can simply detect each user’s packet. Hence because of exclusive resource allocation, the maximum number of users being supported is limited. In contrast, as illustrated in
Figure 4b, the NOMA protocol allocates same two-dimensional time-frequency resource to multiple users in the power domain. The NOMA protocol allocates the same resource exploiting the characteristics of channel difference, which allows multiple users who have a significant channel gain difference to share the same resource. Therefore the number of users being supported is not strictly limited. Unlike the OMA protocol, the NOMA protocol needs an elaborate user signal detection process named SIC at the receiver node side. Through the SIC, each user can decode an individual packet from the superposed packets in the power domain and therefore a high cell capacity is achieved.
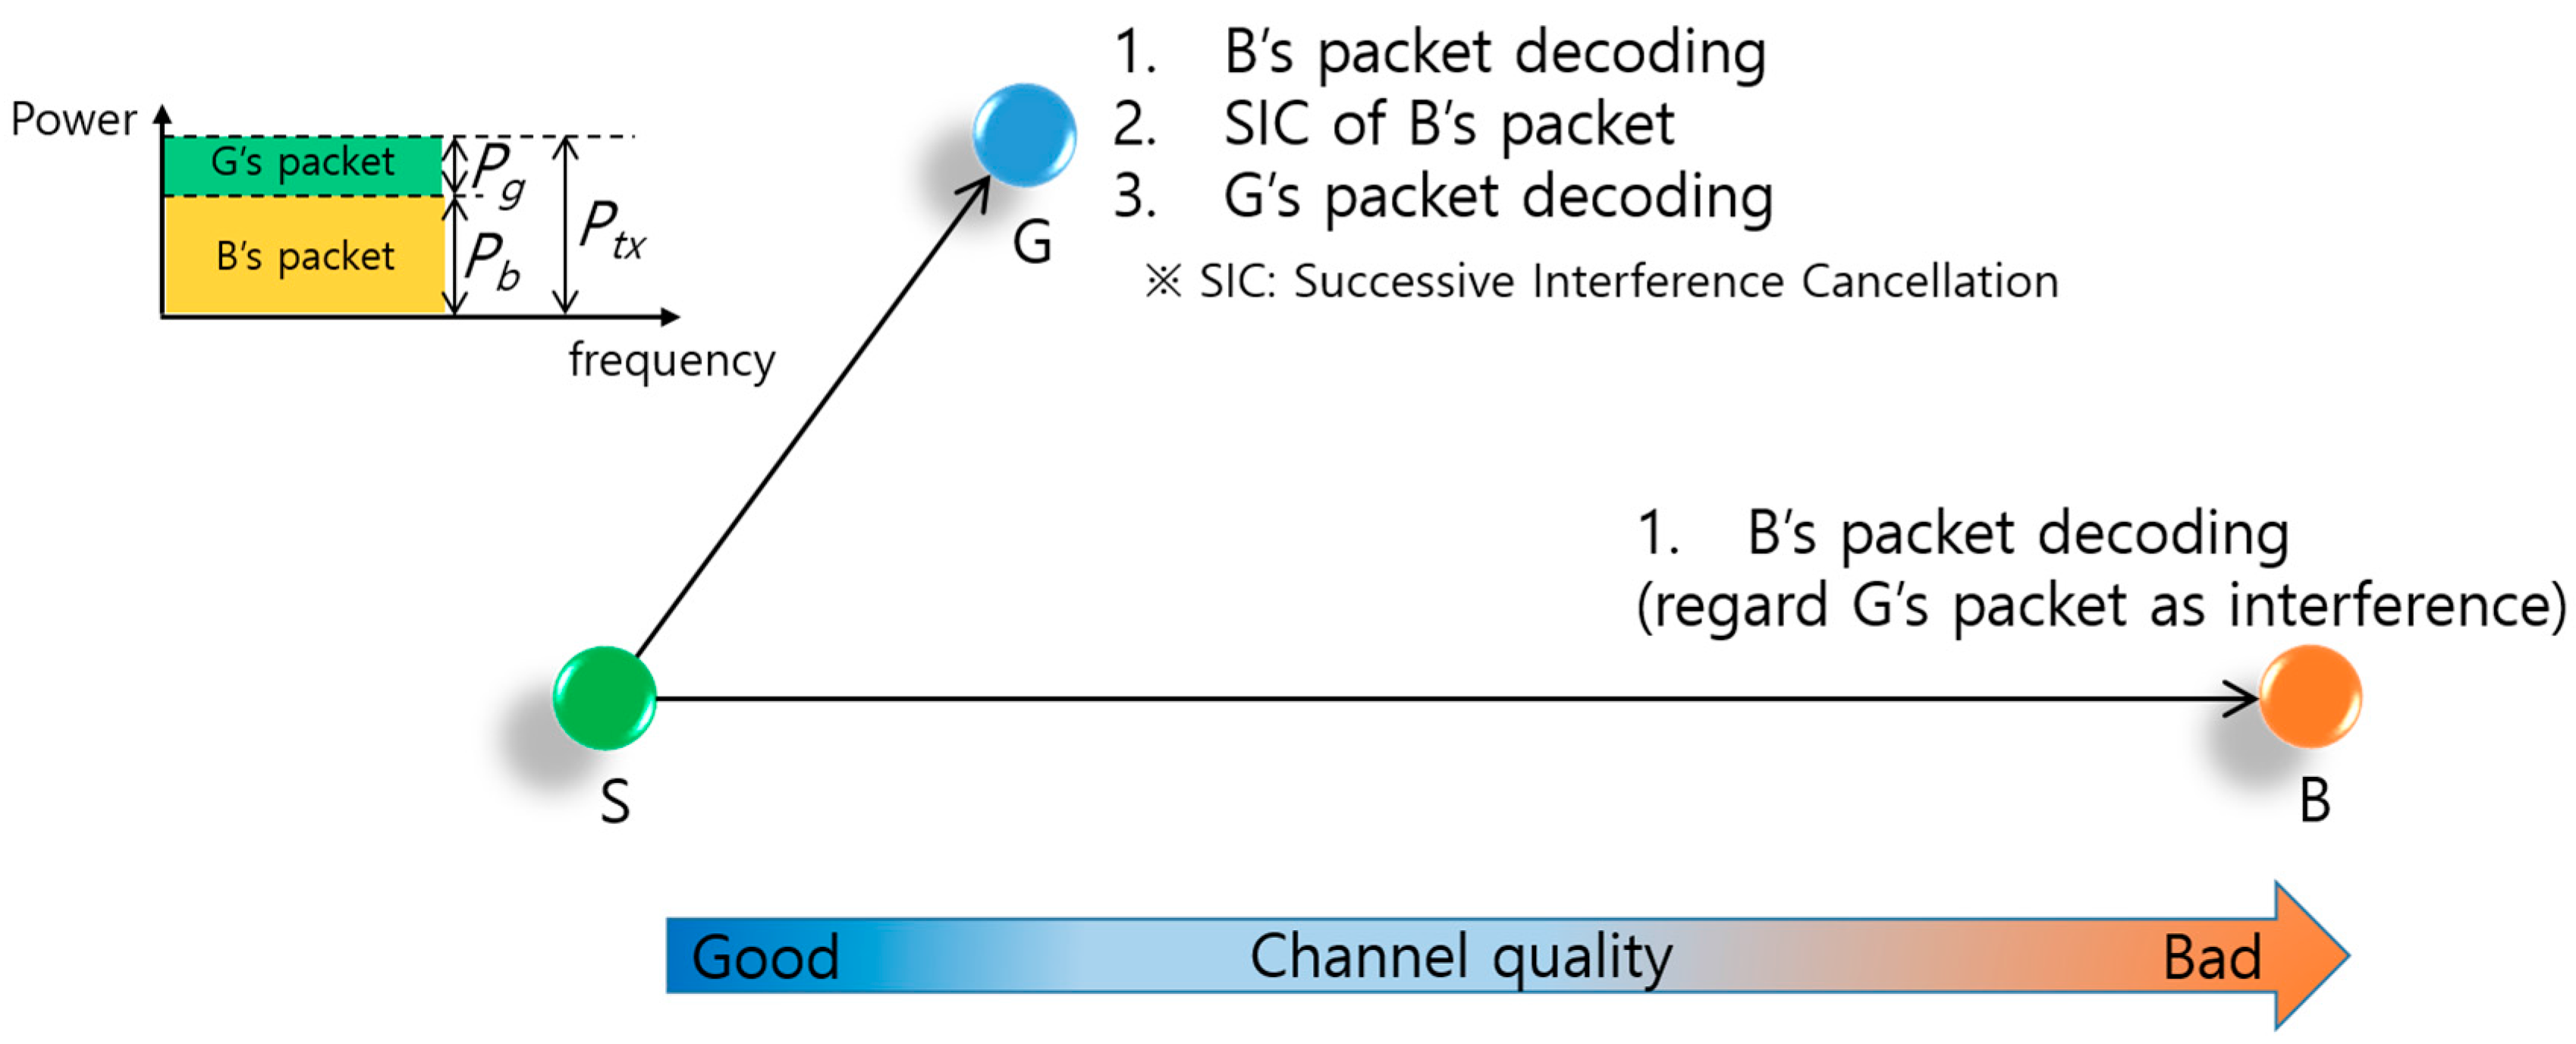
Figure 5 provides an example of the downlink NOMA transmission via power domain multiplexing between a sender node S and two receiver nodes G and B. Among the two receiver nodes, G has good channel quality as it is located near to S, and B has bad channel quality because of severe attenuation commensurate with its distance from S. In general, node S pairs two receiver nodes that have large differences in their channel gains and then transmits data packets to the paired nodes concurrently at the same frequency. To achieve collision-free concurrent transmissions, the paired nodes’ packets are superposed in the power domain, wherein S allocates a larger transmission power (
) to the bad quality channel transmission and a smaller transmission power (
) to the good quality channel transmission without exceeding the transmission power constraint (
), as shown in the upper-left part of
Figure 5. There is a direct association between the power allocation ratio (
) and the sum-rate, which is defined by
, where
and
are the data transmission rates of the good and bad quality channels, respectively. Therefore, finding the optimized
in terms of the sum-rate is critical for NOMA performance. Superposed packets are decoded in the following manner. Node B decodes its packet by considering G’s packet as interference. On the other hand, node G has to decode B’s packet first. Subtracting the decoded packet from the superposed packets, node G can then decode its packet from the subtracted packet, which is the summation of its packet and the ambient noise. This procedure is called SIC [
9].
Most studies on power allocation for NOMA have focused on maximizing the sum-rate. In [
10] the authors proposed two sub-optimal power allocation schemes based on the users’ instantaneous channel state information (CSI) in a sub-carrier based NOMA system. In [
11] the authors first studied the ergodic capacity maximization problem for the Rayleigh fading multiple-input multiple-output (MIMO) NOMA systems. In this literature, the authors proposed both optimal and low complexity sub-optimal power allocation schemes to maximize the ergodic capacity under the conditions with a total transmit power constraint and minimum rate constraint of the weak user. The sum rate maximization of a multiple-input single-output (MISO) downlink NOMA system has been studied in [
12]. The authors used a minorization-maximization algorithm to solve the downlink sum-rate maximization problem. In [
13] the authors proposed a sub-optimal water filling based power allocation scheme to improve the total achieved system throughput. This scheme is operated in two stages: the water filling–based inter sub-band power allocation and the adaptive intra sub-band power allocation. The formulation of an optimization problem for maximizing the sum capacity has been studied in [
14] for the single-input single-output (SISO) method. This paper considered maximizing the sum capacity under a total power constraint and a quality of service (QoS) condition of each user.
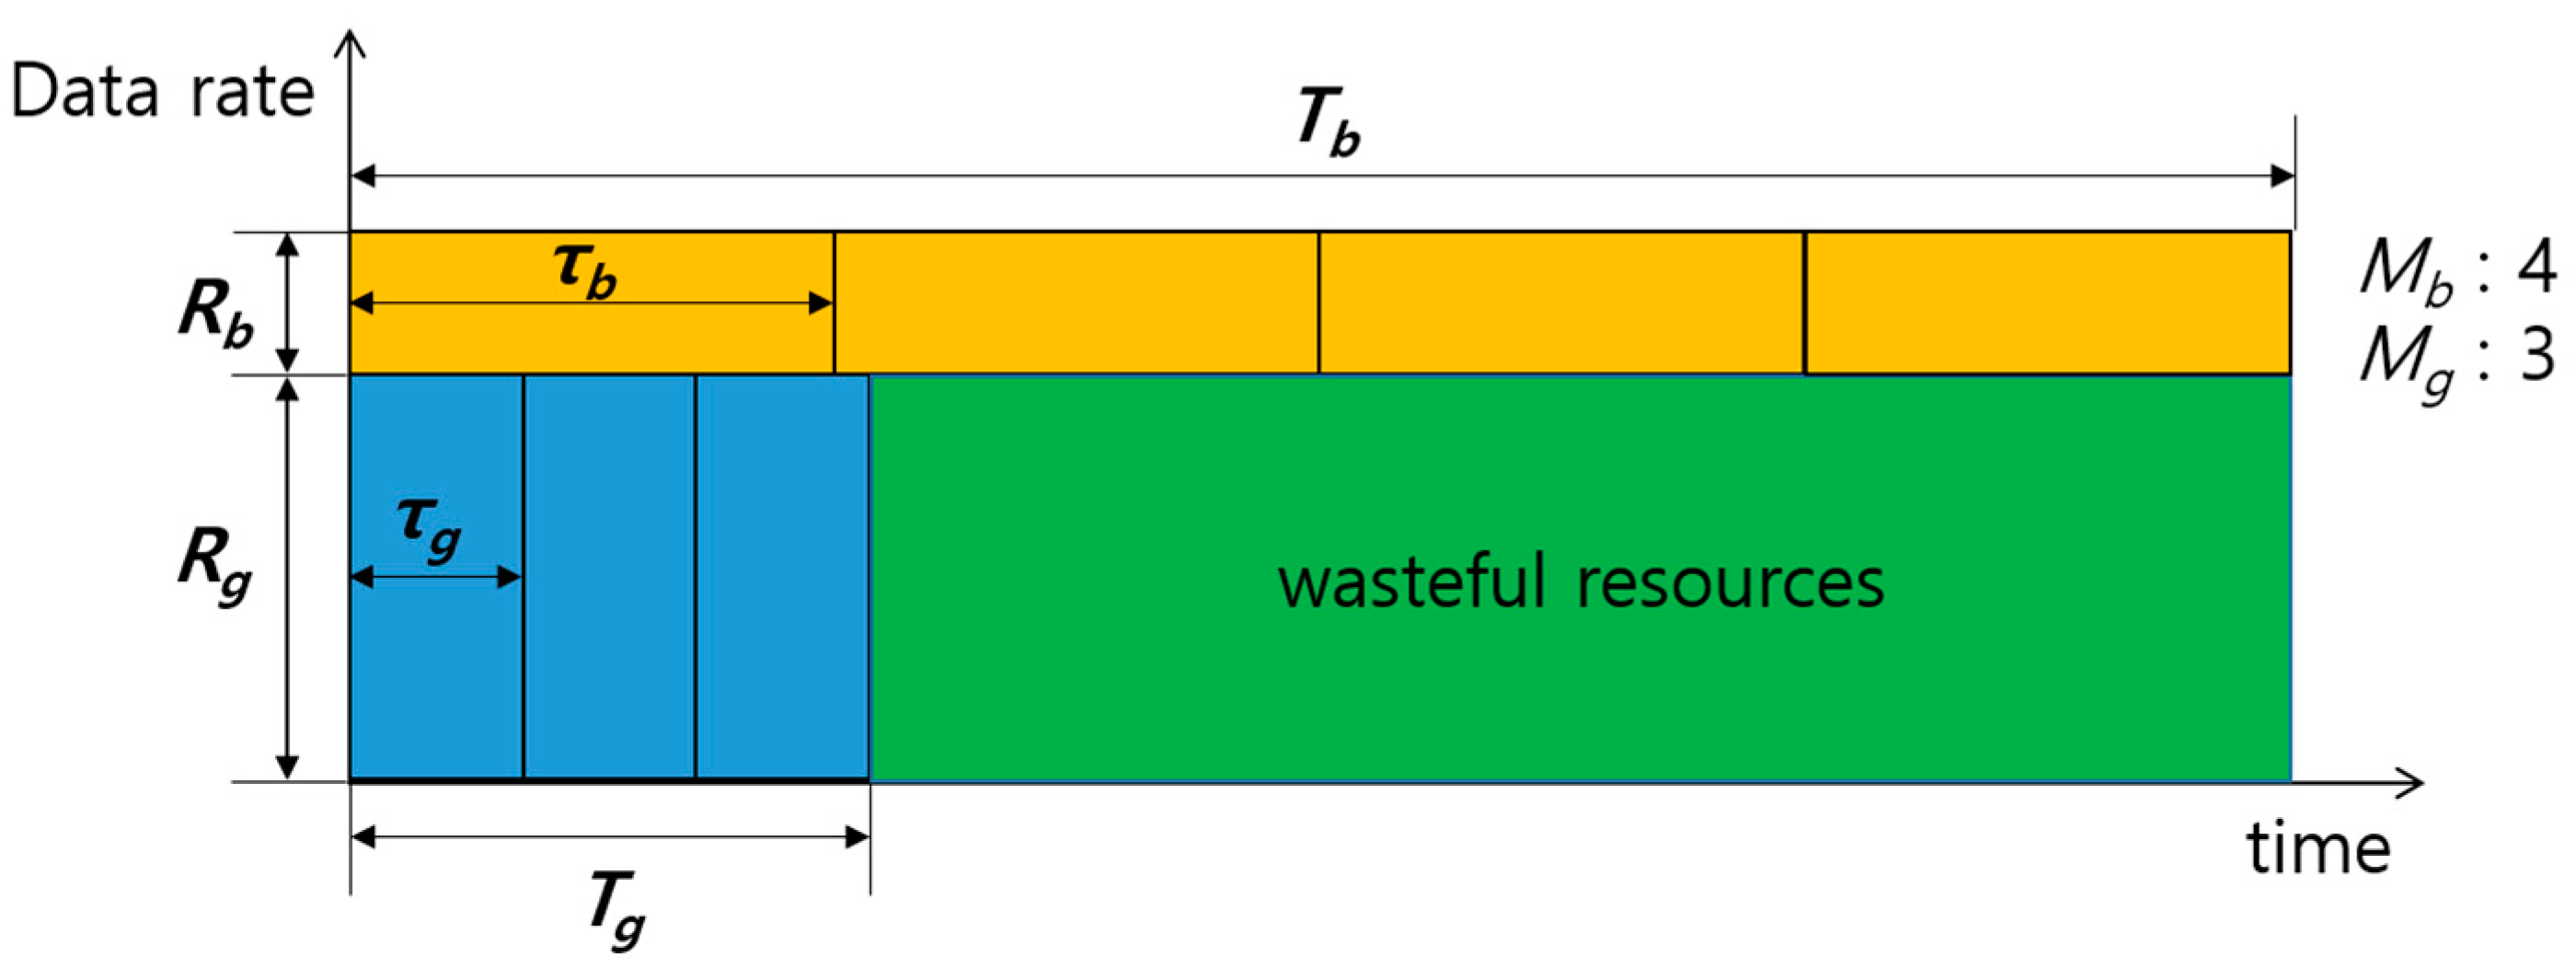
However, since SRM is based on the assumption that paired transmissions last until the end of transmissions, the maximum sum-rate cannot be sustained in the case of unequal transmission times between the paired channels when one of the paired channel completes the transmission before the other. Hence, resource waste occurs while only one channel is in transmission. Resource waste means the resource is available but cannot be used by any other nodes (including the sender node). Especially in UWASNs, resource waste may severely degrade the performance due to the low data rate and long propagation delay.
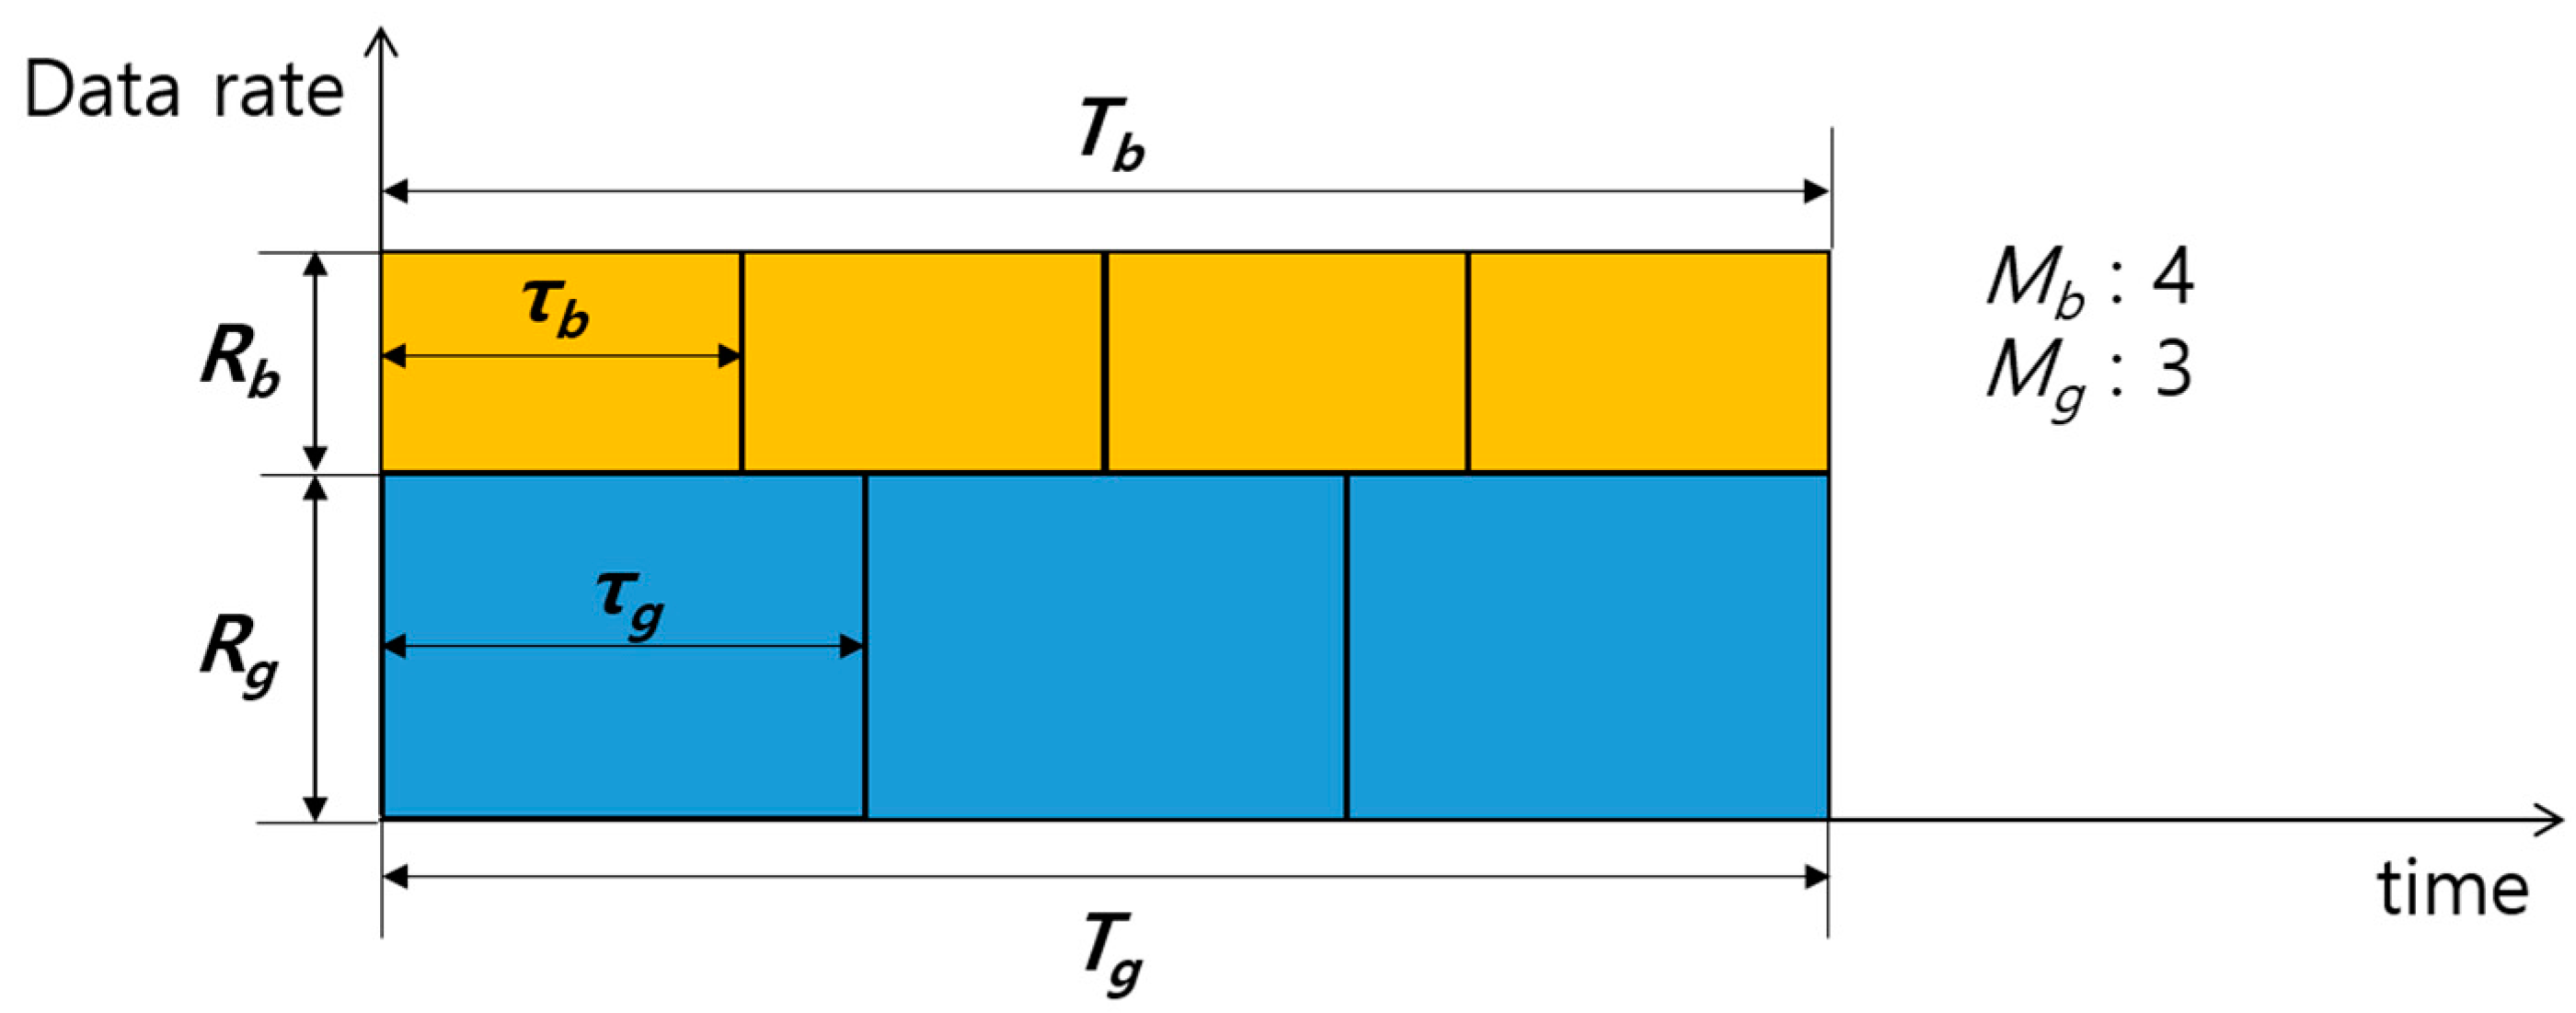
Figure 6 shows an example where resource waste is generated due to unequal transmission times. For simplicity, the packet size in number of bits,
, is considered to be constant. Packet transmission times of nodes G and B, which are denoted by
and
, respectively, are obtained by
Thus, the total transmission times of G and B, which are denoted by
and
, respectively, are obtained by
where
and
are the number of packets transmitted to nodes G and B in the current transmission, respectively. The discrepancy in transmission times,
, causes the aforementioned resource waste. In this case, even though one of the transmissions is complete, to avoid a collision the other nodes cannot use resources for transmitting until the sender nodes’ total transmission time (
) elapse. In general, the sum-rate is maximized when
is much greater than
(i.e.,
) [
15]. Even under such conditions, if the number of packets destined for G and B in the buffer of node S is very large, we can easily make
small enough to be negligible by adjusting
and
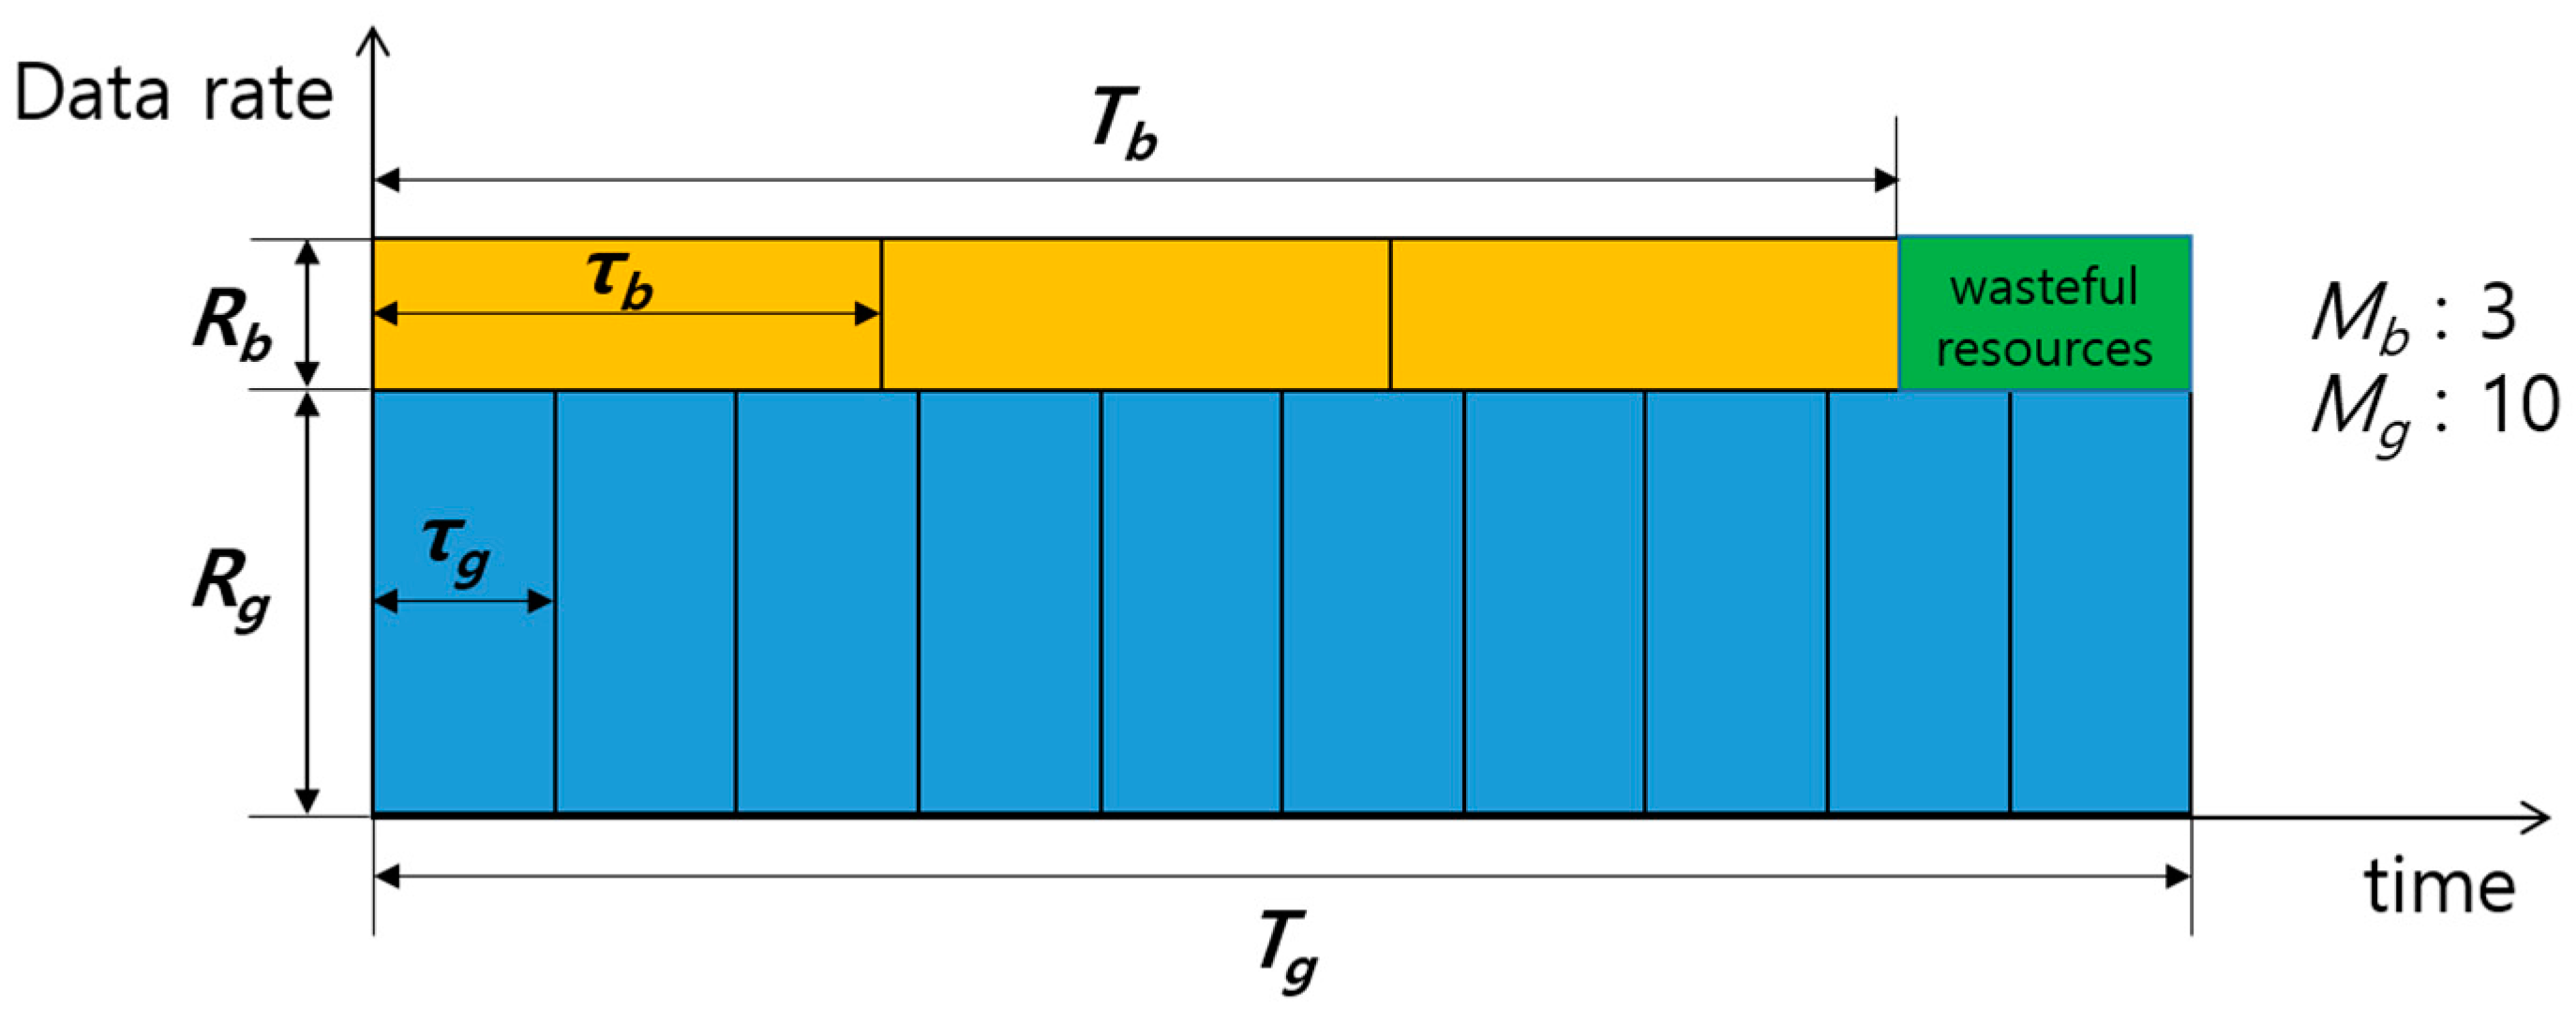
. However, in UWASNs where the traffic generation is infrequent, the number of packets is likely to be small, and thus
could become large, as shown in
Figure 7, where
,
, and
.
Since SRM allocates transmission power without considering and , the discrepancy is unavoidable, and sometimes can be very large. In our proposed ETT, we determine the transmission power that makes and equal, depending on and , to eliminate wasteful resources.
4. Proposed ETT Power Allocation Scheme
Figure 8 presents the equal transmission times of nodes G and B in the proposed ETT under the same condition as
Figure 7. To make
equal to 0 (i.e.,
), the transmission power allocation ratio (
) should be determined to satisfy the following relationship:
However, the obtained from Equation (9) should be located within an operating range of , which guarantees the minimum SNR at which both the nodes, G and B, are capable of decoding the received signal. Thus, we first find the operating range and then choose within the operating range an appropriate associated with Equation (9).
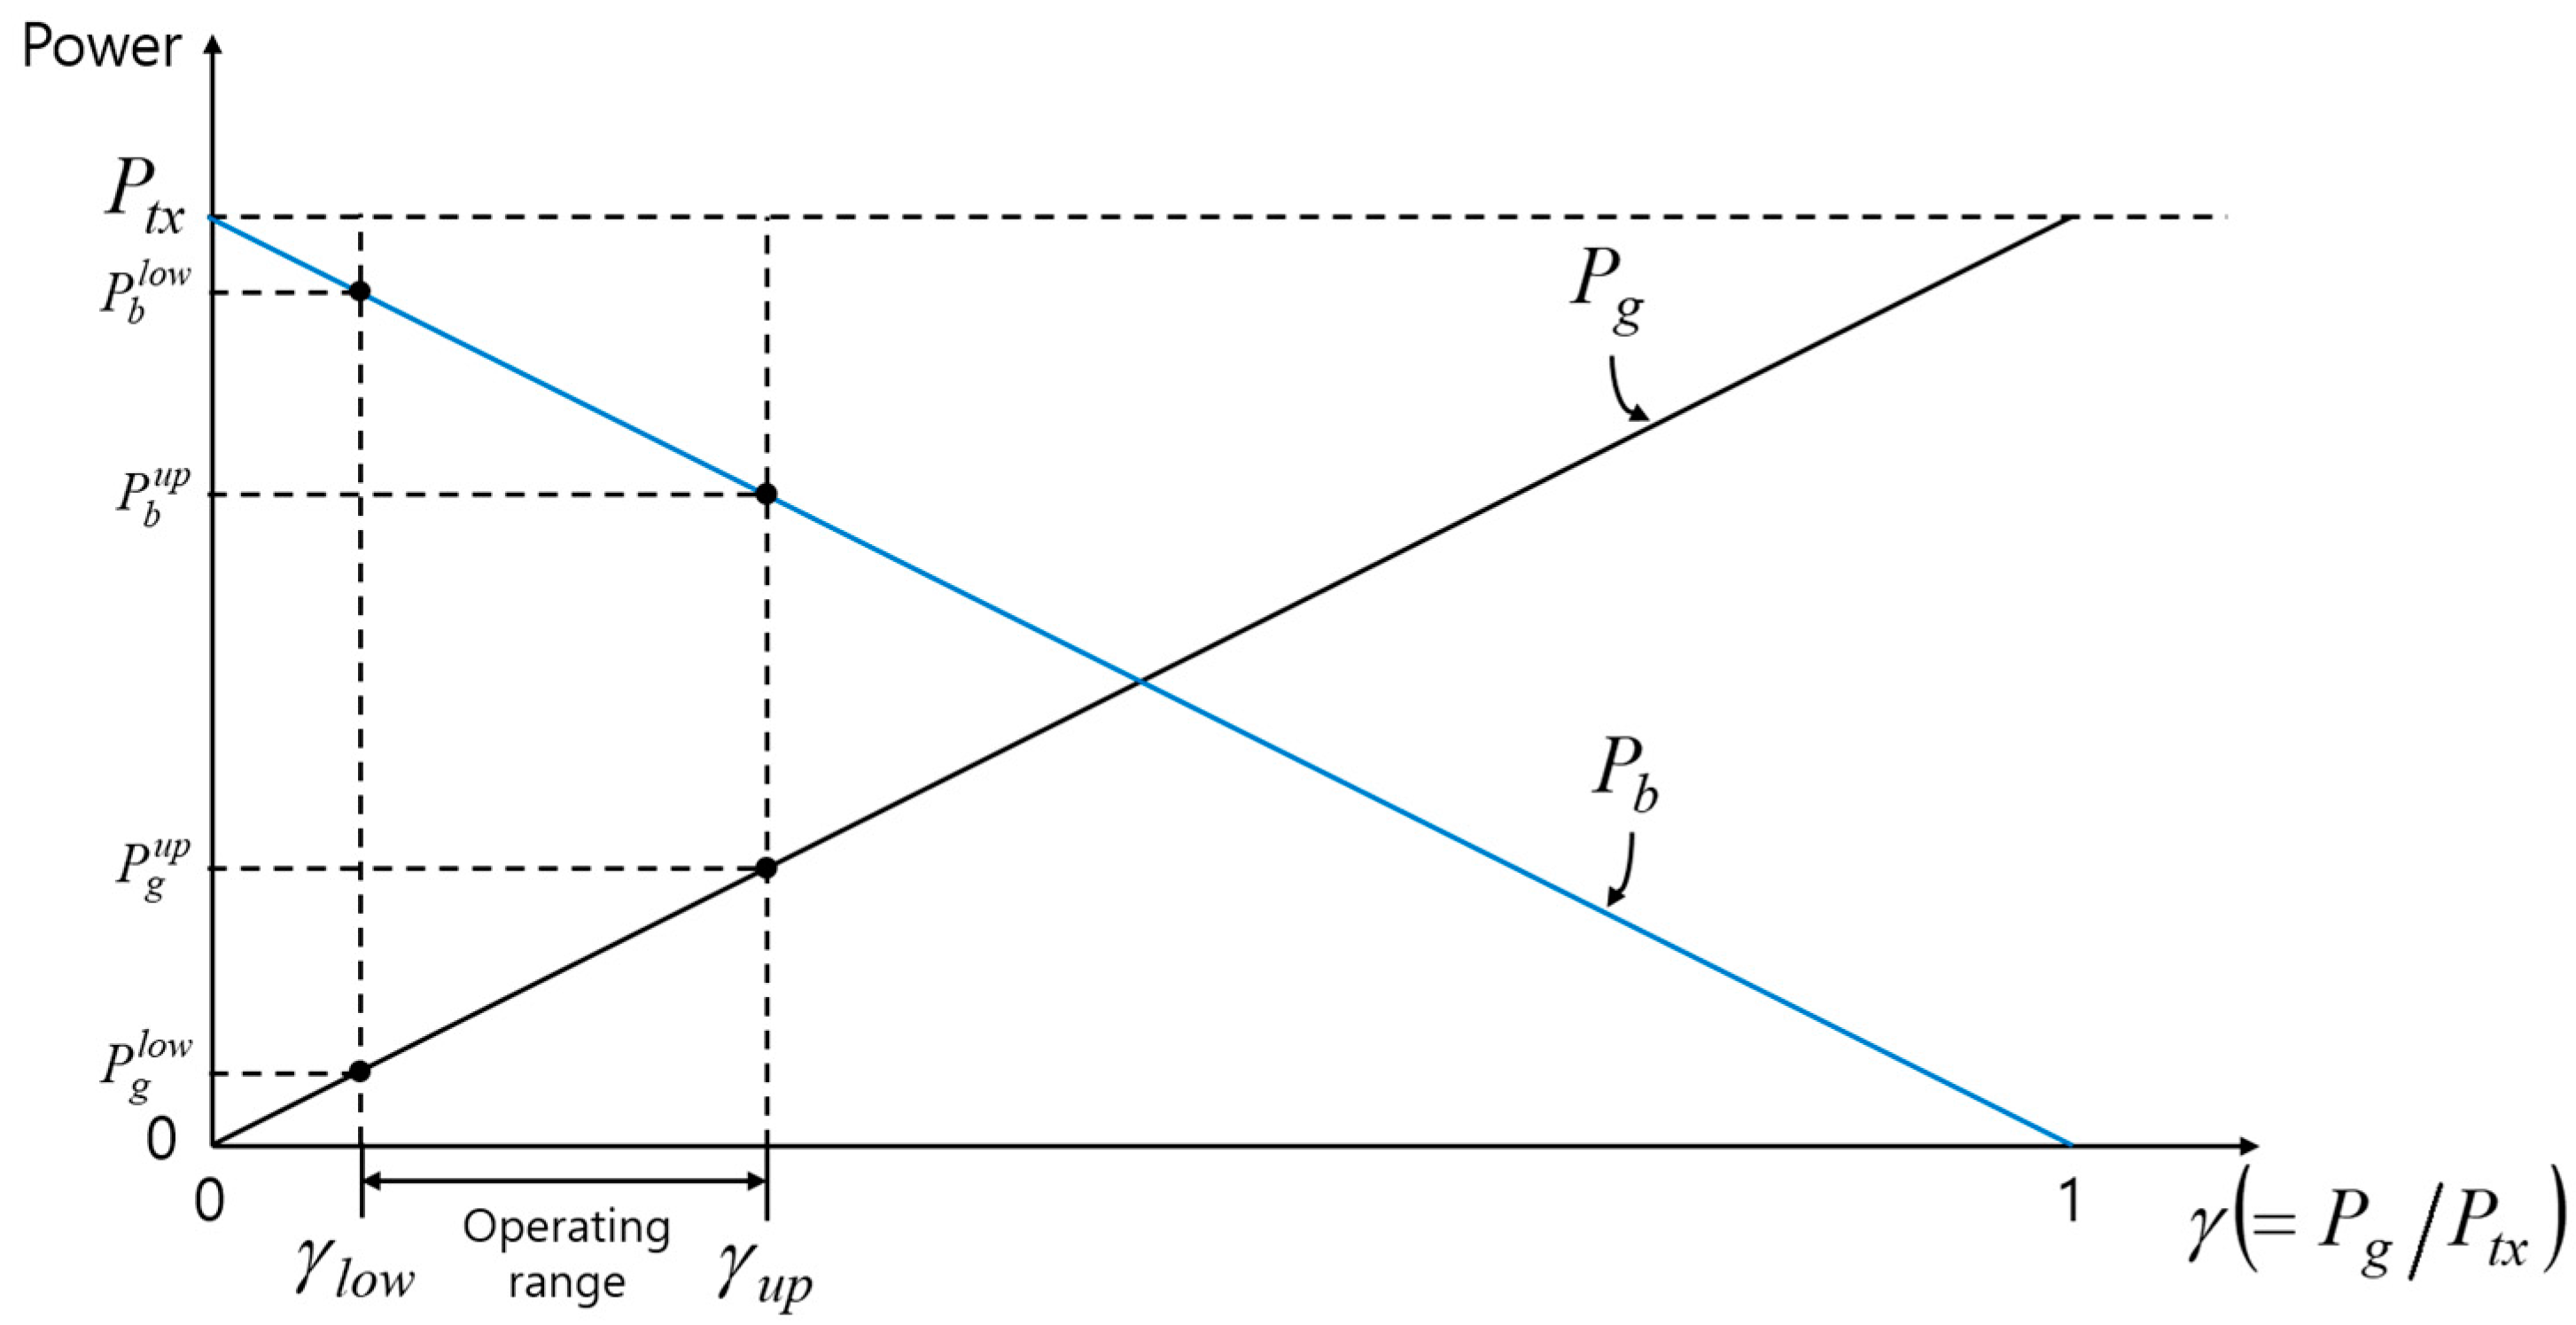
Figure 9 illustrates the relationship between power allocation and operating range. The lower bound and the upper bound of the operating range are denoted by
and
, respectively.
is the point where the SNR of node G (
) becomes the minimum SNR. At the point
, the transmission powers toward nodes G and B are denoted by
and
, respectively. Similarly,
is the point where the SNR of node B (
) becomes the minimum SNR. The corresponding transmission powers to nodes G and B are
and
, respectively. In the following paragraphs, we show how by
and
can be determined.
The SNR of node G at
is obtained by
where
is the frequency bandwidth,
is the PSD of the transmitted signal toward G,
is the attenuation with respect to the distance
and the frequency
,
is the distance between S and G, and
is the PSD of the ambient noise. The PSD of transmission power follows the water-filling principle [
16] given by
where
is a constant depending on the allocated transmission power. Using Equation (11), Equation (10) can be rewritten as
Therefore, from Equation (12),
k is obtained by
where
is newly denoted by
. Then, the transmission power
that corresponds to the minimum SNR at node G is given by
Consequently, the transmission power
at
is obtained by
As a next step, we find the data rates associated with
. According to the Shannon capacity [
17], the data rate
and
at
are given by
where
is the PSD of the transmitted signal to node B at
, and
is the distance between S and B. Similar to the case of
, we find the corresponding power and the data rate at
. First, the SNR of node B at
is obtained by
Unlike the case of the
, the denominator of Equation (18) is the overall noise at B, which is the sum of the attenuated
and the ambient noise. If we substitute the denominator of Equation (18) with
, Equation (18) can be rewritten as
where
is the parameter
of Equation (13) for the case of
. Then,
is obtained as
Thus, the
and the
are obtained by
The data rates and are obtained in the same way as Equations (16) and (17).
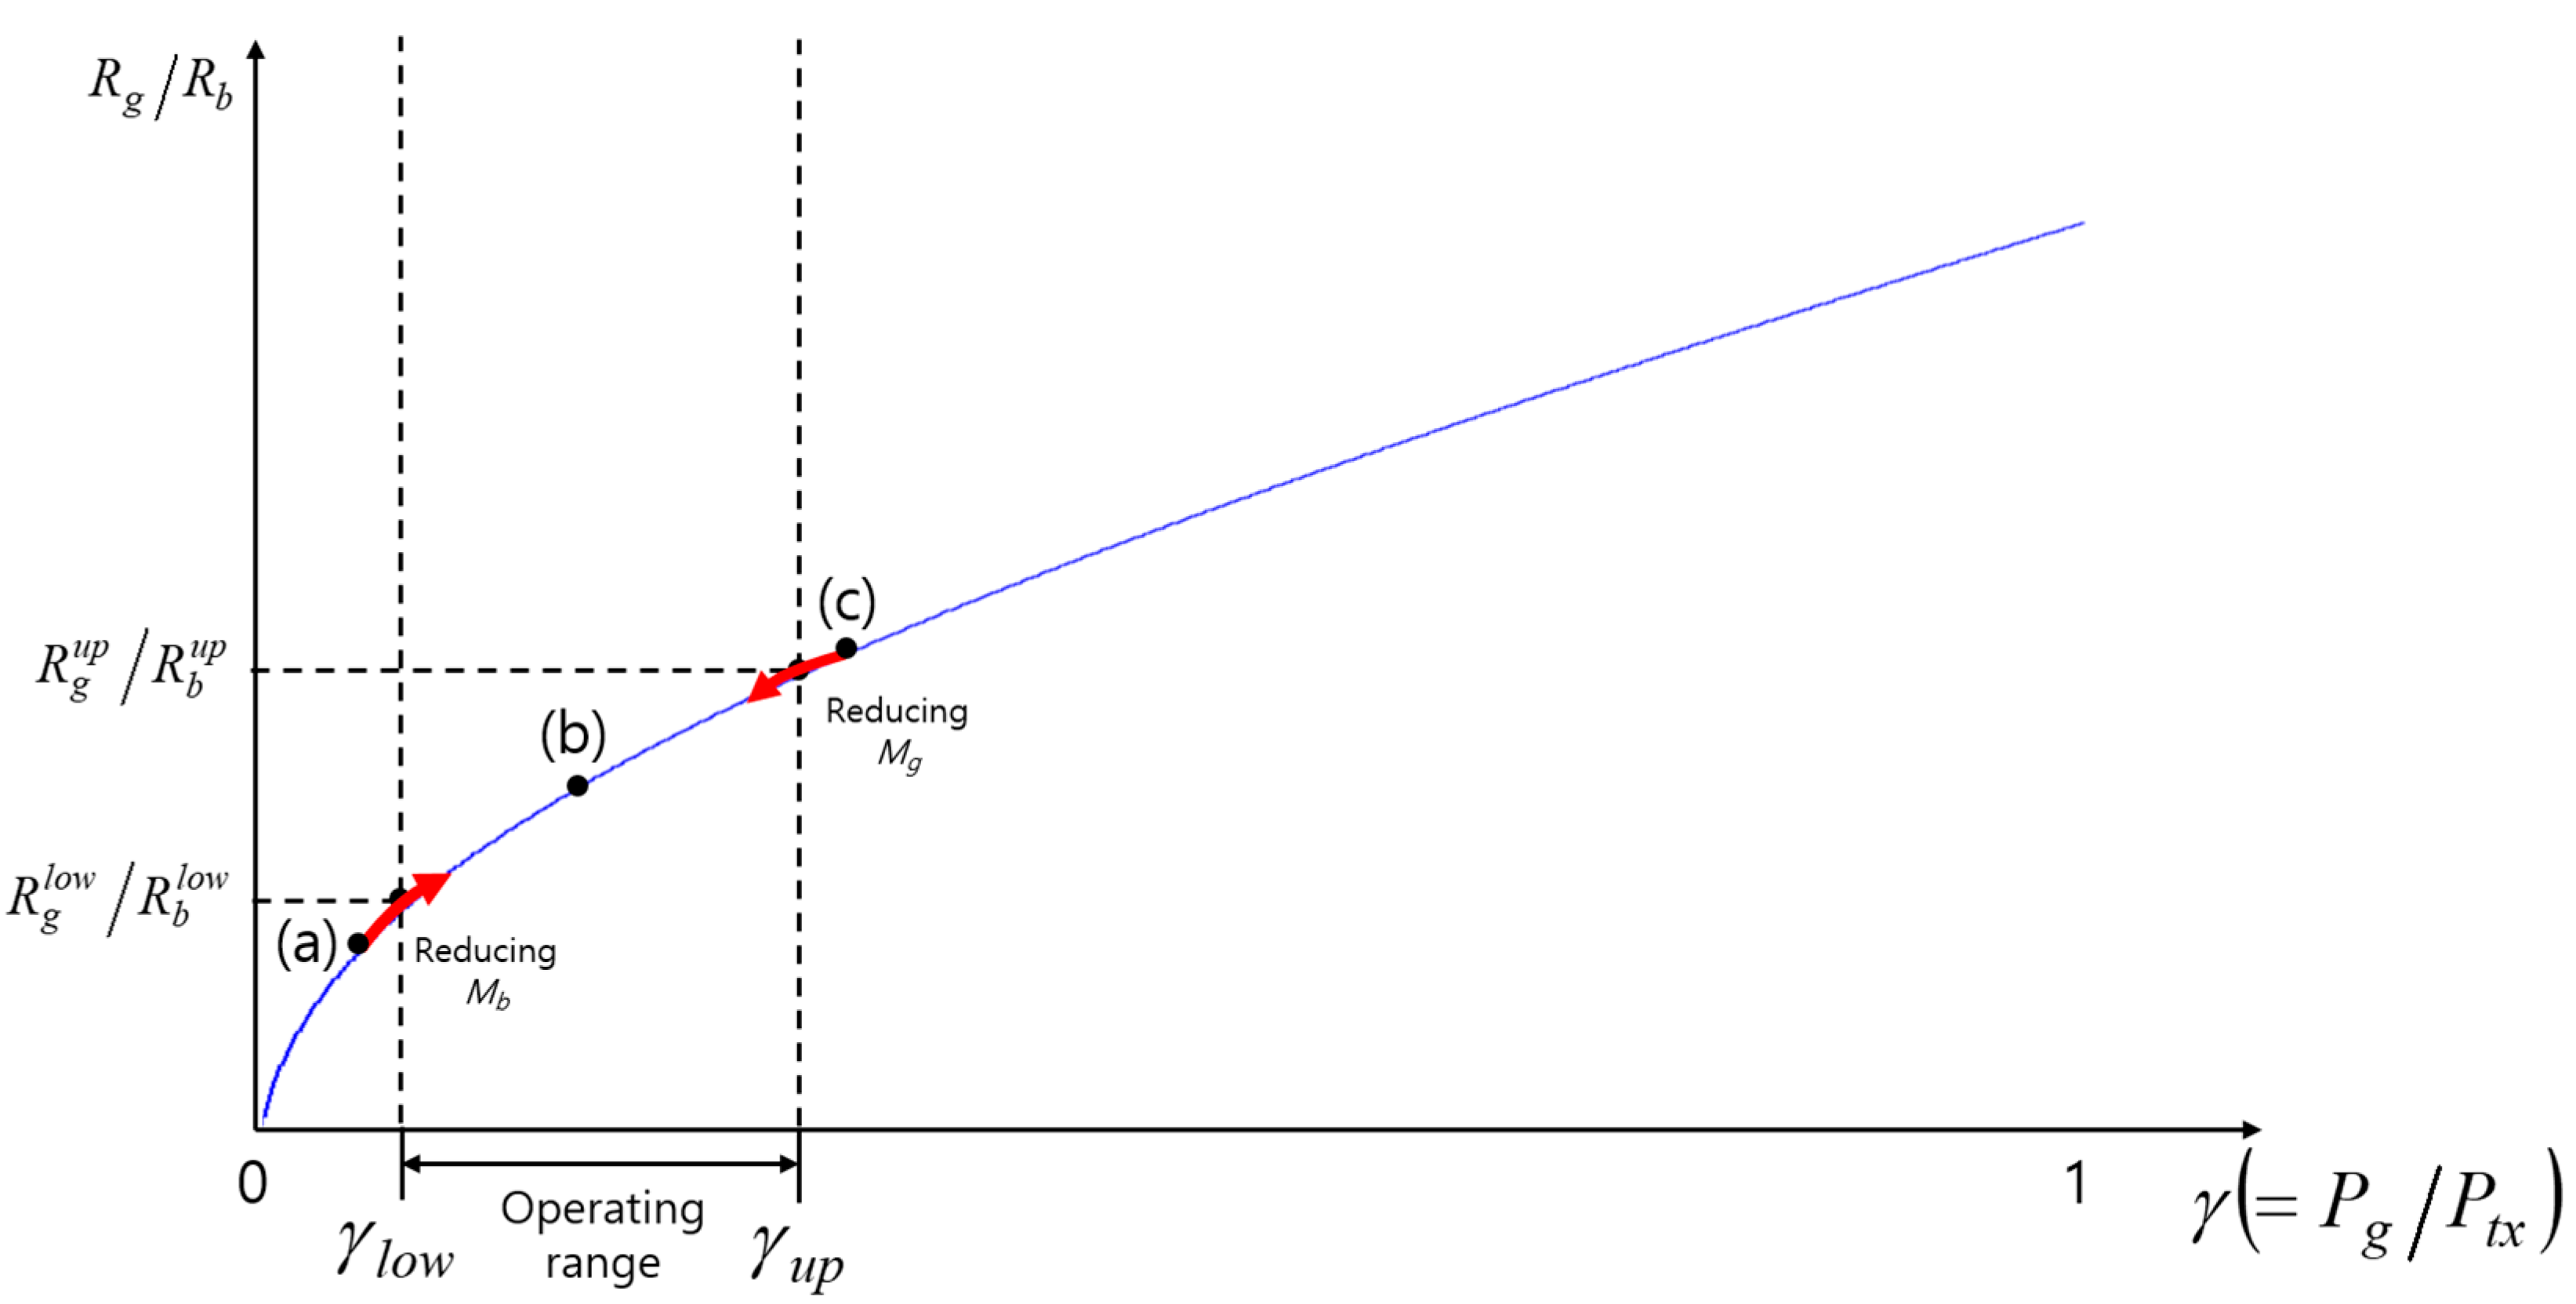
Figure 10 shows the change of the data rates ratio (
) with varying
. If the ratio,
, obtained from Equation (9) when
and
are chosen to carry all the packets waiting in the buffers destined for nodes G and B, respectively, falls within the operating range of
(case (b)), we only have to choose the corresponding transmit power. On the other hand, if the ratio
falls outside the operating range (left-hand side of
(case (a)) or right-hand side of
(case (c))), we keep reducing
for case (a) or
for case (c) by 1 until the ratio
falls within the operating range.
5. Numerical Results
In this section, we analyze the performance of ETT compared to SRM. The parameters we used are summarized in
Table 1.
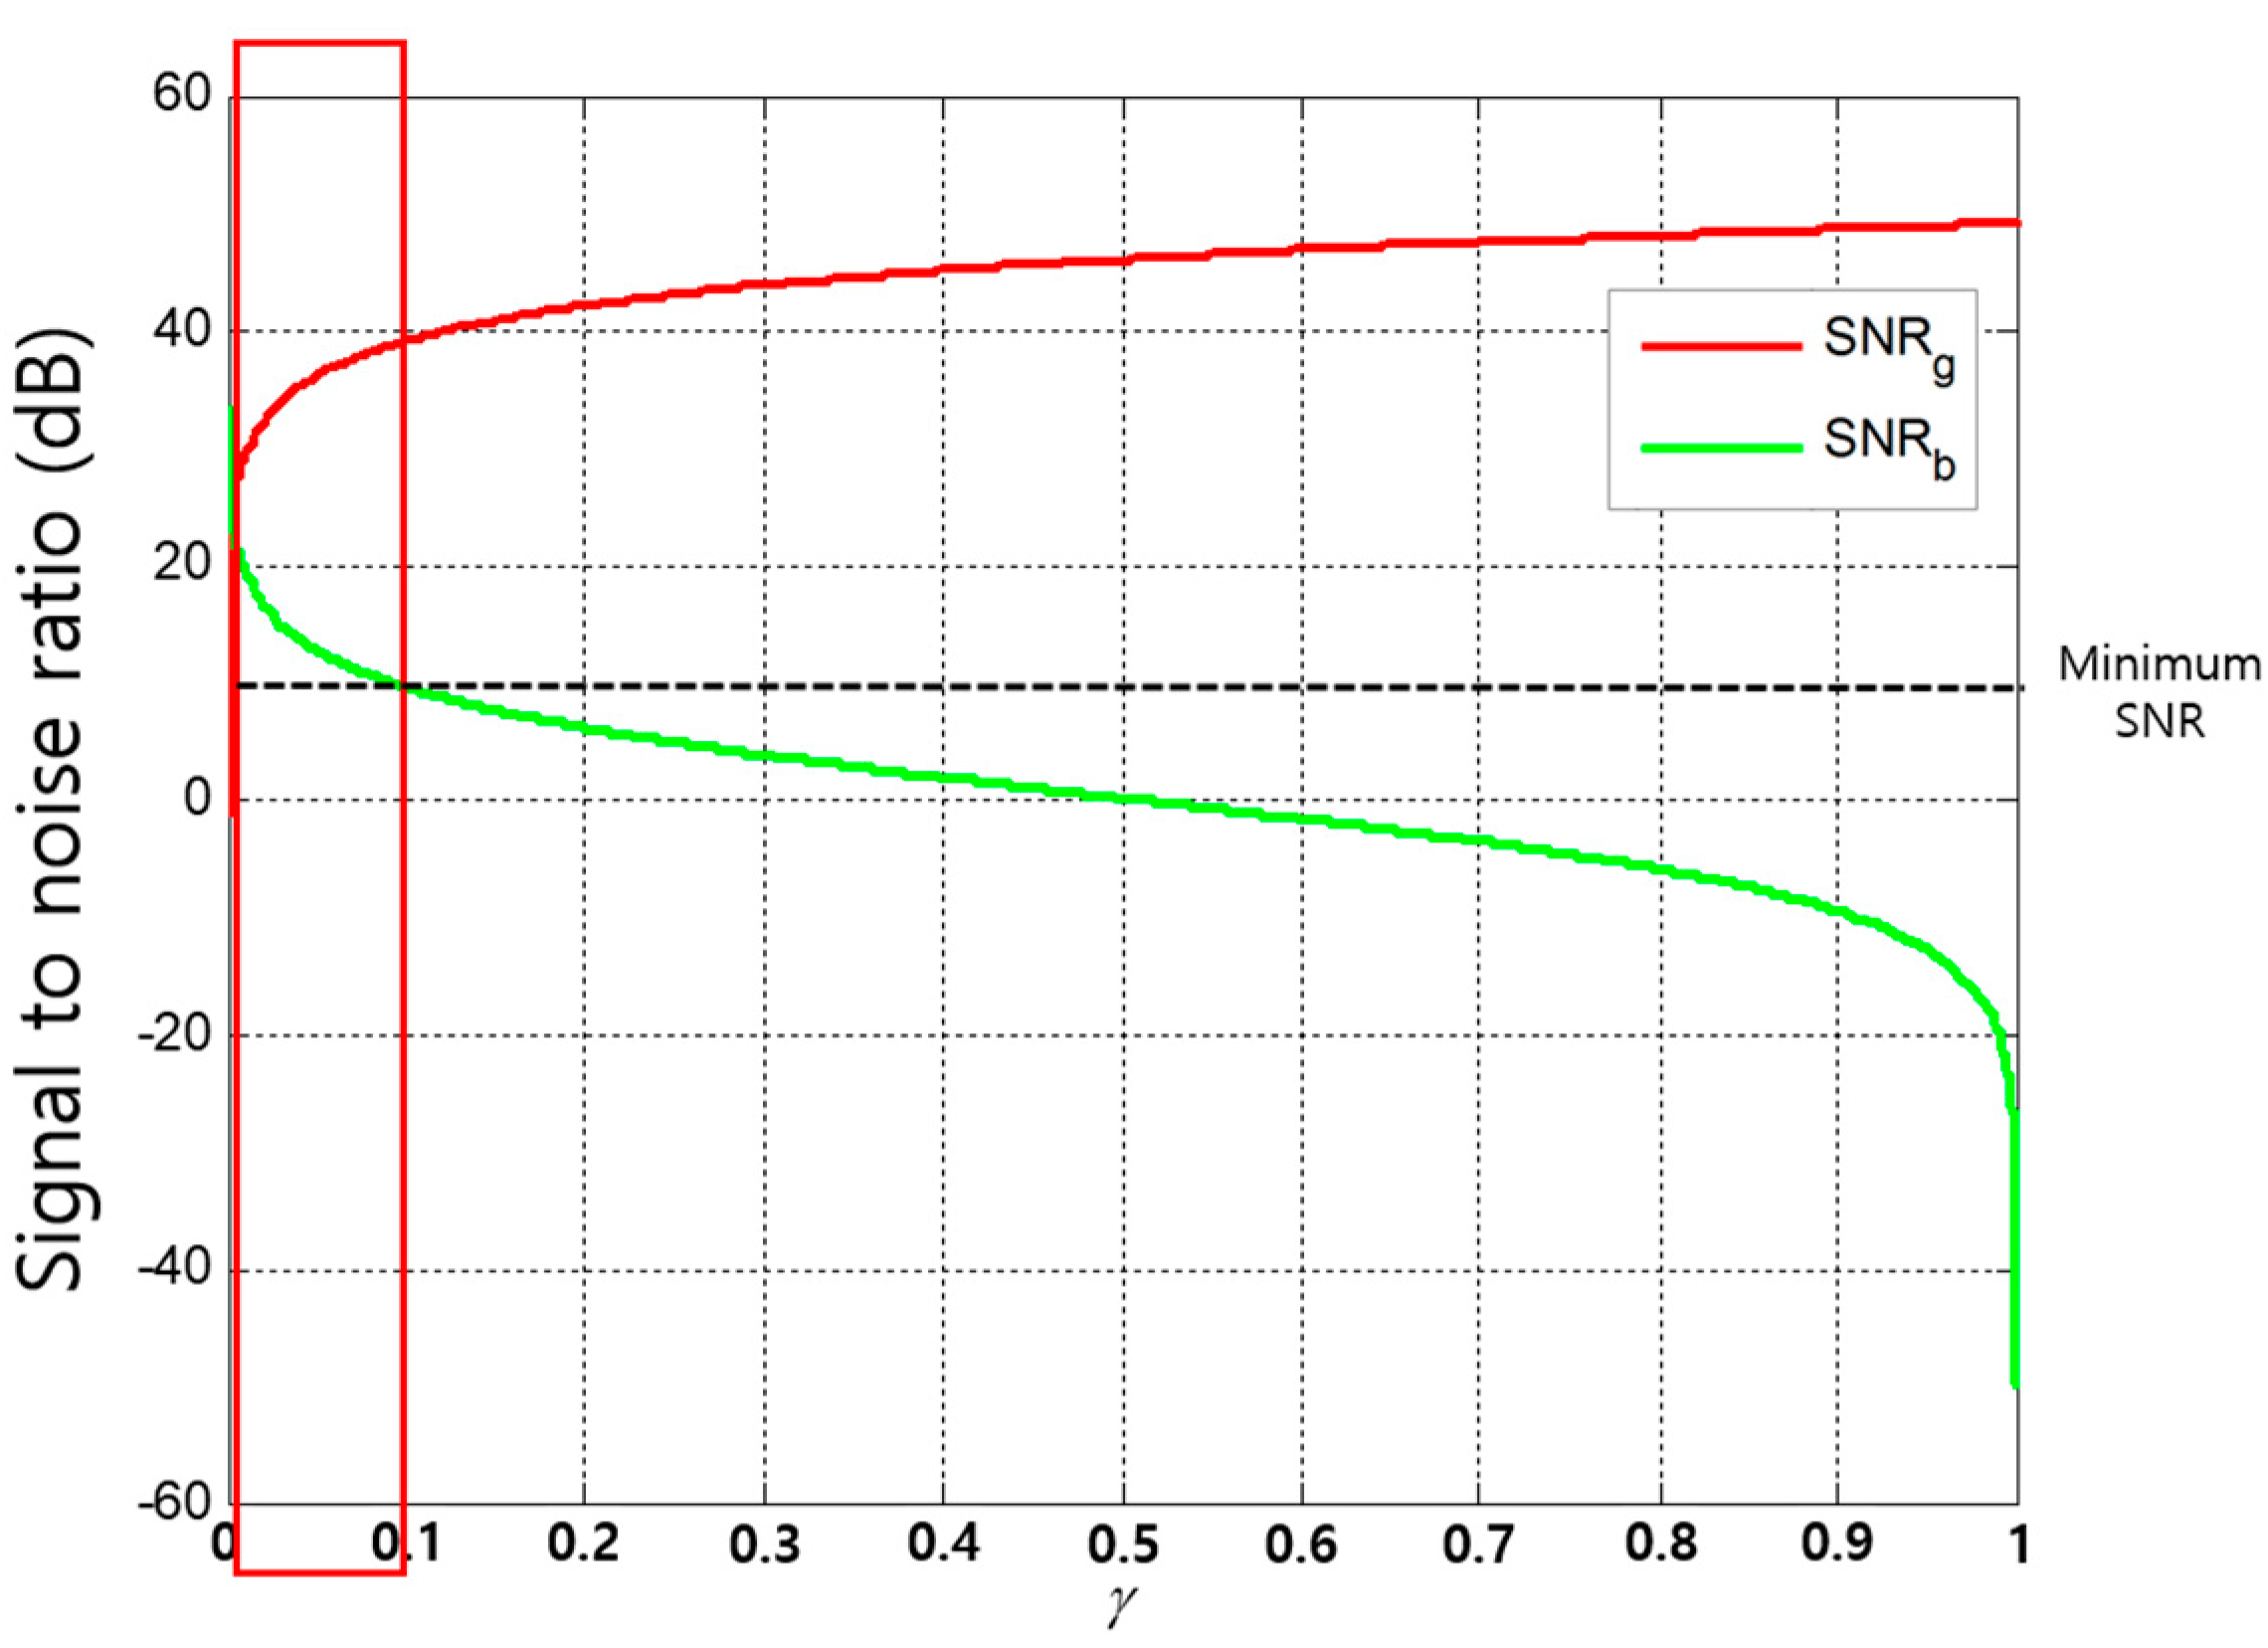
Figure 11 shows the variation of each receiver node’s SNR with varying
. In this analysis, for the minimum SNR of 10 dB, we observe that the operating range of
for the underwater NOMA to be a very narrow range (rectangular outline in
Figure 11), unlike the terrestrial NOMA, because of the severe attenuation related to the communication distance and the frequency, which are prevalent issues in the underwater channel.
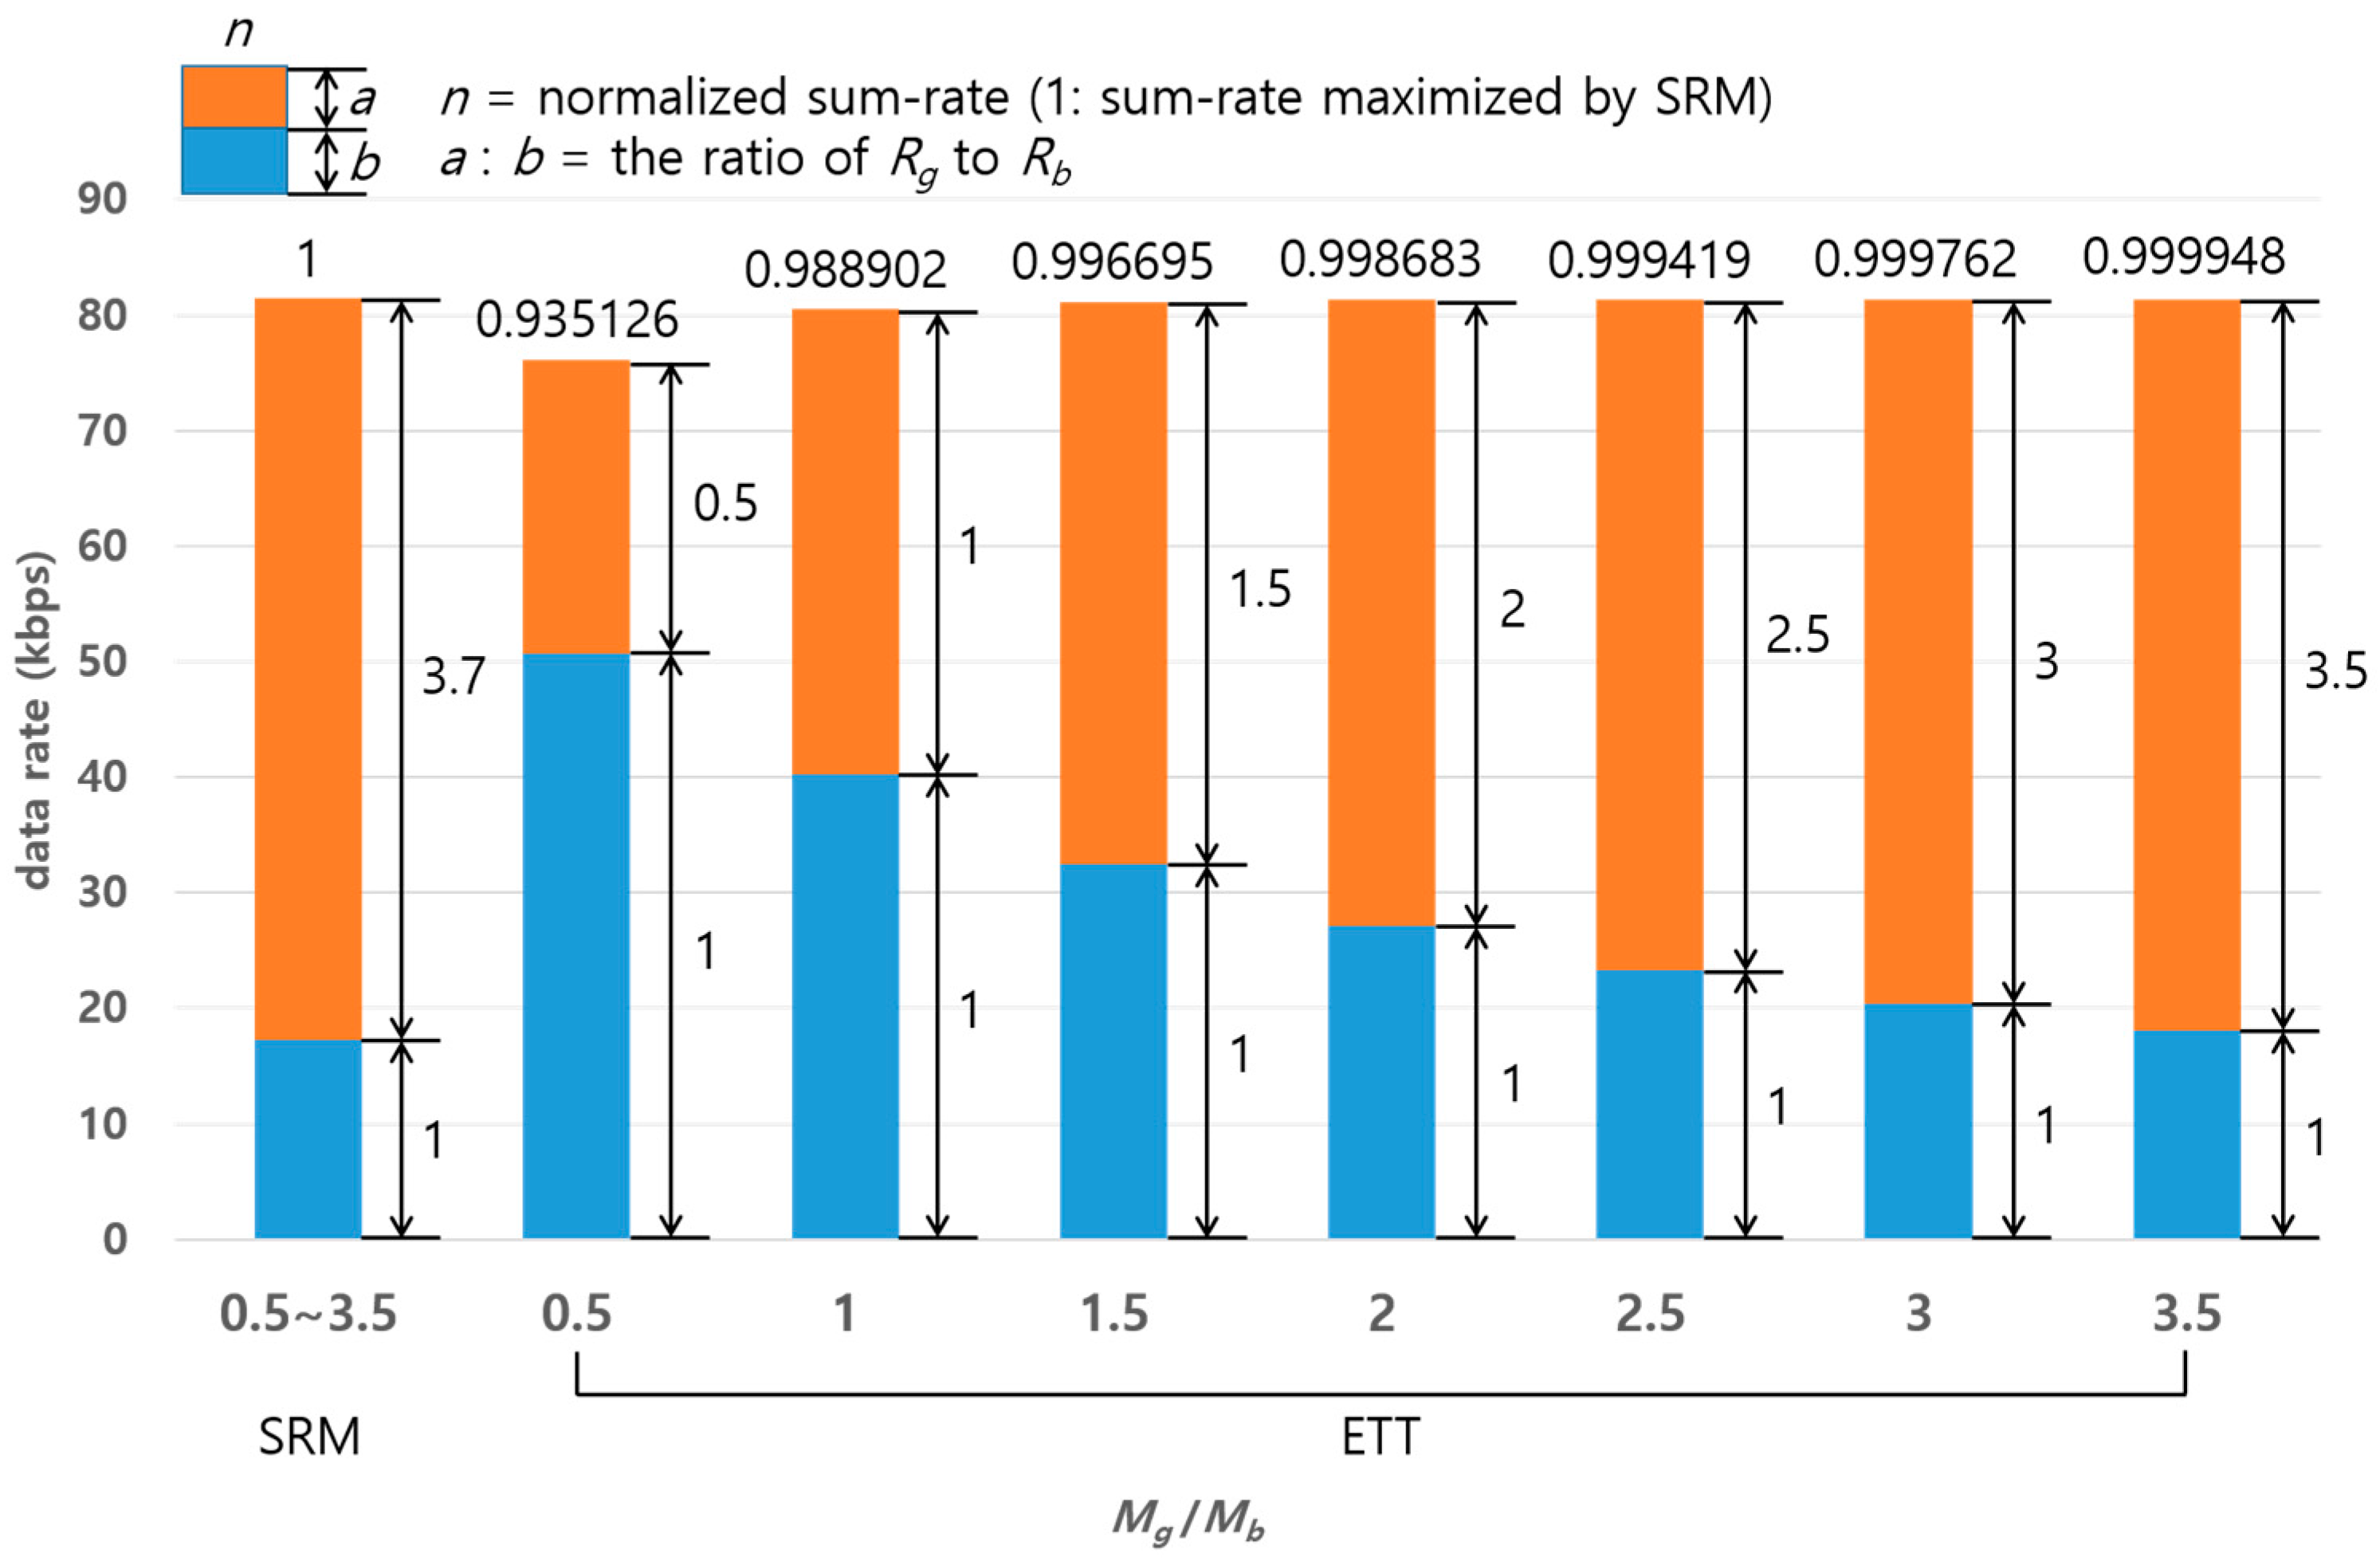
Figure 12 shows a comparison of SRM and ETT in terms of sum-rate varying the packet ratio (
). The numbers on the top of the bars indicate the sum-rate normalized by the maximum sum-rate of SRM. Meanwhile, the numbers on the side of the bars indicate the ratio of data rate of
(upper) and
(lower). The numbers on the botton of the bar indicates the packet ratio
. It is shown that the normalized sum-rate of ETT is approximately equivalent to that of SRM even supporting various data rate ratios (
) led by the packet ratio (
). On the other hand, SRM can achieve the maximum sum-rate under a specific condition of data rate which is 3.7:1 in this example regardless of
. Thus, if the packet ratio does not meet the data rate ratio 3.7:1, SRM’s sum-rate cannot be fully utilized. Note that the reason why ETT has comparatively low sum-rate at 0.5 of
in this analysis is that NOMA inherently shows a better performance when a higher power is allocated to a good quality channel.
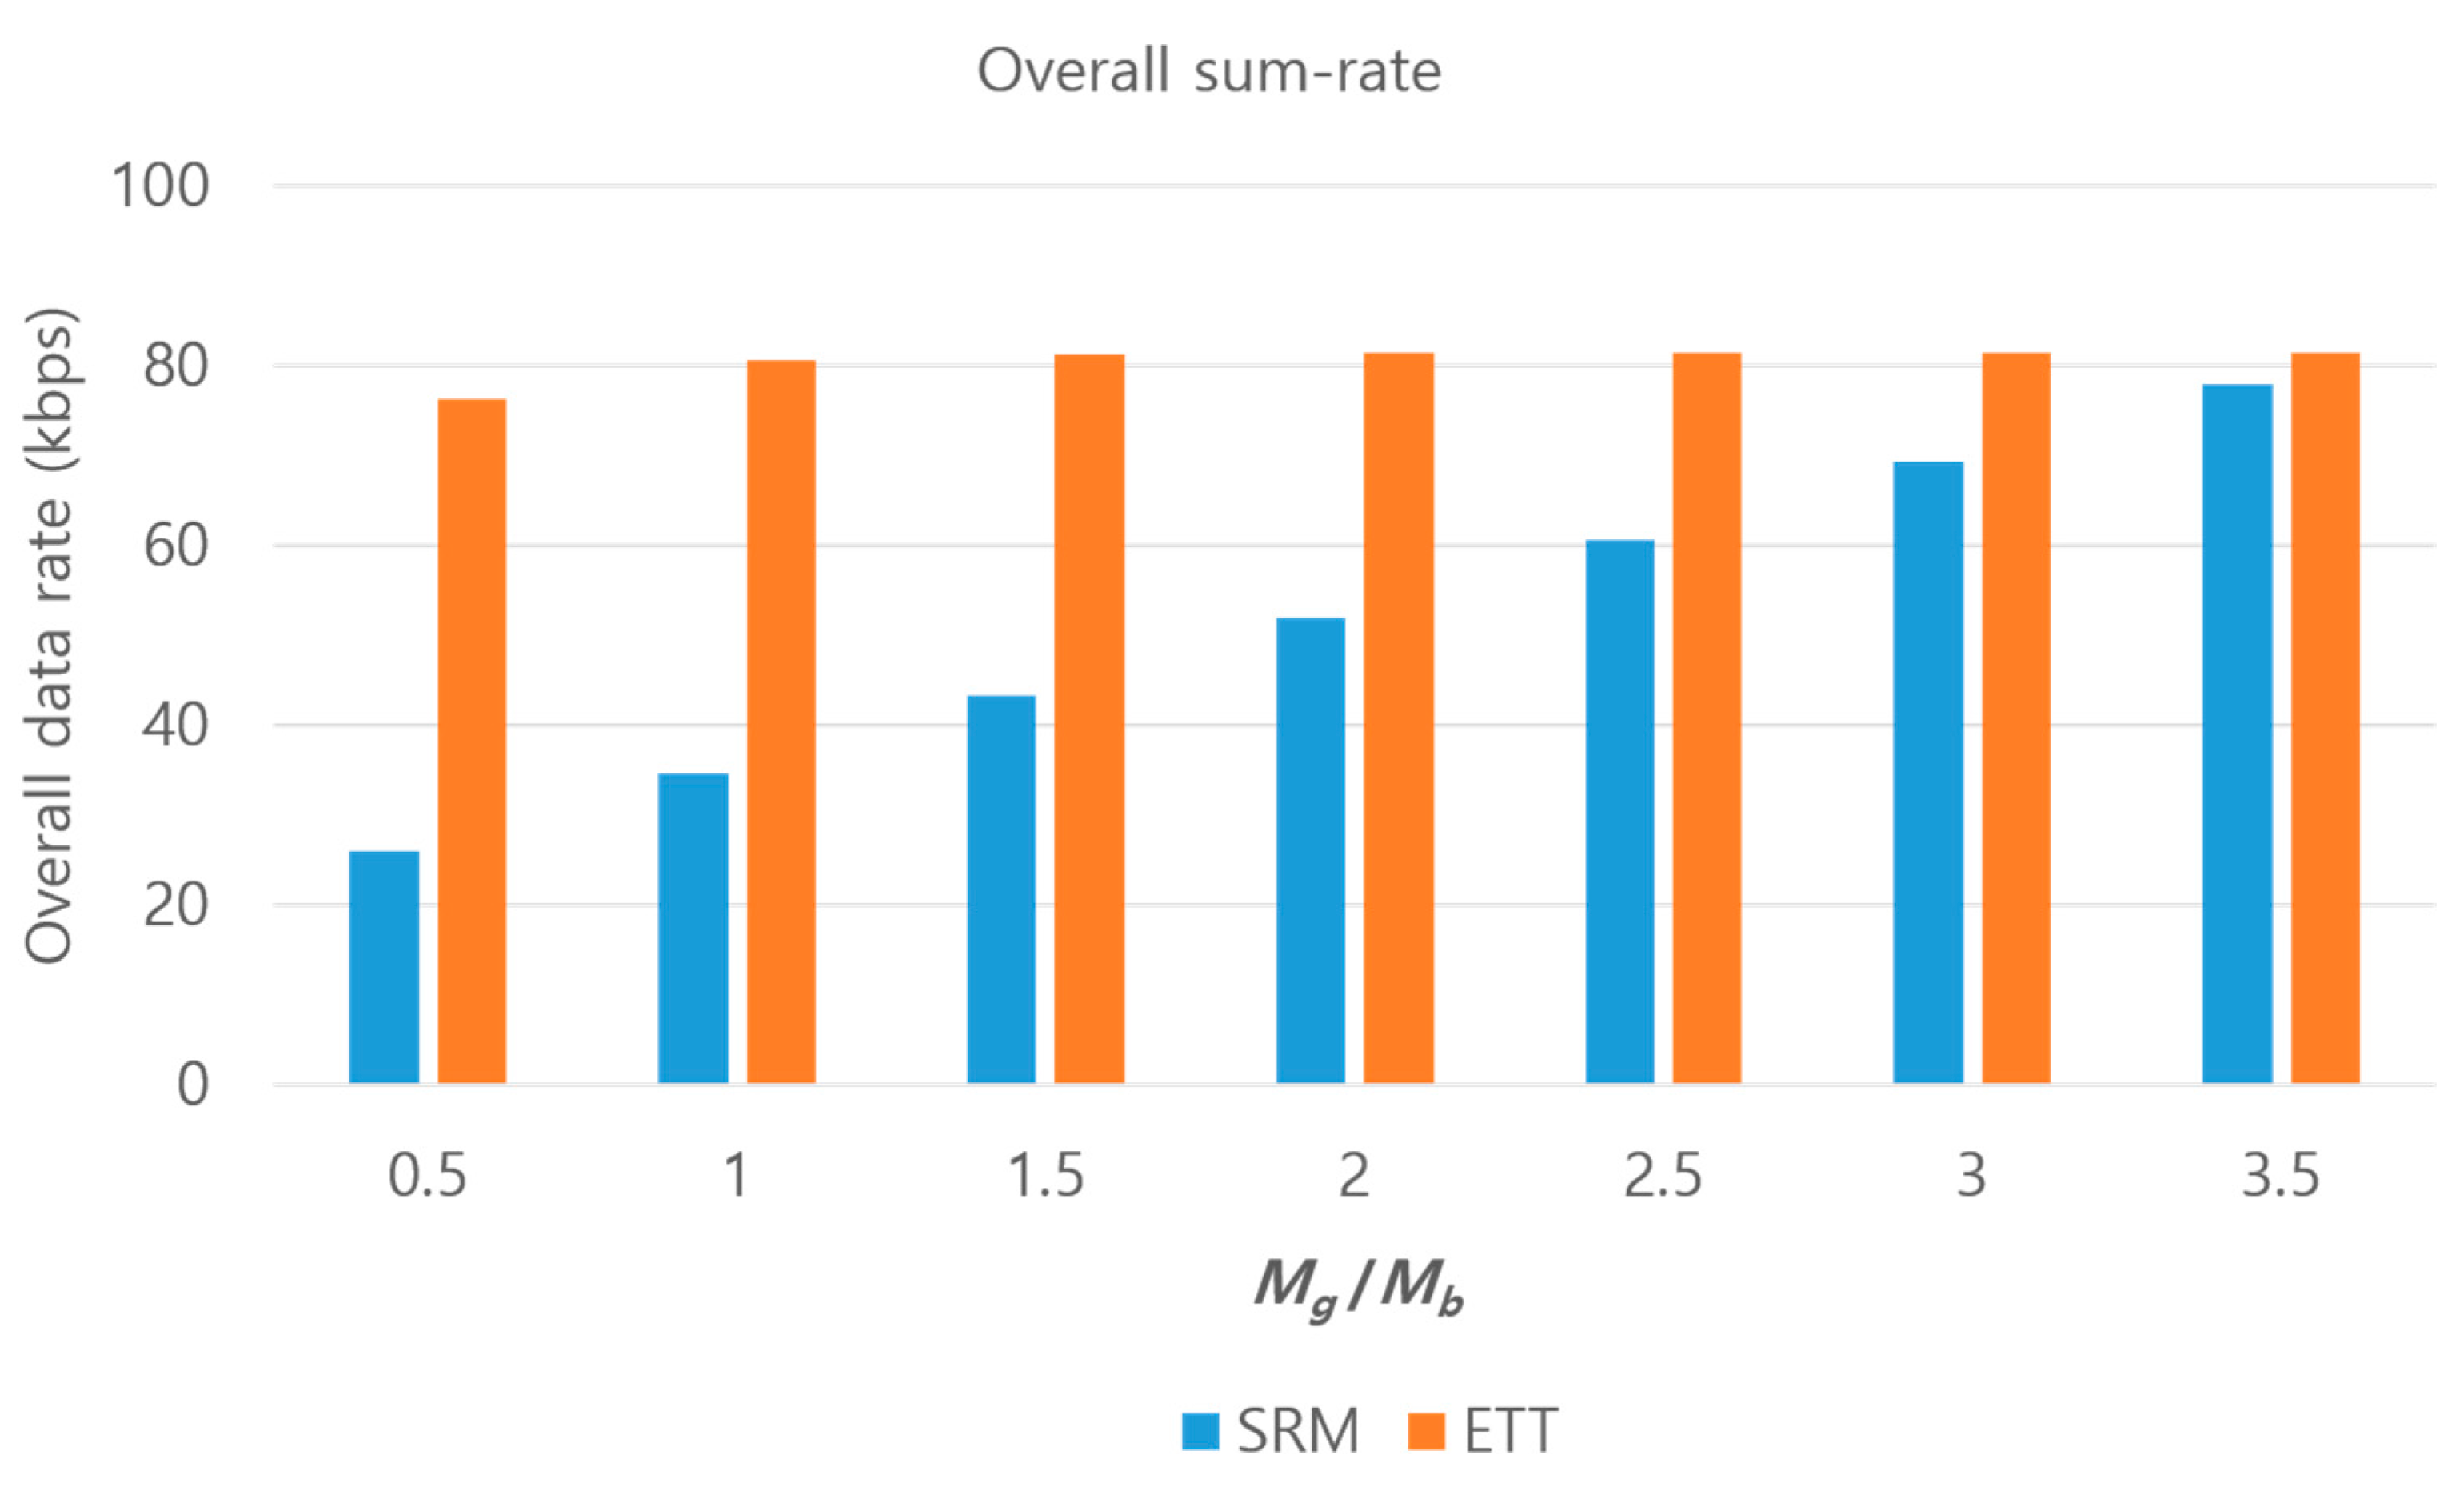
Naturally, the transmission times
and
are different. Thus, from the point of view of this paper, the overall sum-rate is defined by
Figure 13 shows the comparison in terms of the overall sum-rate. We observed that ETT outperforms SRM; especially when
is small, the performance difference becomes larger because the transmission times discrepancy,
, becomes larger under the condition of
. ETT finds the appropriate
, depending on the number of packets, as well as guaranteeing equal transmission times and thus mitigates the occurrence of wasteful resources.
6. Conclusions
In this paper, we proposed an ETT power allocation scheme for resolving the overall sum-rate degradation issues related to the SRM power allocation scheme in UWASNs. Unlike SRM, the proposed ETT finds an appropriate transmission power for each paired channel to guarantee equal transmission times considering the number of packets to each transmission path. As a result, ETT can eliminate wasteful resources through equal transmission times. Numerical analysis shows that while the sum-rate is analogous to that of SRM, the overall sum-rate of ETT is much larger than that of SRM for varying packet ratio scenarios.
Most studies on MAC protocols for UWASNs have focused on how to apply OMA protocols to the underwater channel. Thus, these studies have exclusively provided the solution for assigning and using limited resources. However, we believe that the NOMA protocol that allows a simultaneous sharing of an identical resource according to the channel gain difference can present an advanced solution for UWASNs which experience a severe attenuation according to distance. The performance of NOMA is determined by node pairing and power allocation. Our proposed power allocation scheme will be helpful in solving the issues of overall sum-rate degradation for the low traffic underwater channel.
In this paper, we dealt with the situation of two receiver nodes downlink NOMA. However, with the same concept of ETT, N receiver nodes downlink NOMA will be able to operate without significant complexity. To further our research, we intend to extend ETT to general N receiver nodes downlink NOMA.


