A Multi-Fluorescent DNA/Graphene Oxide Conjugate Sensor for Signature-Based Protein Discrimination


Abstract
:1. Introduction
2. Materials and Methods
2.1. Materials
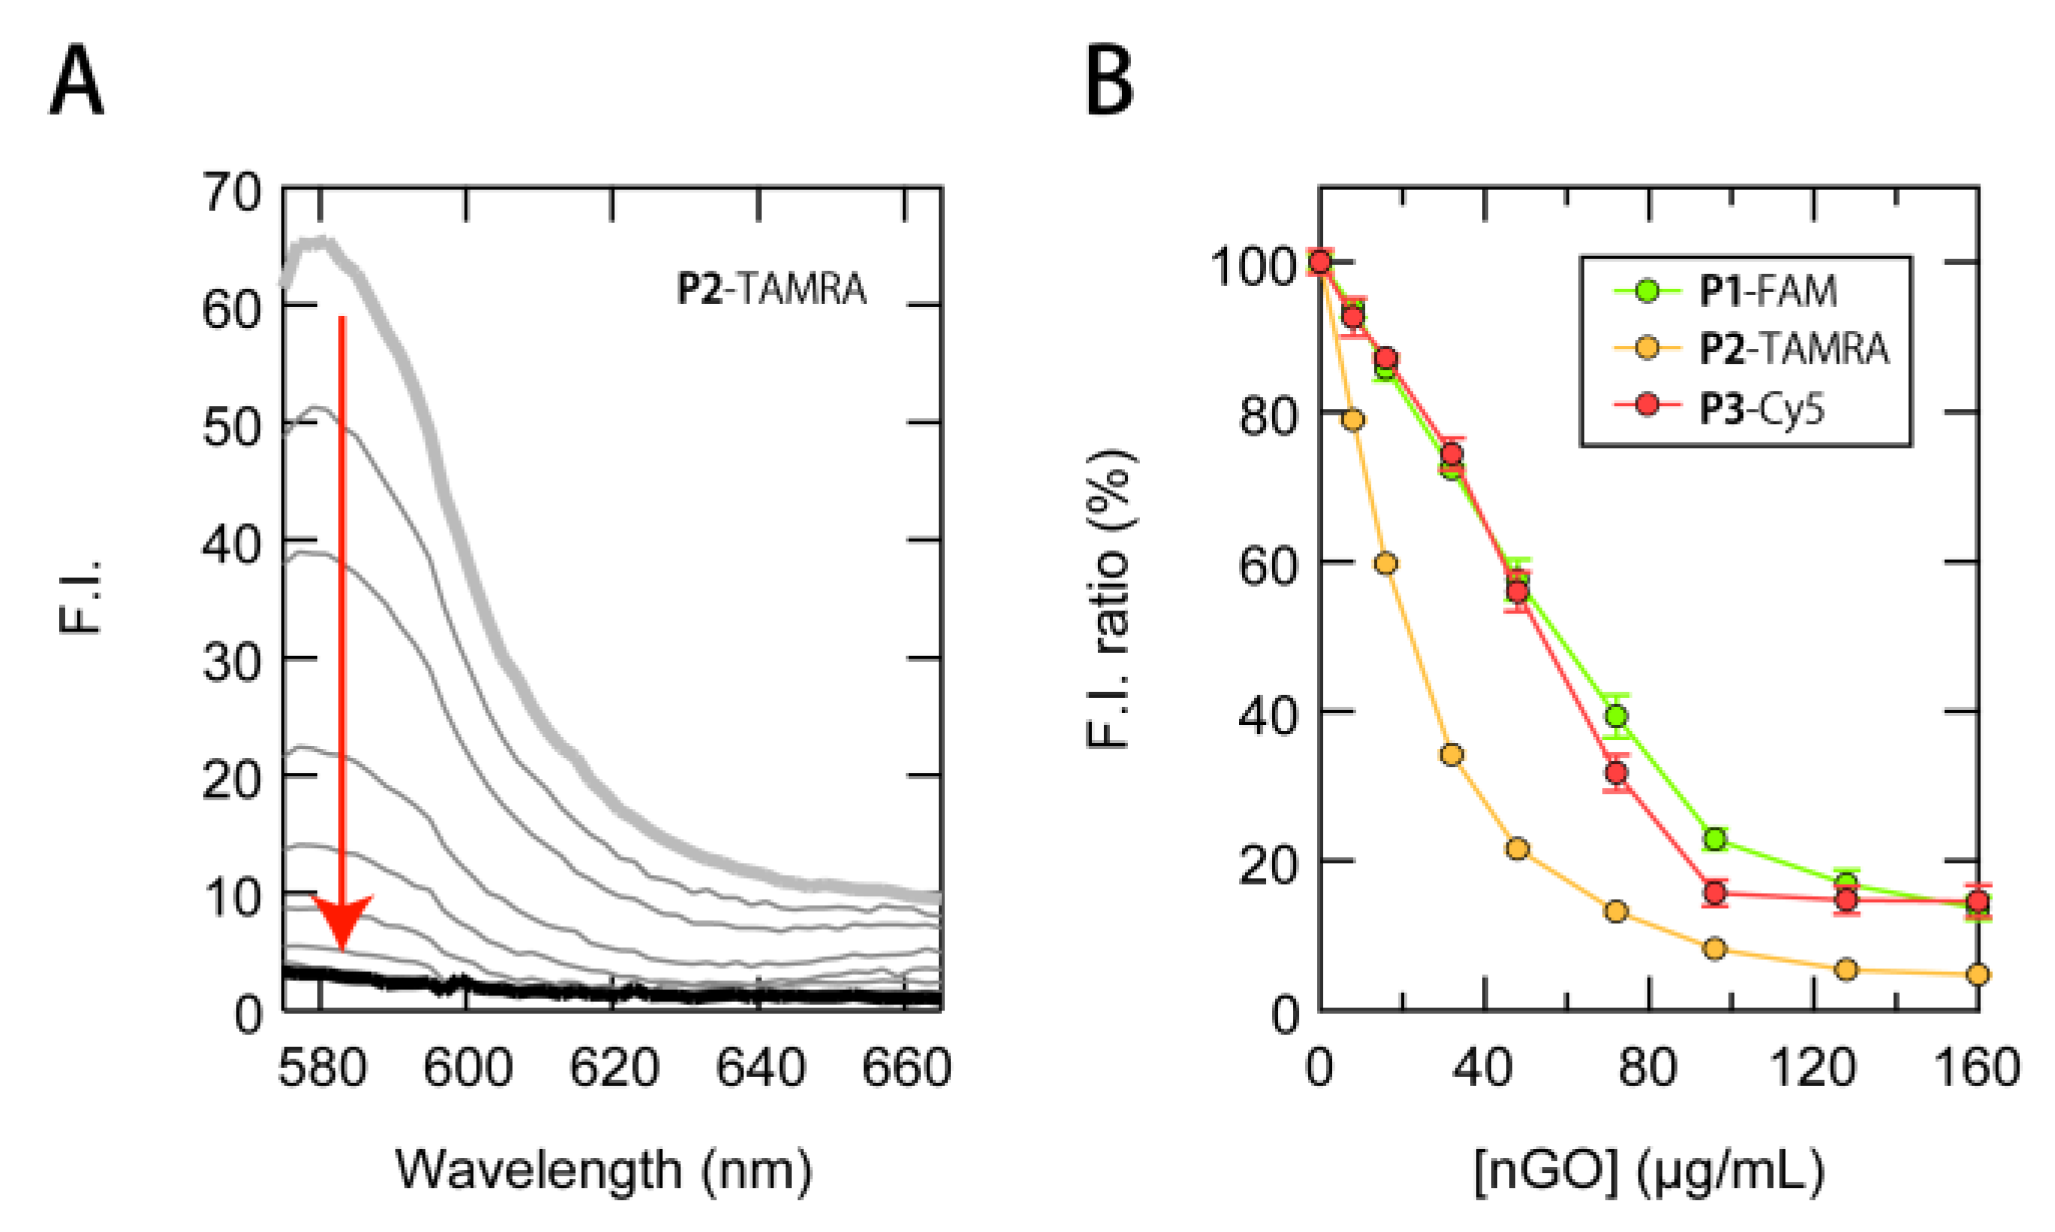
2.2. Fluorescence Quenching Study
2.3. Signature-Based Sensing
3. Results and Discussion
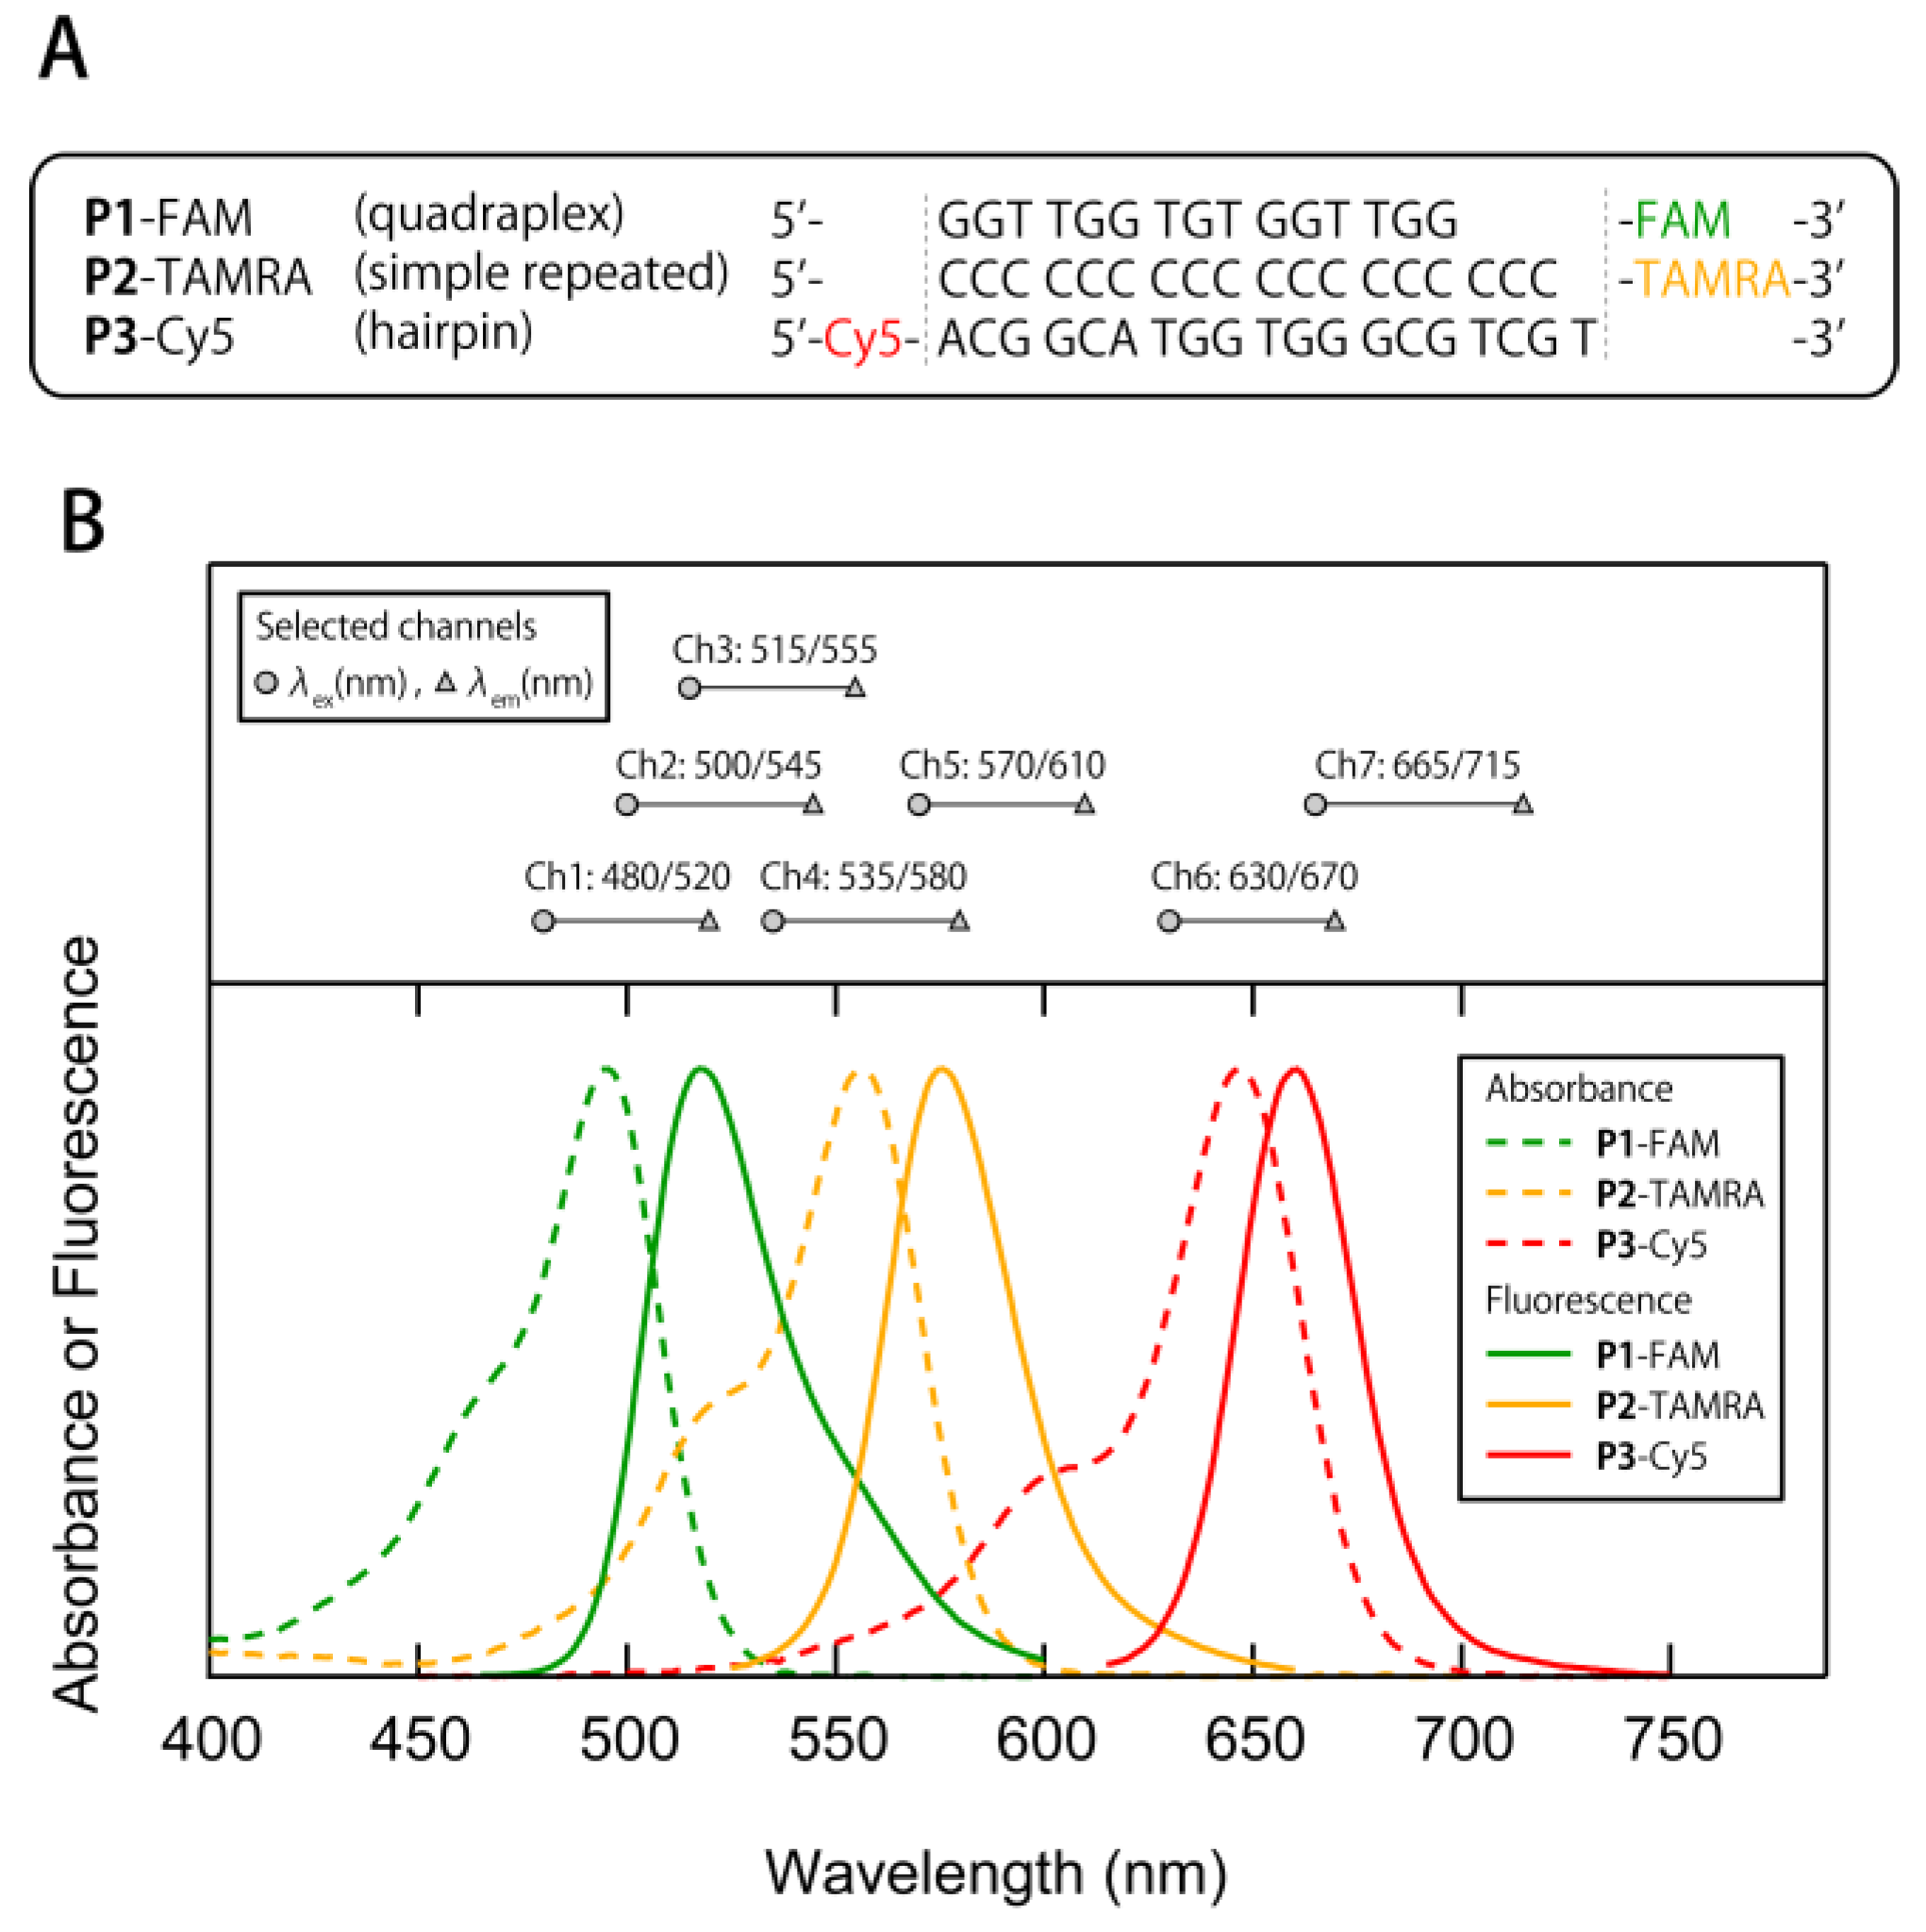
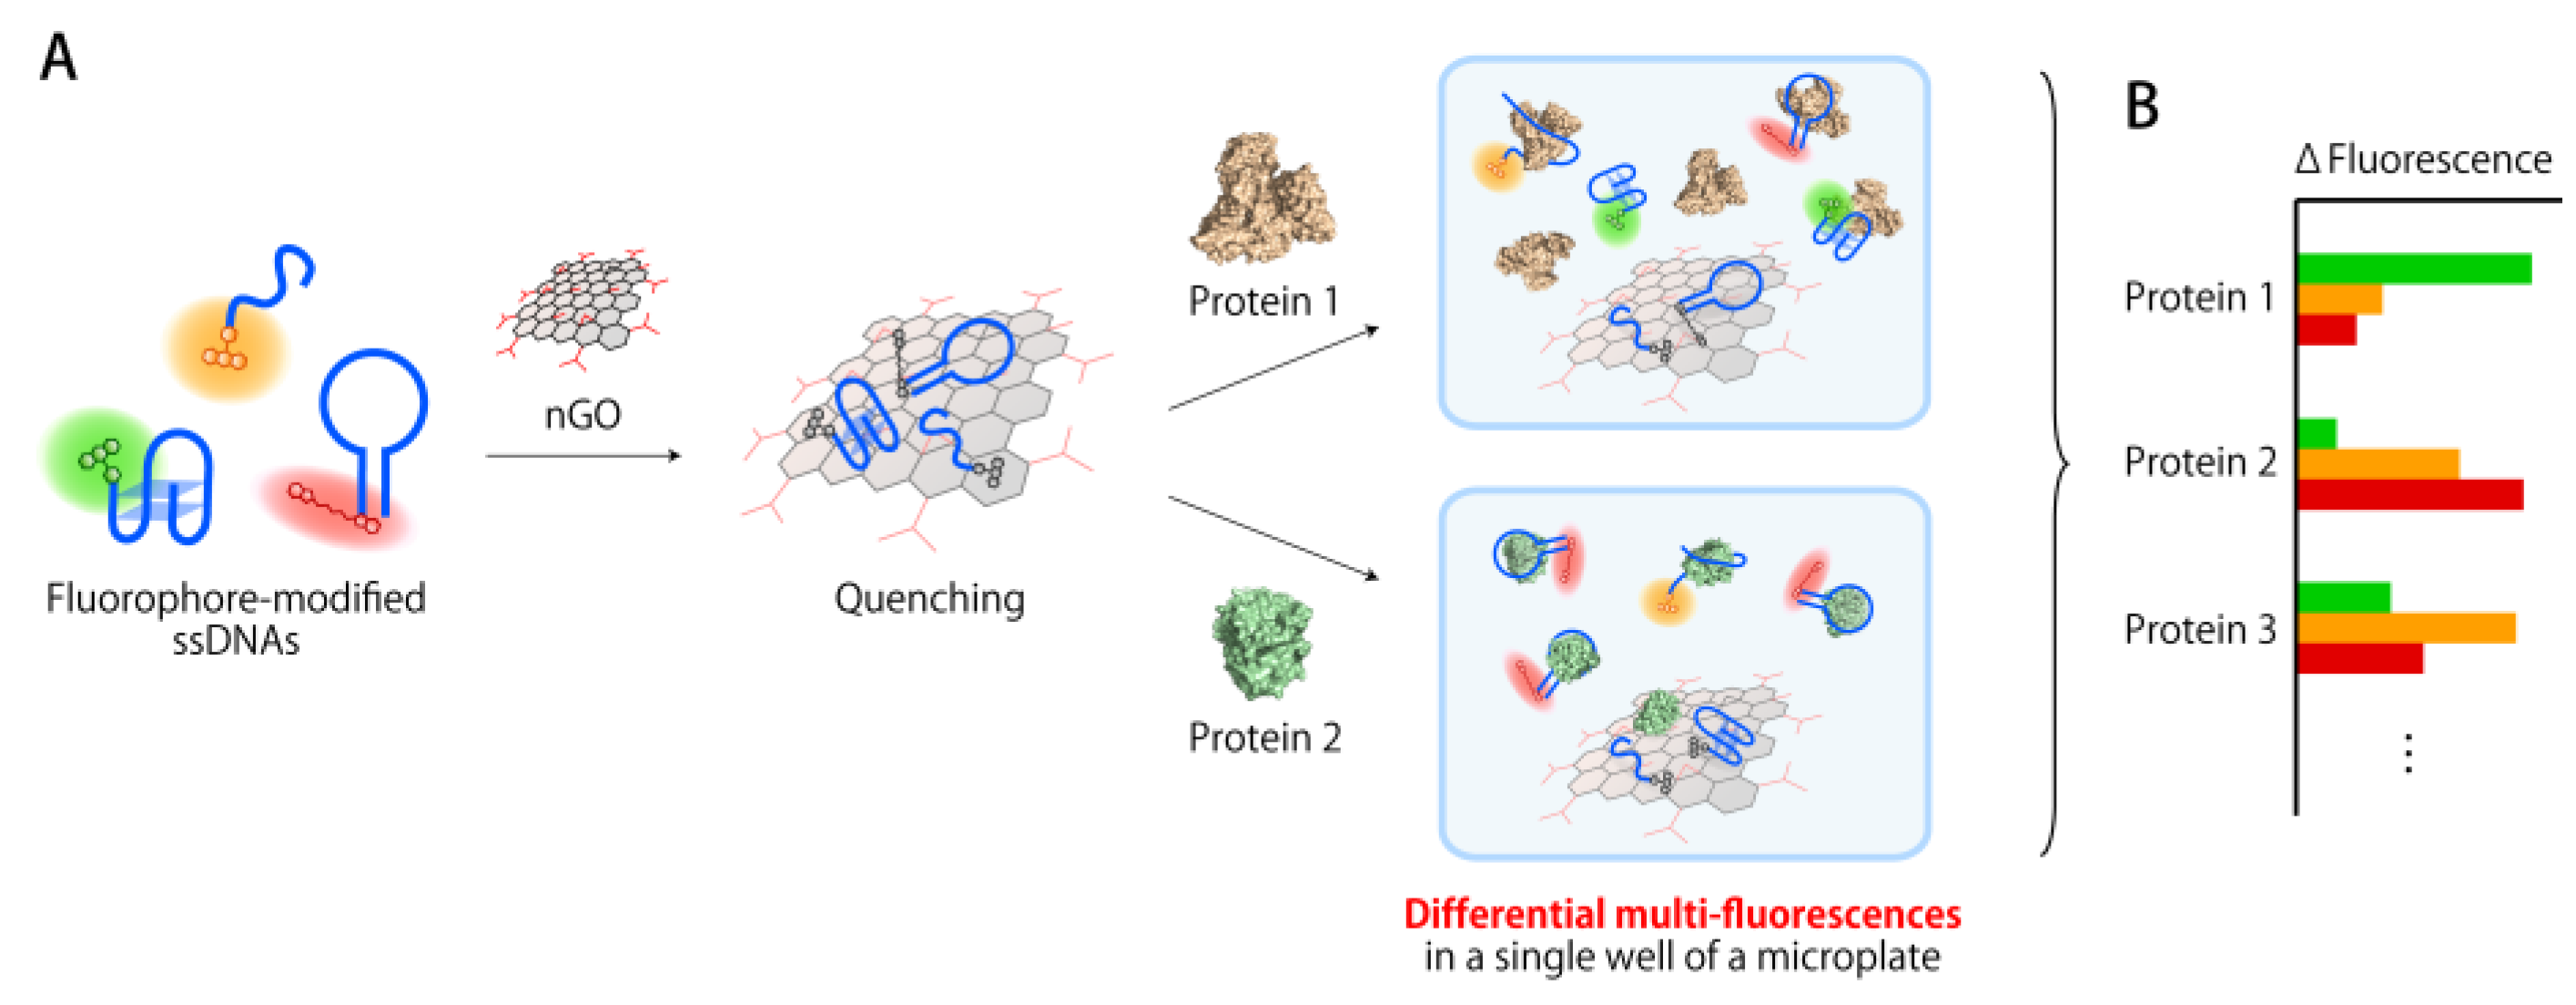
3.1. Construction of a Multi-Fluorescent ssDNAs/nGO Sensor
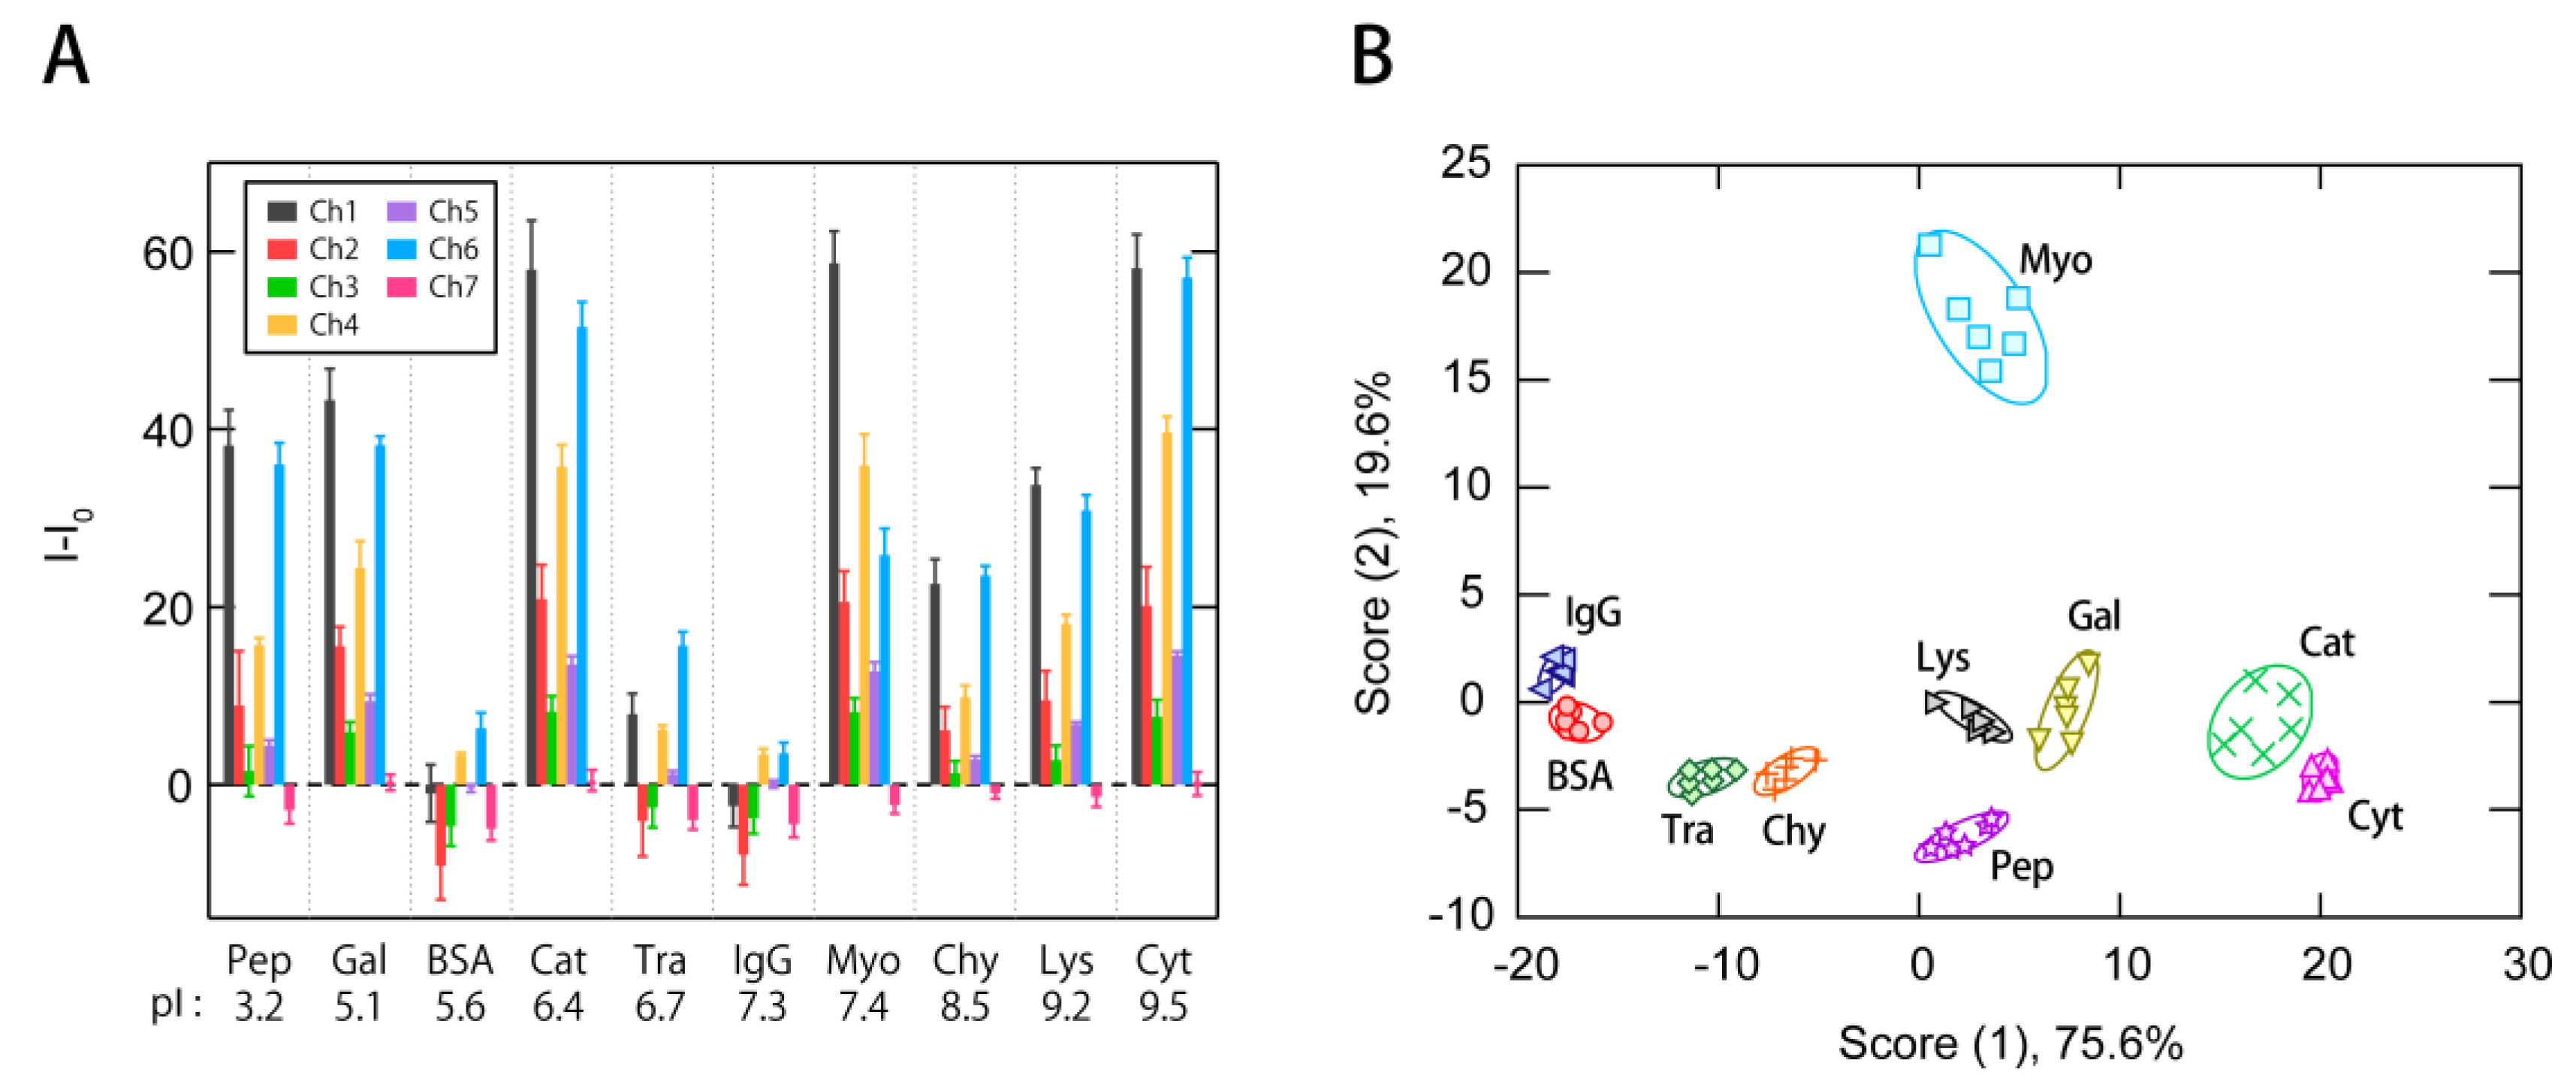
3.2. Multi-Fluorescent Signature-Based Protein Sensing
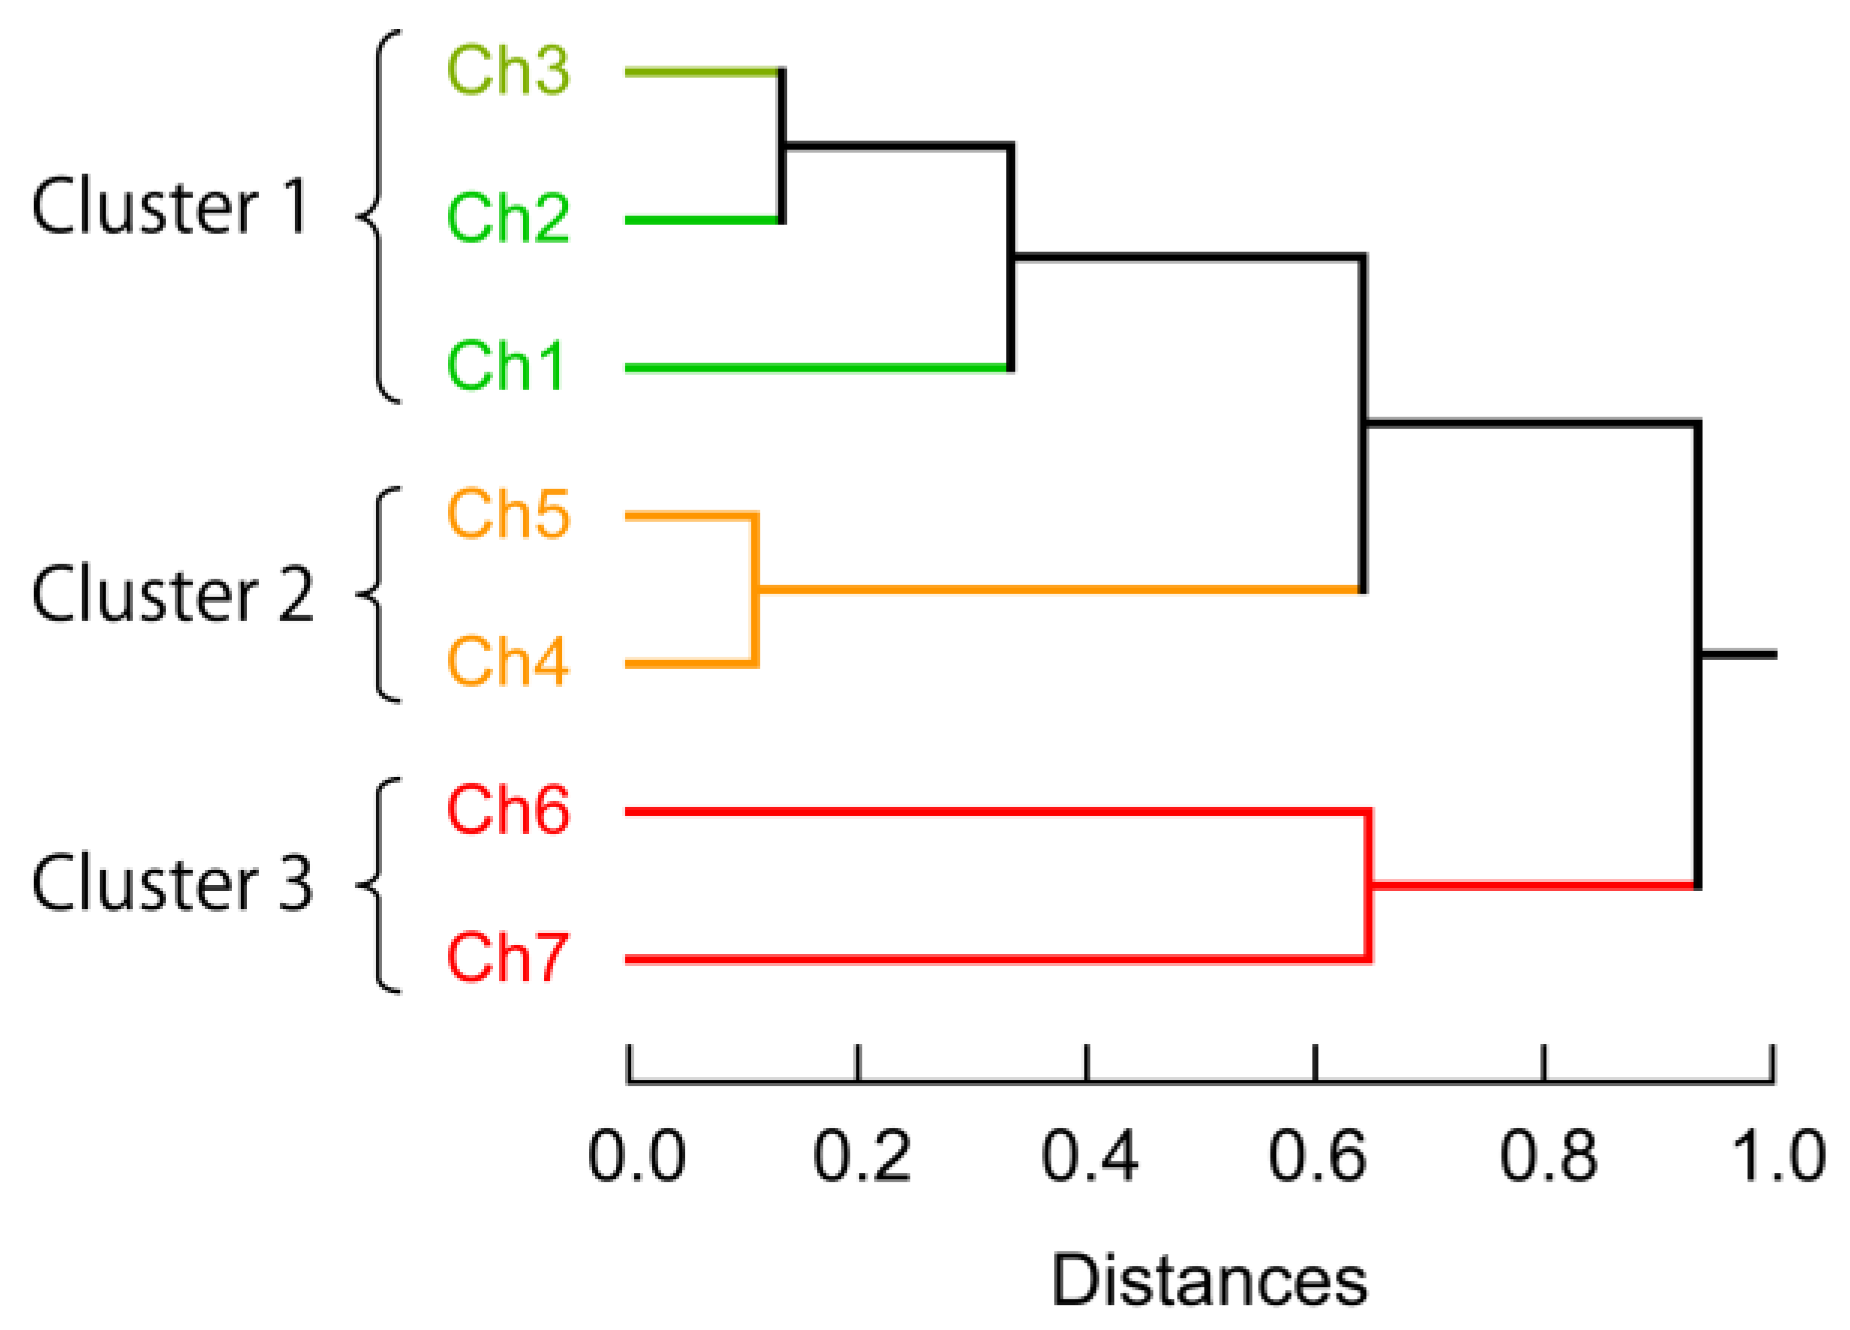
3.3. Exploraion of Effective Sensing Channels for the Discrimination of Proteins
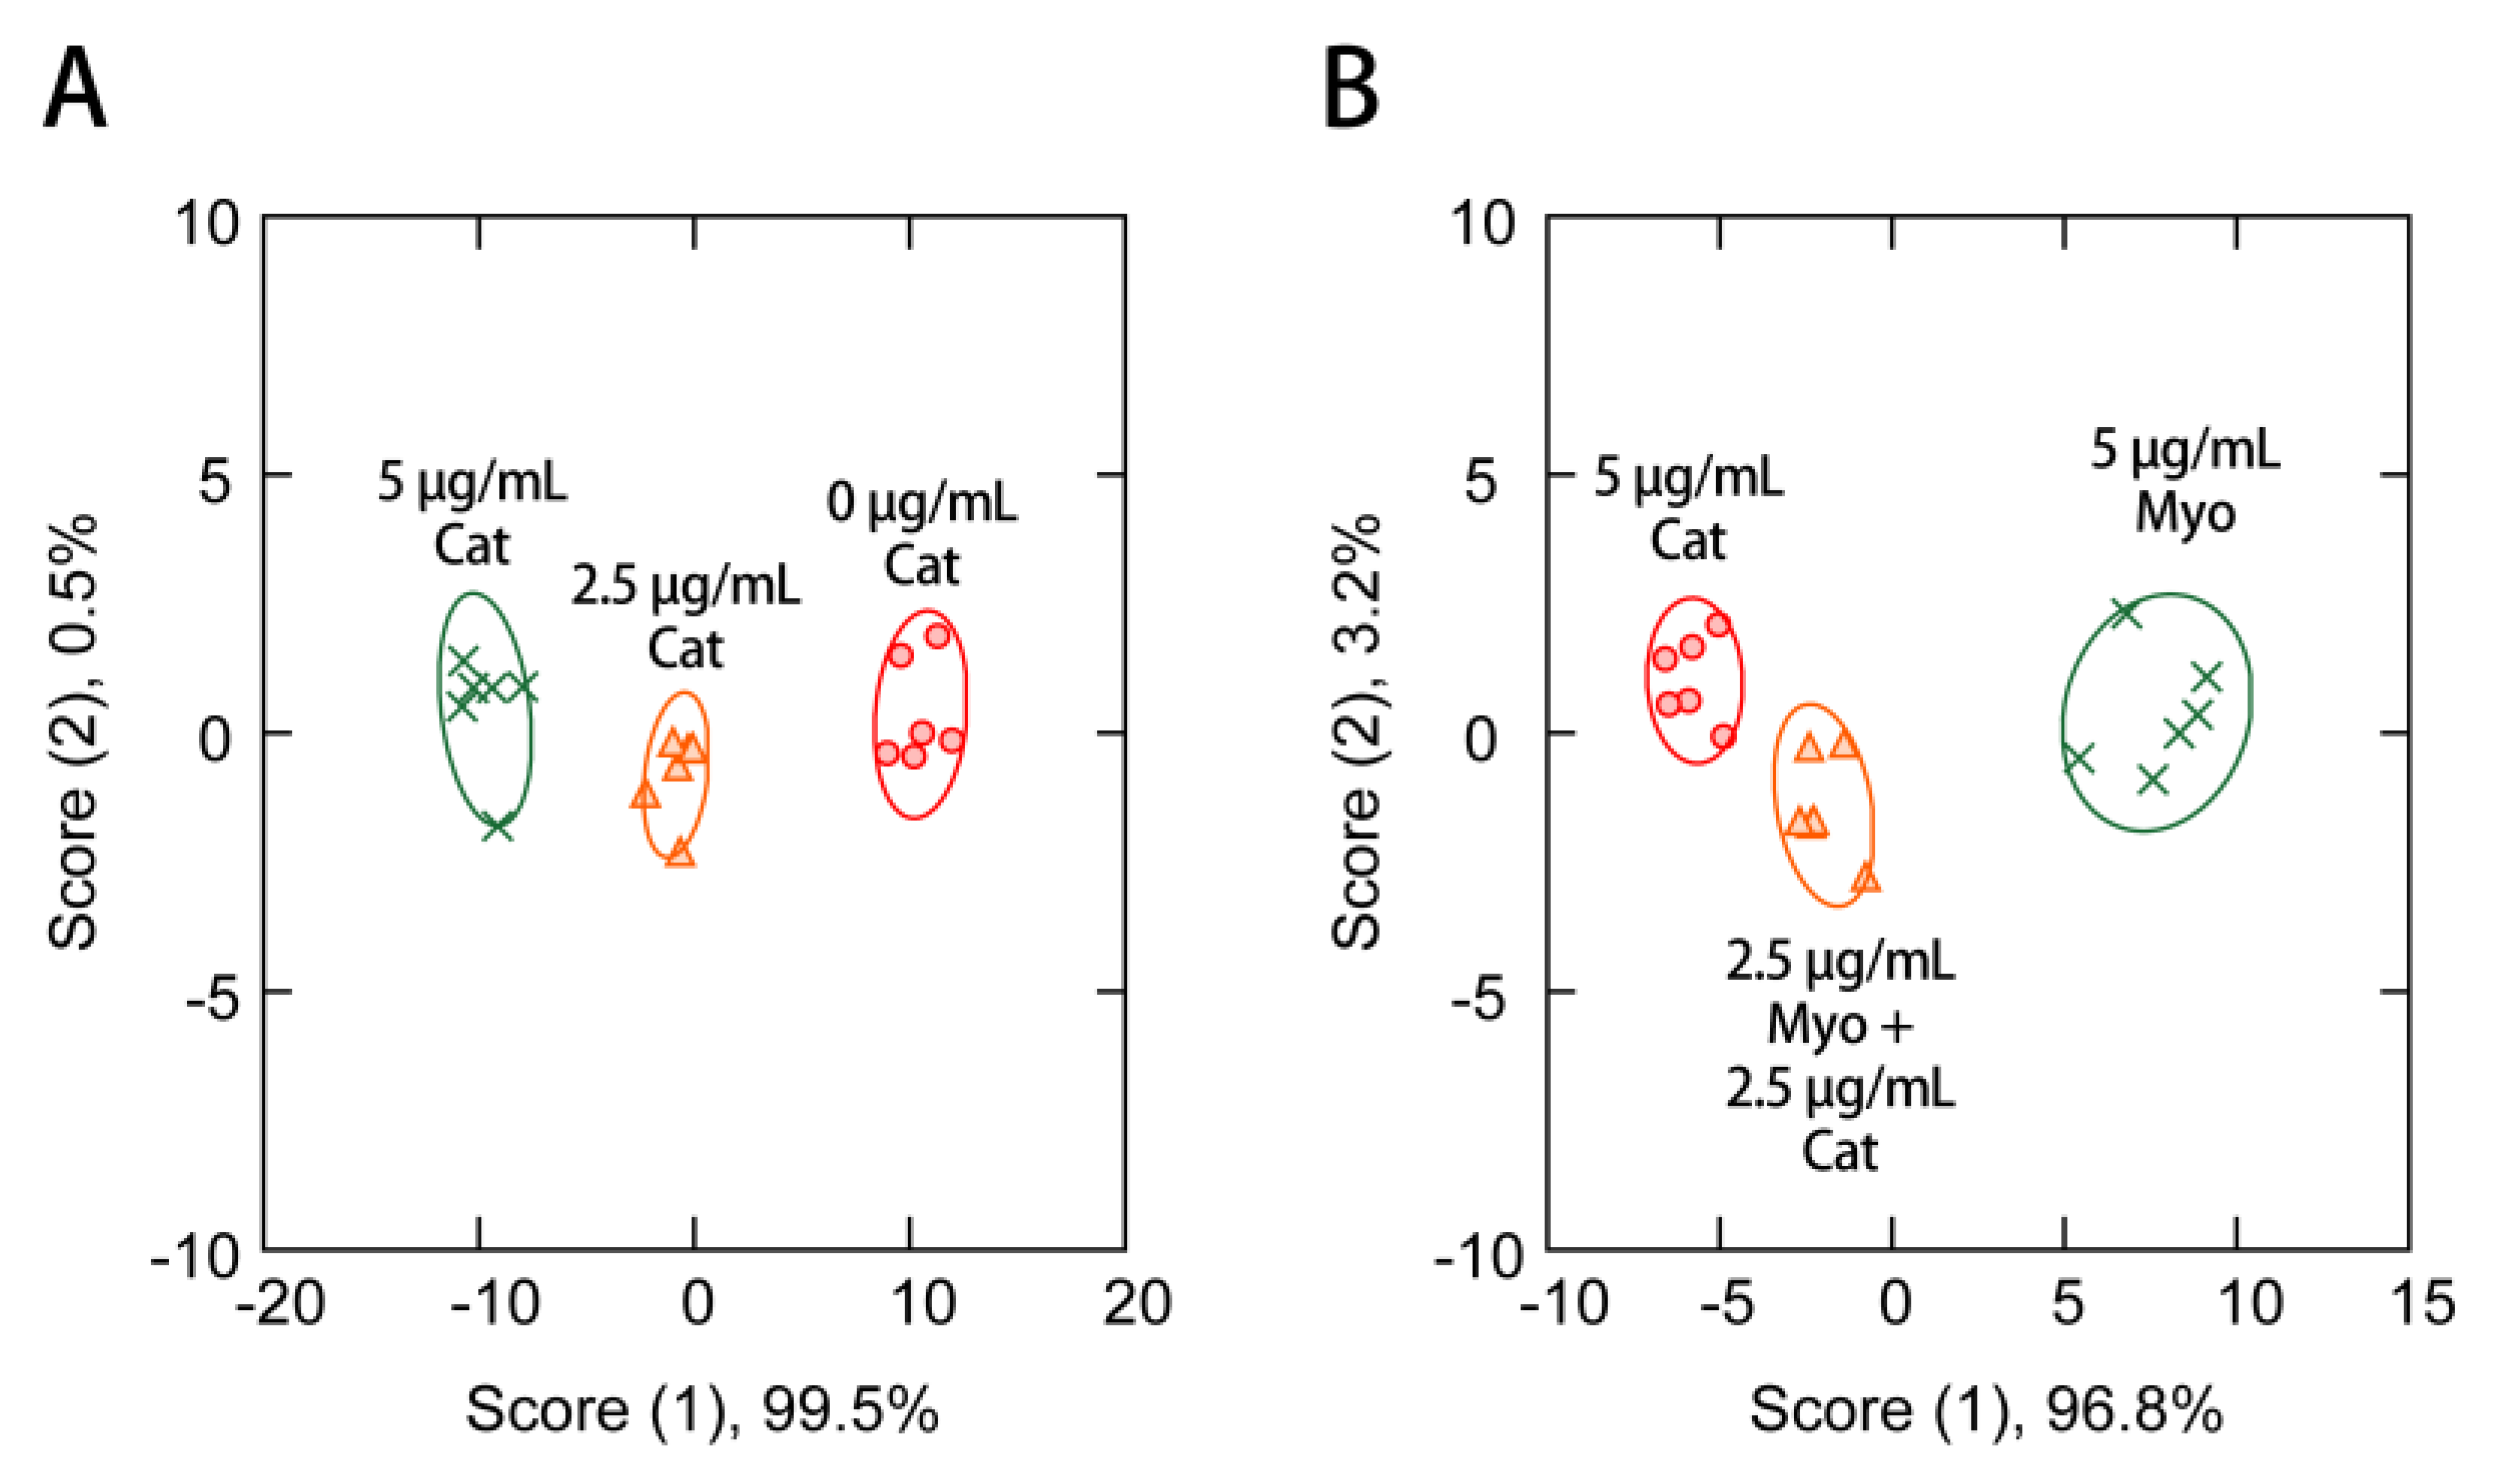
3.4. Protein Sensing in the Presence of Human Serum
4. Conclusions
Supplementary Materials
Acknowledgments
Author Contributions
Conflicts of Interest
References
- Mohammed, M.I.; Desmulliez, M.P. Lab-on-a-chip based immunosensor principles and technologies for the detection of cardiac biomarkers: A review. Lab Chip 2011, 11, 569–595. [Google Scholar] [CrossRef] [PubMed]
- Kirsch, J.; Siltanen, C.; Zhou, Q.; Revzin, A.; Simonian, A. Biosensor technology: Recent advances in threat agent detection and medicine. Chem. Soc. Rev. 2013, 42, 8733–8768. [Google Scholar] [CrossRef] [PubMed]
- Peng, H.P.; Lee, K.H.; Jian, J.W.; Yang, A.S. Origins of specificity and affinity in antibody-protein interactions. Proc. Natl. Acad. Sci. USA. 2014, 111, E2656–E2665. [Google Scholar] [CrossRef] [PubMed]
- Askim, J.R.; Mahmoudi, M.; Suslick, K.S. Optical sensor arrays for chemical sensing: The optoelectronic nose. Chem. Soc. Rev. 2013, 42, 8649–8682. [Google Scholar] [CrossRef] [PubMed]
- Peveler, W.J.; Yazdani, M.; Rotello, V.M. Selectivity and specificity: Pros and cons in sensing. ACS Sens. 2016, 1, 1282–1285. [Google Scholar] [CrossRef]
- You, C.C.; Miranda, O.R.; Gider, B.; Ghosh, P.S.; Kim, I.B.; Erdogan, B.; Krovi, S.A.; Bunz, U.H.; Rotello, V.M. Detection and identification of proteins using nanoparticle-fluorescent polymer ‘chemical nose’ sensors. Nat. Nanotechnol. 2007, 2, 318–323. [Google Scholar] [CrossRef] [PubMed]
- Li, X.; Wen, F.; Creran, B.; Jeong, Y.; Zhang, X.; Rotello, V.M. Colorimetric protein sensing using catalytically amplified sensor arrays. Small 2012, 8, 3589–3592. [Google Scholar] [CrossRef] [PubMed]
- Chou, S.S.; De, M.; Luo, J.; Rotello, V.M.; Huang, J.; Dravid, V.P. Nanoscale graphene oxide (nGO) as artificial receptors: Implications for biomolecular interactions and sensing. J. Am. Chem. Soc. 2012, 134, 16725–16733. [Google Scholar] [CrossRef] [PubMed]
- Zamora-Olivares, D.; Kaoud, T.S.; Dalby, K.N.; Anslyn, E.V. In-situ generation of differential sensors that fingerprint kinases and the cellular response to their expression. J. Am. Chem. Soc. 2013, 135, 14814–14820. [Google Scholar] [CrossRef] [PubMed]
- Lu, Y.; Liu, Y.; Zhang, S.; Wang, S.; Zhang, S.; Zhang, X. Aptamer-based plasmonic sensor array for discrimination of proteins and cells with the naked eye. Anal. Chem. 2013, 85, 6571–6574. [Google Scholar] [CrossRef] [PubMed]
- Tomita, S.; Yoshimoto, K. Polyion complex libraries possessing naturally occurring differentiation for pattern-based protein discrimination. Chem. Commun. 2013, 49, 10430–10432. [Google Scholar] [CrossRef] [PubMed]
- Tomita, S.; Soejima, T.; Shiraki, K.; Yoshimoto, K. Enzymatic fingerprinting of structurally similar homologous proteins using polyion complex library constructed by tuning PEGylated polyamine functionalities. Analyst 2014, 139, 6100–6103. [Google Scholar] [CrossRef] [PubMed]
- Yuan, Z.; Du, Y.; Tseng, Y.T.; Peng, M.; Cai, N.; He, Y.; Chang, H.T.; Yeung, E.S. Fluorescent gold nanodots based sensor array for proteins discrimination. Anal. Chem. 2015, 87, 4253–4259. [Google Scholar] [CrossRef] [PubMed]
- Galpothdeniya, W.I.S.; Fronczek, F.R.; Cong, M.; Bhattarai, N.; Siraj, N.; Warner, I.M. Tunable GUMBOS-based sensor array for label-free detection and discrimination of proteins. J. Mater. Chem. B 2016, 4, 1414–1422. [Google Scholar] [CrossRef]
- Wang, M.; Ye, H.; You, L.; Chen, X. A supramolecular sensor array using lanthanide-doped nanoparticles for sensitive detection of glyphosate and proteins. ACS Appl. Mater. Interfaces 2016, 8, 574–581. [Google Scholar] [CrossRef] [PubMed]
- Xu, S.; Gao, T.; Feng, X.; Fan, X.; Liu, G.; Mao, Y.; Yu, X.; Lin, J.; Luo, X. Near infrared fluorescent dual ligand functionalized Au NCs based multidimensional sensor array for pattern recognition of multiple proteins and serum discrimination. Biosens. Bioelectron. 2017, 97, 203–207. [Google Scholar] [CrossRef] [PubMed]
- Tomita, S.; Ishihara, S.; Kurita, R. Environment-sensitive turn-on fluorescent polyamino acid: Fingerprinting protein populations with post-translational modifications. ACS Appl. Mater. Interfaces 2017, 9, 22970–22976. [Google Scholar] [CrossRef] [PubMed]
- De, M.; Rana, S.; Akpinar, H.; Miranda, O.R.; Arvizo, R.R.; Bunz, U.H.F.; Rotello, V.M. Sensing of proteins in human serum using conjugates of nanoparticles and green fluorescent protein. Nat. Chem. 2009, 1, 461–465. [Google Scholar] [CrossRef] [PubMed]
- Miranda, O.R.; Chen, H.T.; You, C.C.; Mortenson, D.E.; Yang, X.C.; Bunz, U.H.; Rotello, V.M. Enzyme-amplified array sensing of proteins in solution and in biofluids. J. Am. Chem. Soc. 2010, 132, 5285–5289. [Google Scholar] [CrossRef] [PubMed]
- Xu, S.; Lu, X.; Yao, C.; Huang, F.; Jiang, H.; Hua, W.; Na, N.; Liu, H.; Ouyang, J. A visual sensor array for pattern recognition analysis of proteins using novel blue-emitting fluorescent gold nanoclusters. Anal. Chem. 2014, 86, 11634–11639. [Google Scholar] [CrossRef] [PubMed]
- Motiei, L.; Pode, Z.; Koganitsky, A.; Margulies, D. Targeted protein surface sensors as a tool for analyzing small populations of proteins in biological mixtures. Angew. Chem. Int. Ed. 2014, 53, 9289–9293. [Google Scholar] [CrossRef] [PubMed]
- Ran, X.; Pu, F.; Ren, J.; Qu, X. A CuS-based chemical tongue chip for pattern recognition of proteins and antibiotic-resistant bacteria. Chem. Commun. 2015, 51, 2675–2678. [Google Scholar] [CrossRef] [PubMed]
- Chen, S.; Wei, L.; Chen, X.W.; Wang, J.H. Suspension array of ionic liquid or ionic liquid-quantum dots conjugates for the discrimination of proteins and bacteria. Anal. Chem. 2015, 87, 10902–10909. [Google Scholar] [CrossRef] [PubMed]
- Sun, W.; Lu, Y.; Mao, J.; Chang, N.; Yang, J.; Liu, Y. Multidimensional sensor for pattern recognition of proteins based on DNA-gold nanoparticles conjugates. Anal. Chem. 2015, 87, 3354–3359. [Google Scholar] [CrossRef] [PubMed]
- Tomita, S.; Niwa, O.; Kurita, R. Artificial modification of an enzyme for construction of cross-reactive polyion complexes to fingerprint signatures of proteins and mammalian cells. Anal. Chem. 2016, 88, 9079–9086. [Google Scholar] [CrossRef] [PubMed]
- Wei, X.; Chen, Z.; Tan, L.; Lou, T.; Zhao, Y. DNA-catalytically active gold nanoparticle conjugates-based colorimetric multidimensional sensor array for protein discrimination. Anal. Chem. 2017, 89, 556–559. [Google Scholar] [CrossRef] [PubMed]
- Xu, S.; Wu, Y.; Sun, X.; Wang, Z.; Luo, X. A multicoloured Au NCs based cross-reactive sensor array for discrimination of multiple proteins. J. Mater. Chem. B 2017, 5, 4207–4213. [Google Scholar] [CrossRef]
- Wu, P.; Miao, L.N.; Wang, H.F.; Shao, X.G.; Yan, X.P. A multidimensional sensing device for the discrimination of proteins based on manganese-doped ZnS quantum dots. Angew. Chem. Int. Ed. 2011, 50, 8118–8121. [Google Scholar] [CrossRef] [PubMed]
- Sang, L.J.; Wang, H.F. Aminophenylboronic-acid-conjugated polyacrylic acid-Mn-doped ZnS quantum dot for highly sensitive discrimination of glycoproteins. Anal. Chem. 2014, 86, 5706–5712. [Google Scholar] [CrossRef] [PubMed]
- Li, C.; Wu, P.; Hou, X. Plasma-assisted quadruple-channel optosensing of proteins and cells with Mn-doped ZnS quantum dots. Nanoscale 2016, 8, 4291–4298. [Google Scholar] [CrossRef] [PubMed]
- Lu, Y.; Kong, H.; Wen, F.; Zhang, S.; Zhang, X. Lab-on-graphene: Graphene oxide as a triple-channel sensing device for protein discrimination. Chem. Commun. 2013, 49, 81–83. [Google Scholar] [CrossRef] [PubMed]
- Margulies, D.; Hamilton, A.D. Protein recognition by an ensemble of fluorescent DNA G-quadruplexes. Angew. Chem. Int. Ed. 2009, 48, 1771–1774. [Google Scholar] [CrossRef] [PubMed]
- Xu, Q.; Zhang, Y.; Tang, B.; Zhang, C.Y. Multicolor quantum dot-based chemical nose for rapid and array-free differentiation of multiple proteins. Anal. Chem. 2016, 88, 2051–2058. [Google Scholar] [CrossRef] [PubMed]
- Li, X.; Kong, H.; Mout, R.; Saha, K.; Moyano, D.F.; Robinson, S.M.; Rana, S.; Zhang, X.; Riley, M.A.; Rotello, V.M. Rapid identification of bacterial biofilms and biofilm wound models using a multichannel nanosensor. ACS Nano 2014, 8, 12014–12019. [Google Scholar] [CrossRef] [PubMed]
- Rana, S.; Le, N.D.; Mout, R.; Duncan, B.; Elci, S.G.; Saha, K.; Rotello, V.M. A multichannel biosensor for rapid determination of cell surface glycomic signatures. ACS Cent. Sci. 2015, 1, 191–197. [Google Scholar] [CrossRef] [PubMed]
- Le, N.D.B.; Tonga, G.Y.; Mout, R.; Kim, S.T.; Wille, M.E.; Rana, S.; Dunphy, K.A.; Jerry, D.J.; Yazdani, M.; Ramanathan, R.; et al. Cancer cell discrimination using host-guest “doubled” arrays. J. Am. Chem. Soc. 2017, 139, 8008–8012. [Google Scholar] [CrossRef] [PubMed]
- Rana, S.; Le, N.D.; Mout, R.; Saha, K.; Tonga, G.Y.; Bain, R.E.; Miranda, O.R.; Rotello, C.M.; Rotello, V.M. A multichannel nanosensor for instantaneous readout of cancer drug mechanisms. Nat. Nanotechnol. 2015, 10, 65–69. [Google Scholar] [CrossRef] [PubMed]
- Pei, H.; Li, J.; Lv, M.; Wang, J.; Gao, J.; Lu, J.; Li, Y.; Huang, Q.; Hu, J.; Fan, C. A graphene-based sensor array for high-precision and adaptive target identification with ensemble aptamers. J. Am. Chem. Soc. 2012, 134, 13843–13849. [Google Scholar] [CrossRef] [PubMed]
- Tomita, S.; Matsuda, A.; Nishinami, S.; Kurita, R.; Shiraki, K. One-step identification of antibody degradation pathways using fluorescence signatures generated by cross-reactive DNA-based arrays. Anal. Chem. 2017, 89, 7818–7822. [Google Scholar] [CrossRef] [PubMed]
- Liu, J. Adsorption of DNA onto gold nanoparticles and graphene oxide: Surface science and applications. Phys. Chem. Chem. Phys. 2012, 14, 10485–10496. [Google Scholar] [CrossRef] [PubMed]
- Tabachnick, B.G.; Fidell, L.S. Using Multivariate Statistics, 4th ed.; Allyn & Bacon: Needham Heights, MA, USA, 2001. [Google Scholar]
- Larisika, M.; Huang, J.; Tok, A.; Knoll, W.; Nowak, C. An improved synthesis route to graphene for molecular sensor applications. Mater. Chem. Phys. 2012, 136, 304–308. [Google Scholar] [CrossRef]
- Chen, J.; Li, Y.; Huang, L.; Li, C.; Shi, G. High-yield preparation of graphene oxide from small graphite flakes via an improved Hummers method with a simple purification process. Carbon 2015, 81, 826–834. [Google Scholar] [CrossRef]
- Liao, K.H.; Lin, Y.S.; Macosko, C.W.; Haynes, C.L. Cytotoxicity of graphene oxide and graphene in human erythrocytes and skin fibroblasts. ACS Appl. Mater. Interfaces 2011, 3, 2607–2615. [Google Scholar] [CrossRef] [PubMed]
- Pan, S.; Aksay, I.A. Factors controlling the size of graphene oxide sheets produced via the graphite oxide route. ACS Nano 2011, 5, 4073–4083. [Google Scholar] [CrossRef] [PubMed]
- Ding, Z.; Zhang, Z.; Ma, H.; Chen, Y. In vitro hemocompatibility and toxic mechanism of graphene oxide on human peripheral blood T lymphocytes and serum albumin. ACS Appl. Mater. Interfaces 2014, 6, 19797–19807. [Google Scholar] [CrossRef] [PubMed]
- Adkins, J.N.; Varnum, S.M.; Auberry, K.J.; Moore, R.J.; Angell, N.H.; Smith, R.D.; Springer, D.L.; Pounds, J.G. Toward a human blood serum proteome: Analysis by multidimensional separation coupled with mass spectrometry. Mol. Cell Proteom. 2002, 1, 947–955. [Google Scholar] [CrossRef]
- Kodydkova, J.; Vavrova, L.; Kocik, M.; Zak, A. Human catalase, its polymorphisms, regulation and changes of its activity in different diseases. Folia Biol. 2014, 60, 153–167. [Google Scholar]
- Sallach, S.M.; Nowak, R.; Hudson, M.P.; Tokarski, G.; Khoury, N.; Tomlanovich, M.C.; Jacobsen, G.; de Lemos, J.A.; McCord, J. A change in serum myoglobin to detect acute myocardial infarction in patients with normal troponin I levels. Am. J. Cardiol. 2004, 94, 864–867. [Google Scholar] [CrossRef] [PubMed]
- Mayr, B.M.; Kohlbacher, O.; Reinert, K.; Sturm, M.; Gropl, C.; Lange, E.; Klein, C.; Huber, C.G. Absolute myoglobin quantitation in serum by combining two-dimensional liquid chromatography-electrospray ionization mass spectrometry and novel data analysis algorithms. J. Proteome Res. 2006, 5, 414–421. [Google Scholar] [CrossRef] [PubMed]


| Protein | Source | Abbreviation | Mw | pI |
|---|---|---|---|---|
| Pepsin | Porcine stomach | Pep | 35,000 | 3.2 |
| β-Galactosidase | Escherichia coli | Gal | 465,000 | 5.1 |
| Albumin | Bovine serum | BSA | 66,000 | 5.6 |
| Catalase | Bovine liver | Cat | 230,000 | 6.4 |
| Transferrin | Human serum | Tra | 75,000 | 6.7 |
| Immunoglobulin G | Human serum | IgG | 143,000 | 7.3 |
| Myoglobin | Equine heart | Myo | 18,000 | 7.4 |
| α-Chymotrypsinogen | Bovine pancreas | Chy | 26,000 | 8.5 |
| Lysozyme | Hen egg white | Lys | 14,000 | 9.2 |
| Cytchrome c | Horse heart | Cyt | 12,000 | 9.5 |
| Selected Channels | %Correct | ||||||||||||||||
|---|---|---|---|---|---|---|---|---|---|---|---|---|---|---|---|---|---|
| Ch1 | Ch2 | Ch3 | Ch4 | Ch5 | Ch6 | Ch7 | BSA | Cat | Chy | Cyt | Gal | IgG | Lys | Myo | Tra | Pep | Total |
| 50 | 0 | 100 | 0 | 83 | 50 | 83 | 17 | 100 | 17 | 50 | |||||||
| 67 | 17 | 50 | 17 | 83 | 33 | 17 | 0 | 67 | 0 | 35 | |||||||
| 67 | 17 | 17 | 33 | 67 | 33 | 50 | 17 | 33 | 0 | 33 | |||||||
| 50 | 0 | 100 | 67 | 67 | 67 | 83 | 0 | 100 | 100 | 63 | |||||||
| 67 | 0 | 100 | 83 | 100 | 83 | 100 | 50 | 83 | 83 | 75 | |||||||
| 67 | 67 | 67 | 83 | 83 | 83 | 67 | 33 | 100 | 50 | 70 | |||||||
| 50 | 83 | 33 | 17 | 17 | 17 | 33 | 50 | 0 | 33 | 33 | |||||||
| 100 | 100 | 100 | 100 | 100 | 83 | 100 | 100 | 100 | 100 | 98 | |||||||
| 83 | 100 | 100 | 100 | 100 | 83 | 100 | 100 | 100 | 100 | 97 | |||||||
© 2017 by the authors. Licensee MDPI, Basel, Switzerland. This article is an open access article distributed under the terms and conditions of the Creative Commons Attribution (CC BY) license (http://creativecommons.org/licenses/by/4.0/).
Share and Cite
Tomita, S.; Ishihara, S.; Kurita, R. A Multi-Fluorescent DNA/Graphene Oxide Conjugate Sensor for Signature-Based Protein Discrimination. Sensors 2017, 17, 2194. https://doi.org/10.3390/s17102194
Tomita S, Ishihara S, Kurita R. A Multi-Fluorescent DNA/Graphene Oxide Conjugate Sensor for Signature-Based Protein Discrimination. Sensors. 2017; 17(10):2194. https://doi.org/10.3390/s17102194
Chicago/Turabian StyleTomita, Shunsuke, Sayaka Ishihara, and Ryoji Kurita. 2017. "A Multi-Fluorescent DNA/Graphene Oxide Conjugate Sensor for Signature-Based Protein Discrimination" Sensors 17, no. 10: 2194. https://doi.org/10.3390/s17102194
APA StyleTomita, S., Ishihara, S., & Kurita, R. (2017). A Multi-Fluorescent DNA/Graphene Oxide Conjugate Sensor for Signature-Based Protein Discrimination. Sensors, 17(10), 2194. https://doi.org/10.3390/s17102194