
Microsoft Kinect Visual and Depth Sensors for Breathing and Heart Rate Analysis


Abstract
:
1. Introduction
2. Methods
2.1. Data Acquisition
2.2. Data Processing
3. Results
4. Conclusions
Acknowledgments
Author Contributions
Conflicts of Interest
Abbreviations
| ROI | region of interest |
| HR | heart rate |
| RGB | red-green-blue |
| FIR | finite impulse response |
| IIR | infinite impulse response |
| 3D | three-dimensional |
| MS | Microsoft |
| fps | frames per second |
| bpm | beats per minute |
References
- Benetazzo, F.; Freddi, A.; Monteriu, A.; Longhi, S. Respiratory rate detection algorithm based on RGB-D camera: Theoretical background and experimental results. Healthc. Technol. Lett. 2014, 1, 81–86. [Google Scholar] [CrossRef] [PubMed]
- Fekr, A.; Janidarmian, M.; Radecka, K.; Zilic, Z. A Medical Cloud-Based Platform for Respiration Rate Measurement and Hierarchical Classification of Breath Disorders. Sensors 2014, 14, 11204–11224. [Google Scholar] [CrossRef] [PubMed]
- Hong, K.; Hong, S. Real-time stress assessment using thermal imaging. Vis. Comput. 2015, 2015, 1–9. [Google Scholar] [CrossRef]
- Jing, B.; Li, H. A Novel Thermal Measurement for Heart Rate. J. Comput. 2013, 8, 2163–2166. [Google Scholar] [CrossRef]
- Massagram, W.; Lubecke, V.; Host-Madsen, A.; Boric-Lubecke, O. Assessment of Heart Rate Variability and Respiratory Sinus Arrhythmia via Doppler Radar. IEEE Trans. Microw. Theory Technol. 2009, 57, 2543–2543. [Google Scholar] [CrossRef]
- Monkaresi, H.; Calvo, R.A.; Yan, H. A machine learning approach to improve contactless heart rate monitoring using a webcam. IEEE J. Biomed. Health Inform. 2014, 18, 1153–1160. [Google Scholar] [CrossRef] [PubMed]
- Shao, D.; Yang, Y.; Liu, C.; Tsow, F.; Yu, H.; Tao, N. Noncontact monitoring breathing pattern, exhalation flow rate and pulse transit time. IEEE Trans. Bio-Med. Eng. 2014, 61, 2760–2767. [Google Scholar] [CrossRef] [PubMed]
- Yang, L.; Ren, Y.; Hu, H.; Tian, B. New fast fall detection method based on spatio-temporal context tracking of head by using depth images. Sensors 2015, 15, 23004–23019. [Google Scholar] [CrossRef] [PubMed]
- Balakrishnan, G.; Durand, F.; Gutag, J. Detecting pulse from head motions in video. In Proceedings of the IEEE Conference on Computer Vision and Pattern Recognition, CVPR, Portland, OR, USA, 20–25 June 2013; pp. 3430–3437.
- Poh, M.; McDuff, D.J.; Picard, R.W. Non-contact, automated cardiac pulse measurements using video imaging and blind source separation. Opt. Express 2010, 18, 10762–10774. [Google Scholar] [CrossRef] [PubMed]
- Gao, Z.; Yu, Y.; Du, S. Leveraging Two Kinect Sensors for Accurate Full-Body Motion Capture. Sensors 2015, 15, 24297–24317. [Google Scholar] [CrossRef] [PubMed]
- Lachat, E.; Macher, H.; Landes, T.; Grussenmeyer, P. Assessment and Calibration of a RGB-D Camera (Kinect v2 Sensor) Towards a Potential Use for Close-Range 3D Modeling. Remote Sens. 2015, 7, 13070–13097. [Google Scholar] [CrossRef]
- Procházka, A.; Vyšata, O.; Vališ, M.; Ťupa, O.; Schatz, M.; Mařík, V. Bayesian Classification and Analysis of Gait Disorders Using Image and Depth Sensors of Microsoft Kinect. Digit. Signal Process. 2015, 47, 169–177. [Google Scholar] [CrossRef]
- Procházka, A.; Vyšata, O.; Vališ, M.; Ťupa, O.; Schatz, M.; Mařík, V. Use of Image and Depth Sensors of the Microsoft Kinect for the Detection of Gait Disorders. Neural Comput. Appl. 2015, 26, 1621–1629. [Google Scholar] [CrossRef]
- Yang, C.; Cheung, G.; Stankovic, V. Estimating heart rate via depth video motion tracking. In Proceedings of the IEEE International Conference on Multimedia and Expo, ICME-2015, Torino, Italy, 29 June–3 July 2015; pp. 1–6.
- Bae, M.; Park, I. Content-based 3D model retrieval using a single depth image from a low-cost 3D camera. Vis. Comput. 2013, 29, 555–564. [Google Scholar] [CrossRef]
- Ťupa, O.; Procházka, A.; Vyšata, O.; Schatz, M.; Mareš, J.; Vališ, M.; Mařík, V. Motion tracking and gait feature estimation for recognising Parkinson’s disease using MS Kinect. BioMed. Eng. OnLine 2015, 14, 1–20. [Google Scholar] [CrossRef] [PubMed]
- Yu, M.; Wu, H.; Liou, J.; Lee, M.; Hung, Y. Multiparameter sleep monitoring using a depth camera. In Proceedings of the BIOSTEC 2012, Vilamoura, Portugal, 1–4 February 2012; pp. 311–325.
- Ma, Z.; Wu, E. Real-time and robust hand tracking with a single depth camera. Vis. Comput. 2014, 30, 1133–1144. [Google Scholar] [CrossRef]
- Alimohamed, S.; Prosser, K.; Weerasuriya, C.; Iles, R.; Cameron, J.; Lasenby, J.; Fogarty, C. P134 Validating structured light plethysmography (SLP) as a non-invasive method of measuring lung function when compared to Spirometry. Thorax 2011, 66, A121. [Google Scholar] [CrossRef]
- Brand, D.; Lau, E.; Cameron, J.; Wareham, R.; Usher-Smith, J.; Bridge, P.; Lasenby, J.; Iles, R. Tidal Breathing Parameters Measurement by Structured Light Plethysmography (SLP) and Spirometry. Am. J. Resp. Crit. Care 2010, B18, A2528–A2528. [Google Scholar]
- Loblaw, A.; Nielsen, J.; Okoniewski, M.; Lakhani, M.A. Remote respiratory sensing with an infrared camera using the Kinect infrared projector. In Proceedings of the 2013 World Congress in Computer Science, Computer Engineering and Alied Computing, WORLDCOMP, Las Vegas, NV, USA, 25–28 July 2013; pp. 1–7.
- Murthy, R.; Pavlidis, I. Noncontact measurement of breathing function. IEEE Eng. Med. Biol. Mag. 2014, 25, 57–67. [Google Scholar] [CrossRef]
- Wang, C.W.; Hunter, A.; Gravill, N.; Matusiewicz, S. Unconstrained video monitoring of breathing behavior and application to diagnosis of sleep apnea. IEEE Trans. Biomed. Eng. 2014, 61, 396–404. [Google Scholar] [CrossRef] [PubMed]
- Falie, D.; Ichim, M.; David, L. Respiratory motion visualization and the sleep apnea diagnosis with the time of flight (ToF) camera. In Proceedings of the 1st WSEAS International Conference on VISUALIZATION, IMAGING and SIMULATION, VIS’08, Bucharest, Romania, 7–9 November 2008; pp. 179–184.
- Gu, C.; Li, C. Assessment of Human Respiration Patterns via Noncontact Sensing Using Doppler Multi-Radar System. Sensors 2015, 15, 6383–6398. [Google Scholar] [CrossRef] [PubMed]
- Arlotto, P.; Grimaldi, M.; Naeck, R.; Ginoux, J. An Ultrasonic Contactless Sensor for Breathing Monitoring. Sensors 2014, 14, 15371–15386. [Google Scholar] [CrossRef] [PubMed]
- Hashizaki, M.; Nakajima, H.; Kume, K. Monitoring of Weekly Sleep Pattern Variations at Home with a Contactless Biomotion Sensor. Sensors 2014, 14, 18950–18964. [Google Scholar] [CrossRef] [PubMed]
- Pandiyan, E.M.; Selvan, M.T.; Hussian, M.S.; Velmathi, D.G. Force Sensitive Resistance Based Heart Beat Monitoring for Health Care System. Int. J. Inform. Sci. Technol. 2014, 4, 11–16. [Google Scholar] [CrossRef]
- Jerhotová, E.; Švihlík, J.; Procházka, A. Biomedical Image Volumes Denoising via the Wavelet Transform. In Applied Biomedical Engineering; Gargiulo, G.D., McEwan, A., Eds.; INTECH: Rijeka, Croatia, 2011; pp. 435–458. [Google Scholar]
- Procházka, A.; Vyšata, O.; Ťupa, O.; Mareš, J.; Vališ, M. Discrimination of Axonal Neuropathy Using Sensitivity and Specificity Statistical Measures. Neural Comput. Appl. 2014, 25, 1349–1358. [Google Scholar] [CrossRef]
- Cippitelli, E.; Gasparrini, S.; Gambi, E.; Spinsante, S. A Human Activity Recognition System Using Skeleton Data from RGBD Sensors. Comput. Intell. Neurosci. 2016, 2016, 1–14. [Google Scholar] [CrossRef] [PubMed]
- Erden, F.; Velipasalar, S.; Alkar, A.; Cetin, A. Sensors in Assisted Living. IEEE Signal Proc. Mag. 2016, 33, 36–44. [Google Scholar] [CrossRef]
- Ye, M.; Yang, C.; Stankovic, V.; Stankovic, L.; Kerr, A. A depth camera motion analysis framework for tele-rehabilitation: Motion capture and person-centric kinematics analysis. IEEE J. Sel. Top. Signal Process. 2016, 2016, 1–11. [Google Scholar] [CrossRef]
- Yang, C.; Mao, Y.; Cheung, G.; Stankovic, V.; Chan, K. Monitoring via Depth Video Recording & Analysis. In Proceedings of the 5th IEEE International Workshop on Hot Topics in 3D, Hot3D, Chengdu, China, 14–18 July 2014; pp. 1–6.
- Yang, C.; Mao, Y.; Cheung, G.; Stankovic, V.; Chan, K. Graph-Based Depth Video Denoising and Event Detection for Sleep Monitoring. In Proceedings of the IEEE International Workshop on Multimedia Signal Processing, Jakarta, Indonesia, 7–9 September 2014; pp. 1–6.
- Bandyopadhyay, S.K. Lip Contour Detection Techniques Based on Front View Of Face. J. Glob. Res. Comput. Sci. 2011, 2, 43–46. [Google Scholar]
- Khan, I.; Abdullah, H.; Zainal, M.S.B. Efficient Eyes and Mouth Detection Algorithm Using Combination of Viola Jones and Skin Color Pixel Detection. Int. J. Eng. Appl. Sci. 2013, 3, 51–60. [Google Scholar]
- Khoshelham, K.; Elberink, S.O. Accuracy and Resolution of Kinect Depth Data for Indoor Mapping Applications. Sensors 2012, 12, 1437–1454. [Google Scholar] [CrossRef] [PubMed]
- Chen, K.; Lorenz, D.A. Image Sequence Interpolation Using Optimal Control. J. Math. Imaging Vis. 2011, 41, 222–238. [Google Scholar] [CrossRef]
- Zi, L.; Du, J.; Wang, Q. Frame Interpolation Based on Visual Correspondence and Coherency Sensitive Hashing. Math. Probl. Eng. 2013, 13, 1–11. [Google Scholar] [CrossRef]
- Merget, D.; Eckl, T.; Schwörer, M.; Tiefenbacher, P.; Rigoll, G. Capturing Facial Videos with Kinect 2.0: A Multithreaded Open Source Tool and Database. In Proceedings of the IEEE Winter Conference on Applications of Computer Vision, WACV 2016, Lake Placid, NY, USA, 7–9 March 2016; pp. 1–5.


| MS Kinect Sensor | Respiratory Rate (Breaths/min) | Error |
|---|---|---|
| Depth sensor | 20.580 | |
| Image sensor: red component | 20.592 | 0.06 |
| Image sensor: green component | 20.532 | 0.23 |
| Image sensor: blue component | 20.532 | 0.23 |
| Infrared sensor | 20.526 | 0.26 |
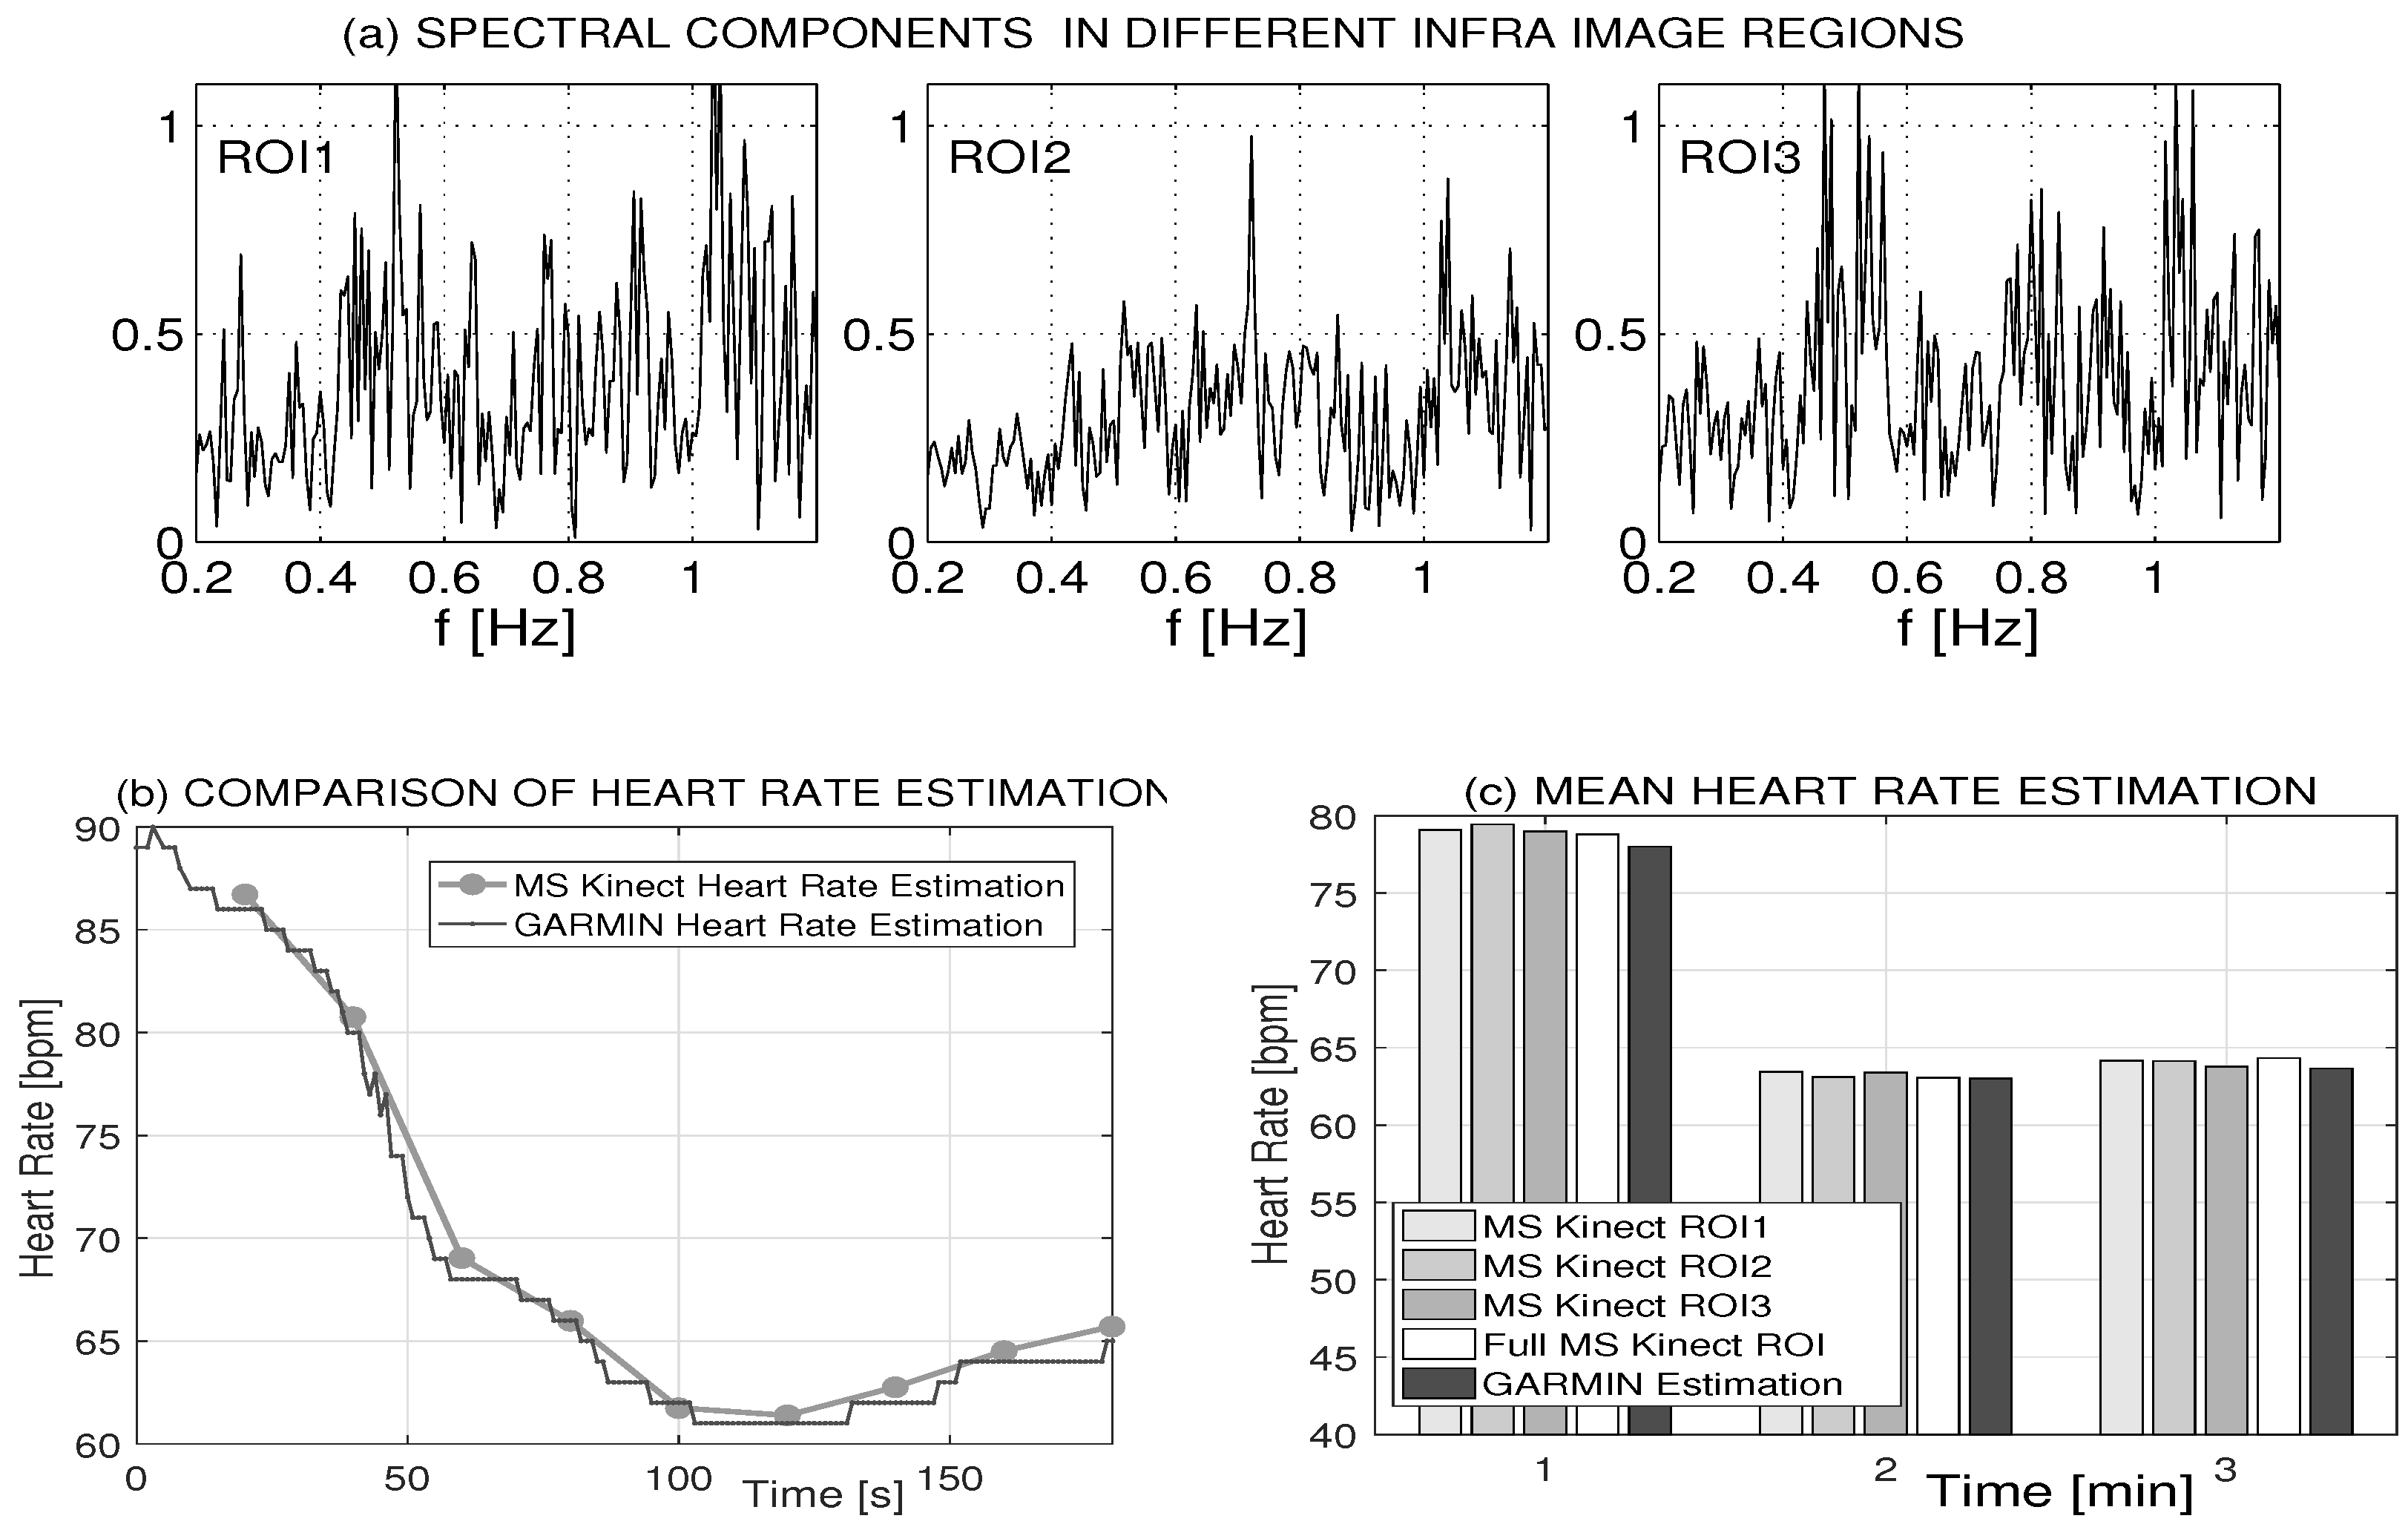
| Starting Time (s) | Garmin Record (bpm) | Kinect HR (bpm) Estimate | ROI Error (%) | |||
|---|---|---|---|---|---|---|
| ROI1 | ROI2 | ROI3 | ROI | |||
| 0 | 86 | 86.3 | 85.2 | 86.9 | 86.7 | 0.81 |
| 20 | 80 | 82.0 | 84.9 | 80.9 | 80.7 | 0.88 |
| 40 | 68 | 68.9 | 68.2 | 69.2 | 69.0 | 1.47 |
| 60 | 66 | 66.0 | 66.2 | 67.3 | 66.0 | 0.00 |
| 80 | 62 | 62.7 | 61.3 | 61.8 | 61.8 | 0.32 |
| 100 | 61 | 61.6 | 61.8 | 61.1 | 61.4 | 0.66 |
| 120 | 62 | 62.5 | 62.9 | 62.2 | 62.8 | 1.29 |
| 140 | 64 | 64.1 | 64.1 | 63.4 | 64.5 | 0.78 |
| 160 | 65 | 65.9 | 65.4 | 65.7 | 65.7 | 1.08 |
© 2016 by the authors; licensee MDPI, Basel, Switzerland. This article is an open access article distributed under the terms and conditions of the Creative Commons Attribution (CC-BY) license (http://creativecommons.org/licenses/by/4.0/).
Share and Cite
Procházka, A.; Schätz, M.; Vyšata, O.; Vališ, M. Microsoft Kinect Visual and Depth Sensors for Breathing and Heart Rate Analysis. Sensors 2016, 16, 996. https://doi.org/10.3390/s16070996
Procházka A, Schätz M, Vyšata O, Vališ M. Microsoft Kinect Visual and Depth Sensors for Breathing and Heart Rate Analysis. Sensors. 2016; 16(7):996. https://doi.org/10.3390/s16070996
Chicago/Turabian StyleProcházka, Aleš, Martin Schätz, Oldřich Vyšata, and Martin Vališ. 2016. "Microsoft Kinect Visual and Depth Sensors for Breathing and Heart Rate Analysis" Sensors 16, no. 7: 996. https://doi.org/10.3390/s16070996
APA StyleProcházka, A., Schätz, M., Vyšata, O., & Vališ, M. (2016). Microsoft Kinect Visual and Depth Sensors for Breathing and Heart Rate Analysis. Sensors, 16(7), 996. https://doi.org/10.3390/s16070996