
Robust Ground Target Detection by SAR and IR Sensor Fusion Using Adaboost-Based Feature Selection


Abstract
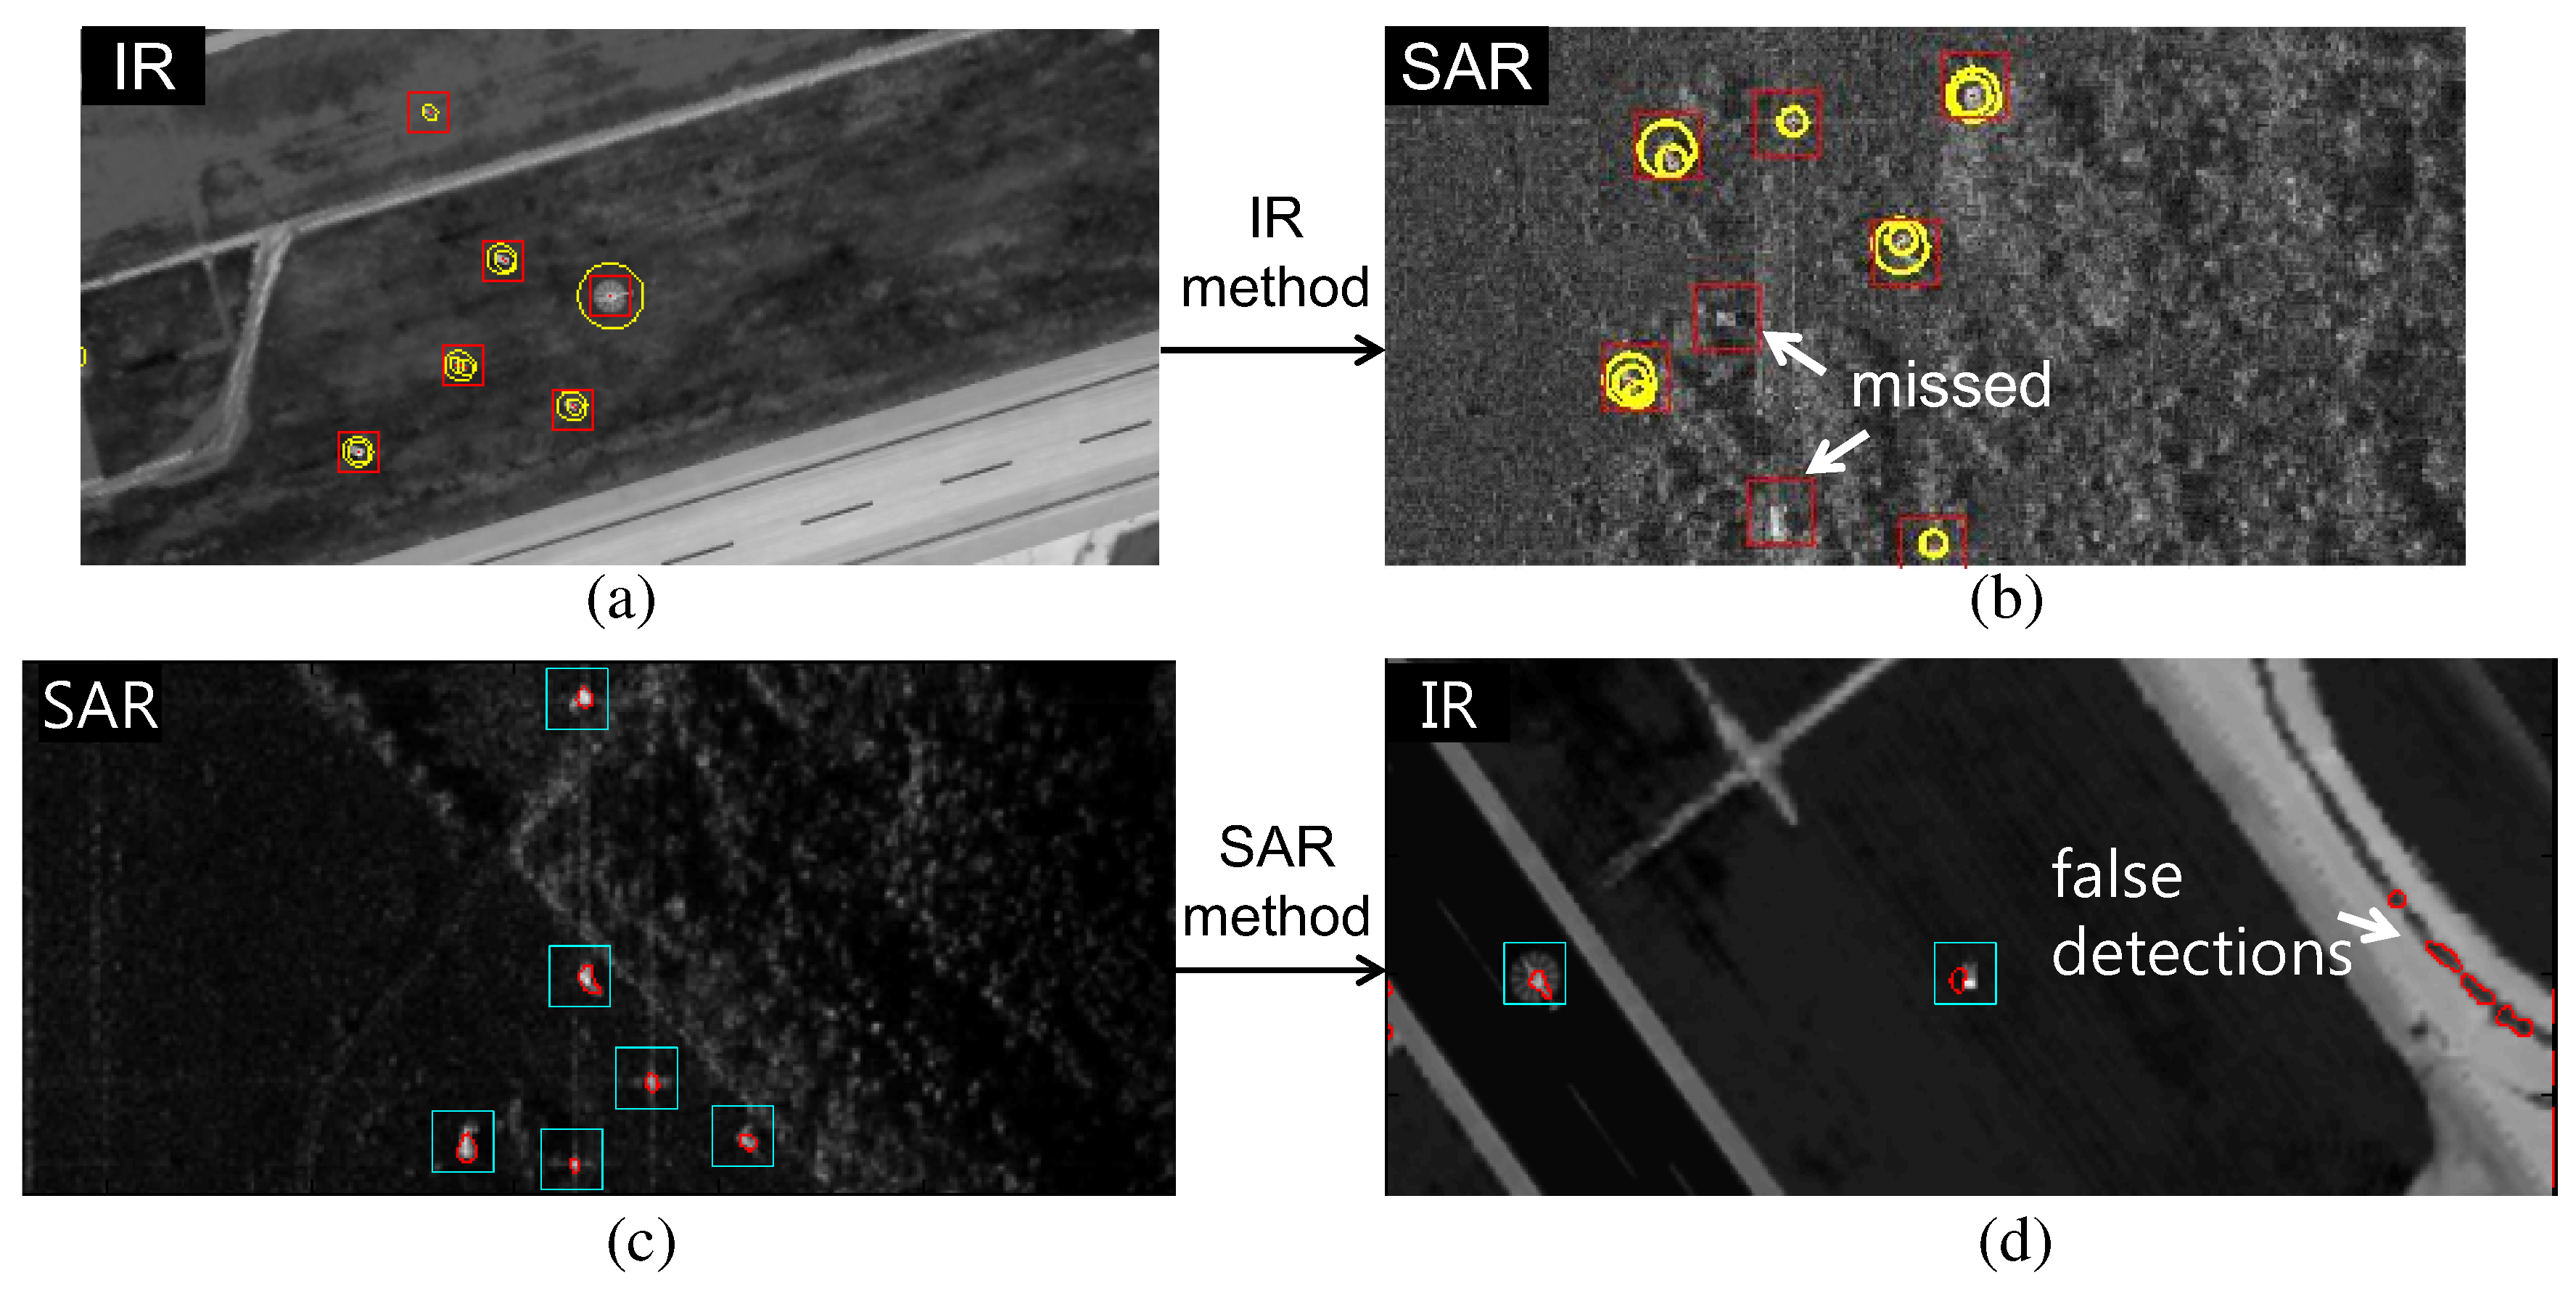
:1. Introduction
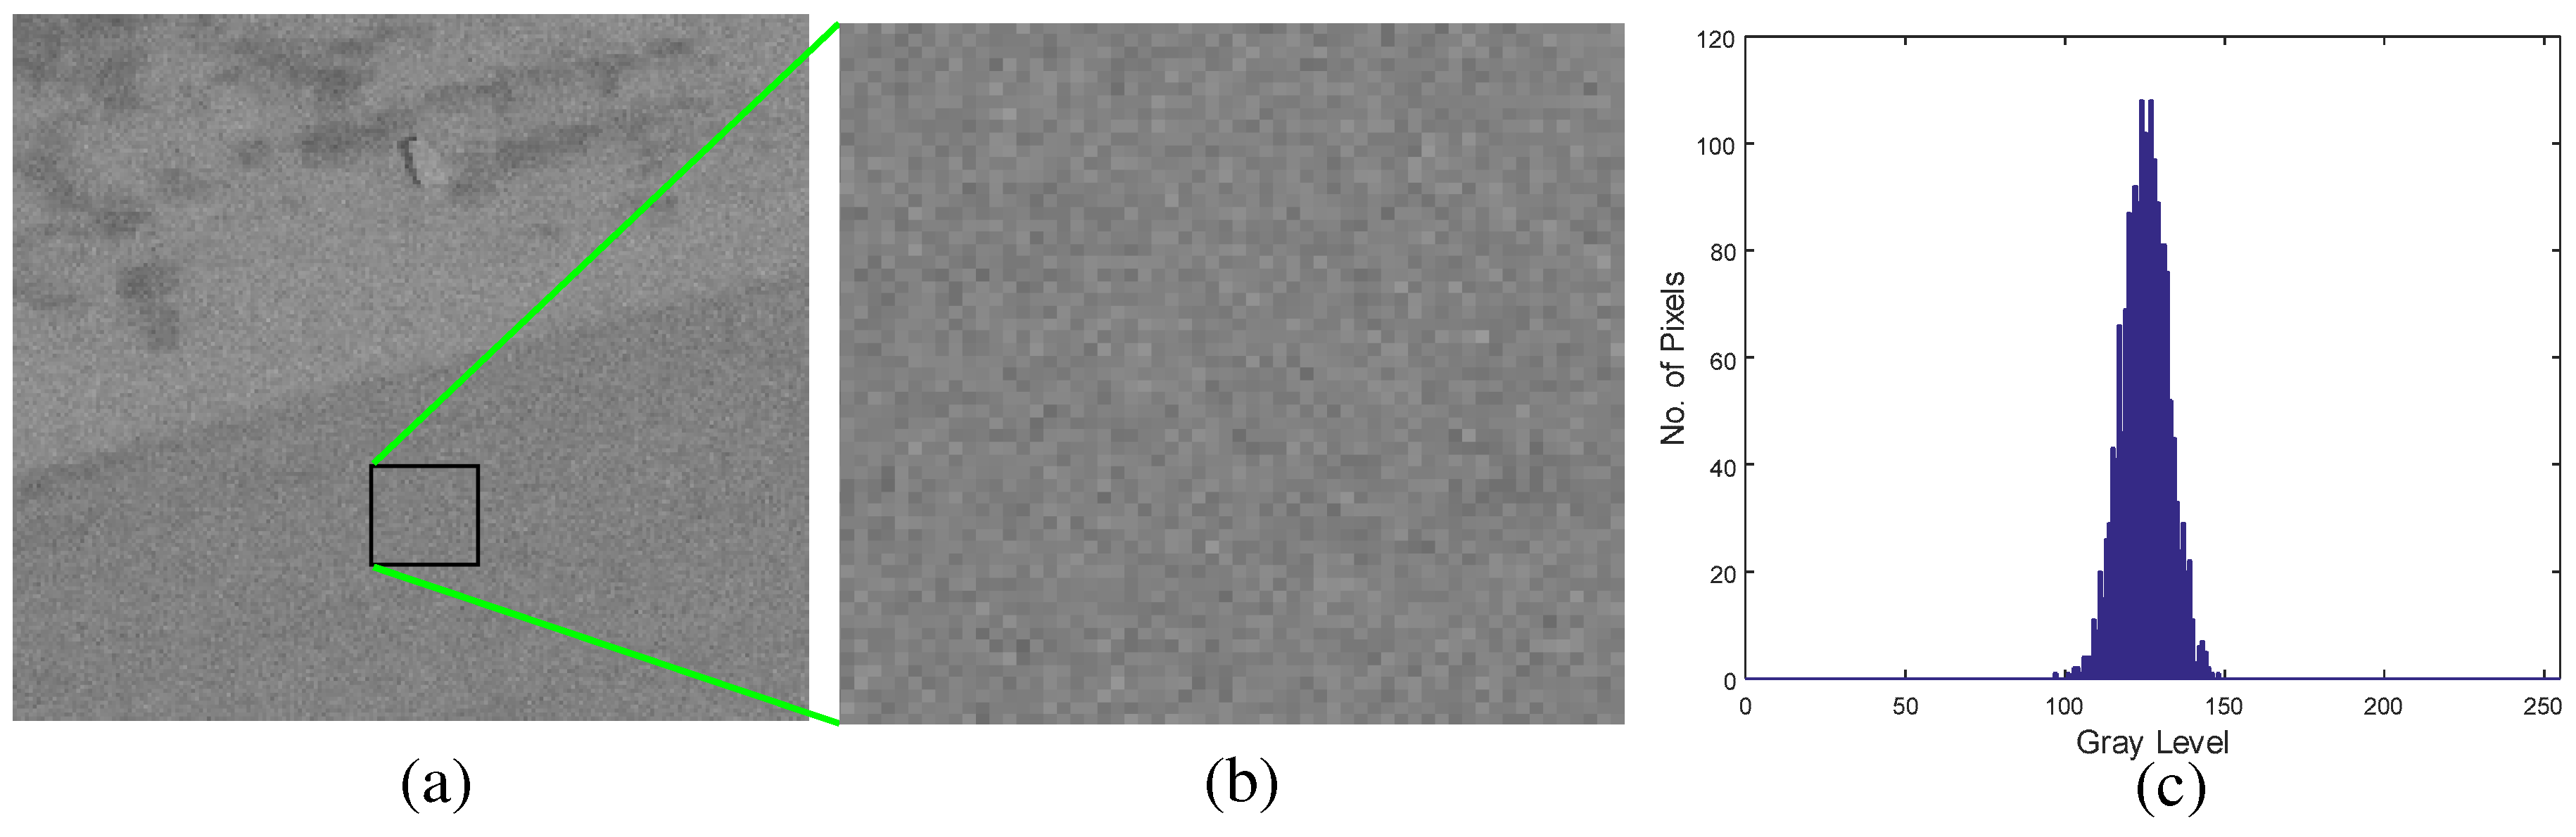
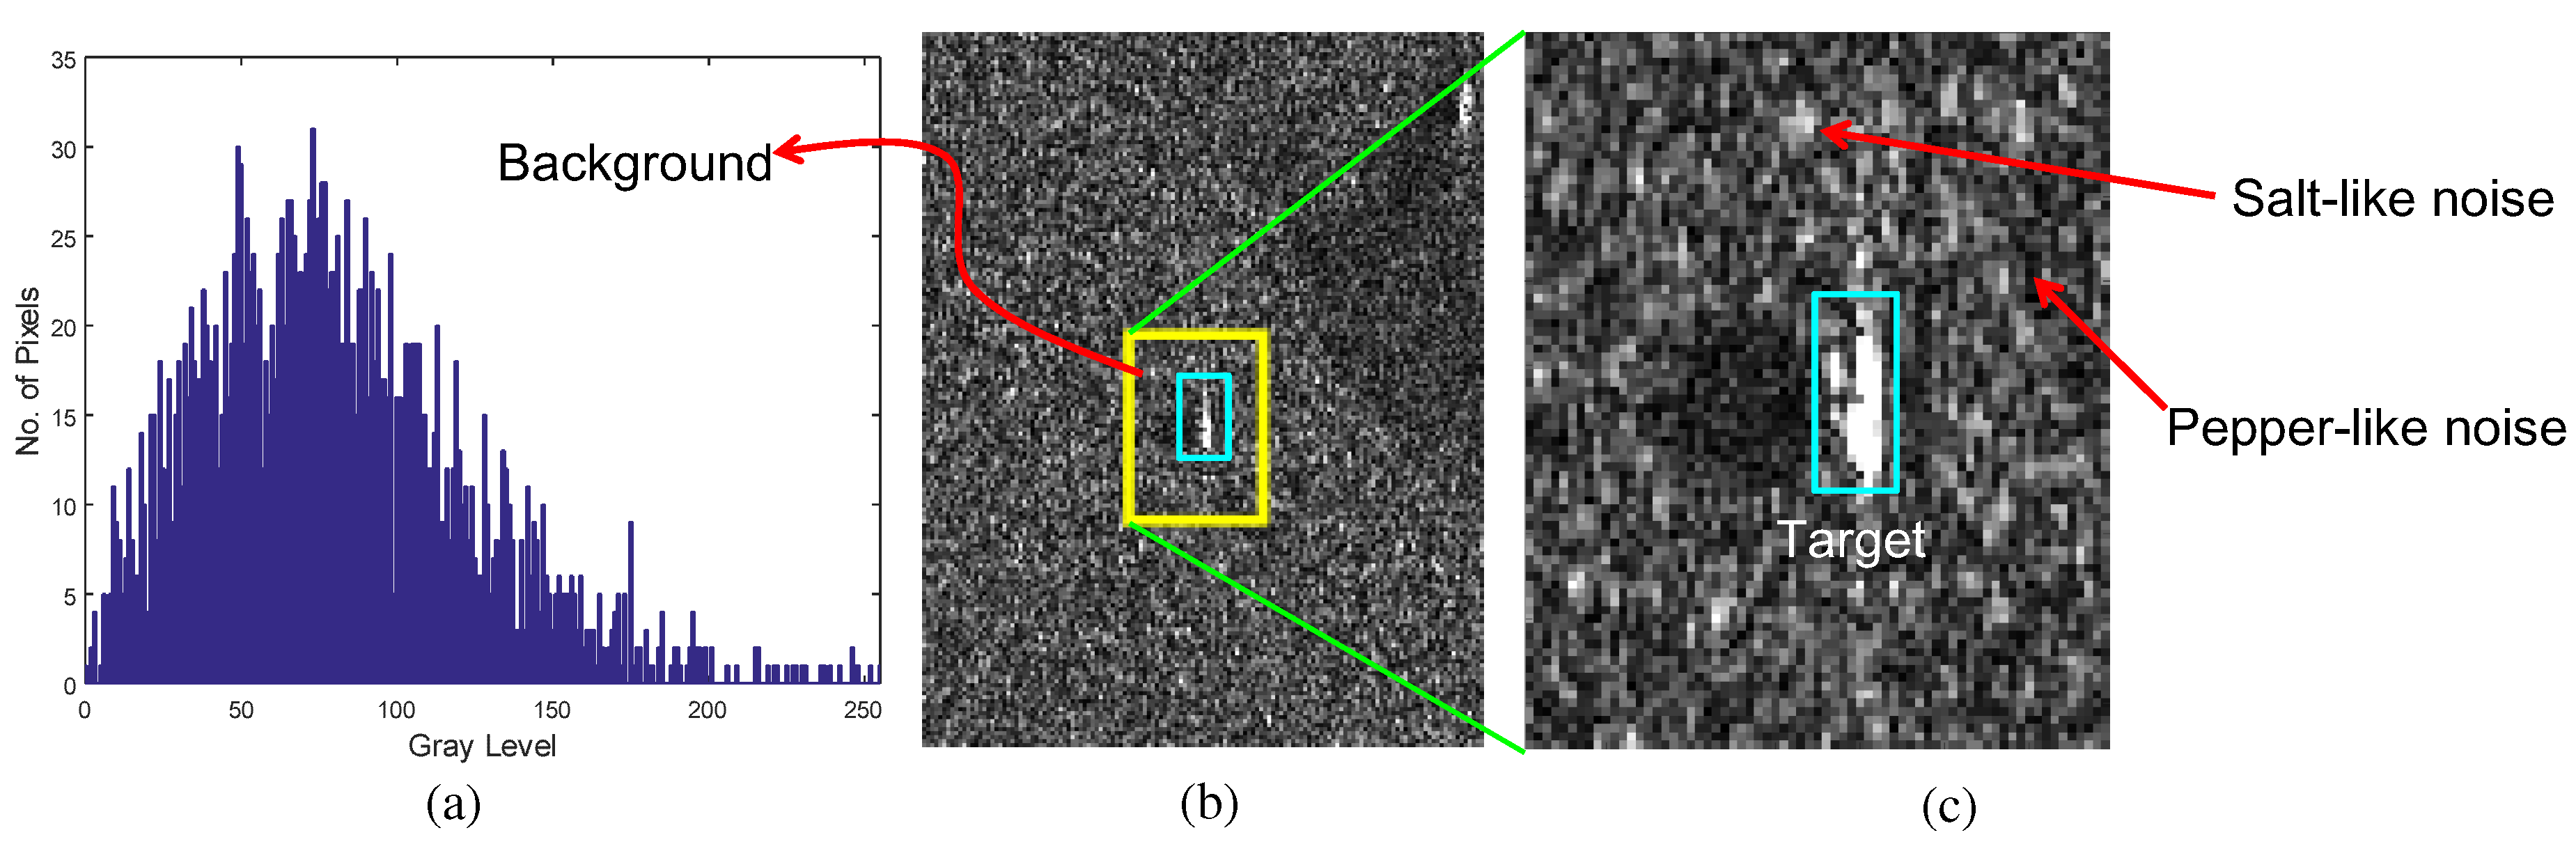
2. Background of BMVT Theory and Its Limitations
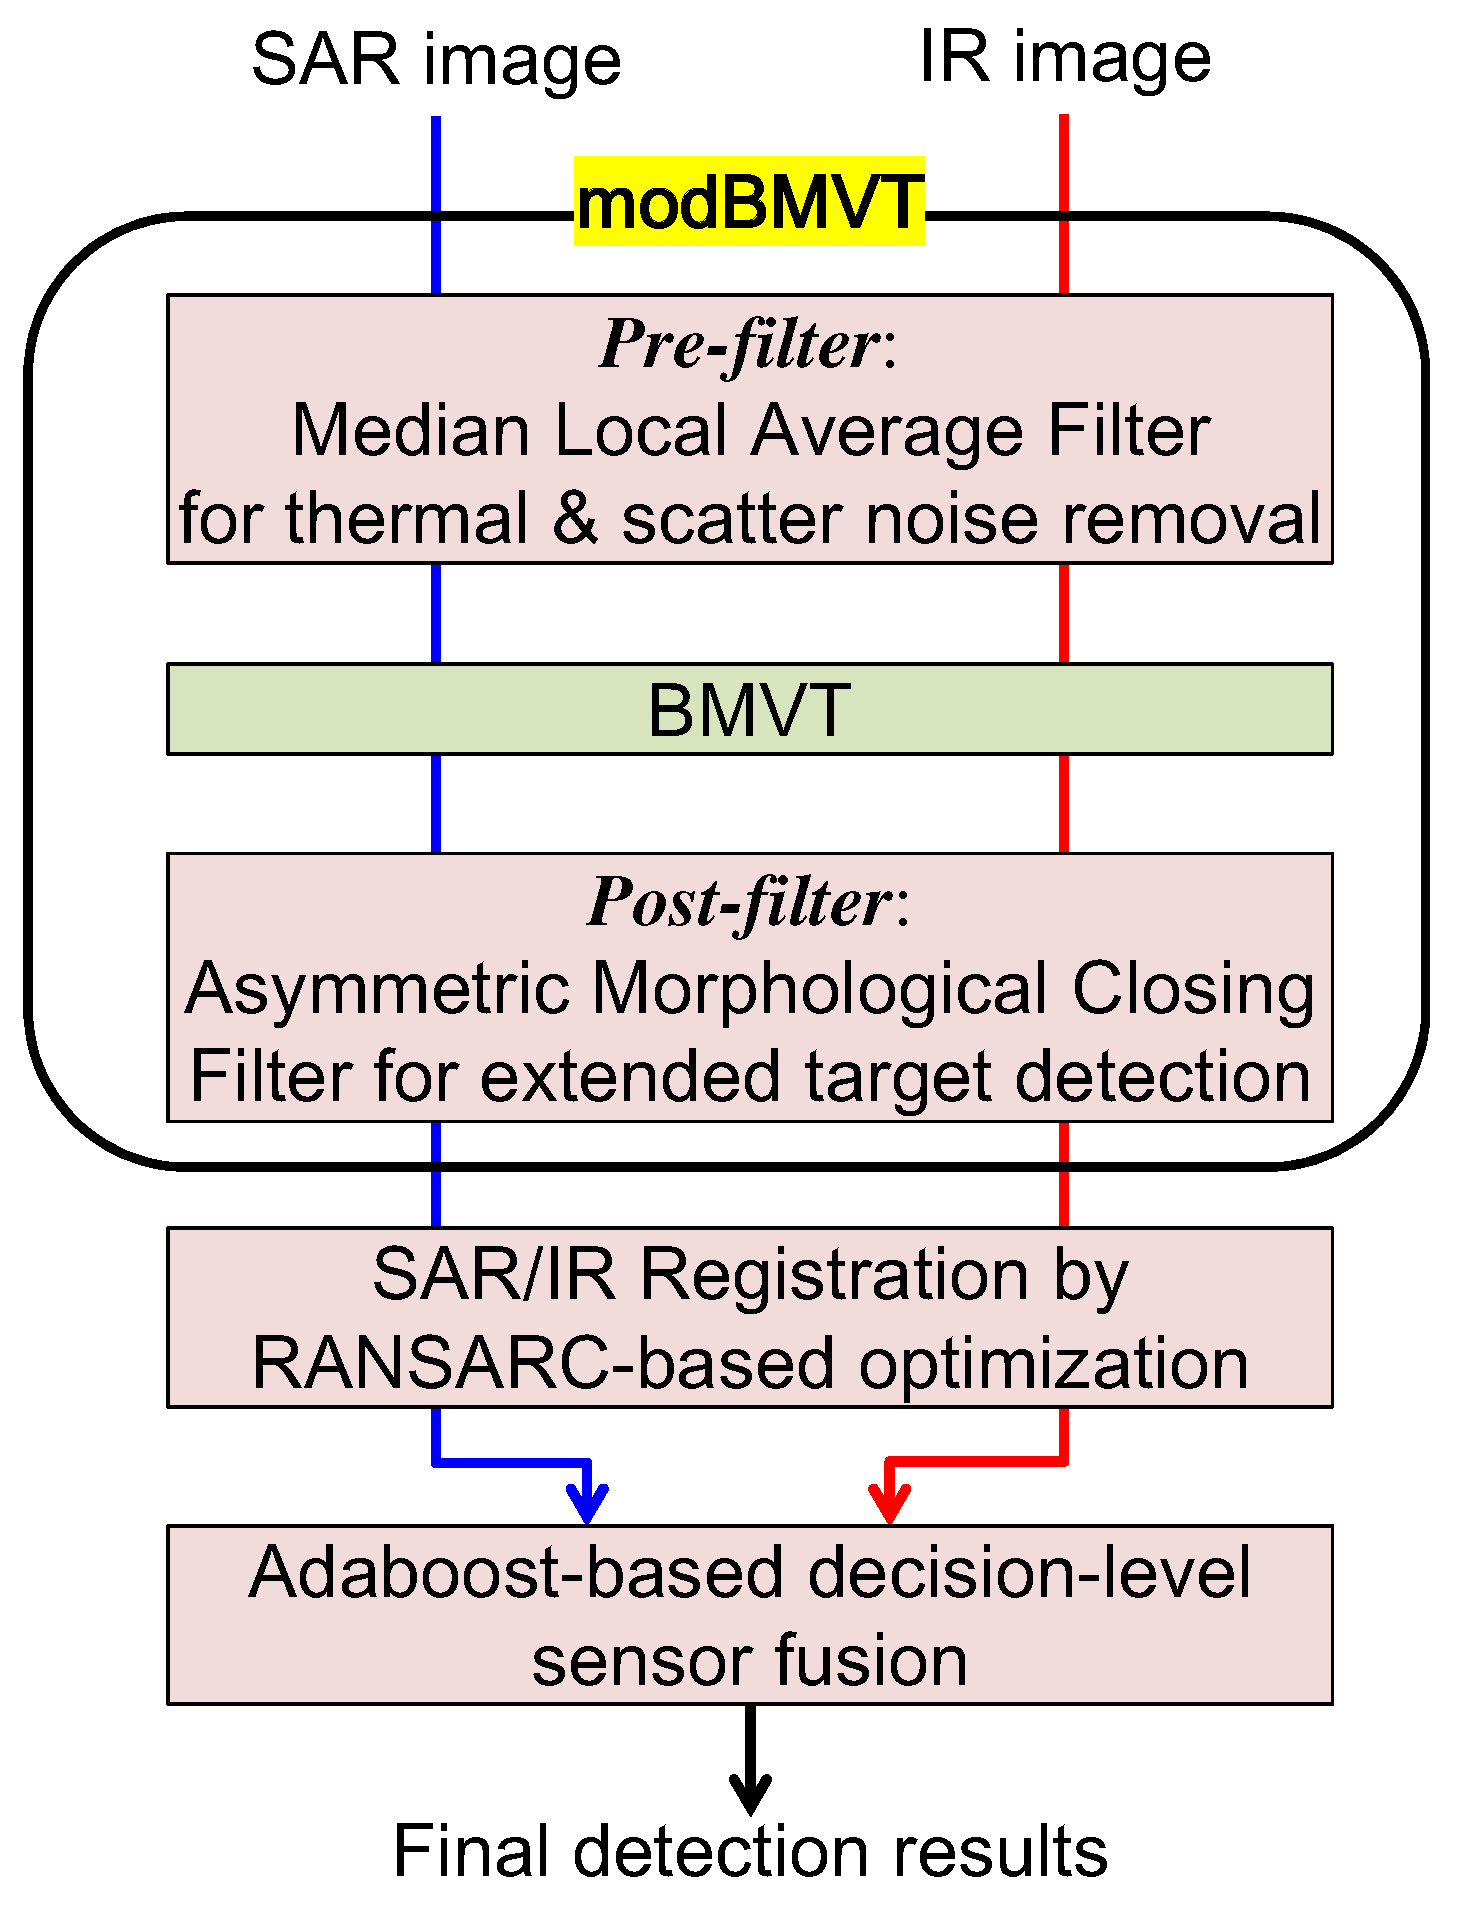
3. Proposed Fusion-Based Extended SAR/IR Target Detection Using modBMVT
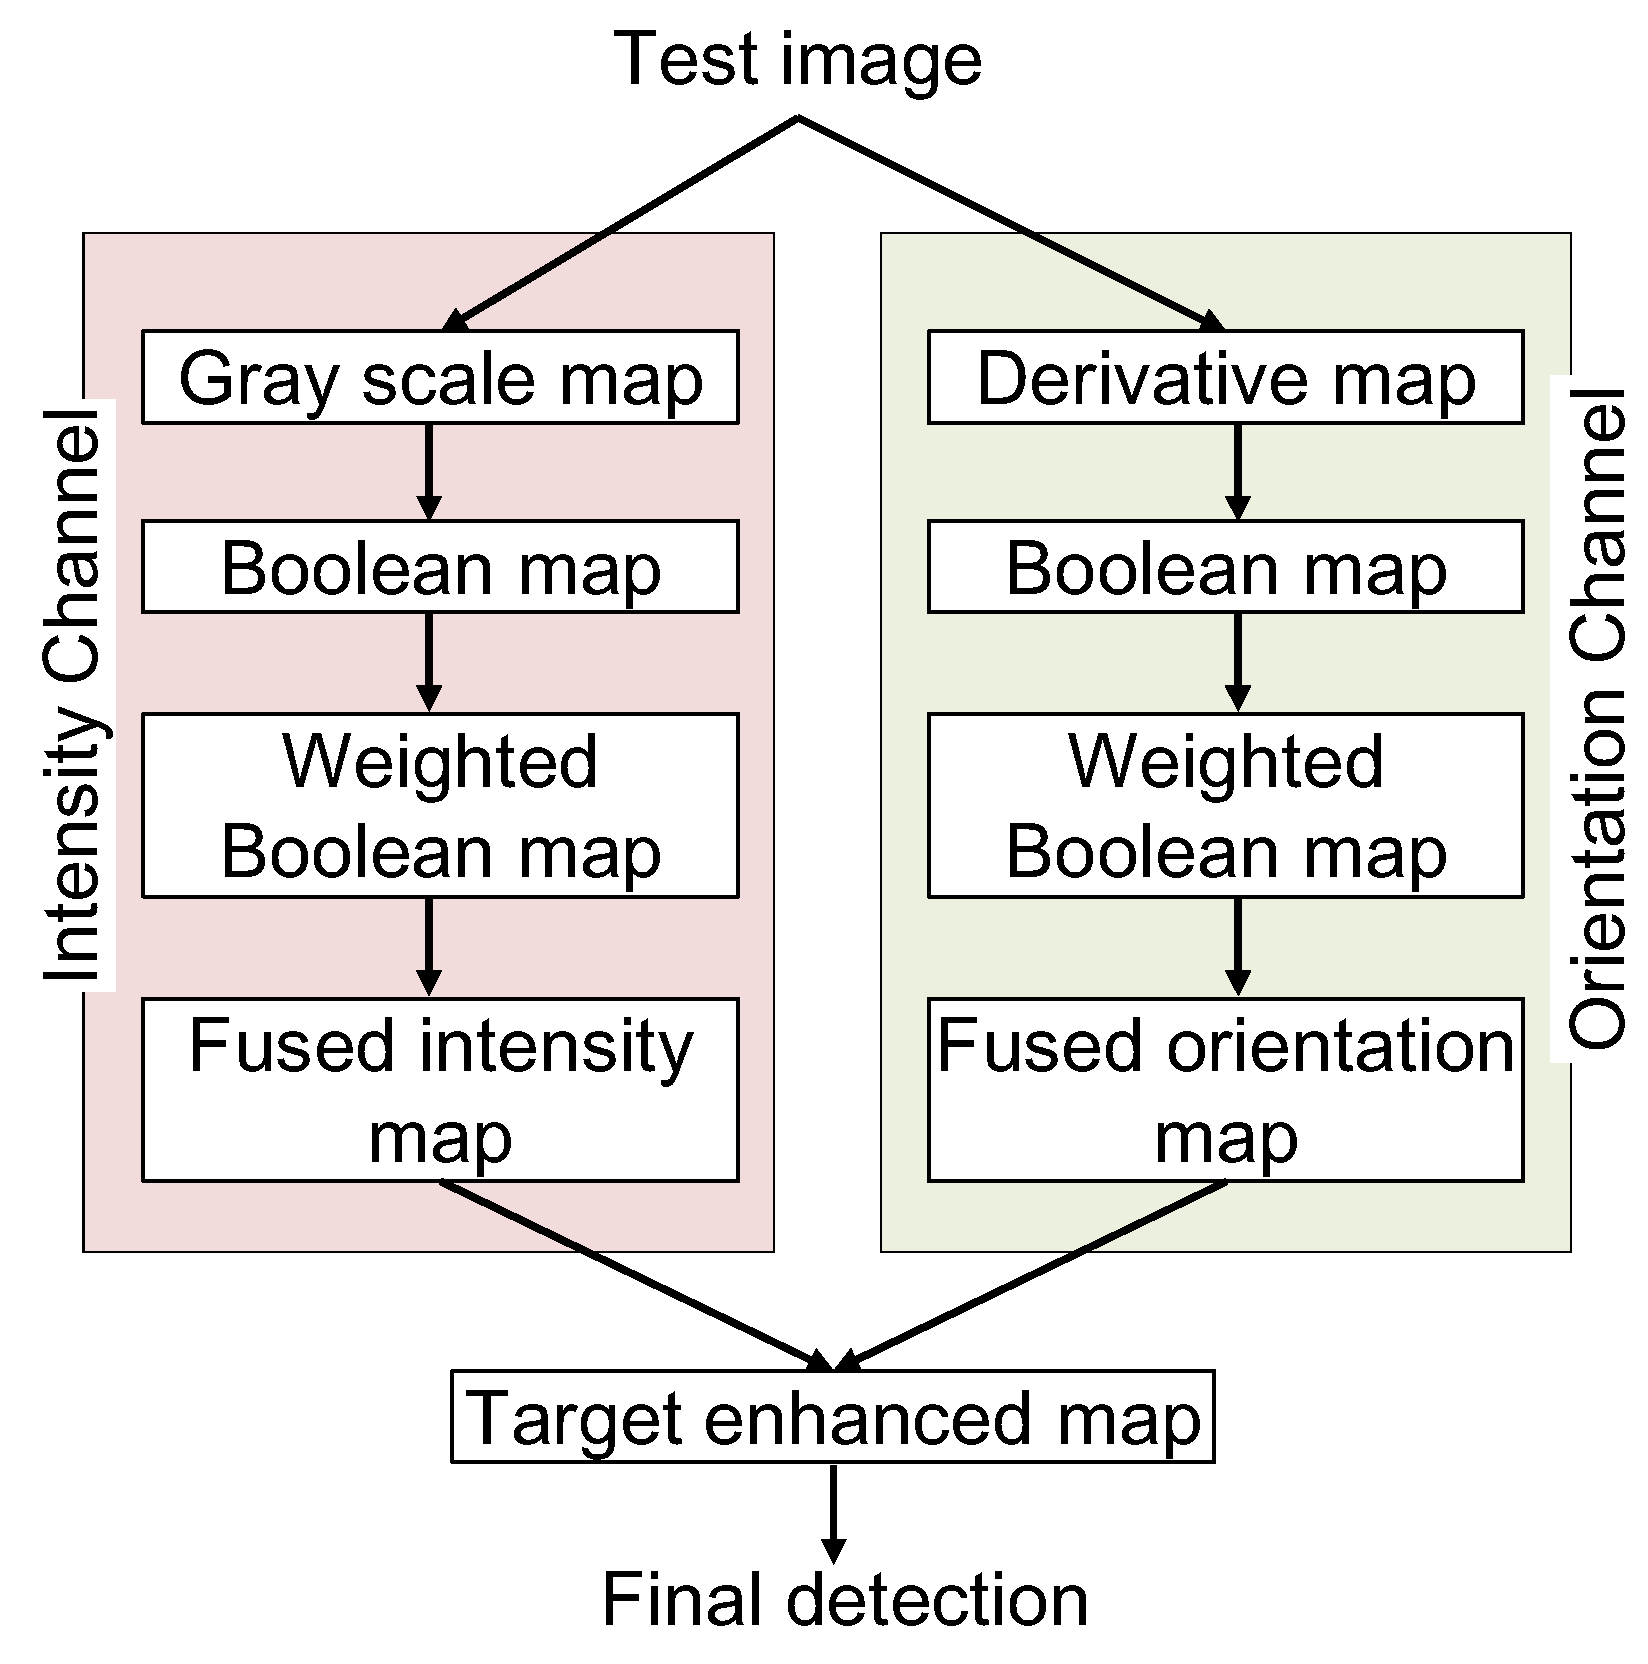
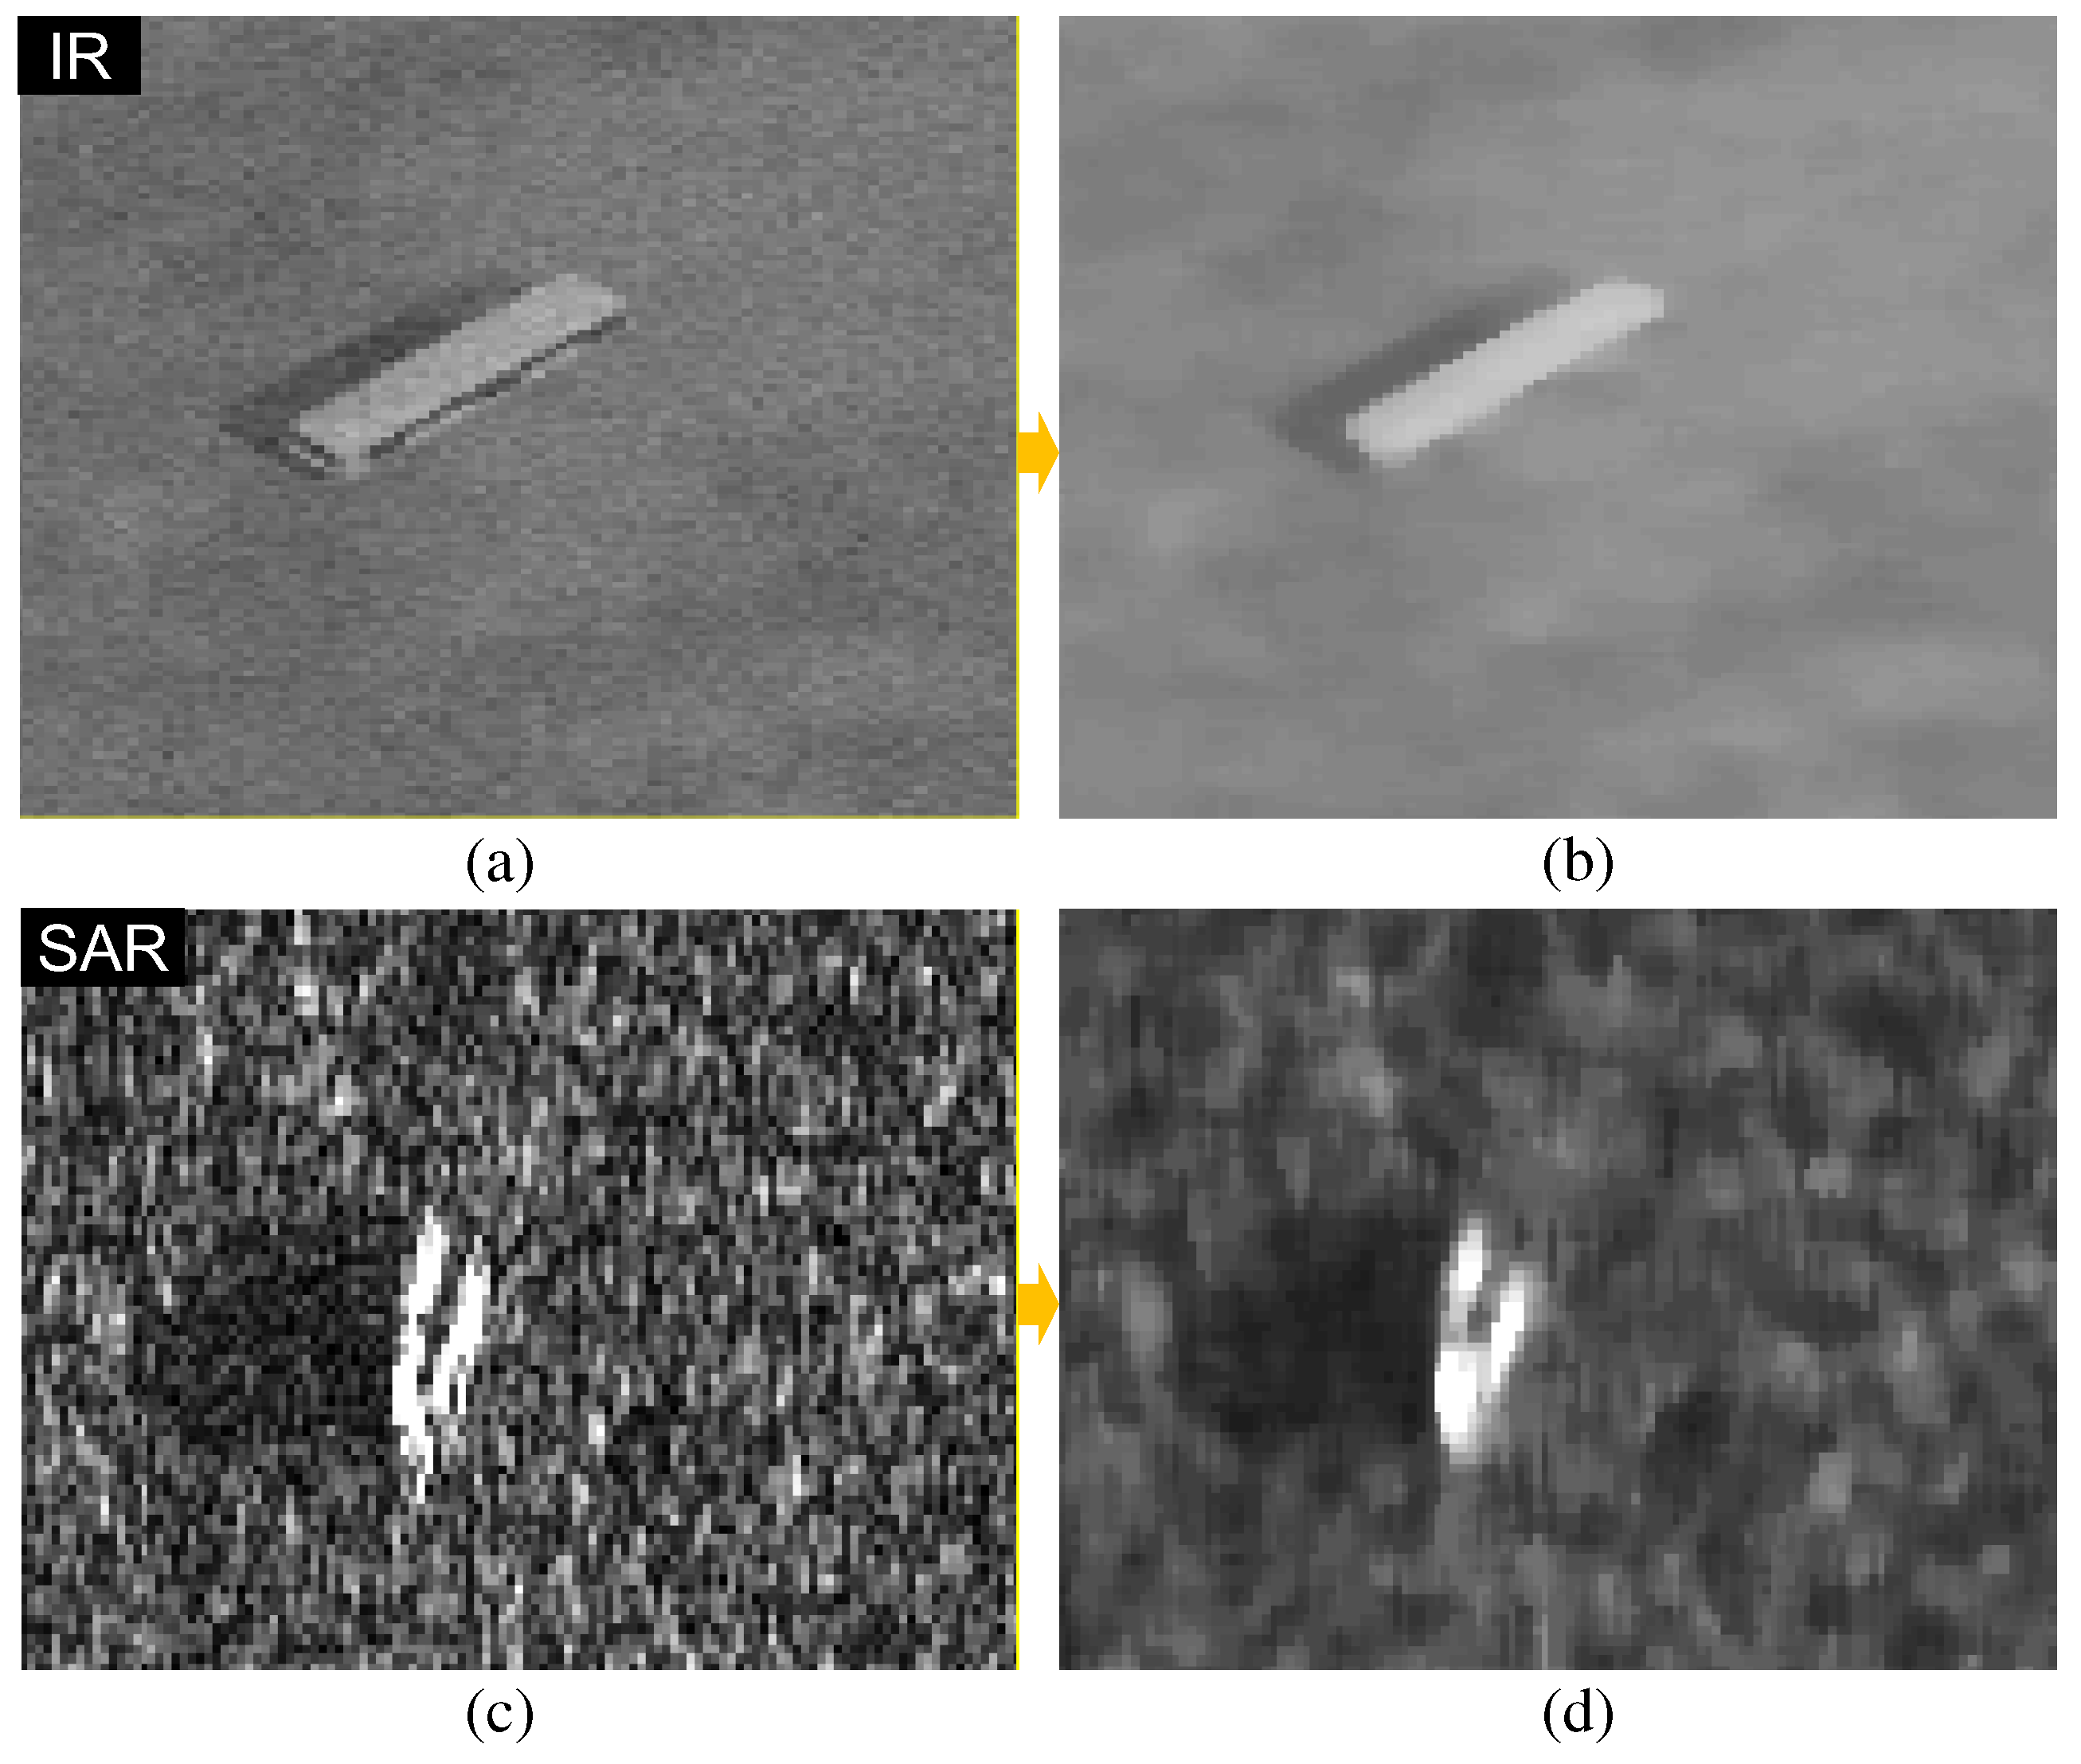
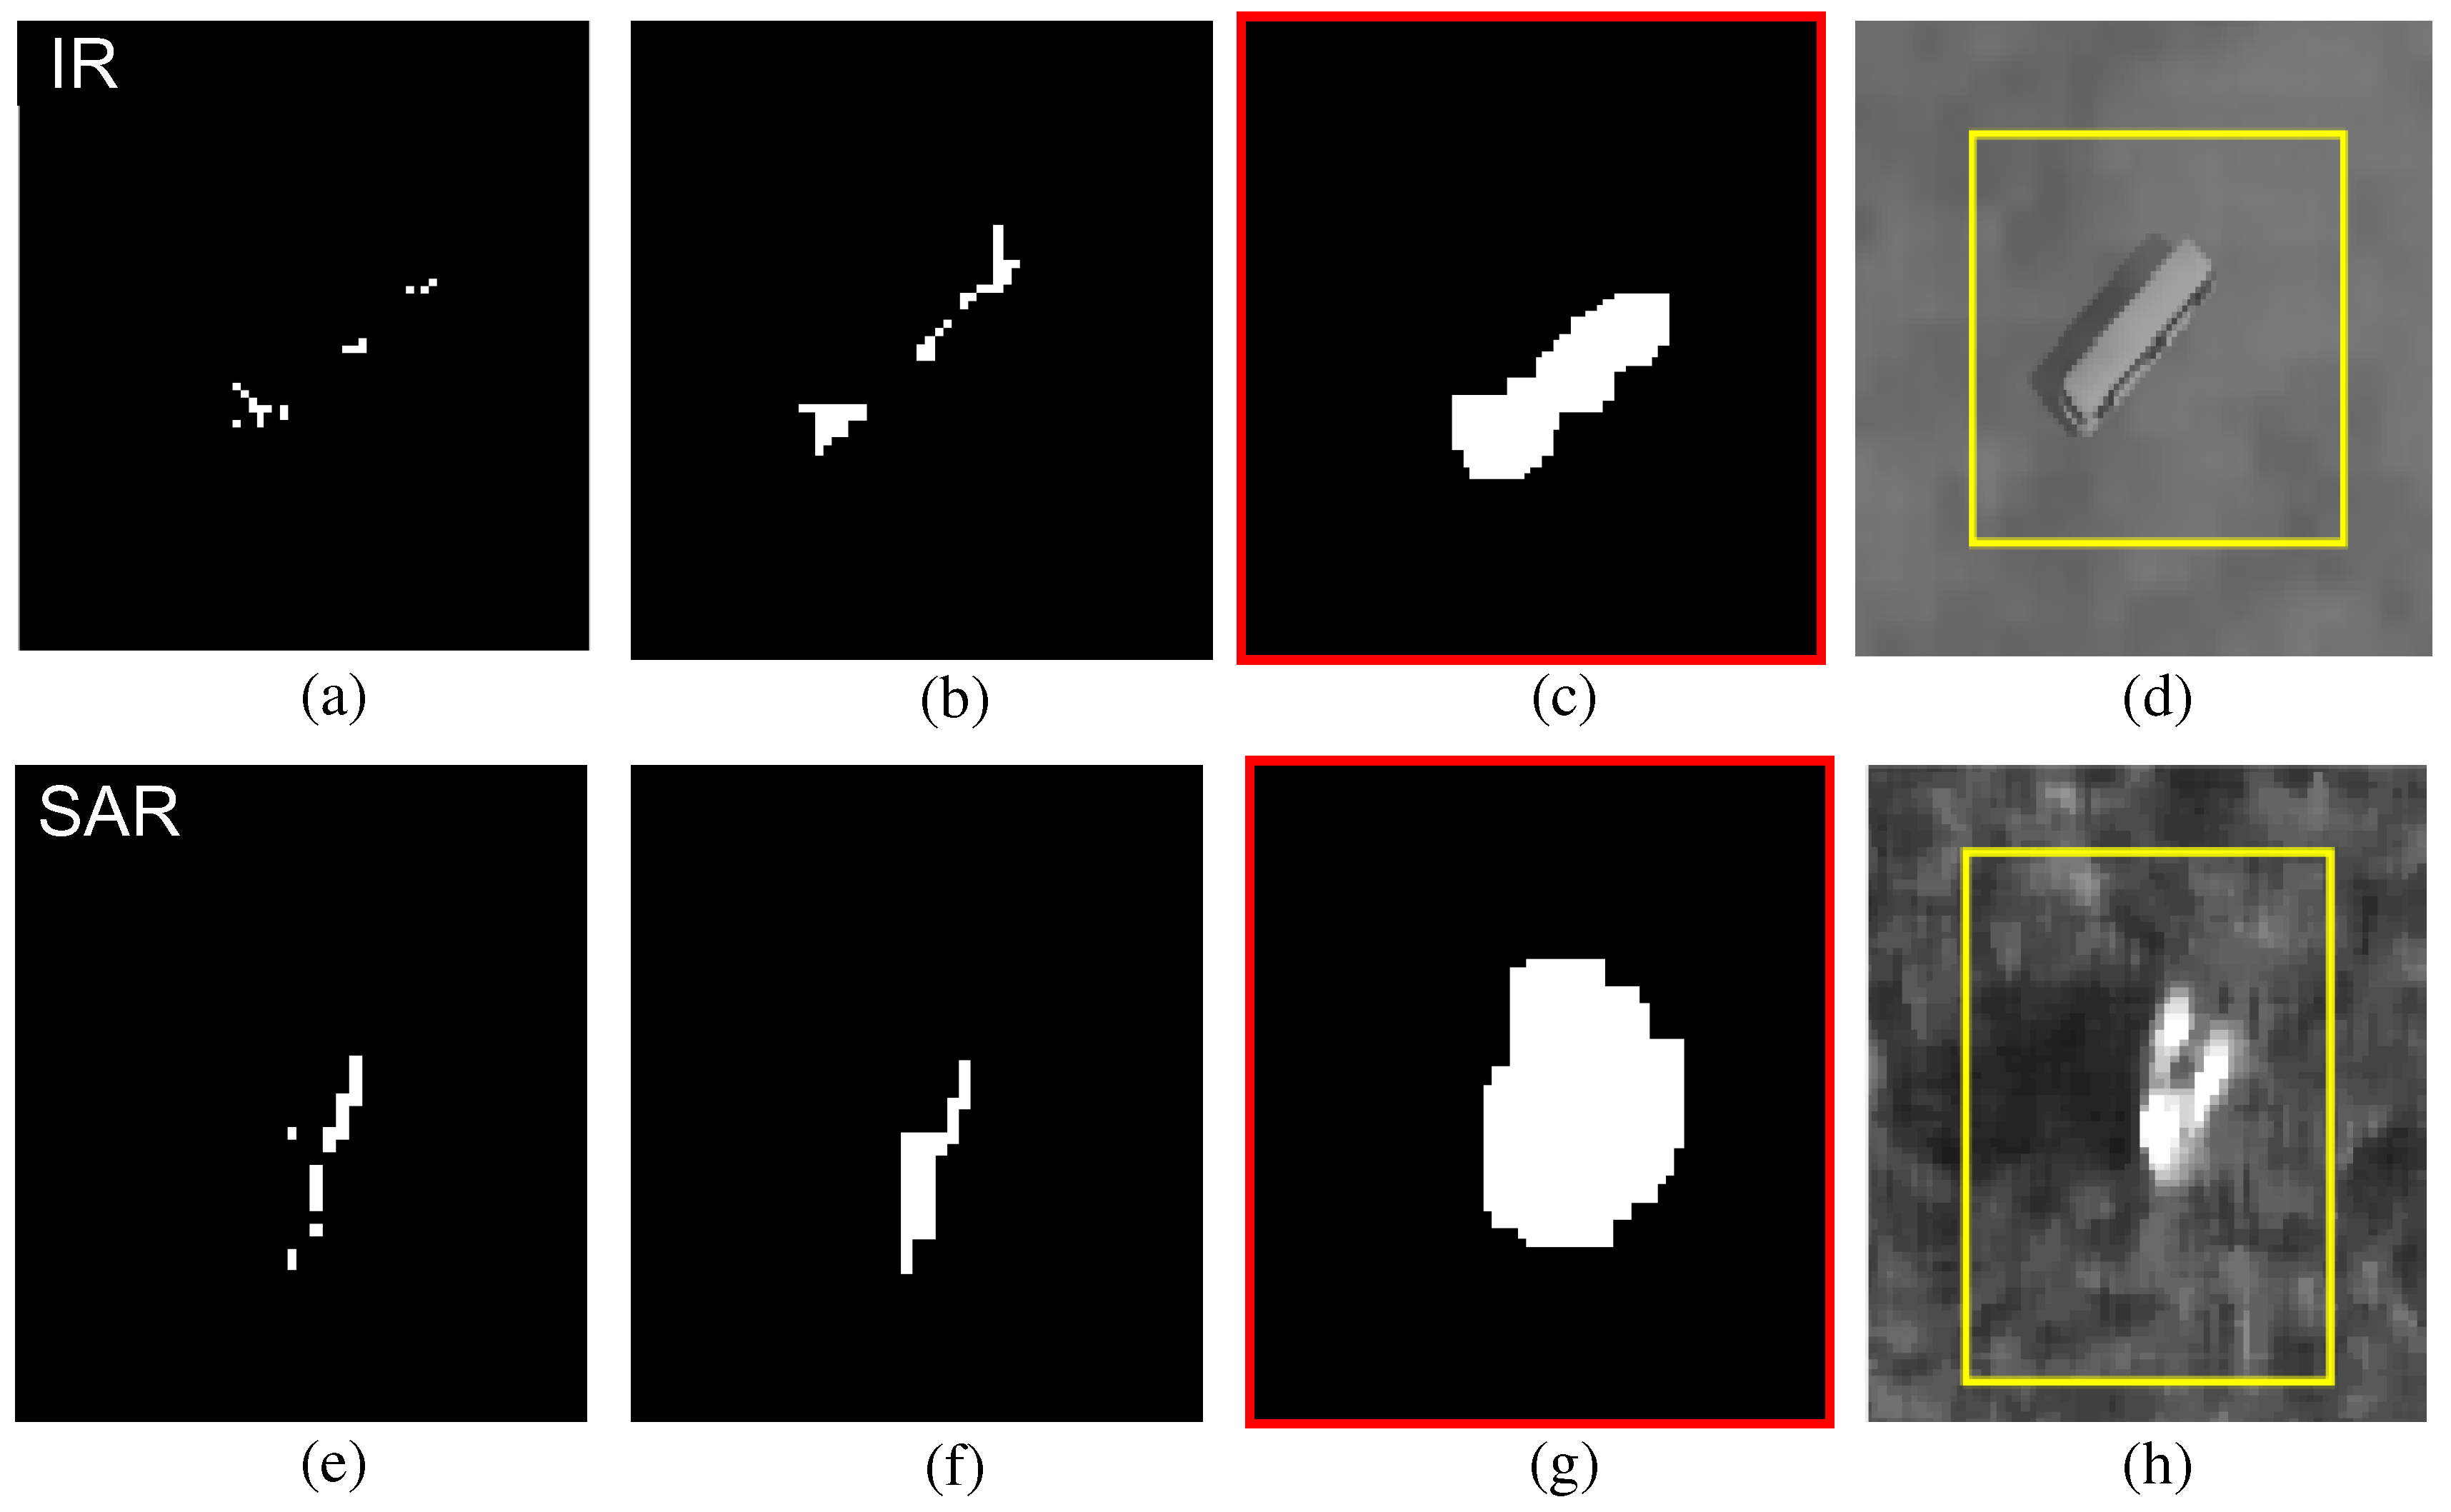
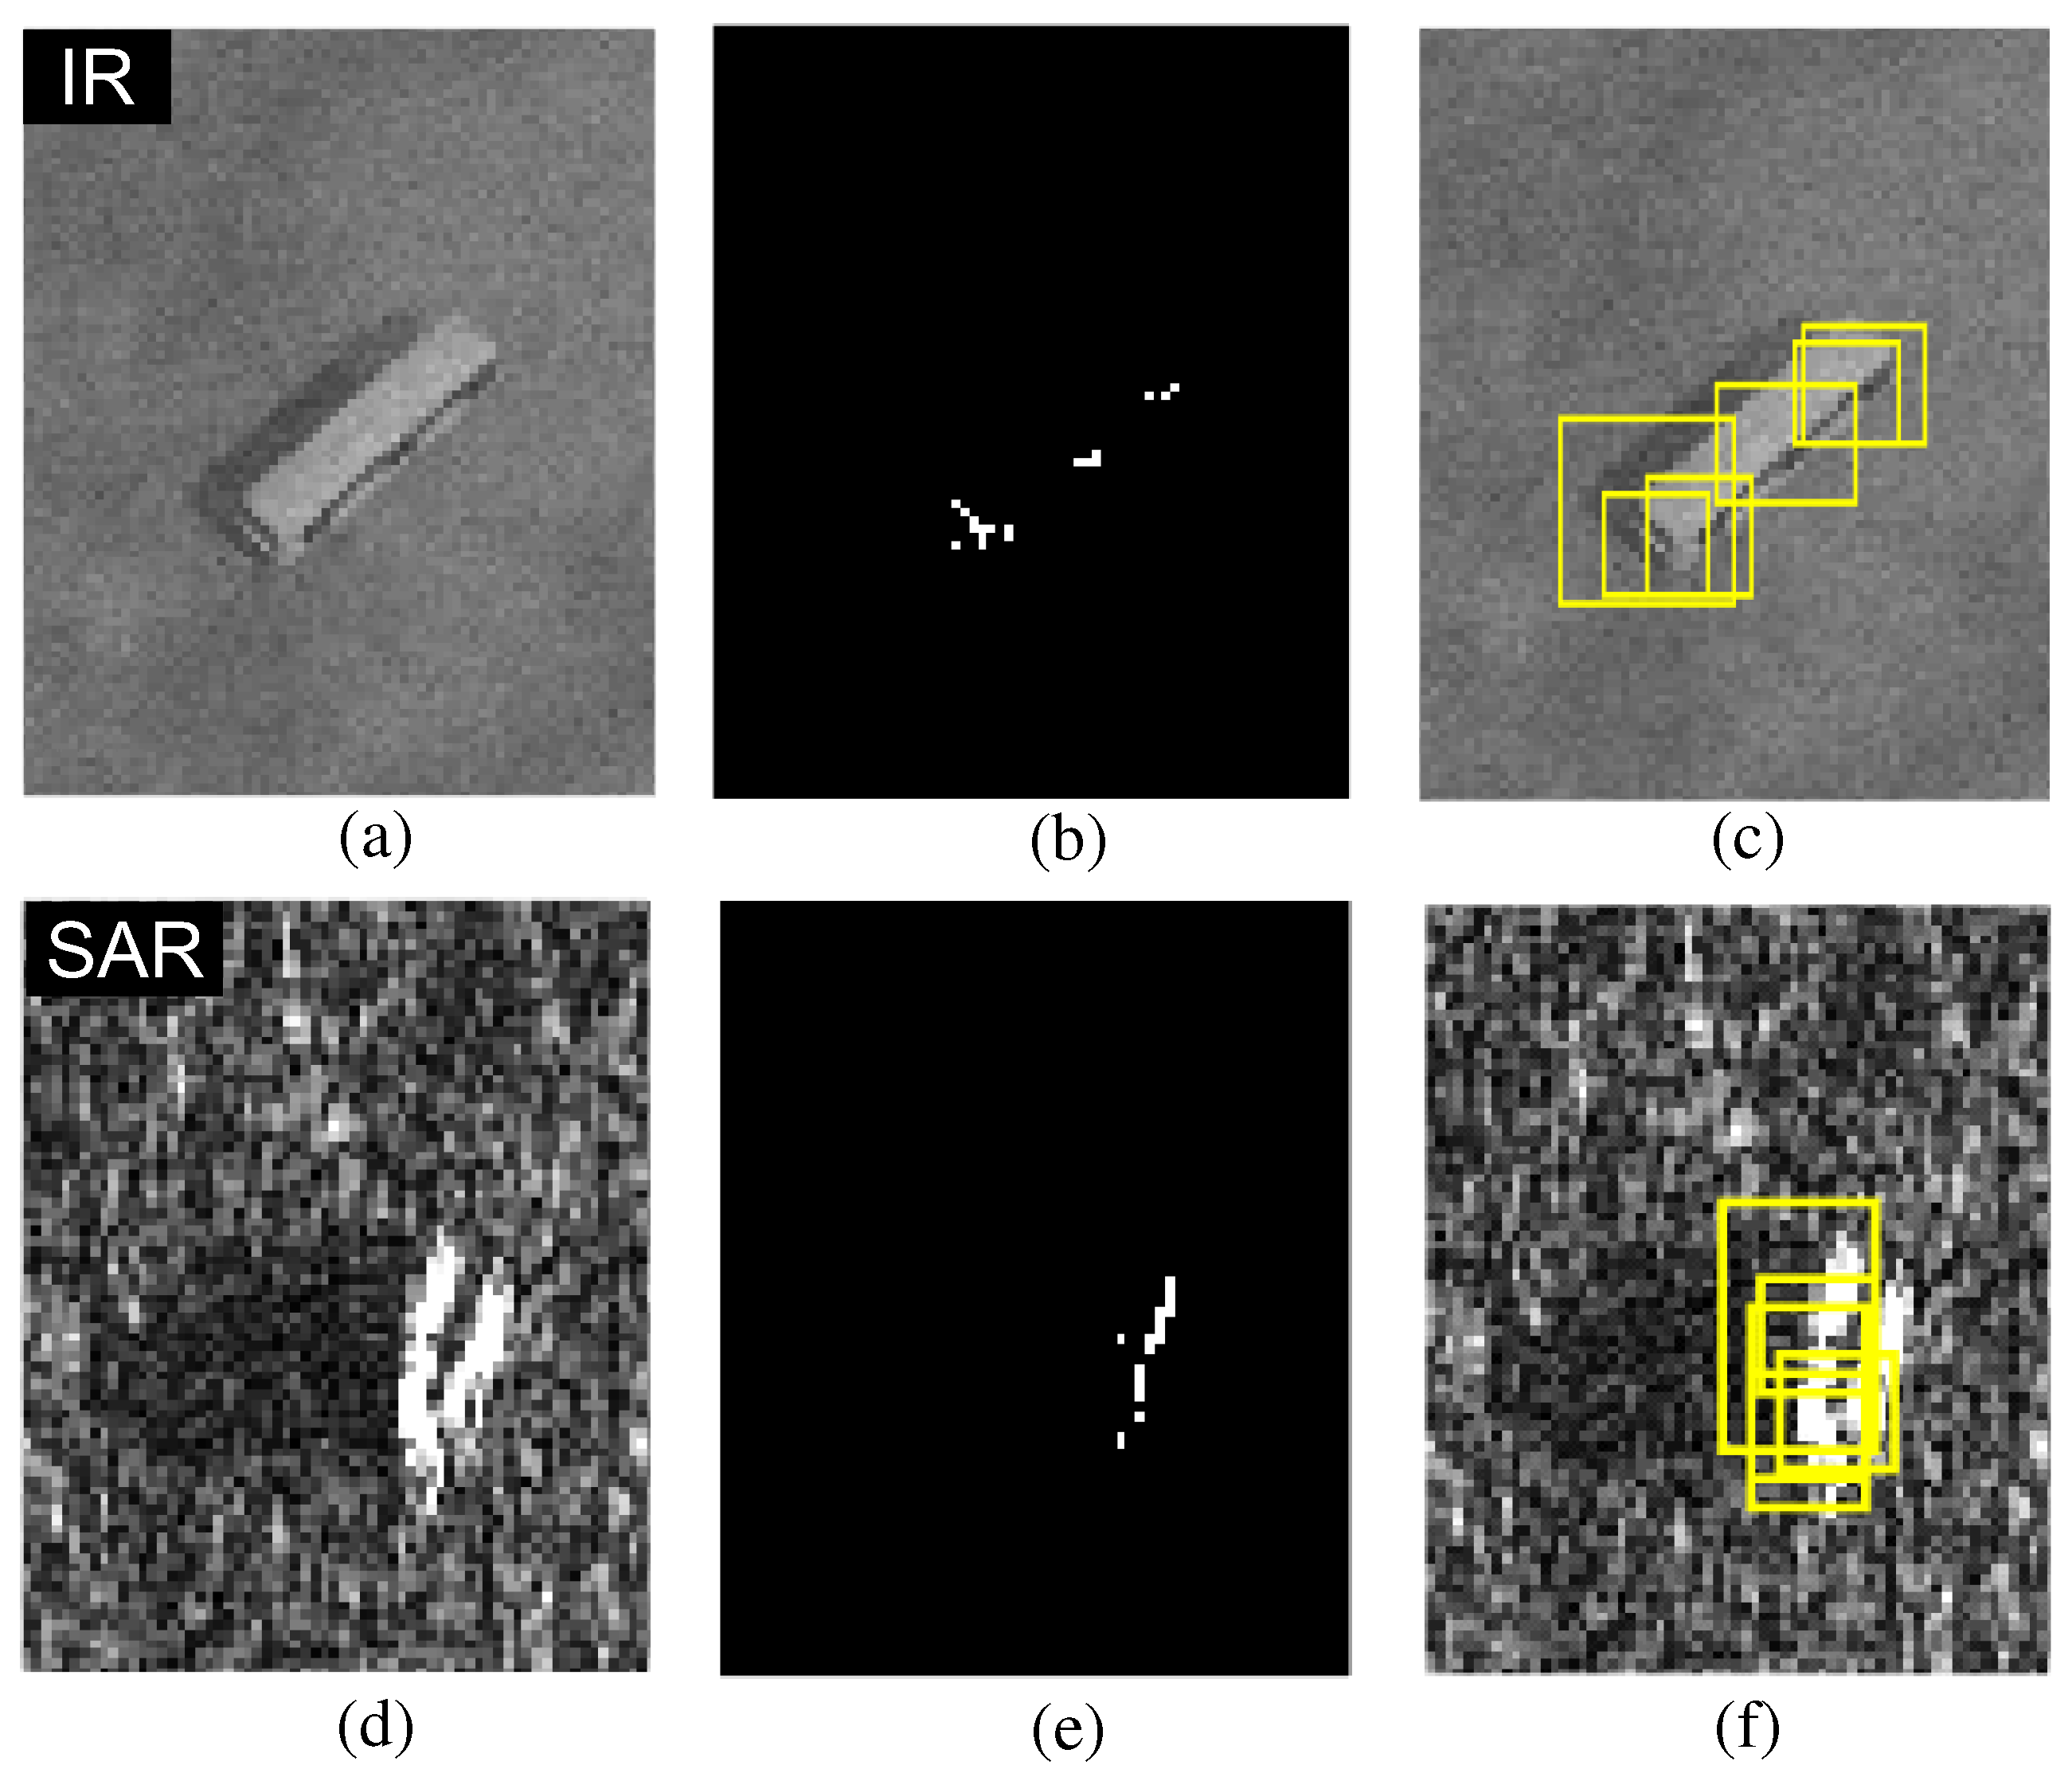
3.1. Proposed Modified BMVT-Based Target Detection: modBMVT
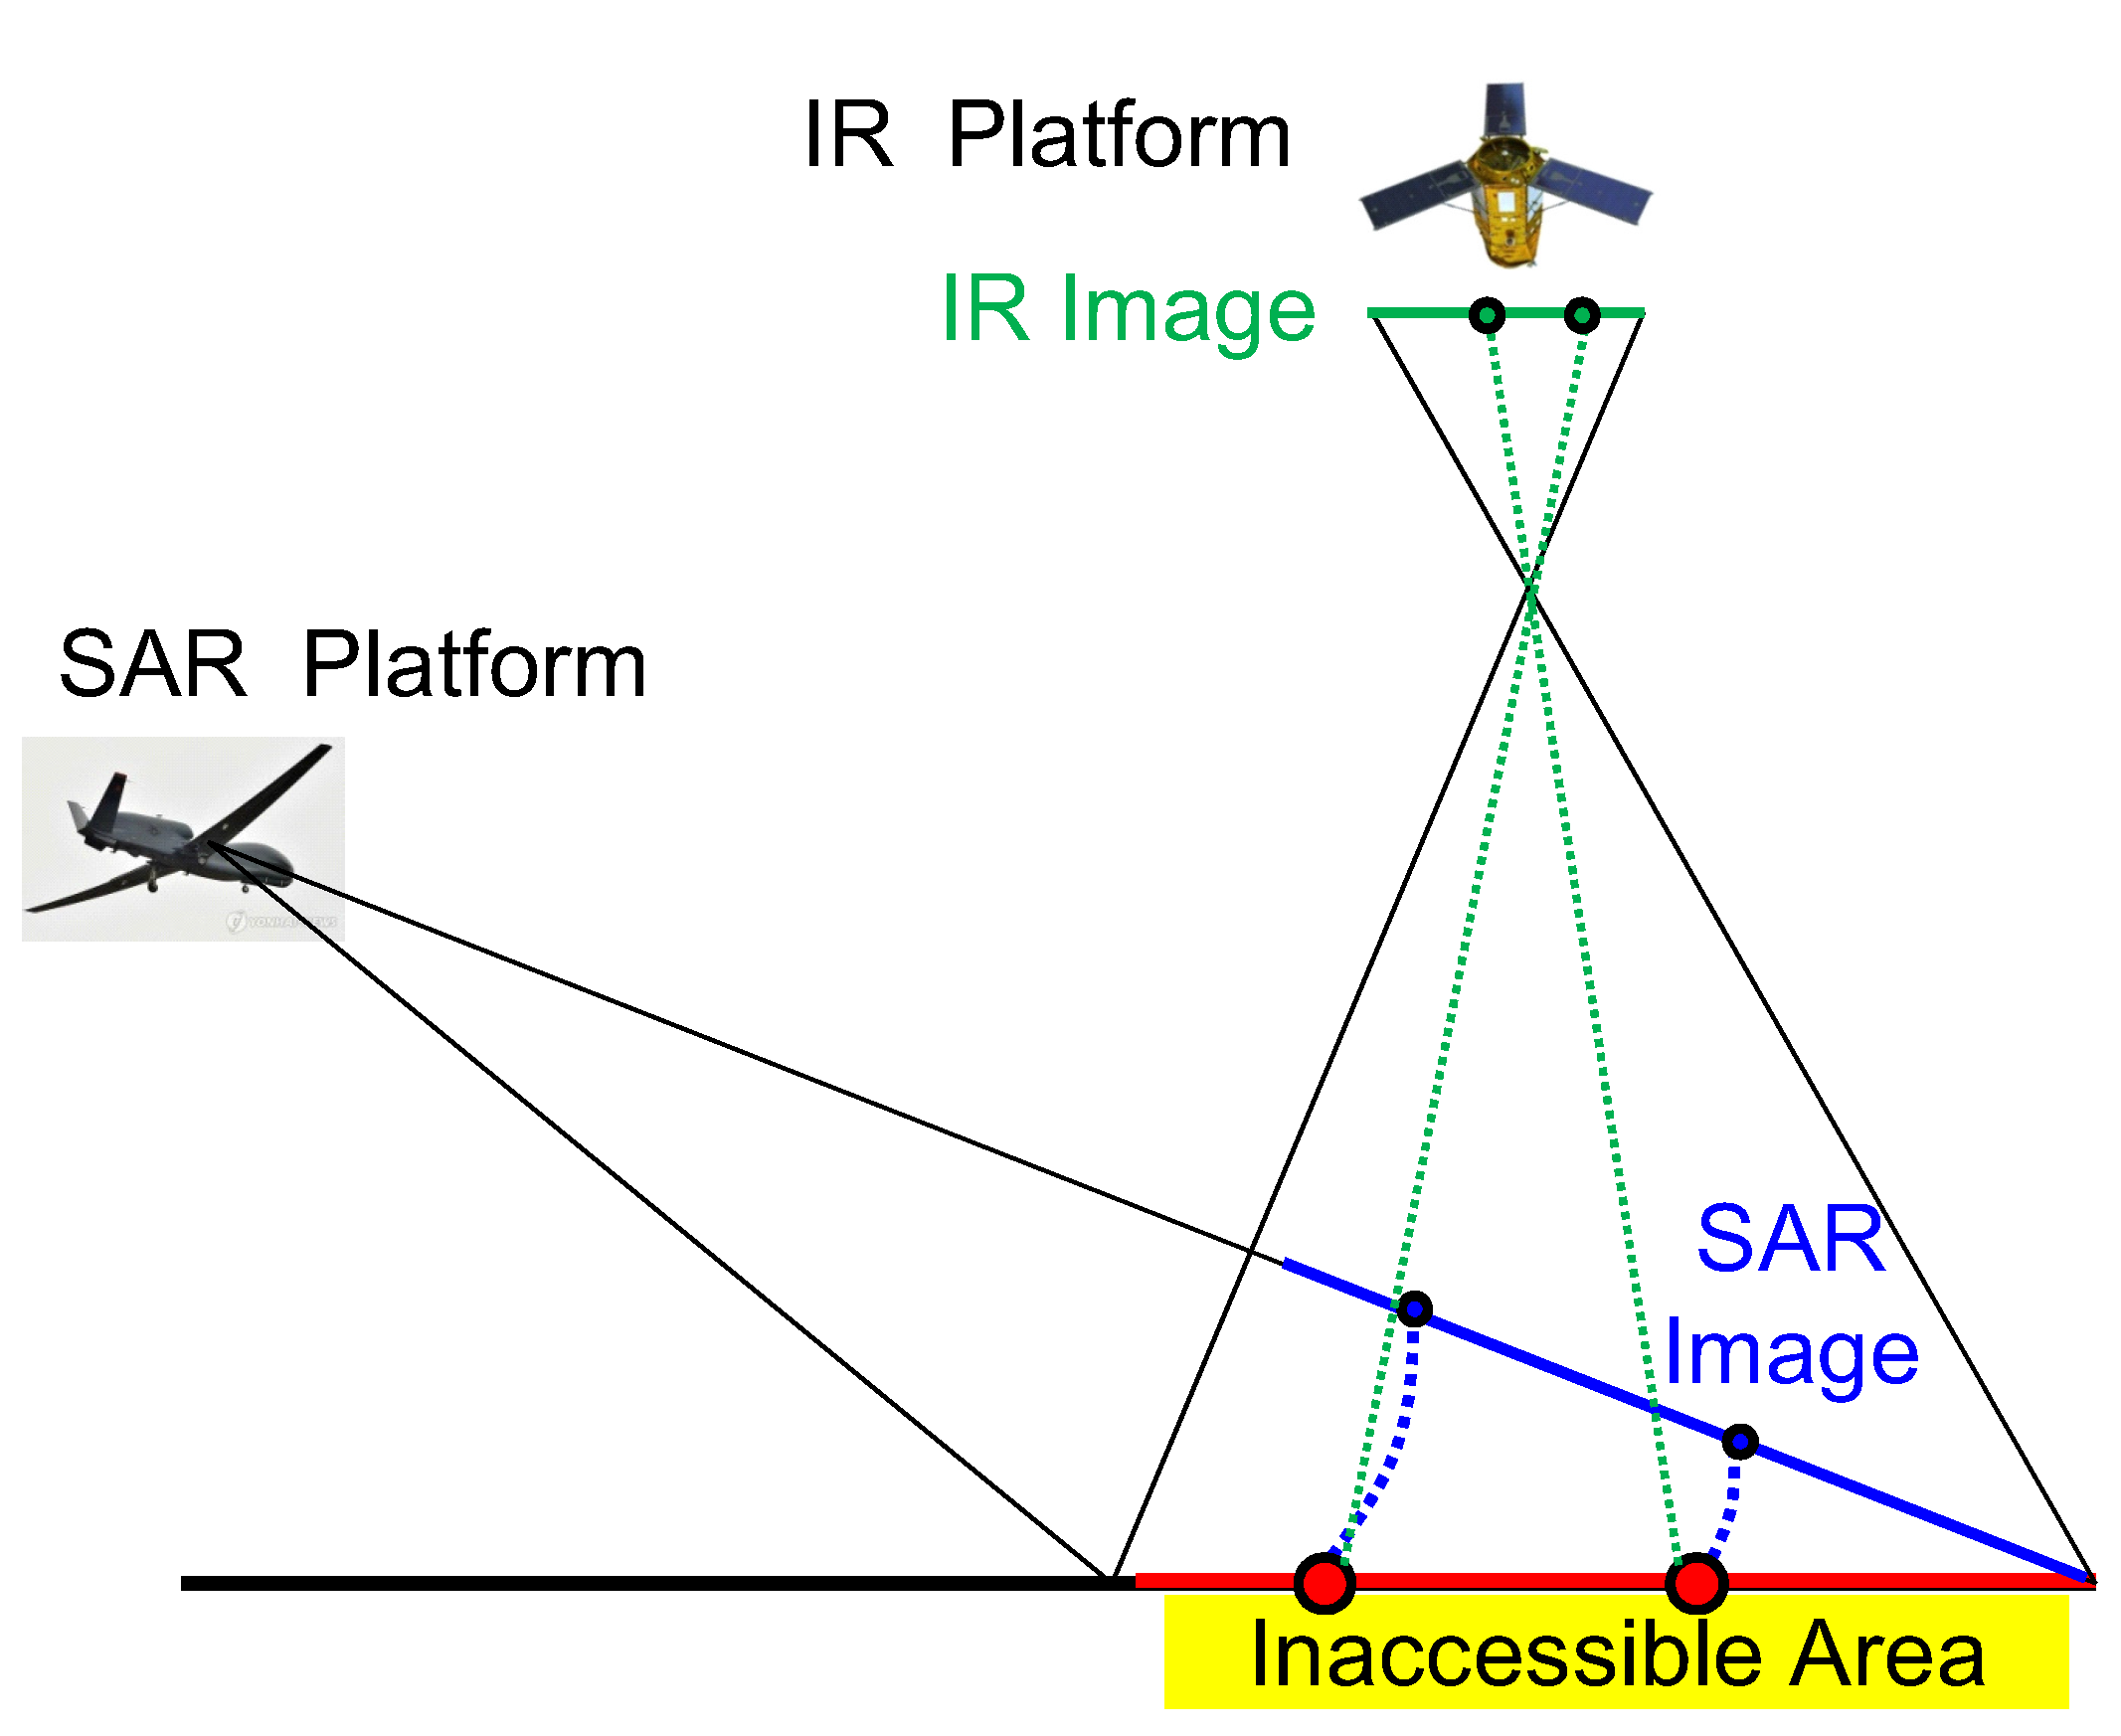
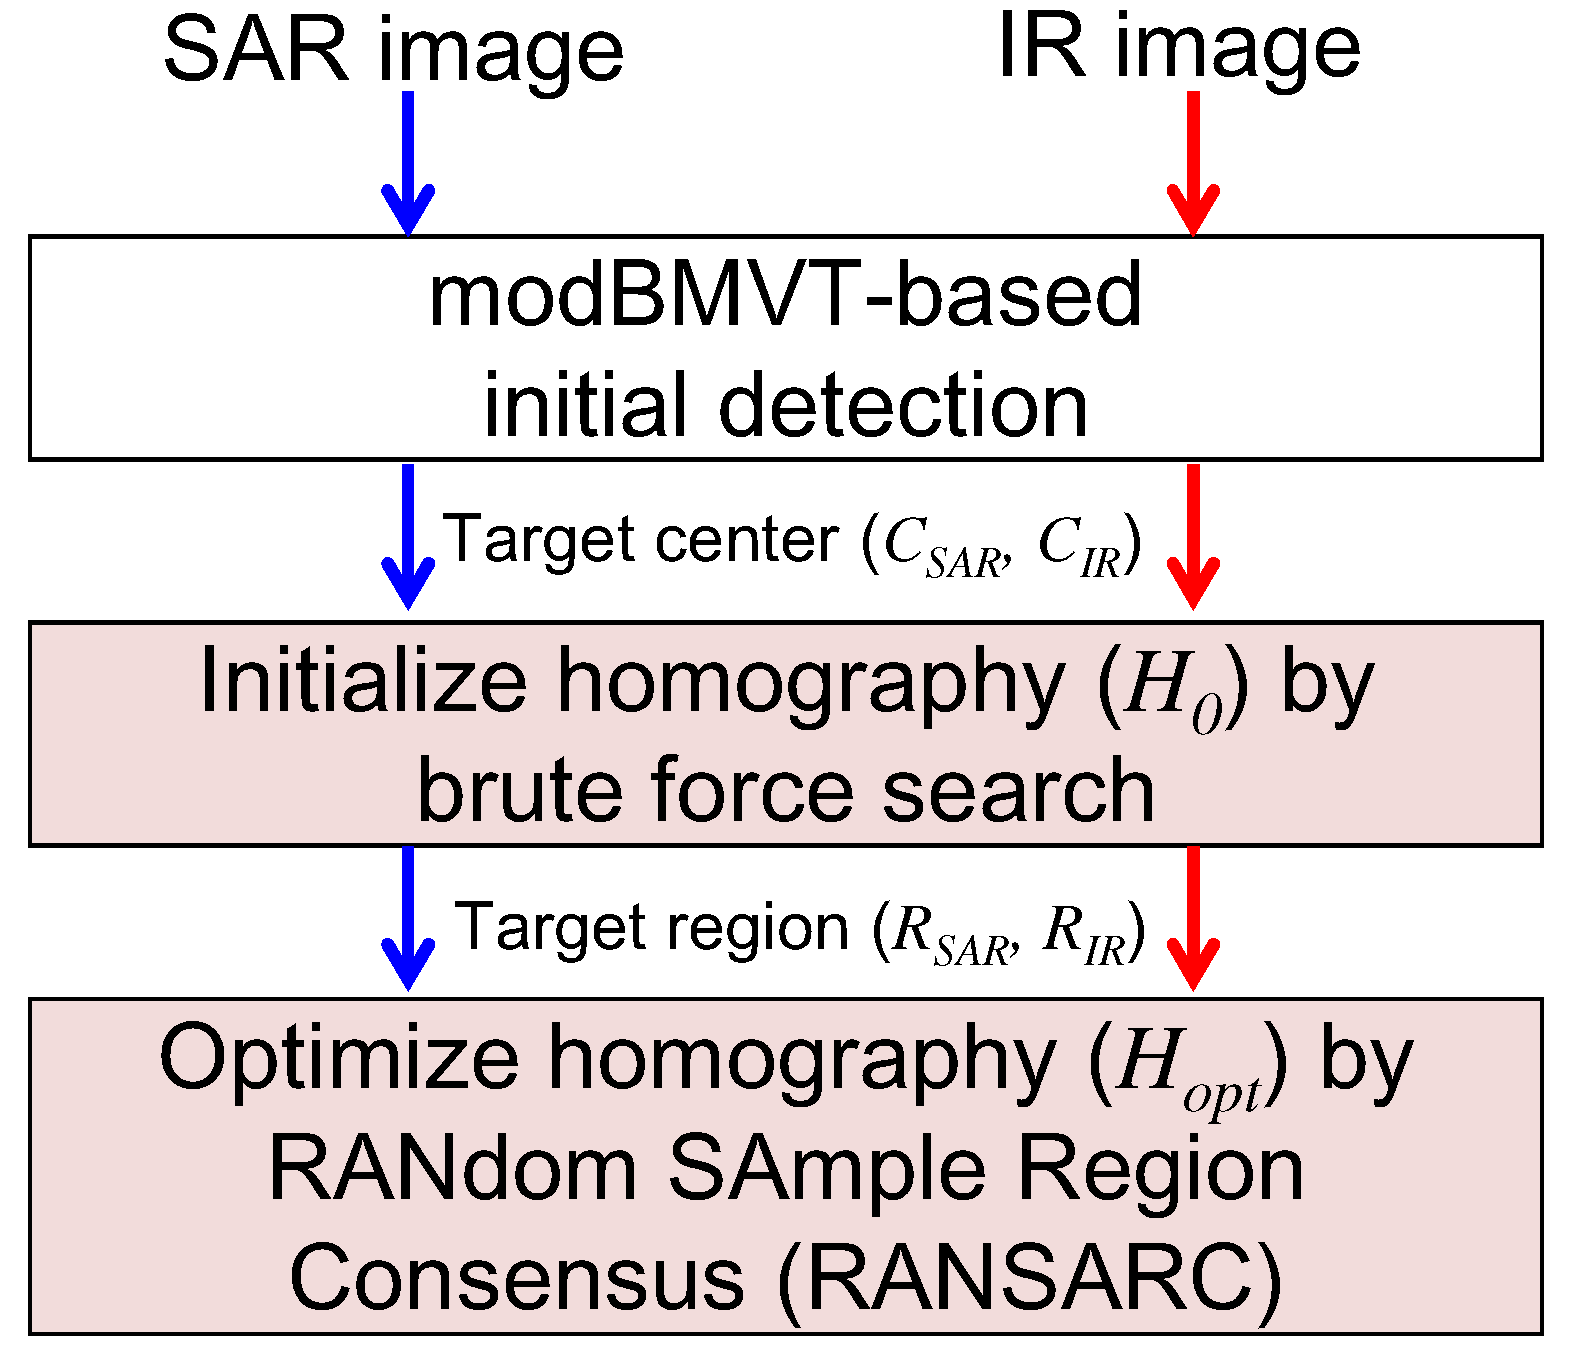
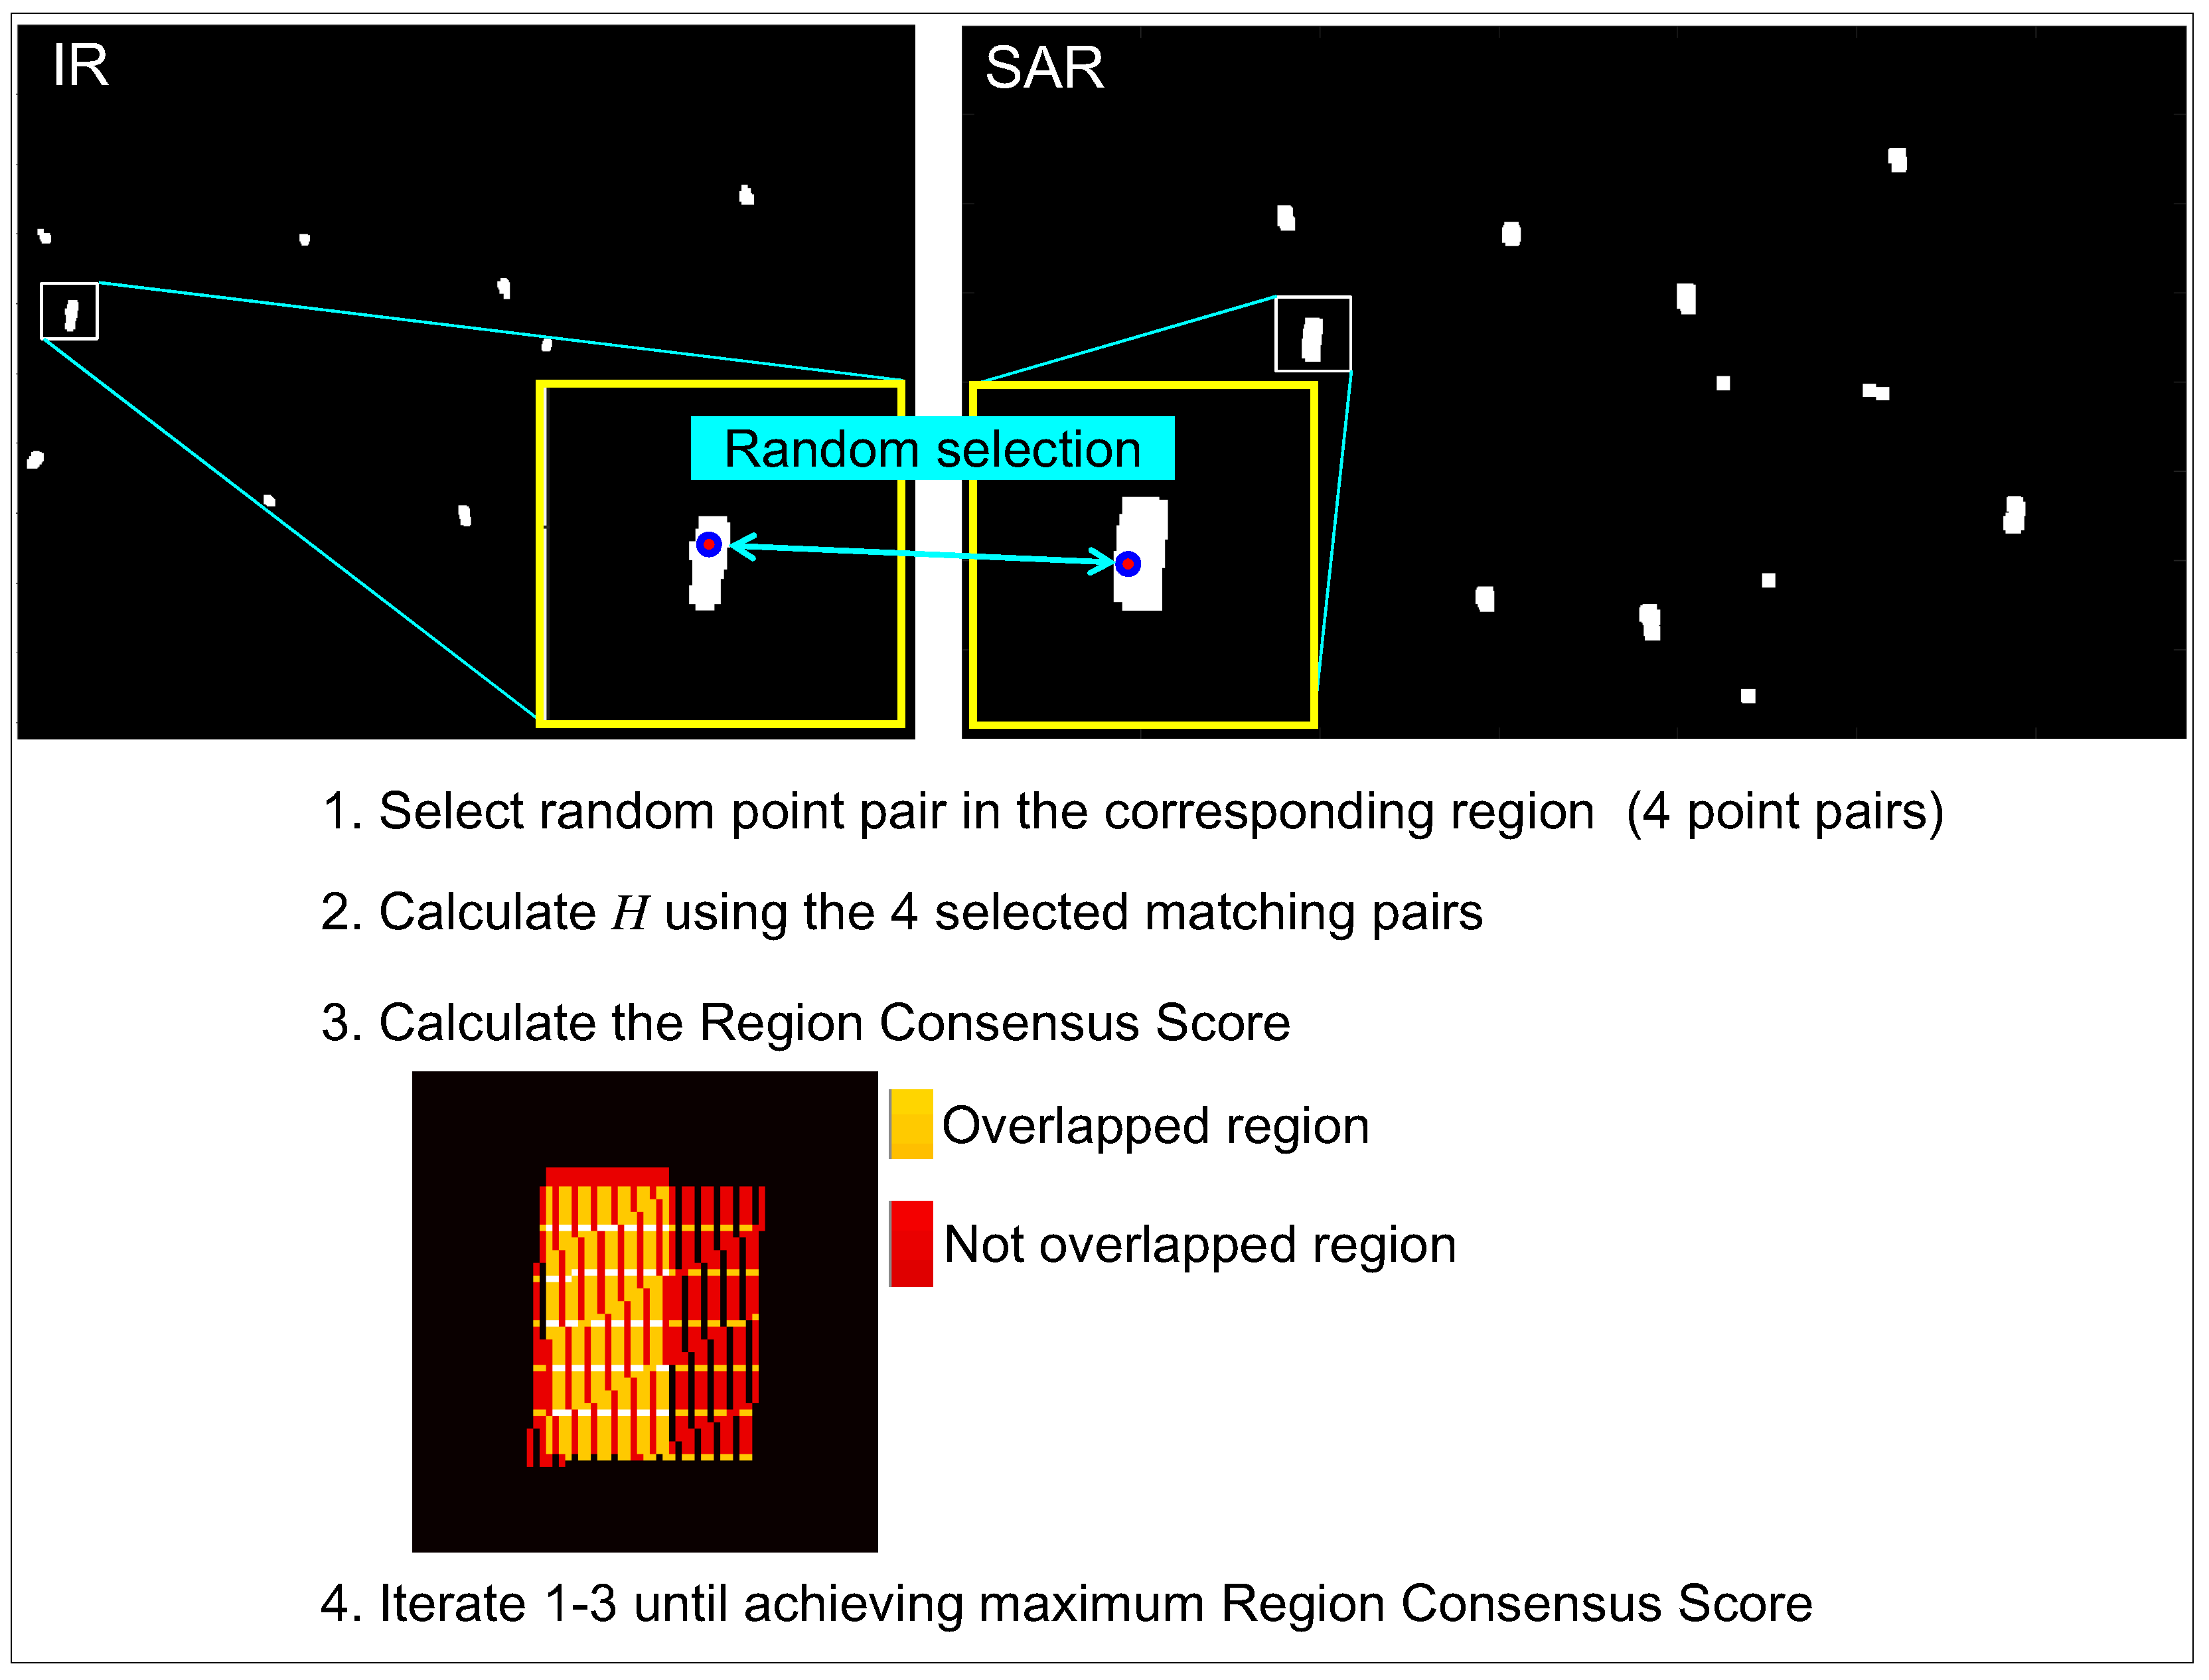
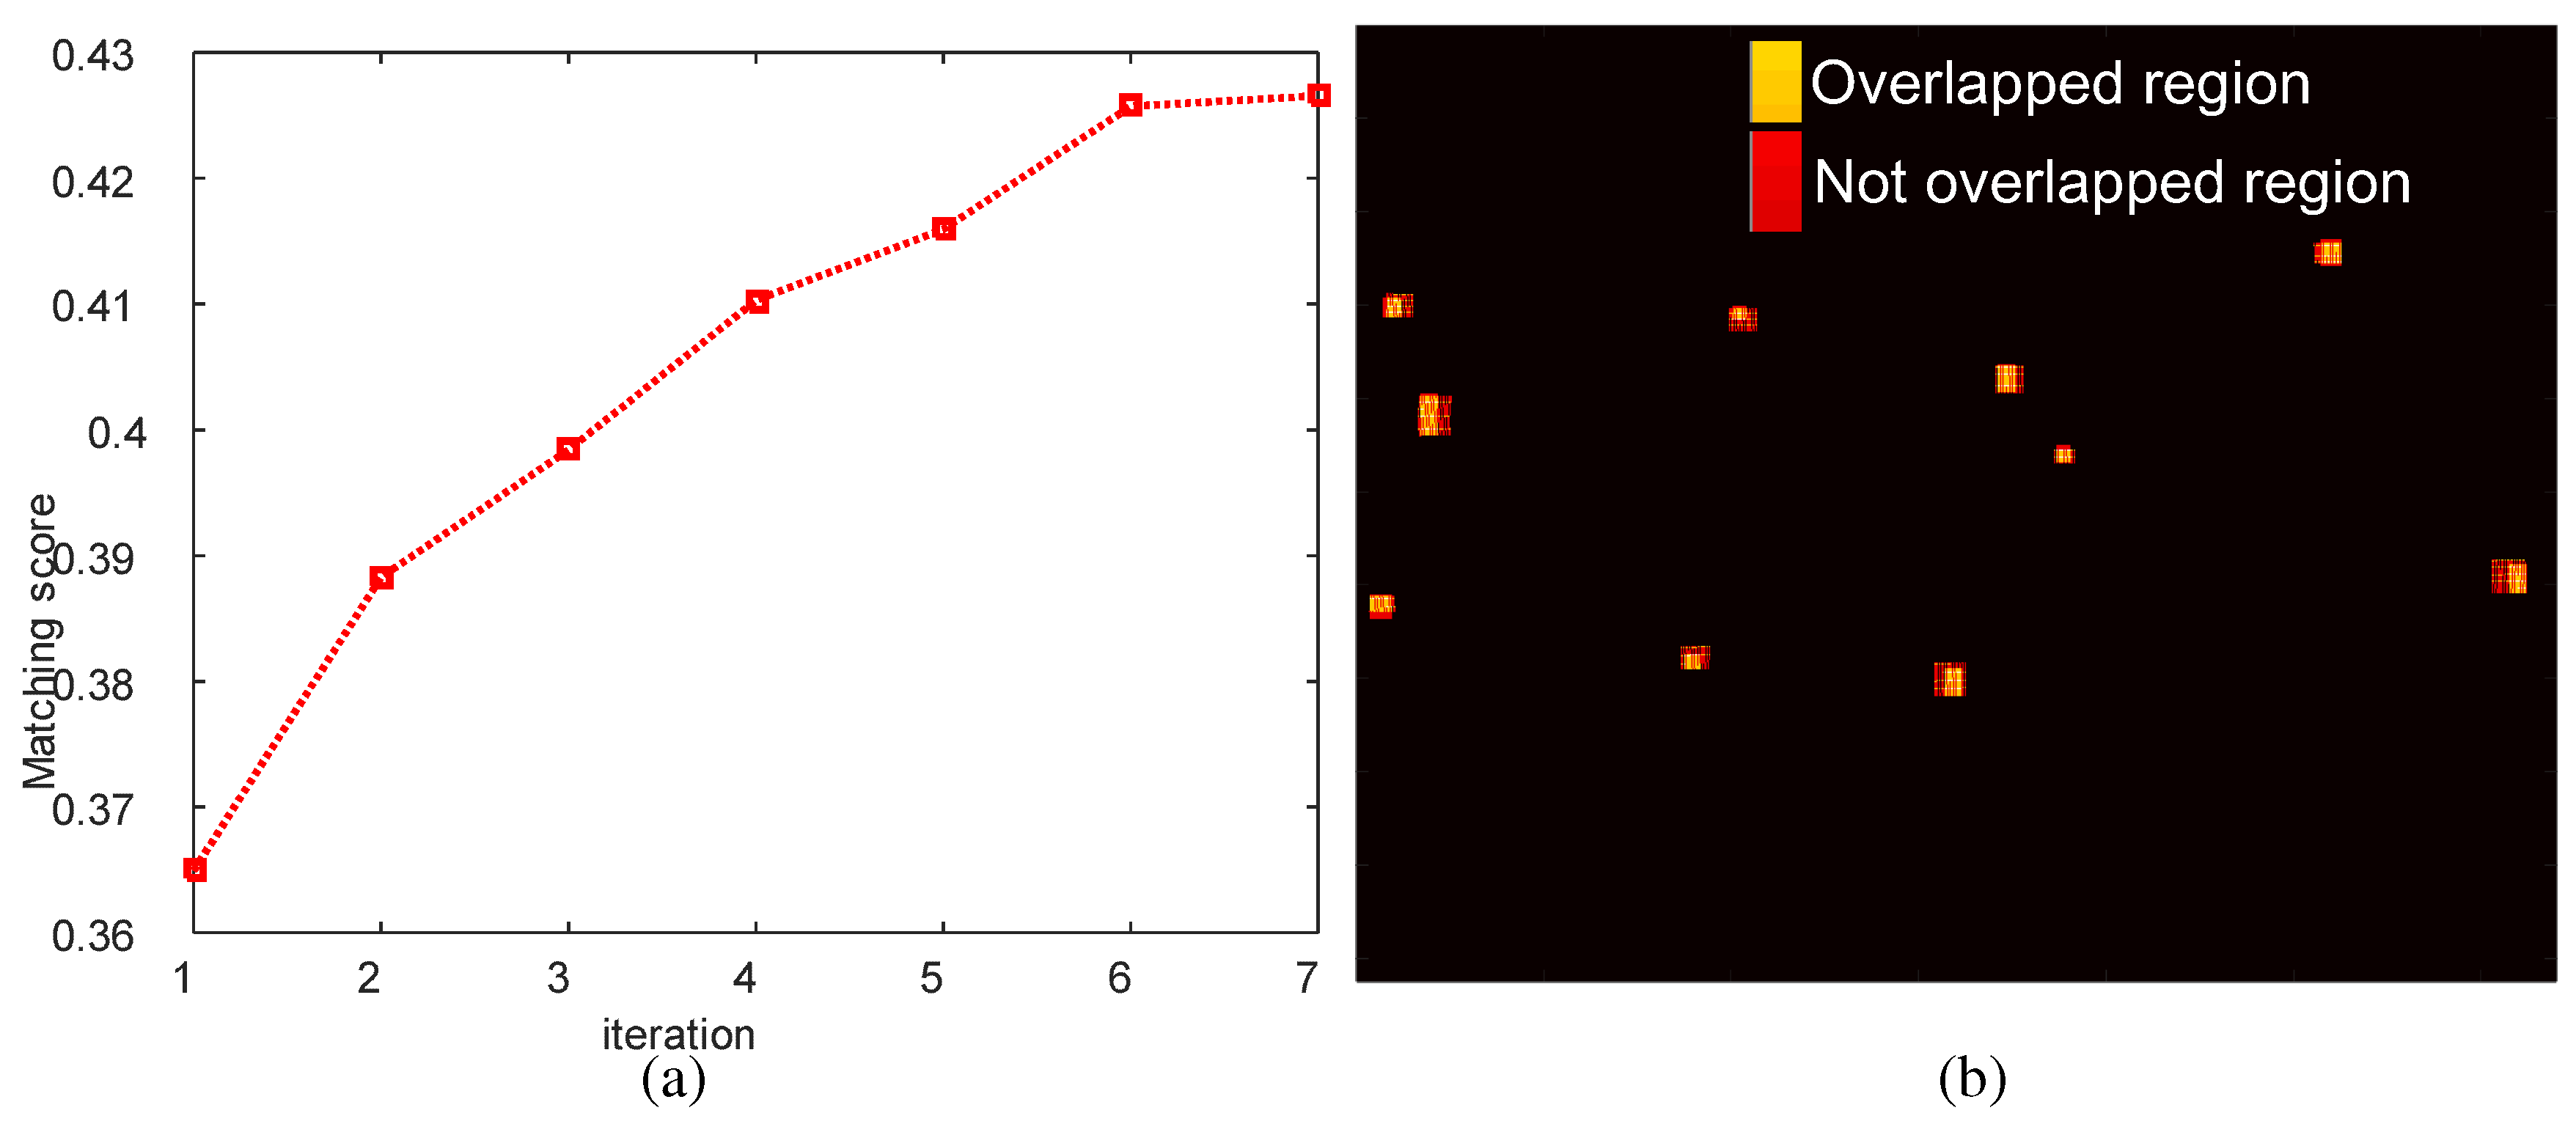
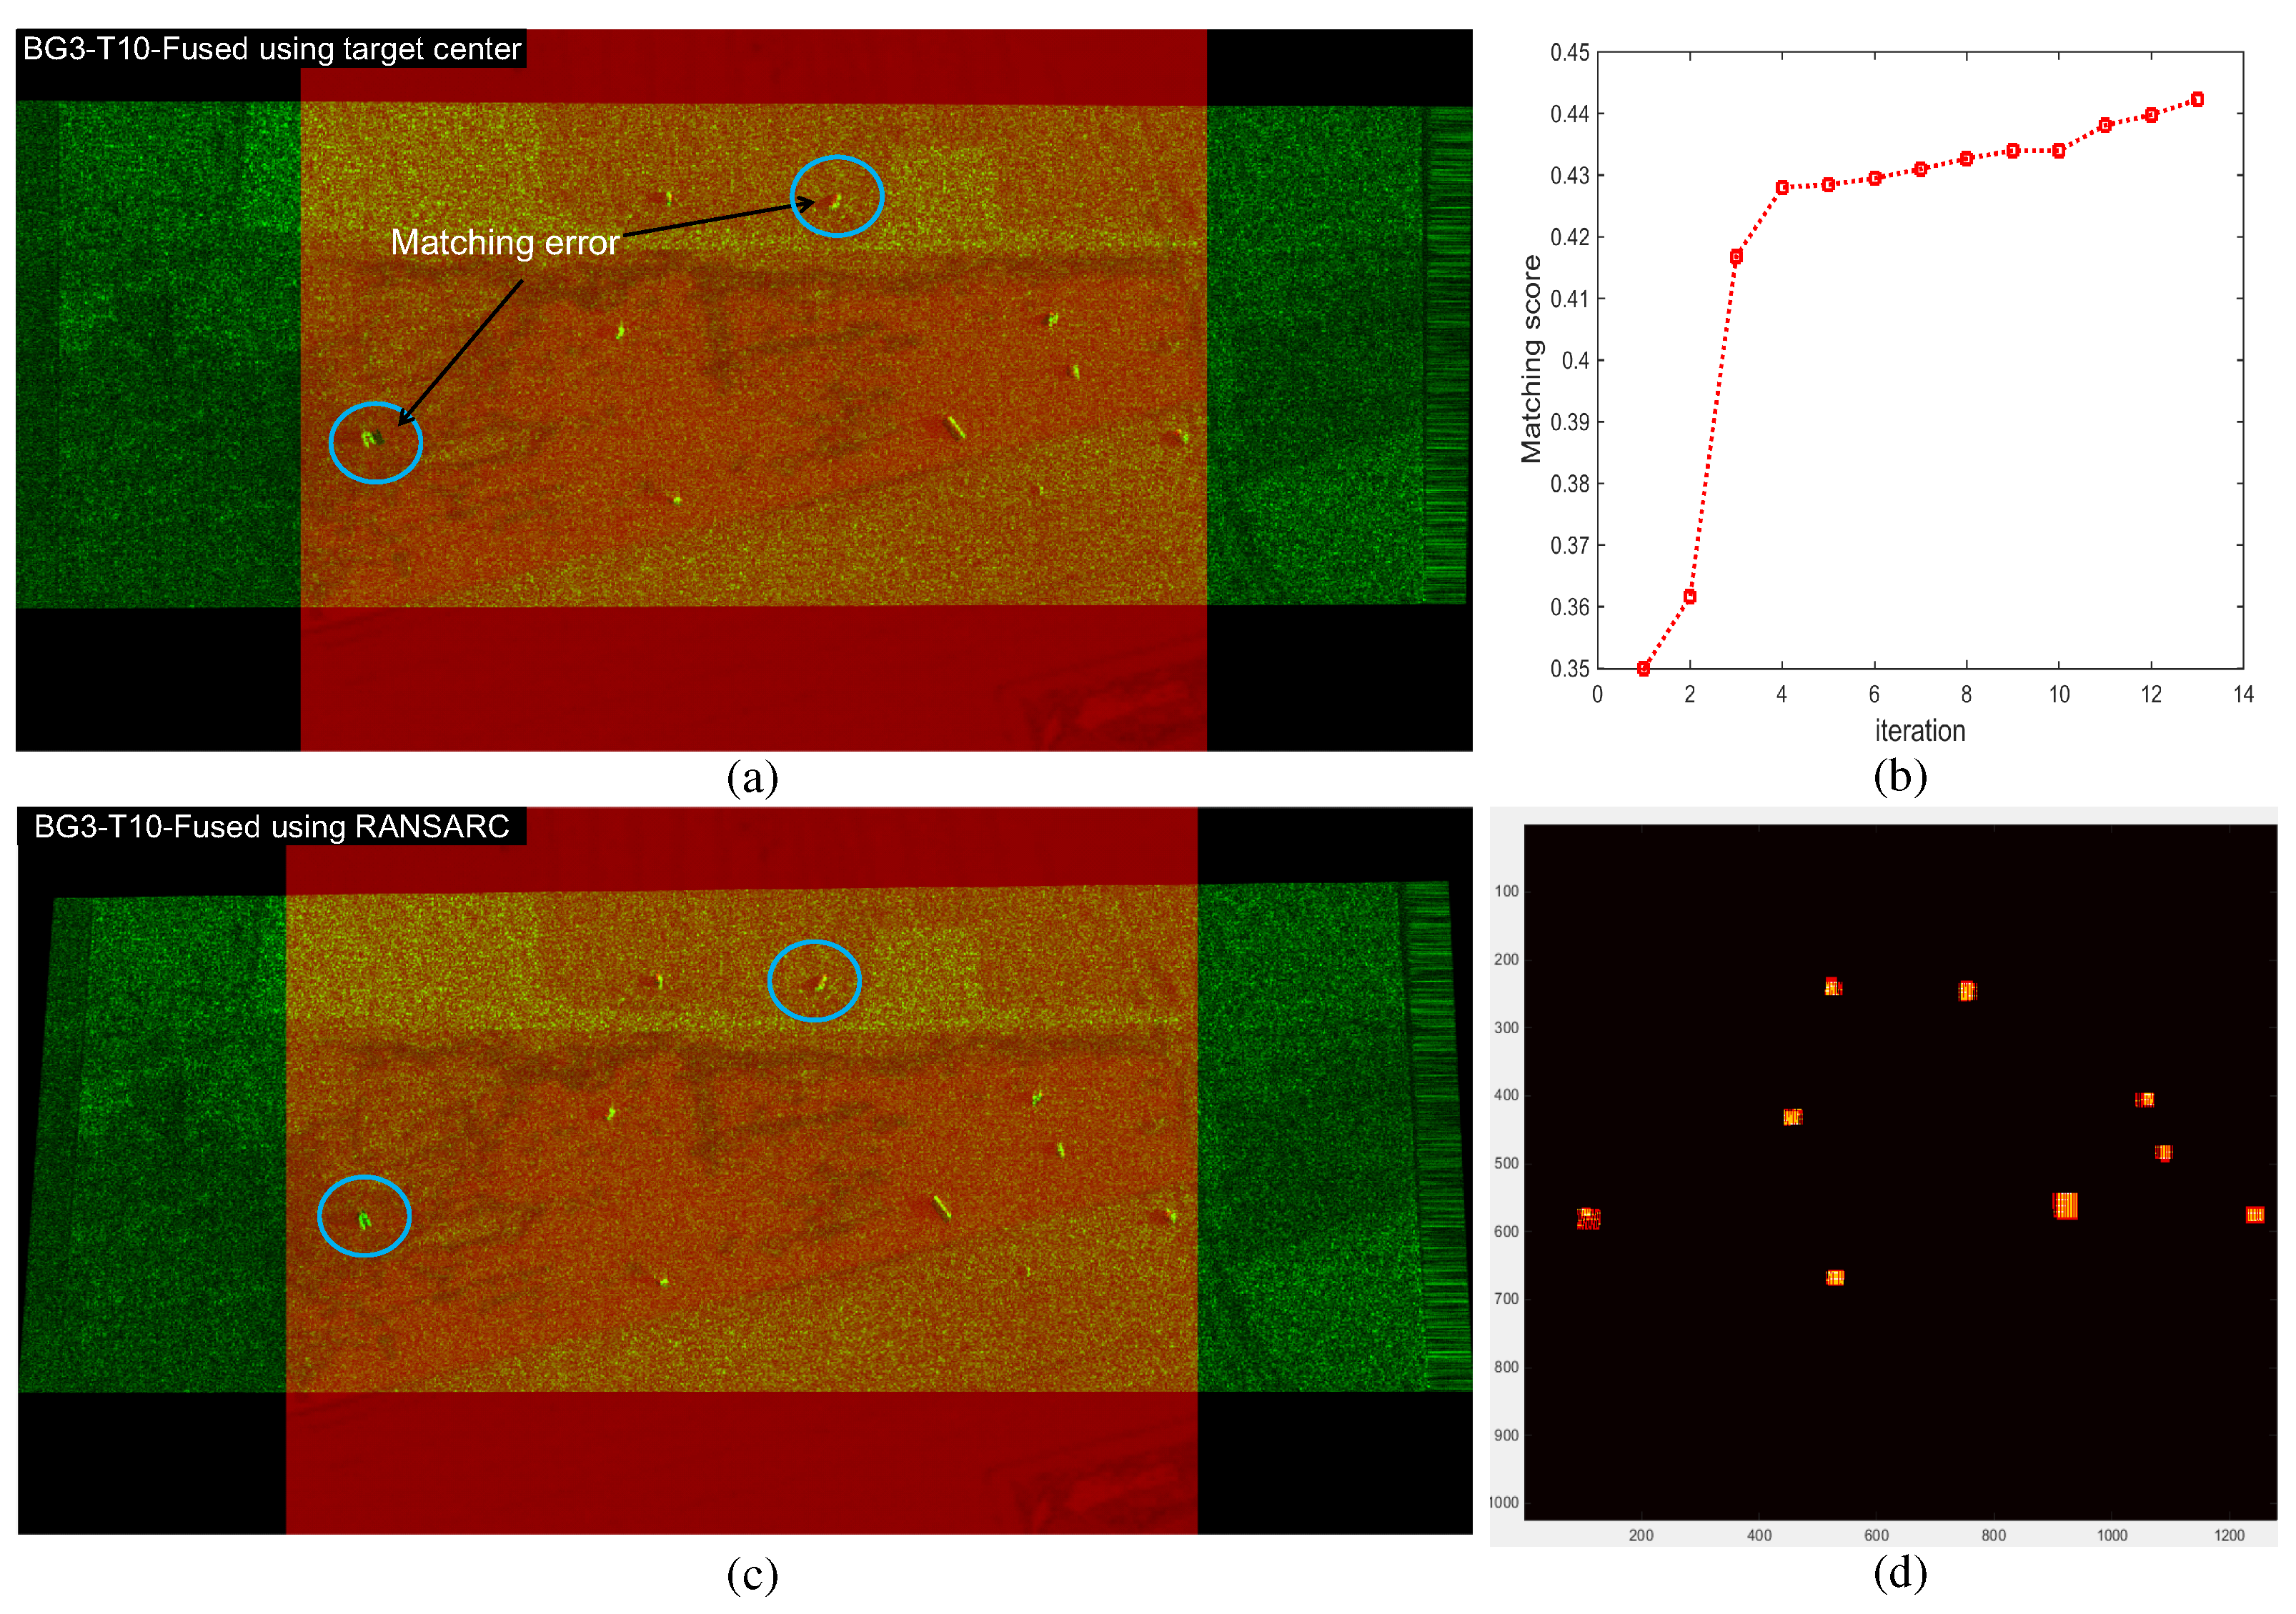
3.2. RANSARC-Based SAR/IR Registration
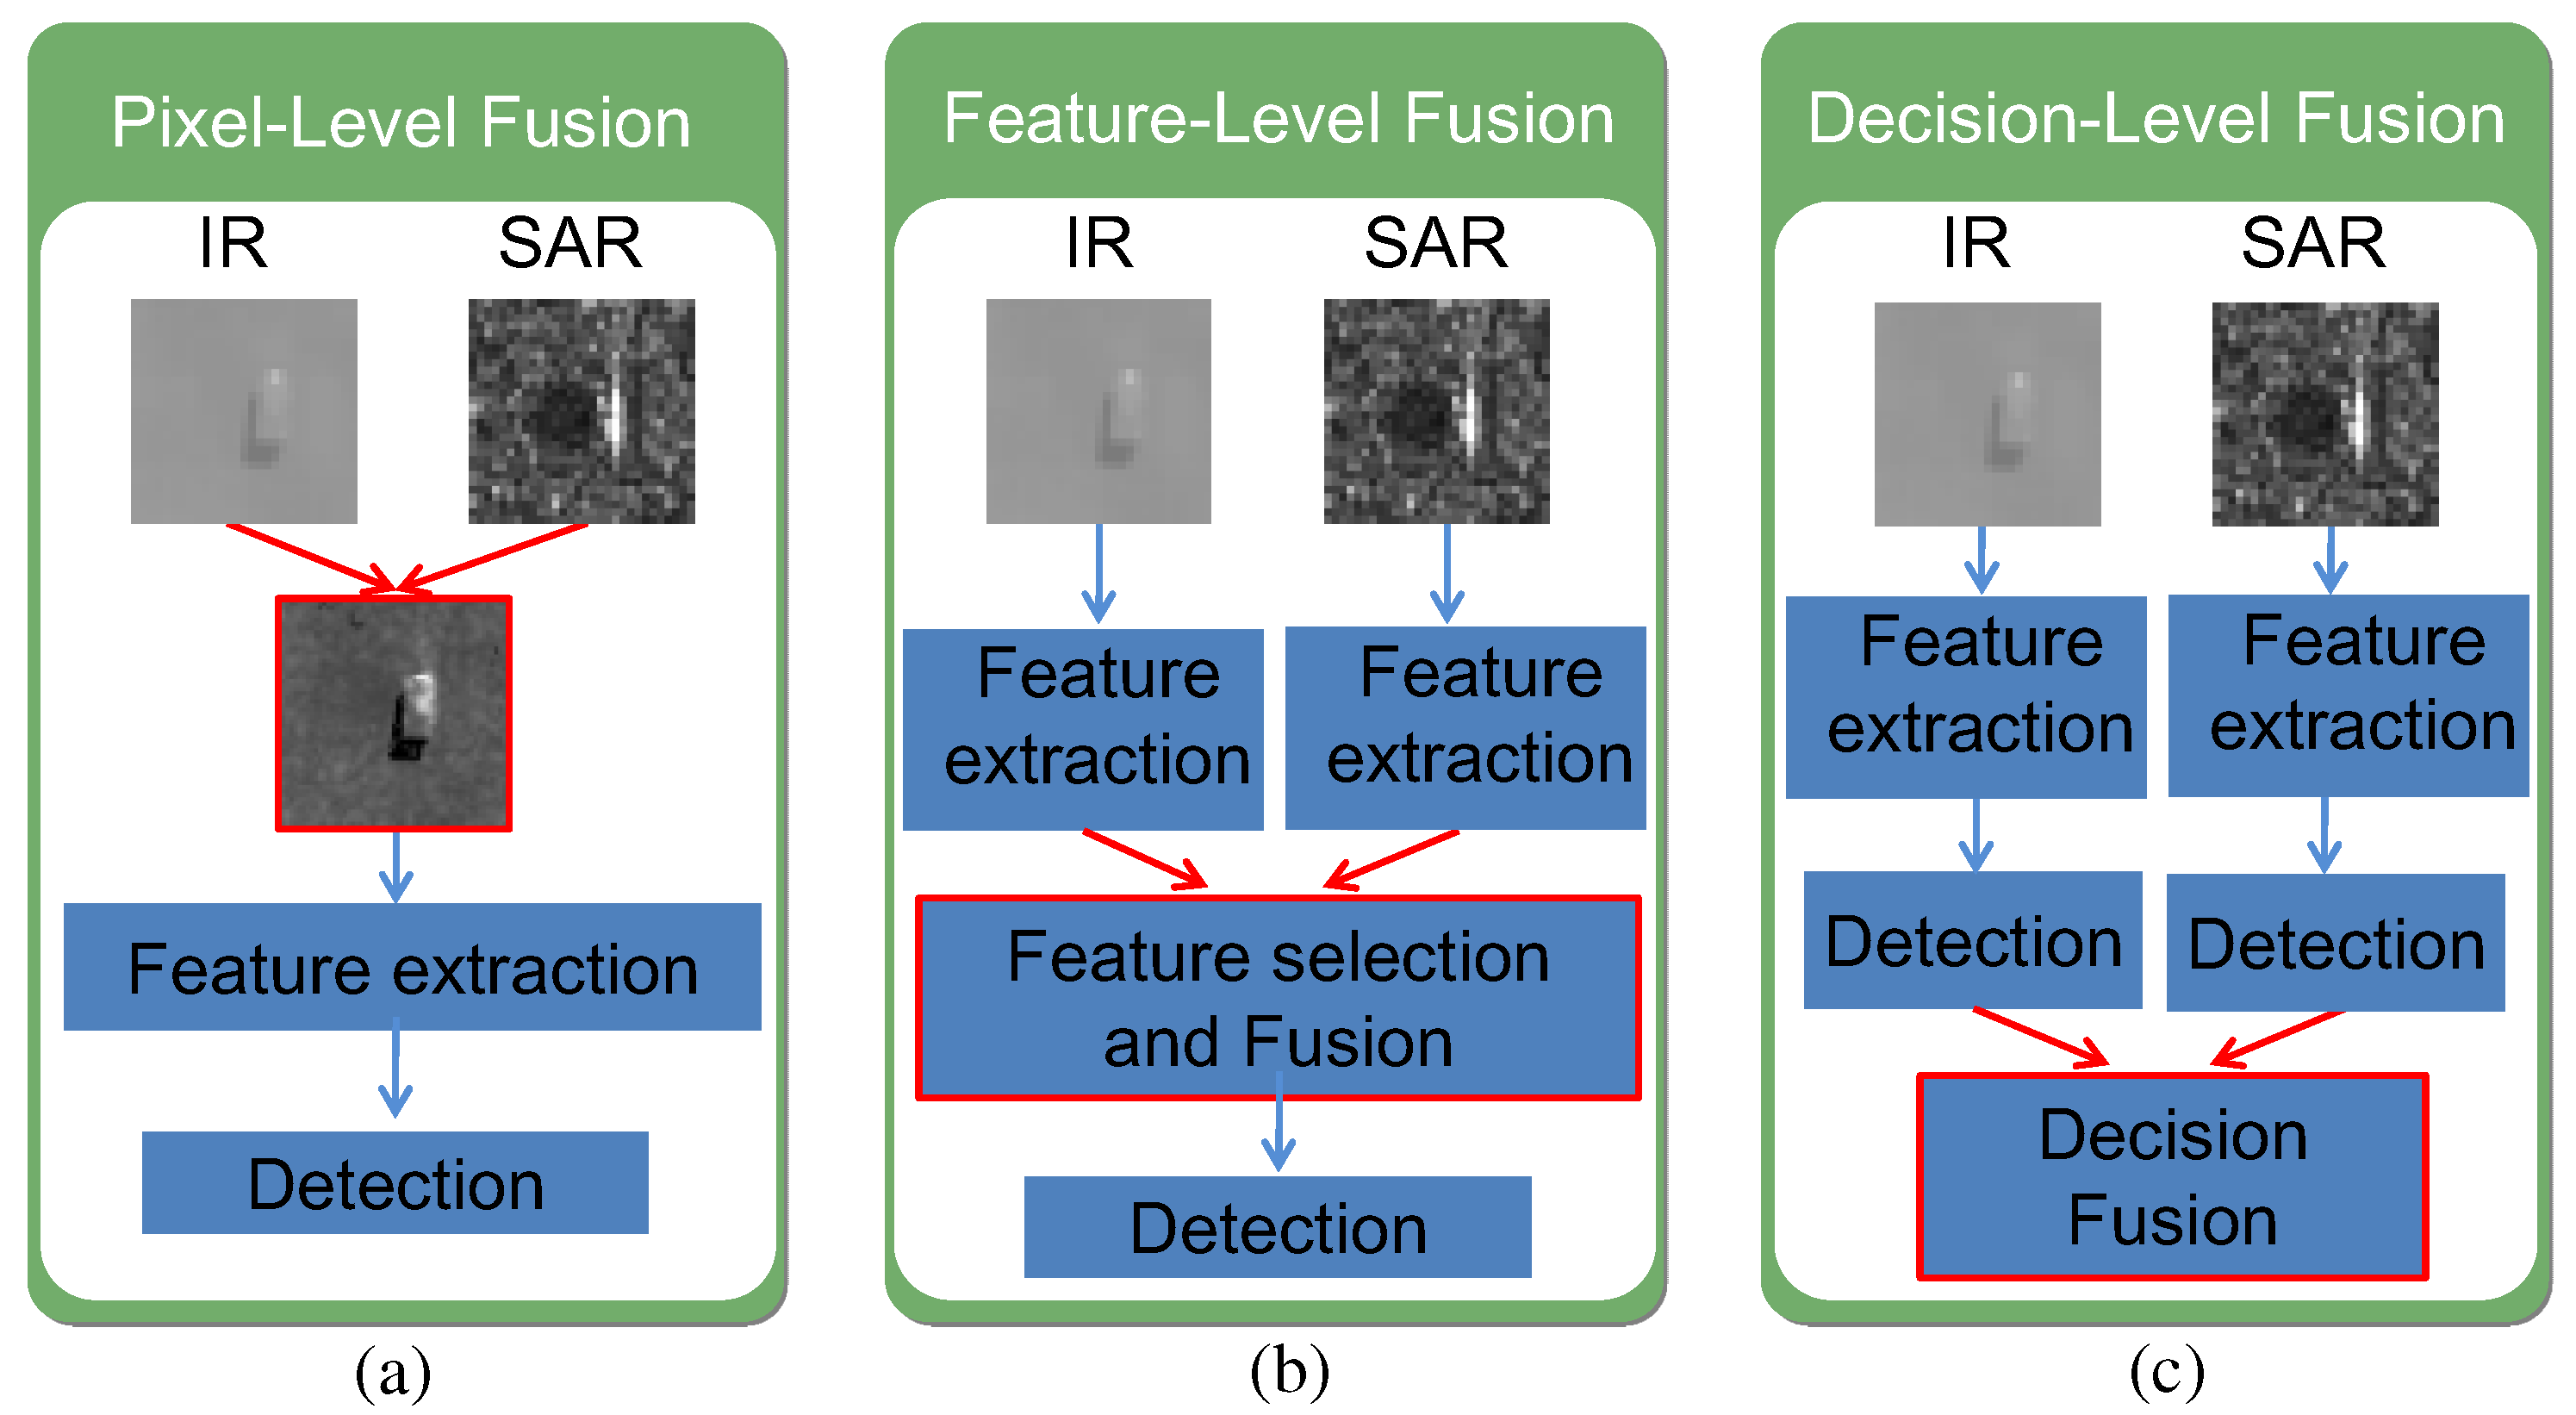
3.3. Target Detection by Adaboost-Based SAR/IR Fusion
4. Experimental Results
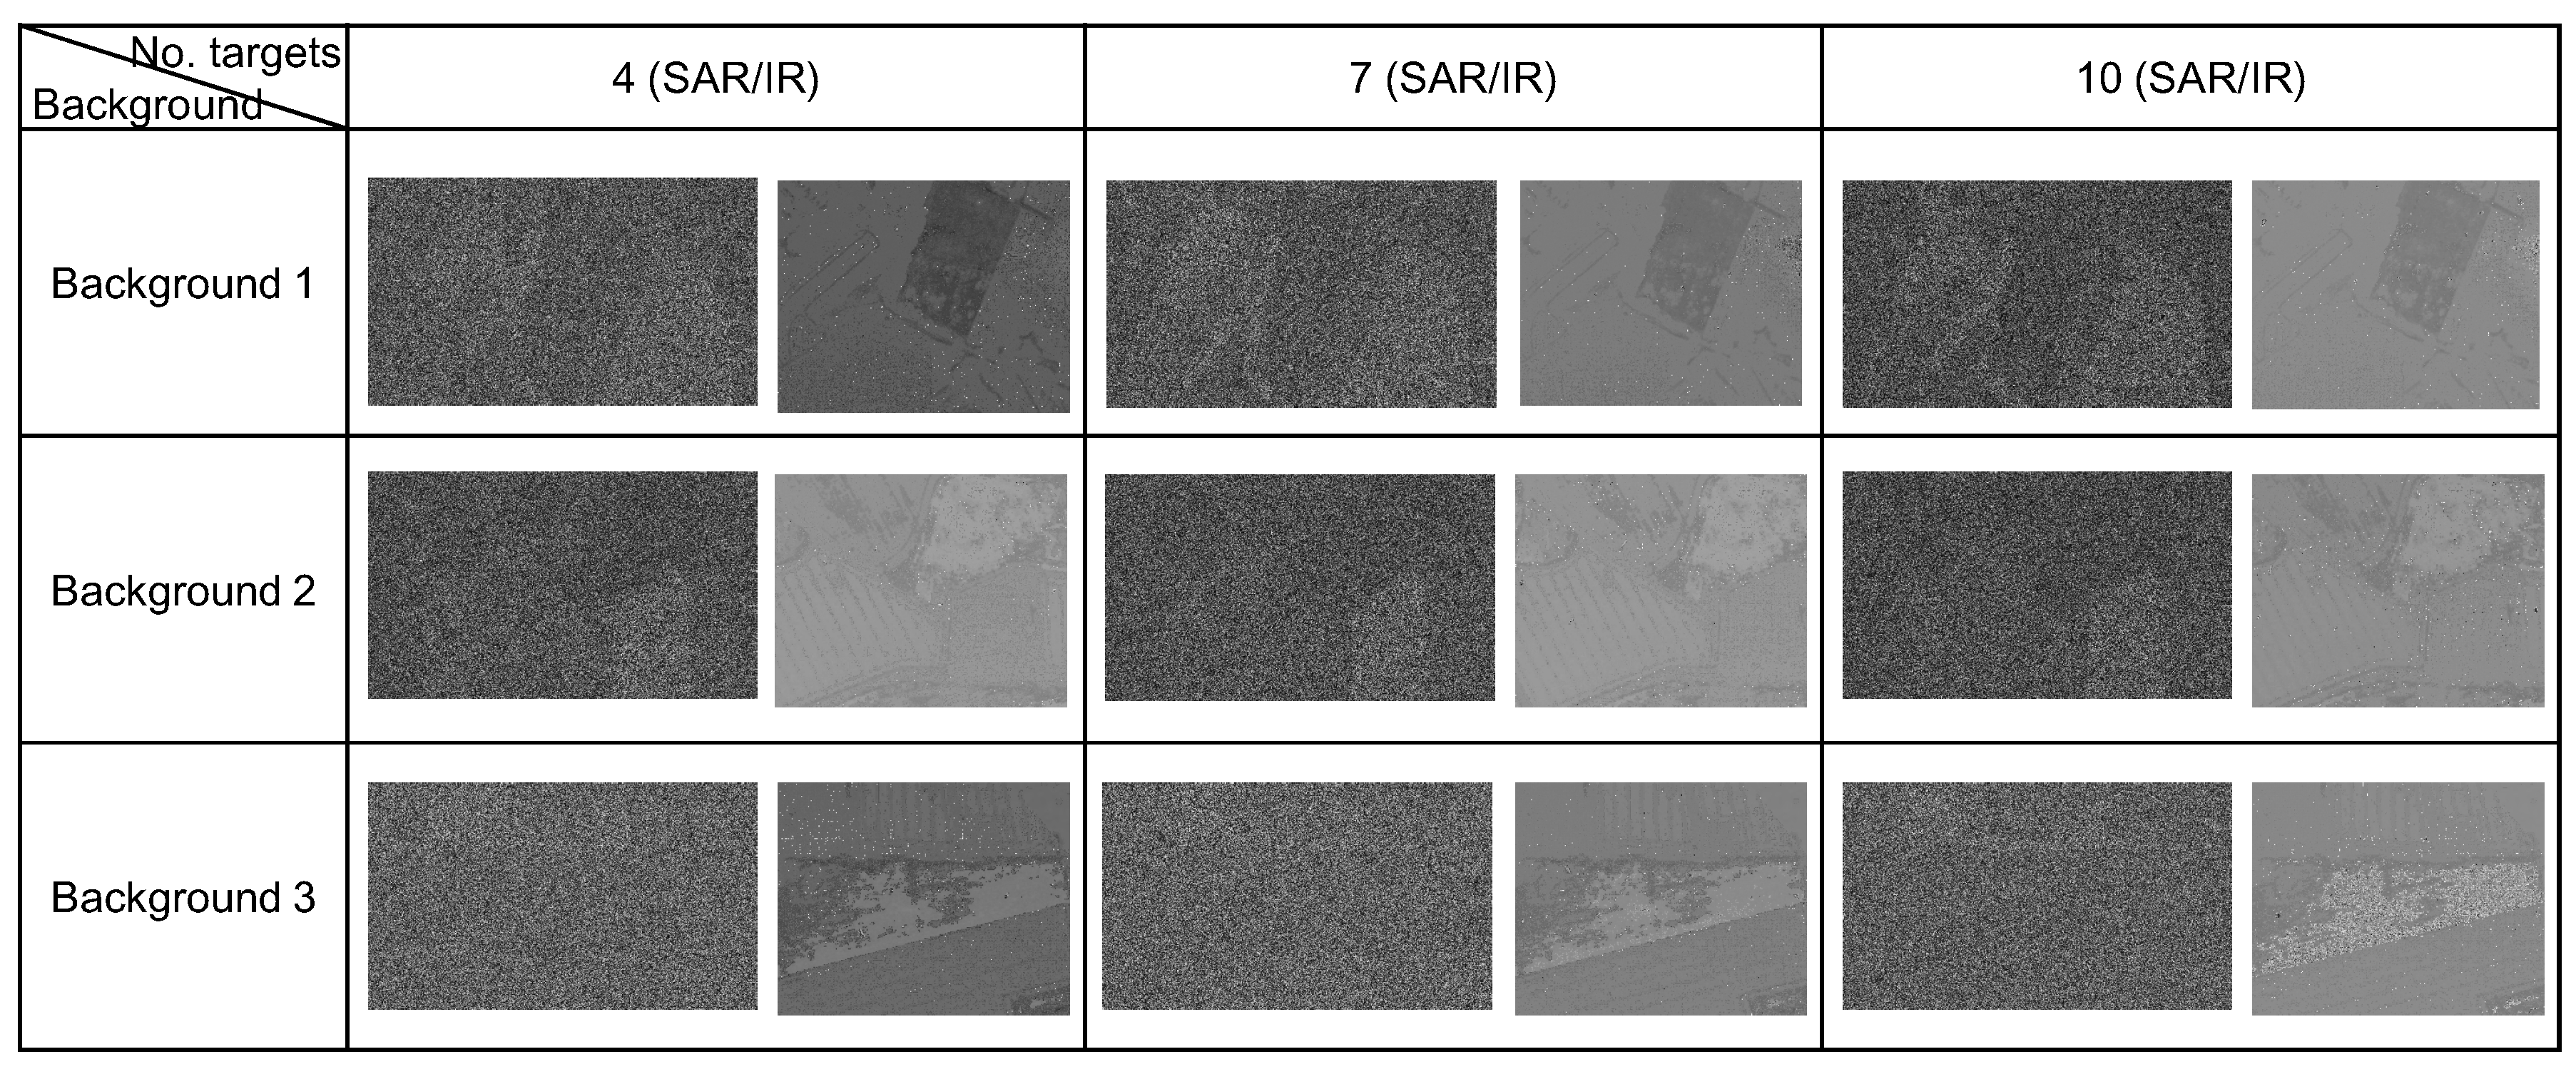
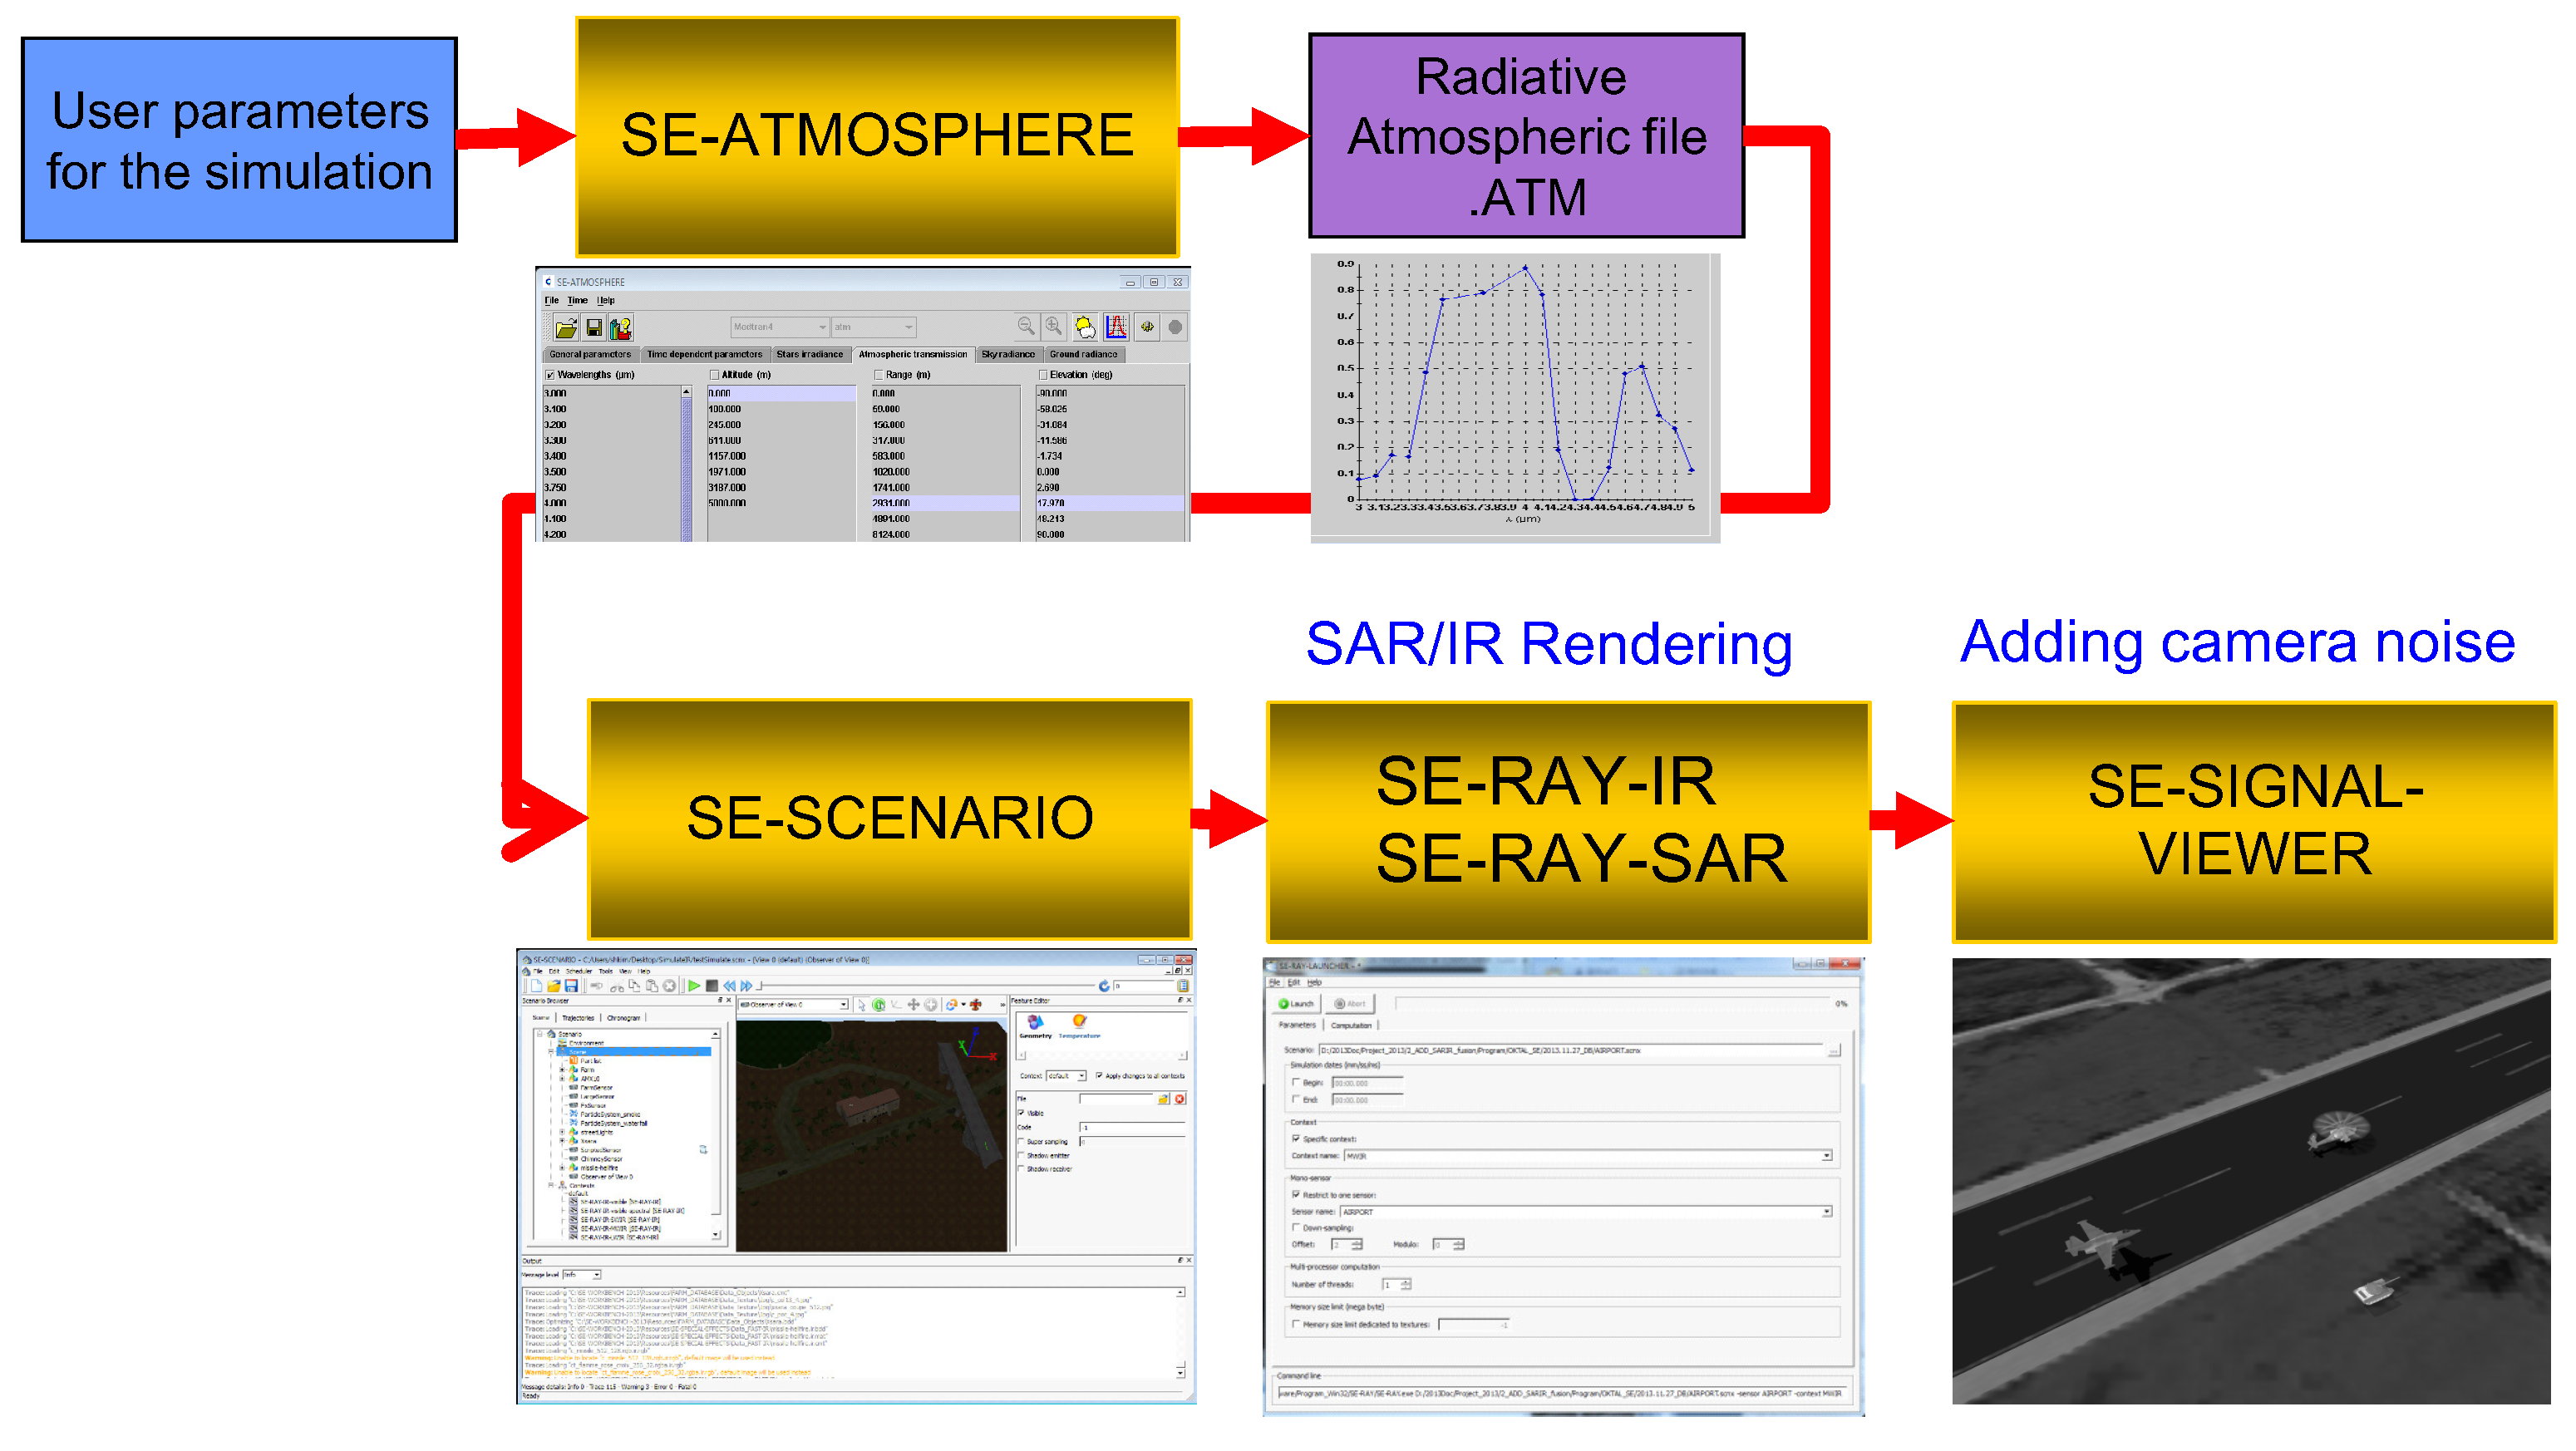
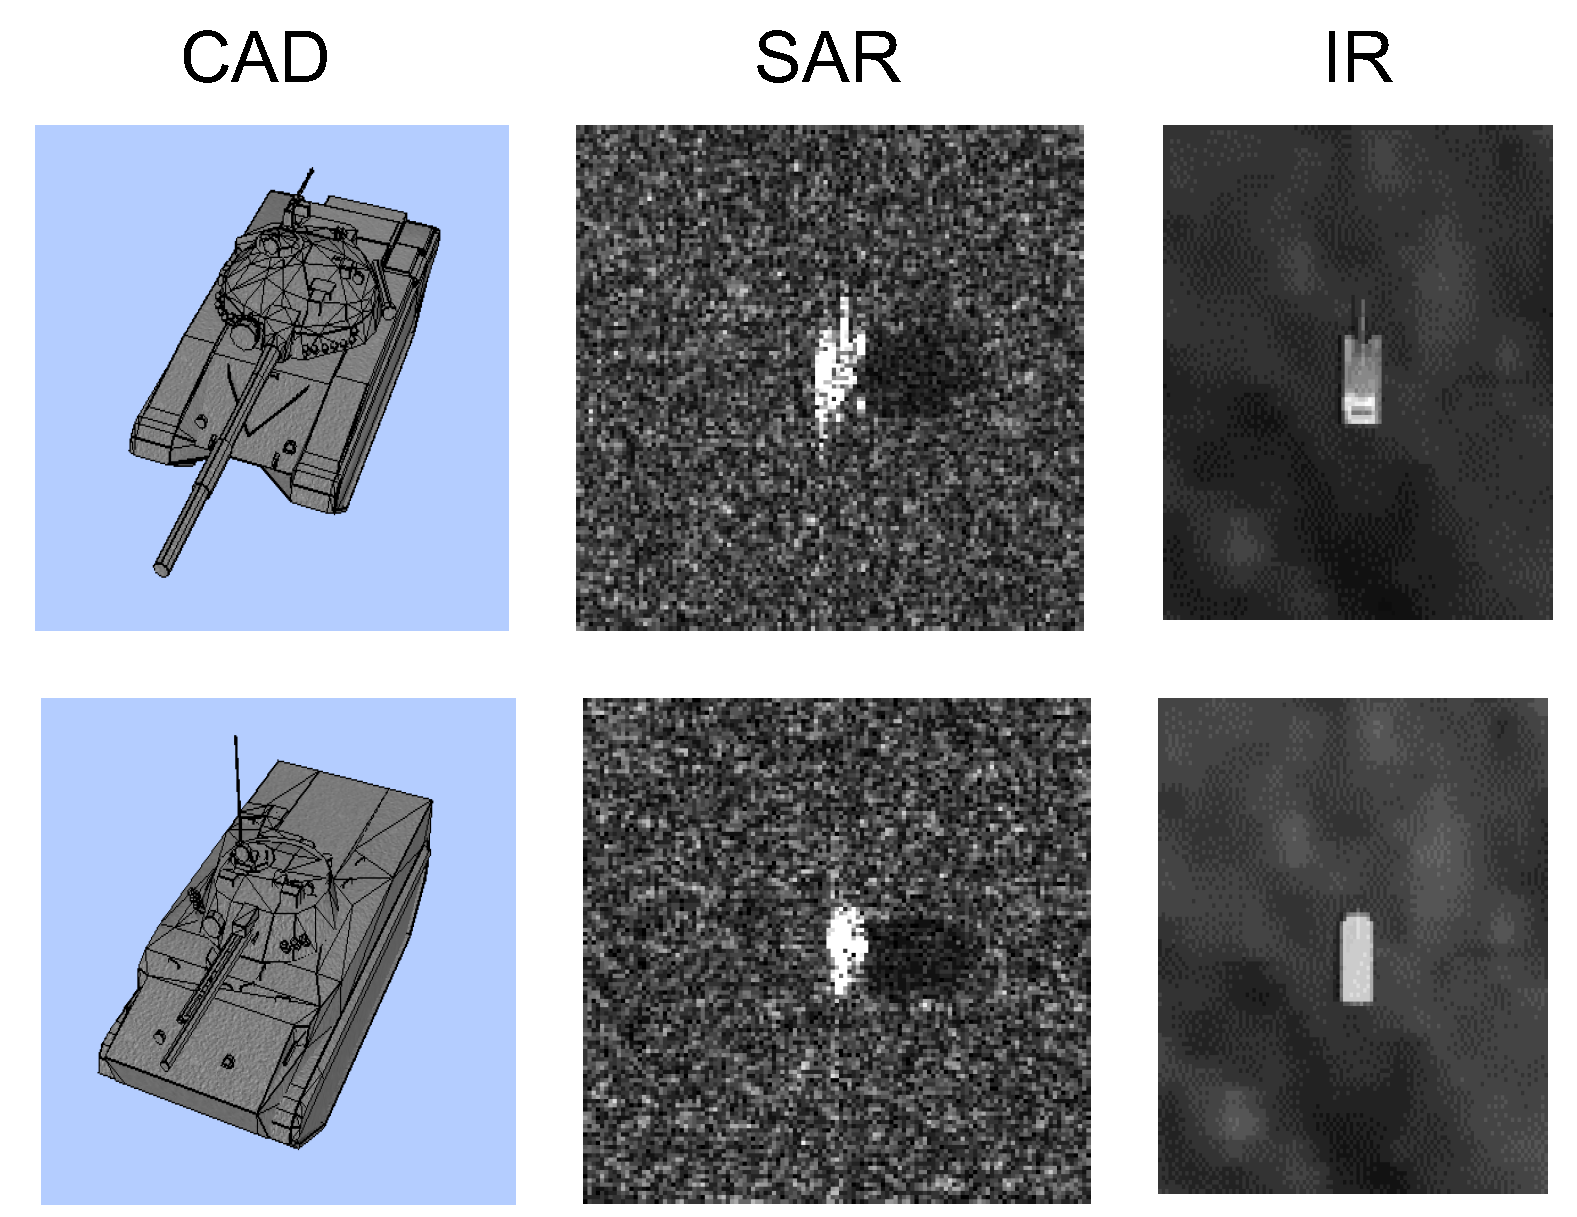
4.1. SAR/IR Database
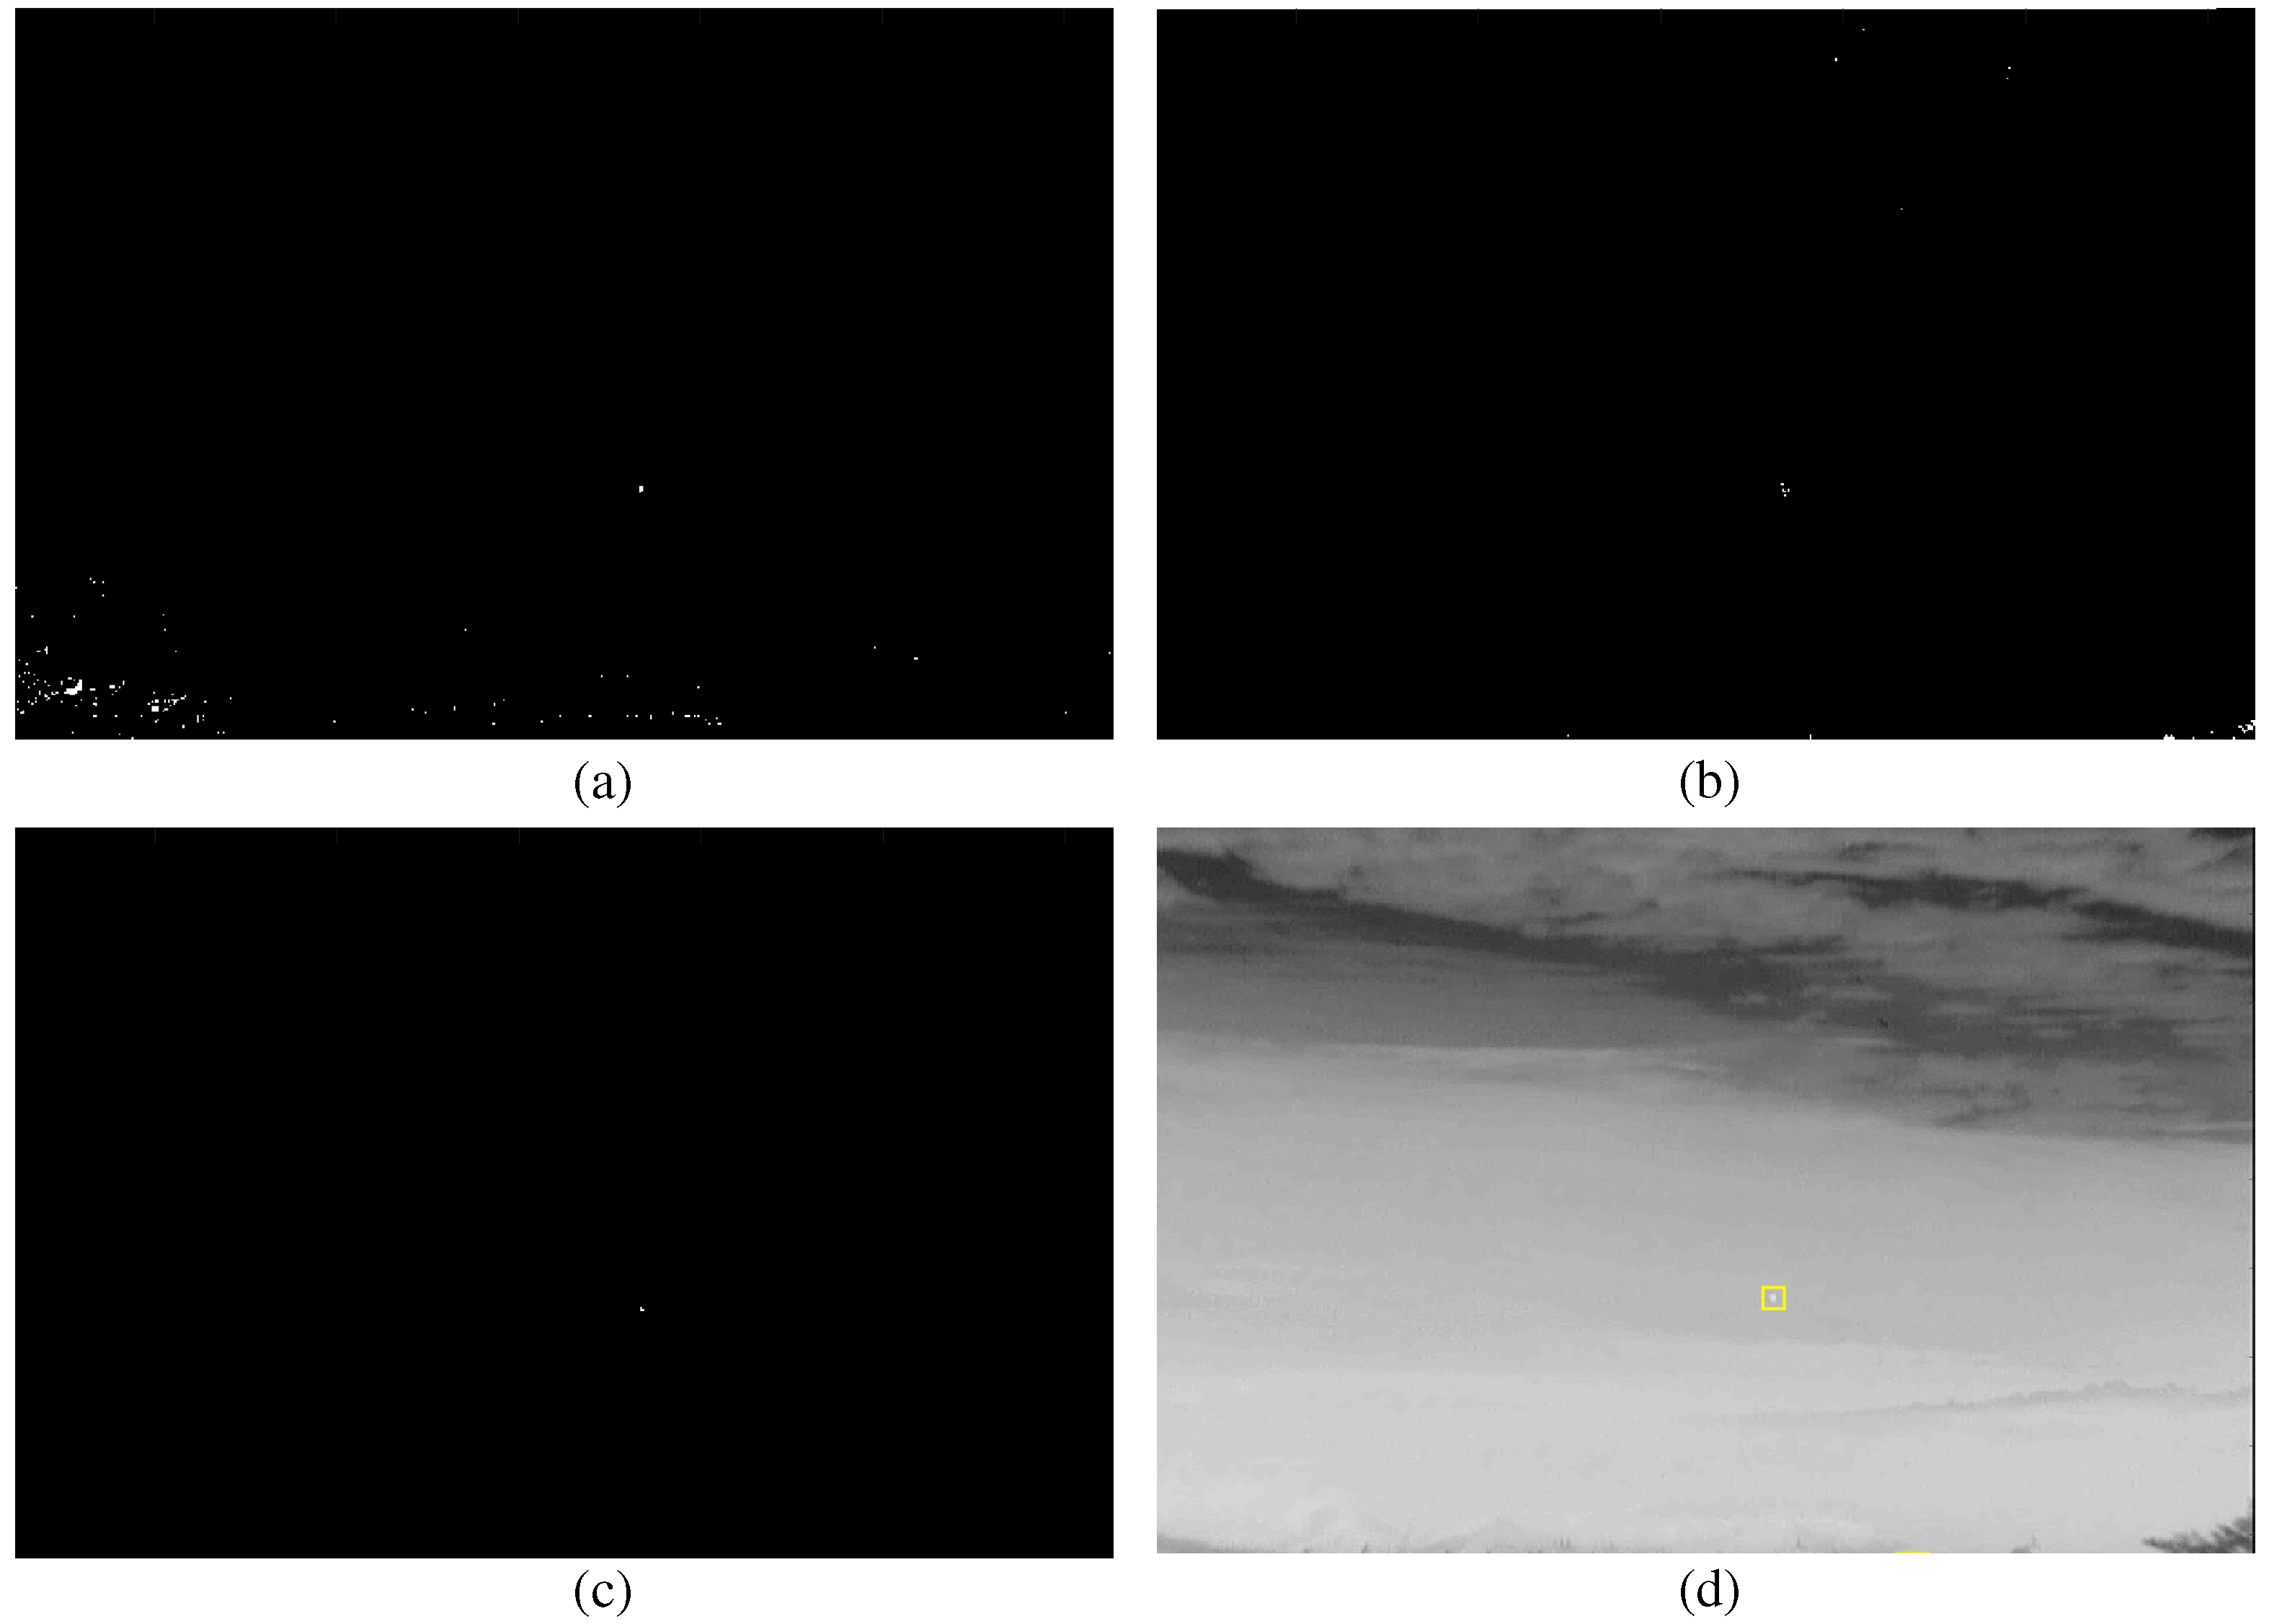
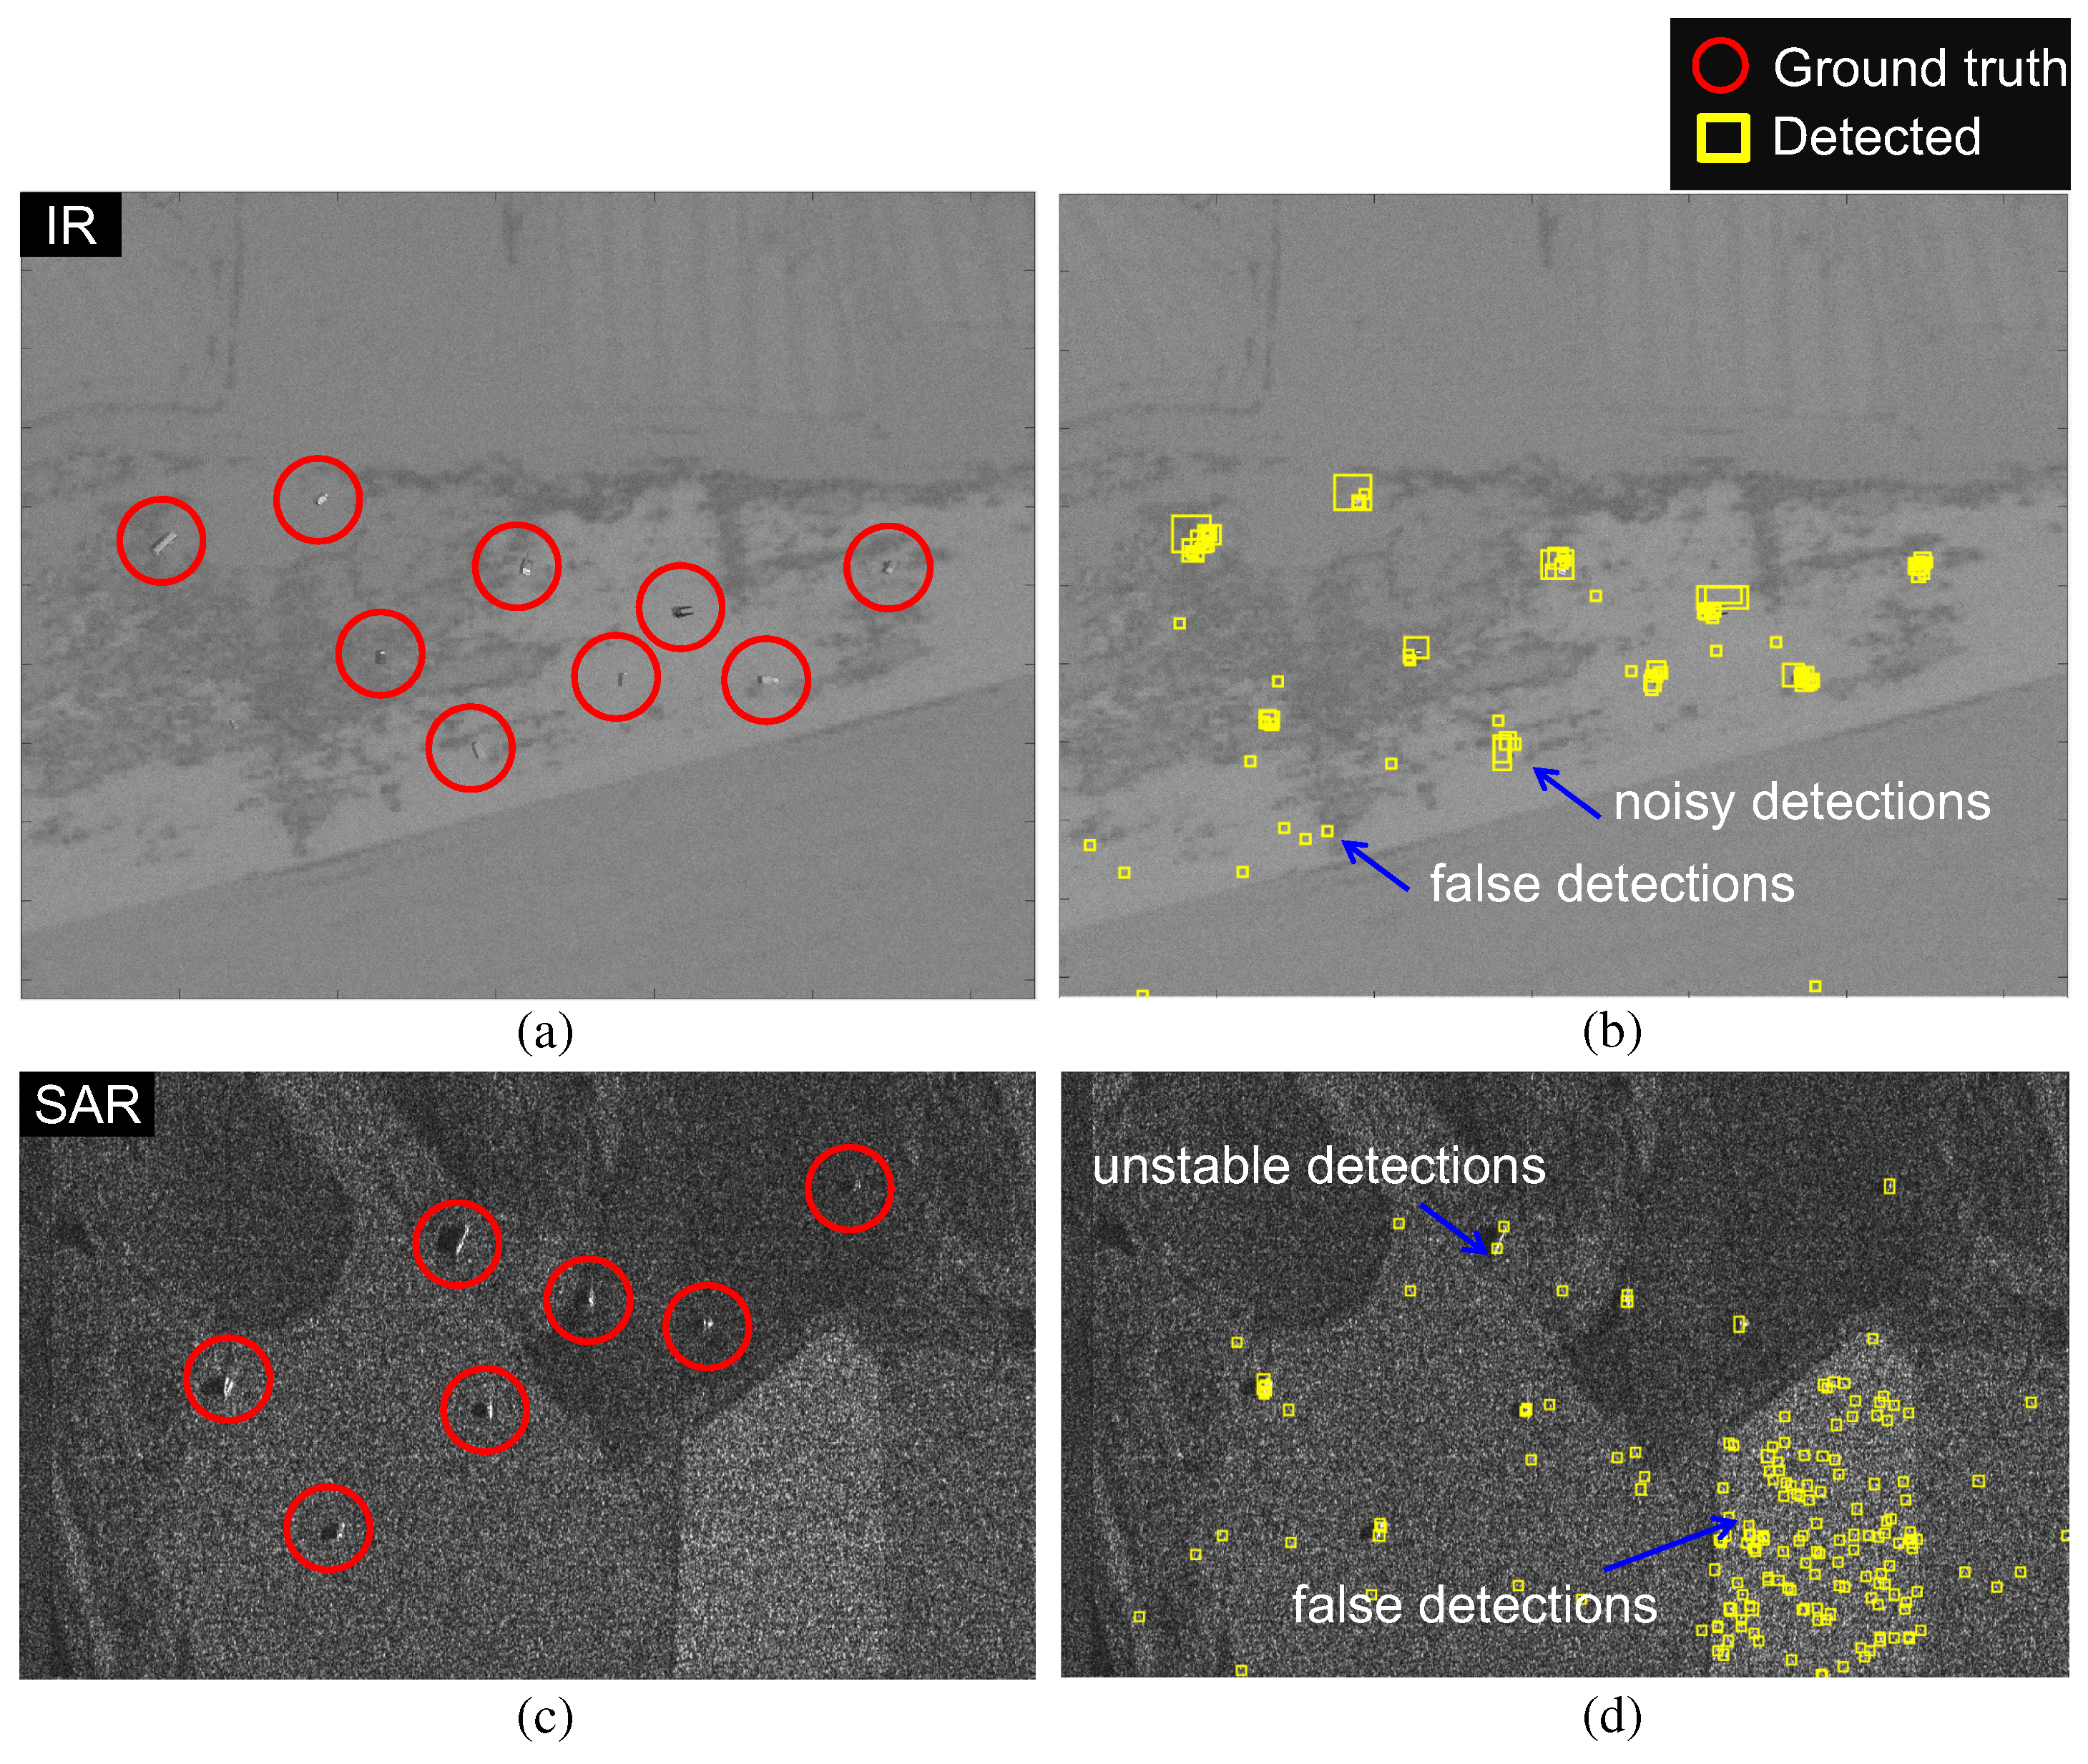
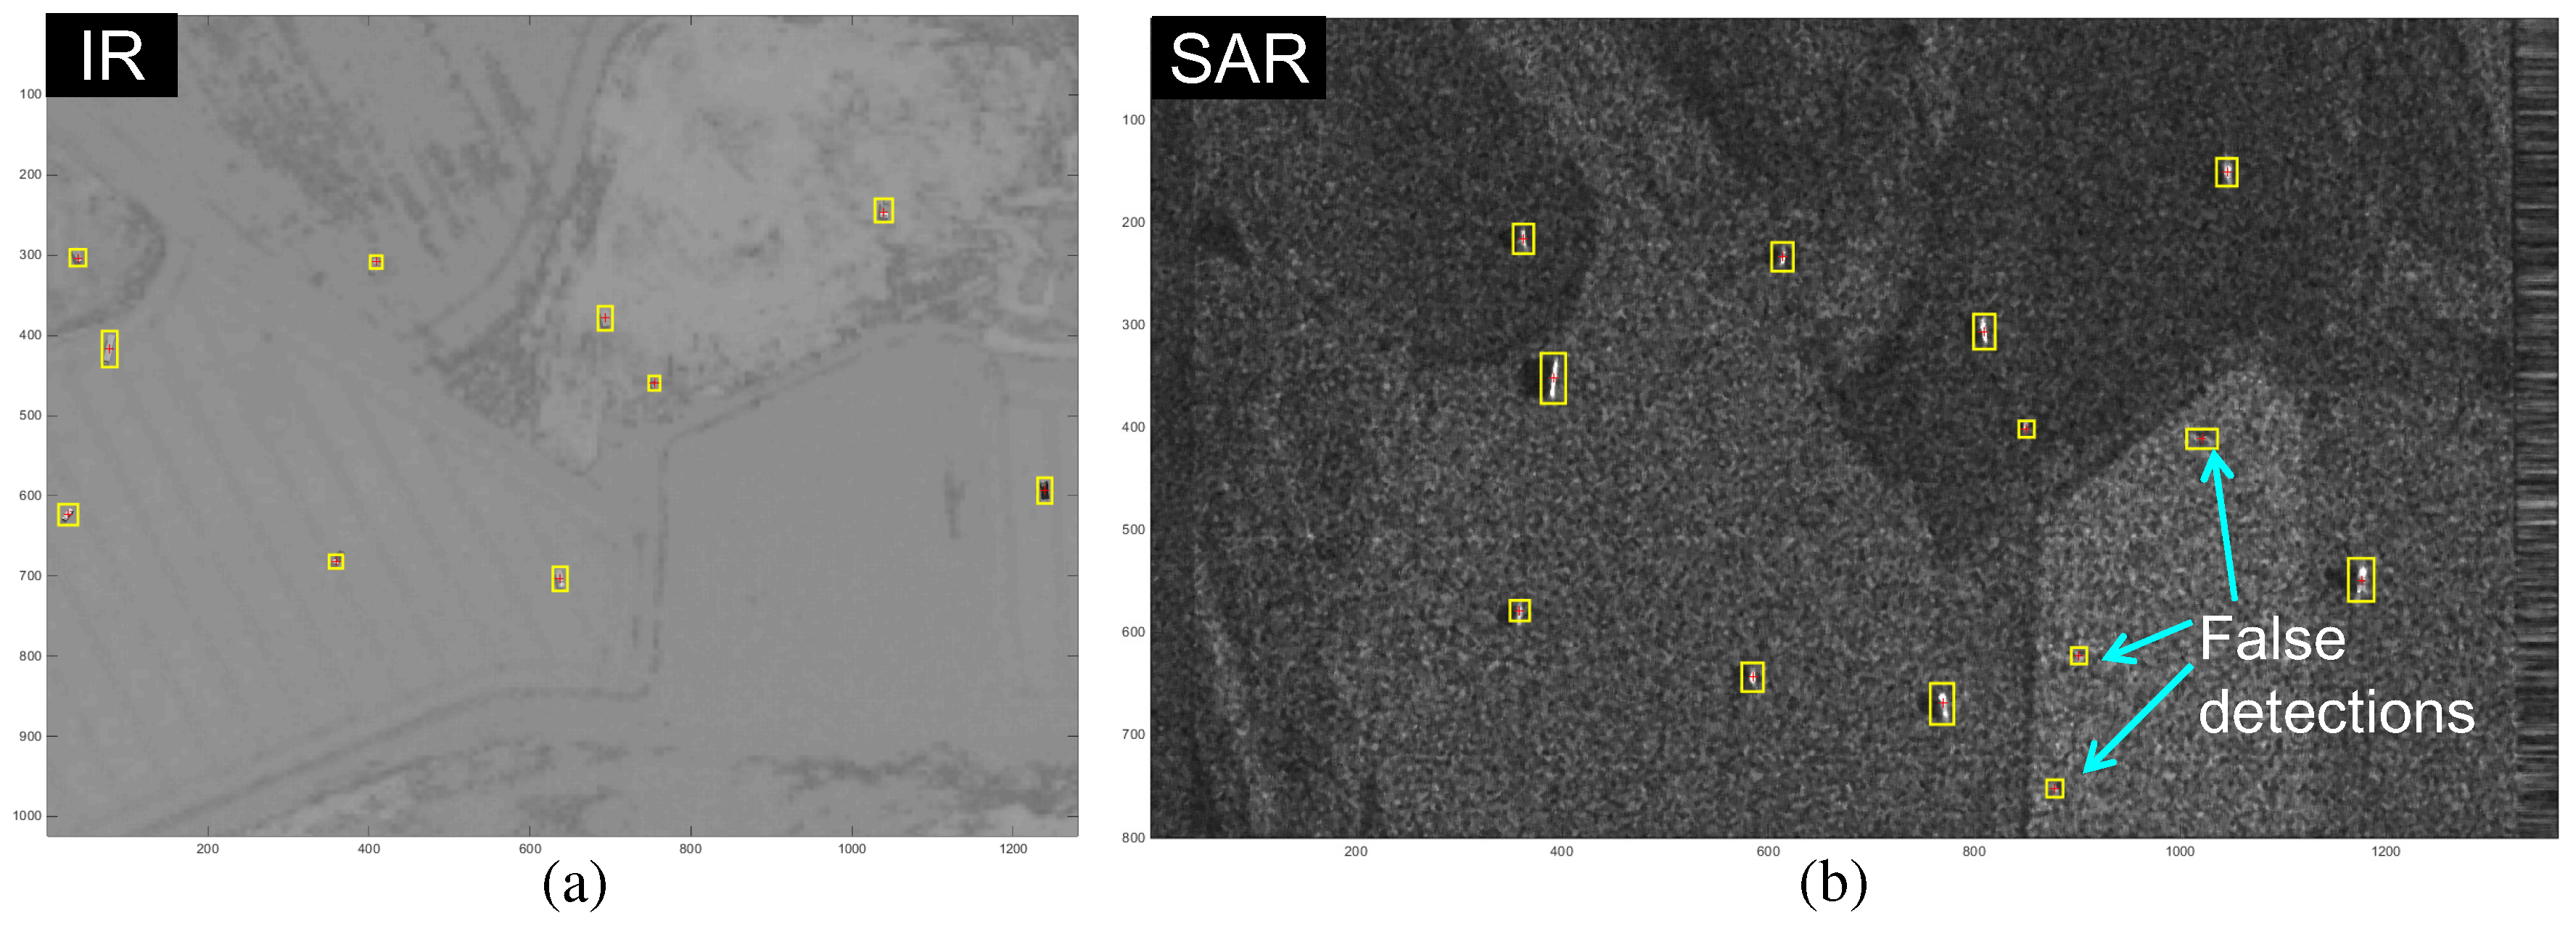
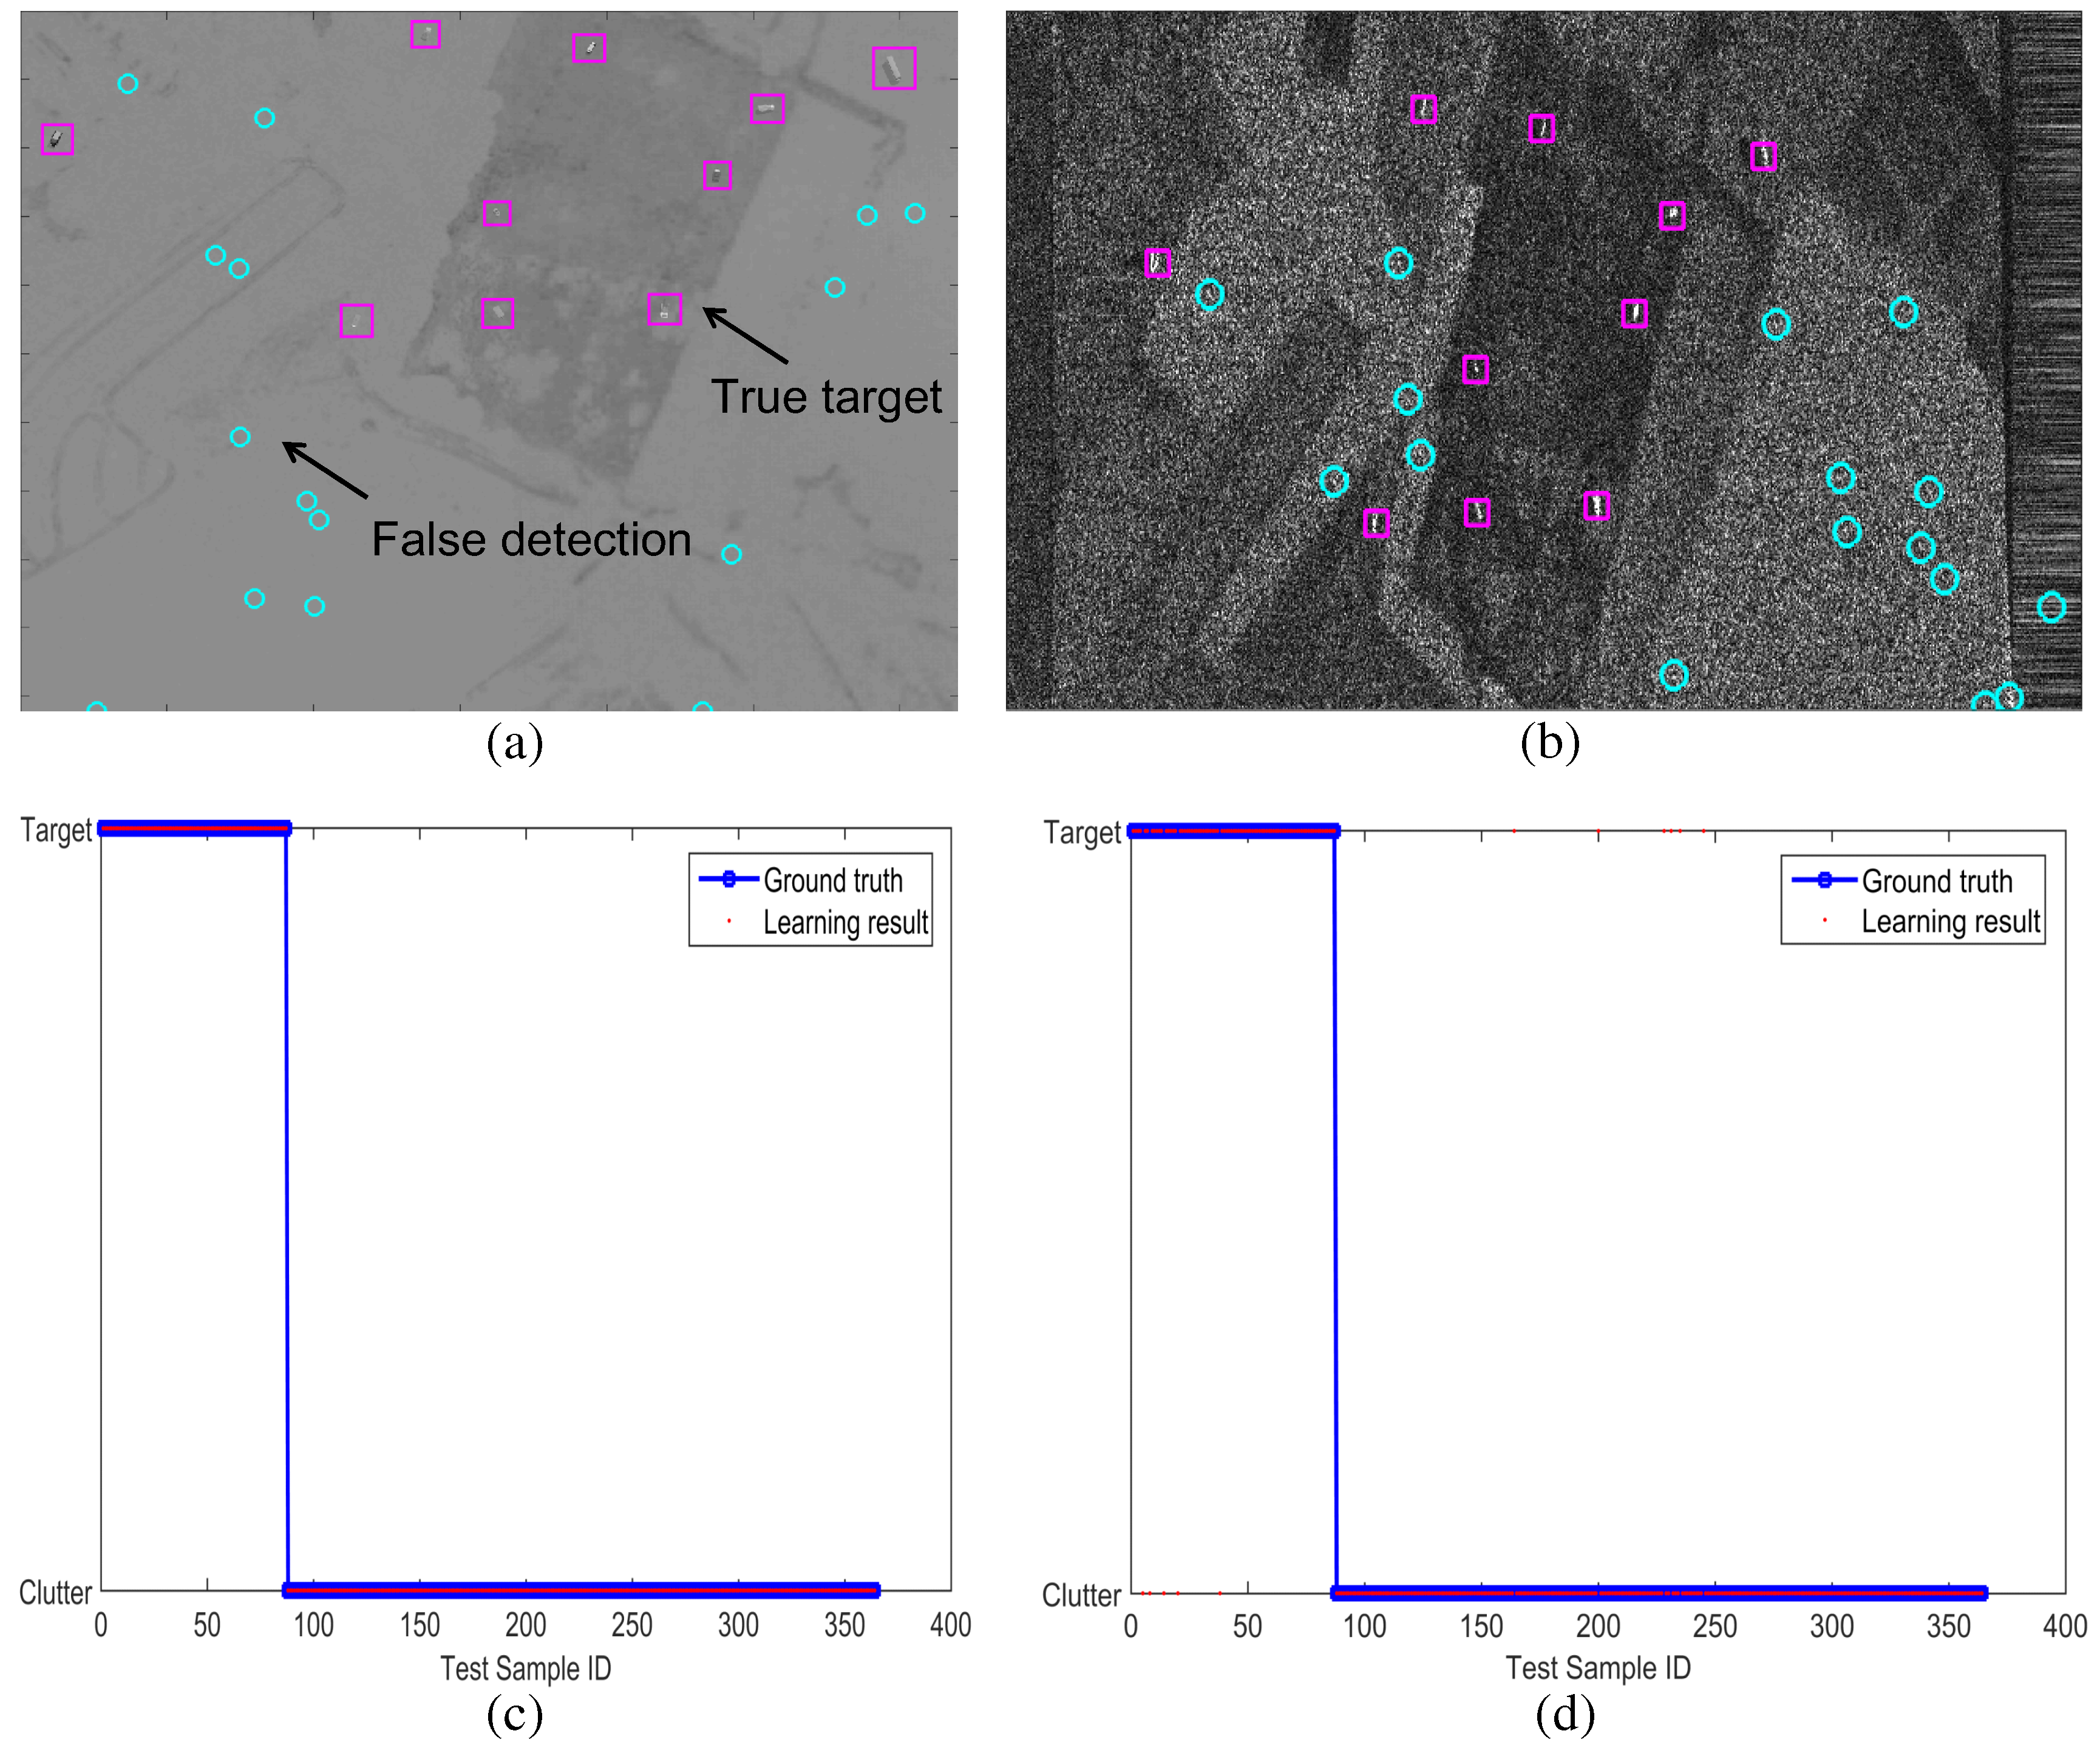
4.2. Individual SAR/IR Target Detection by BMVT vs. Proposed modBMVT
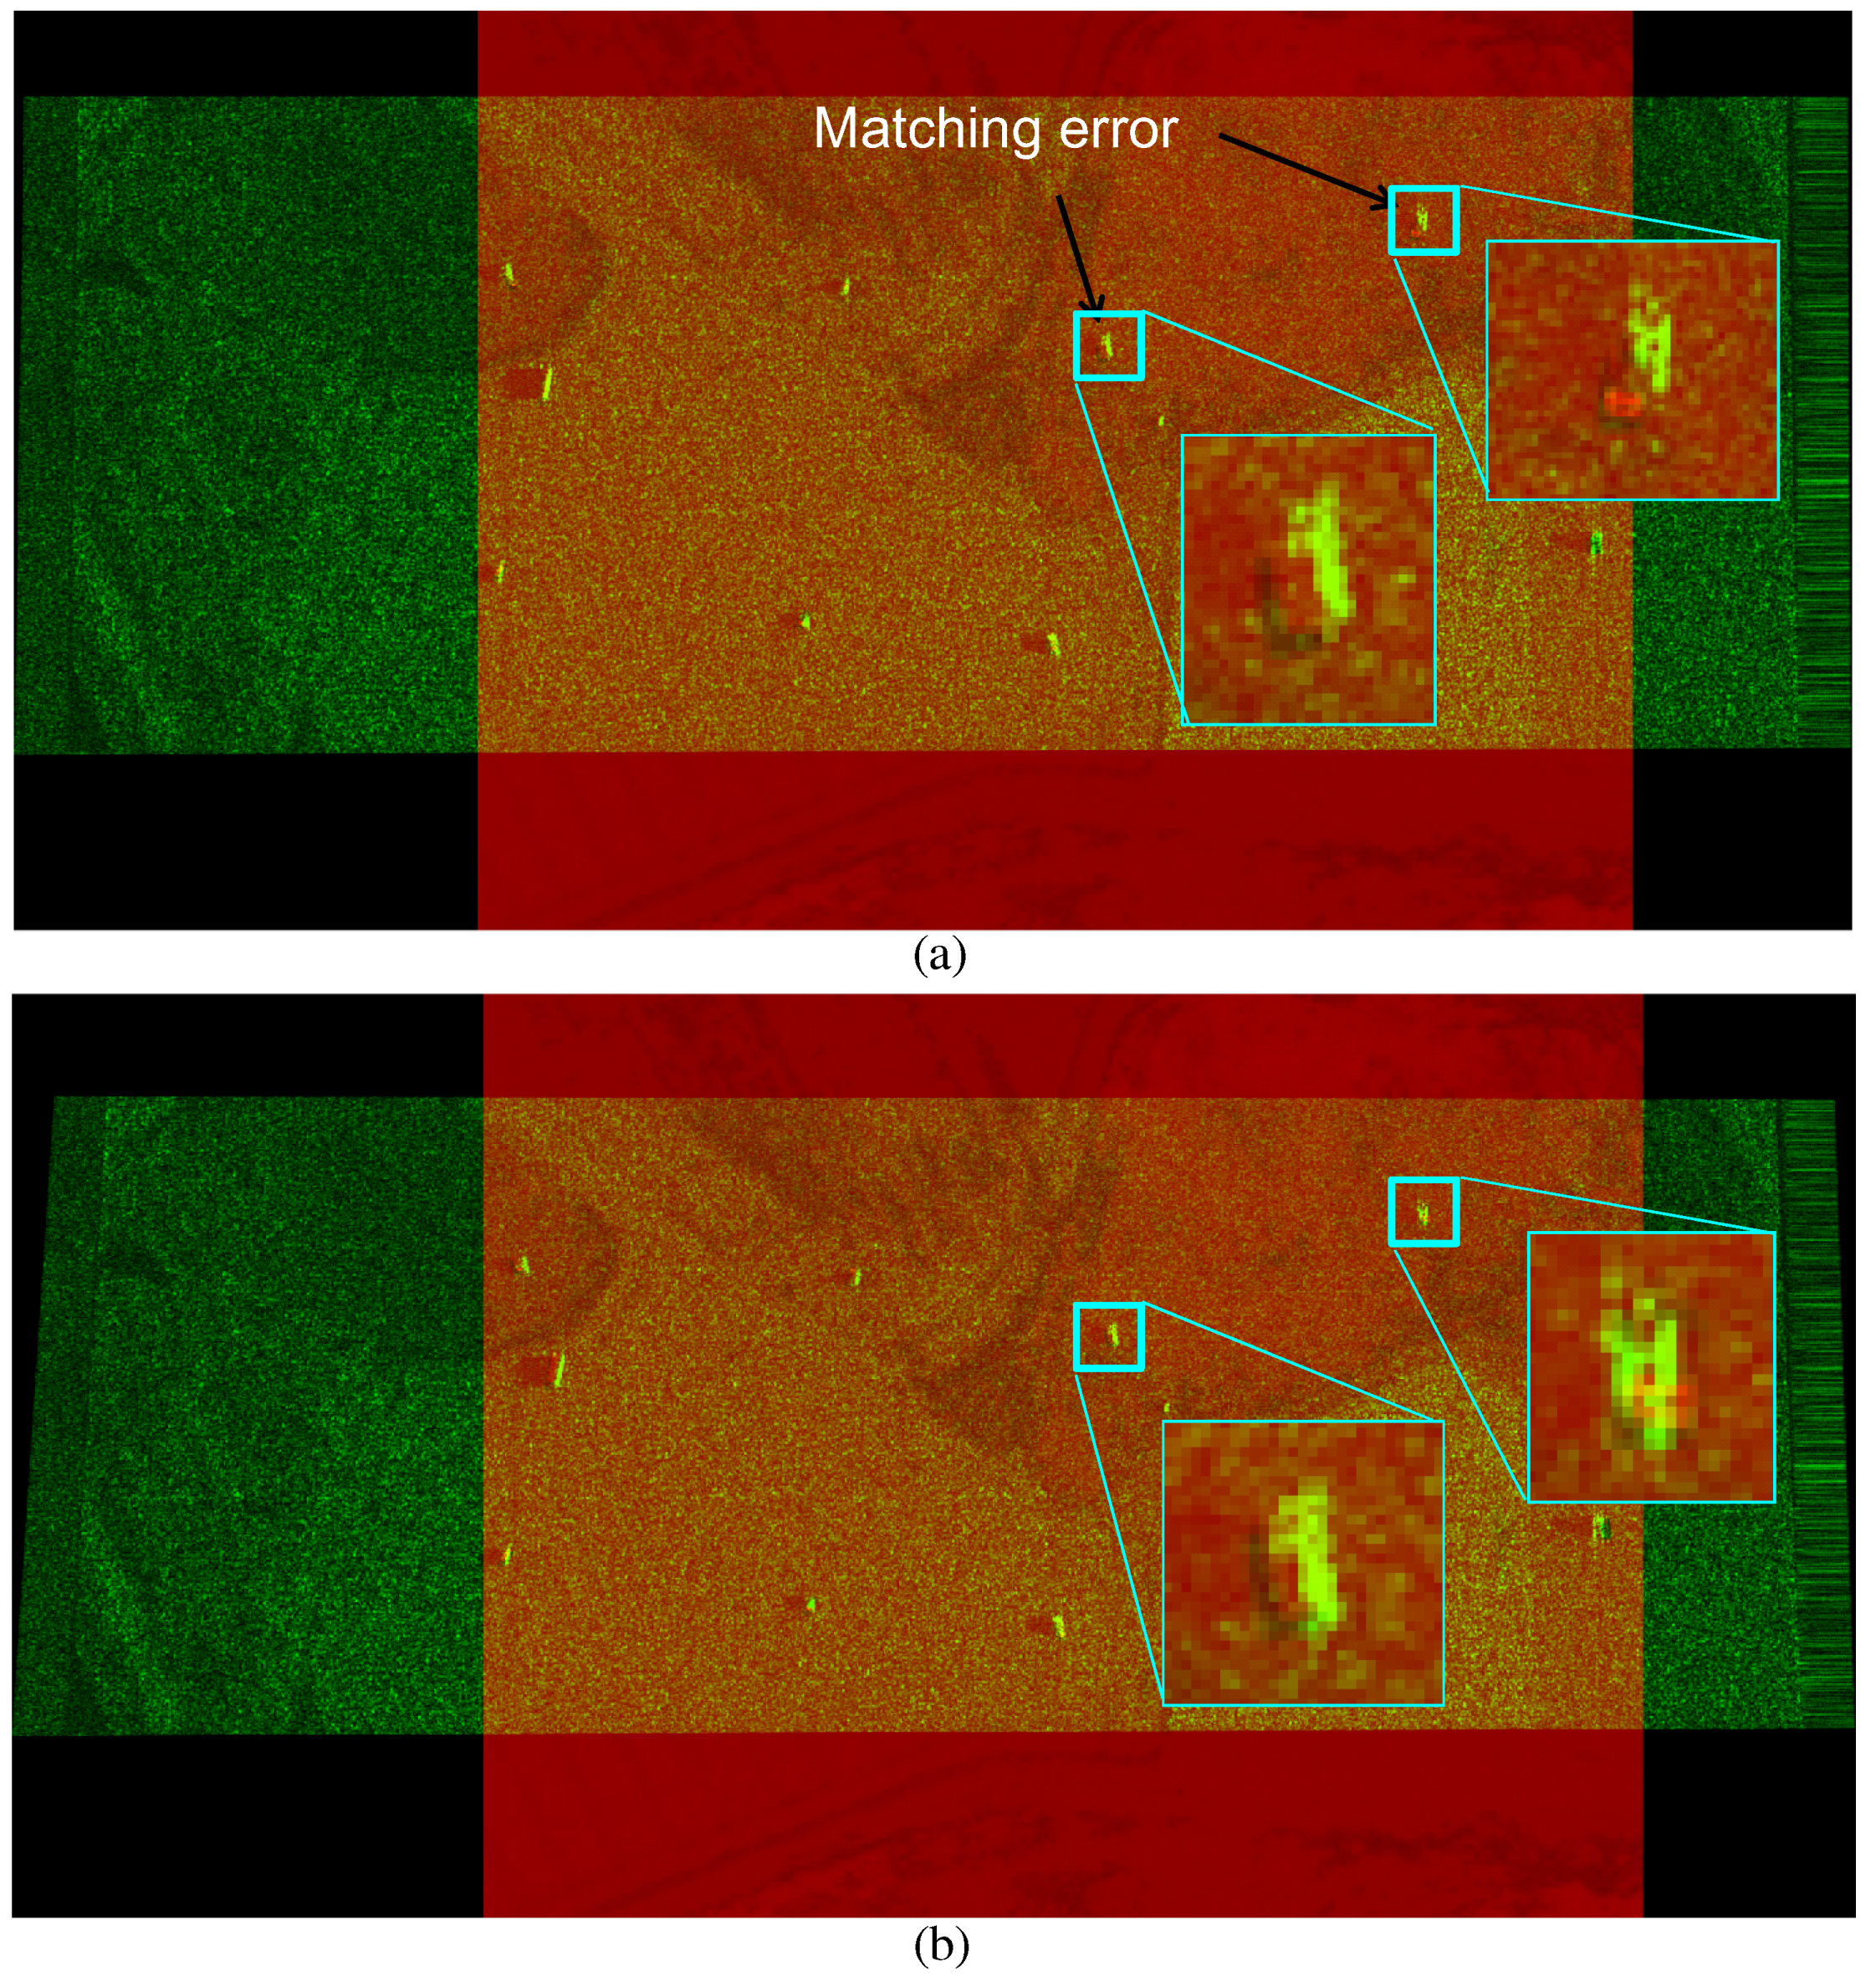
4.3. Evaluation of RANSARC-Based SAR/IR Registration
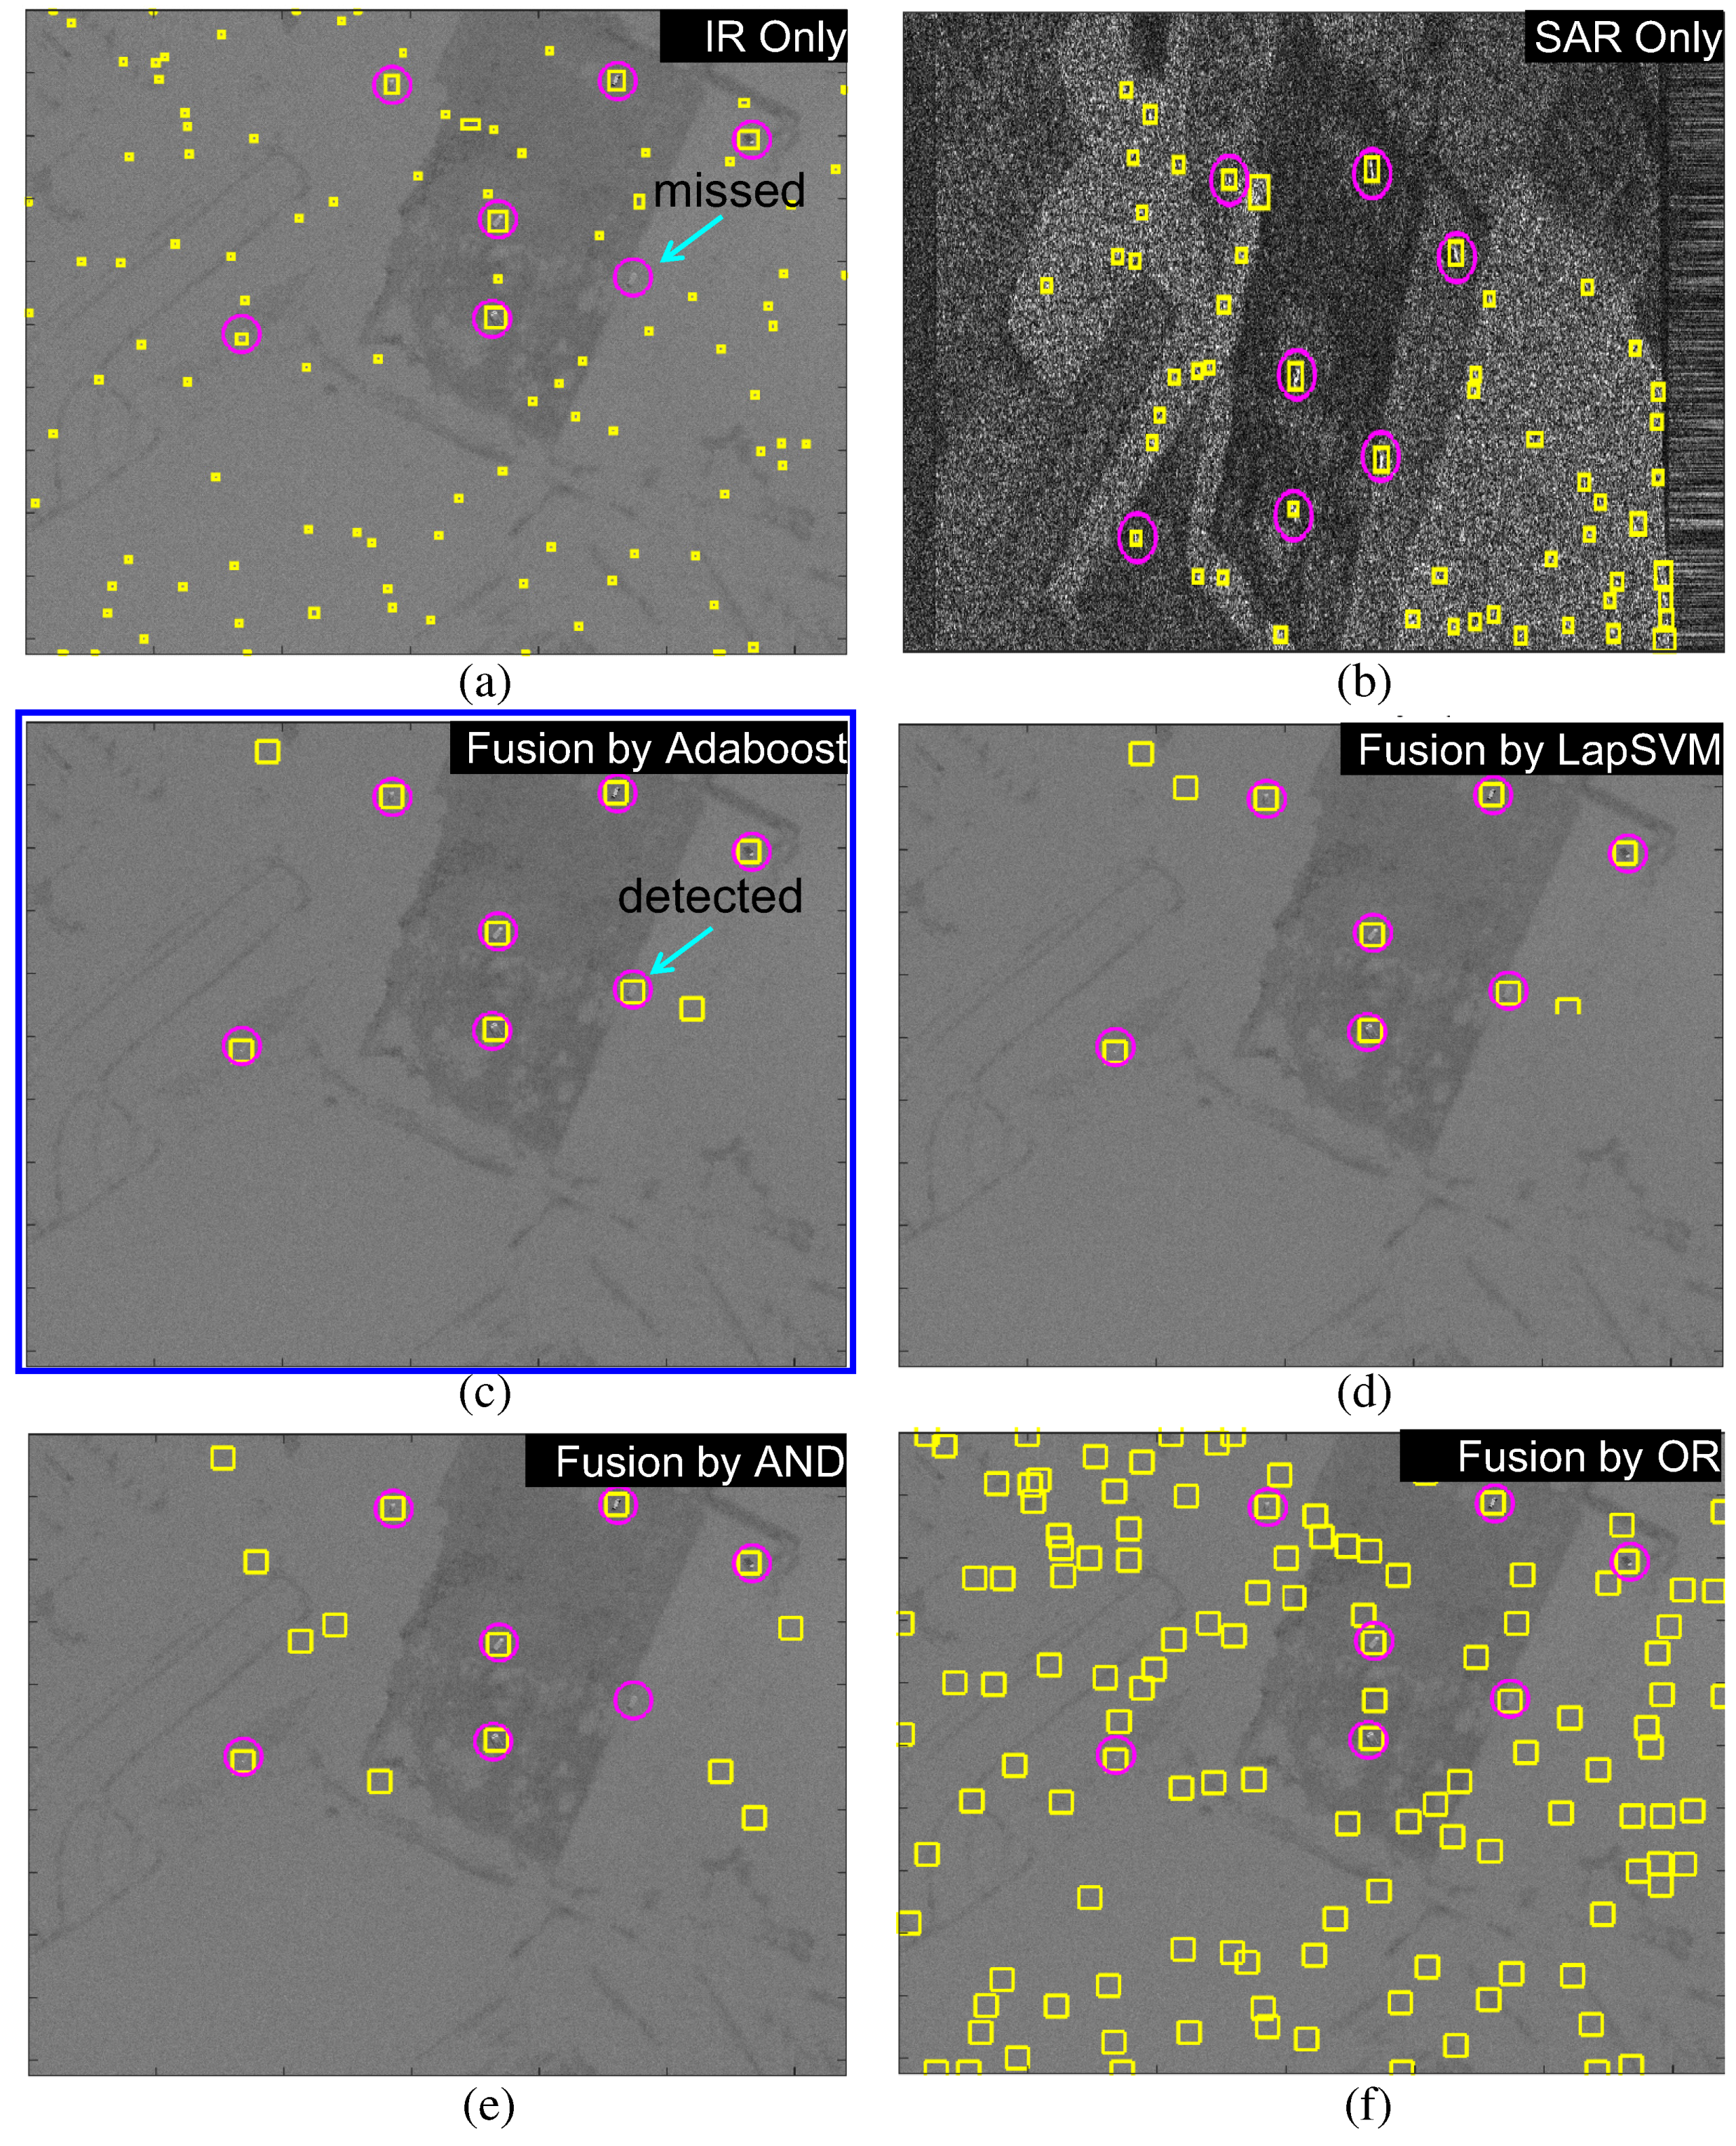
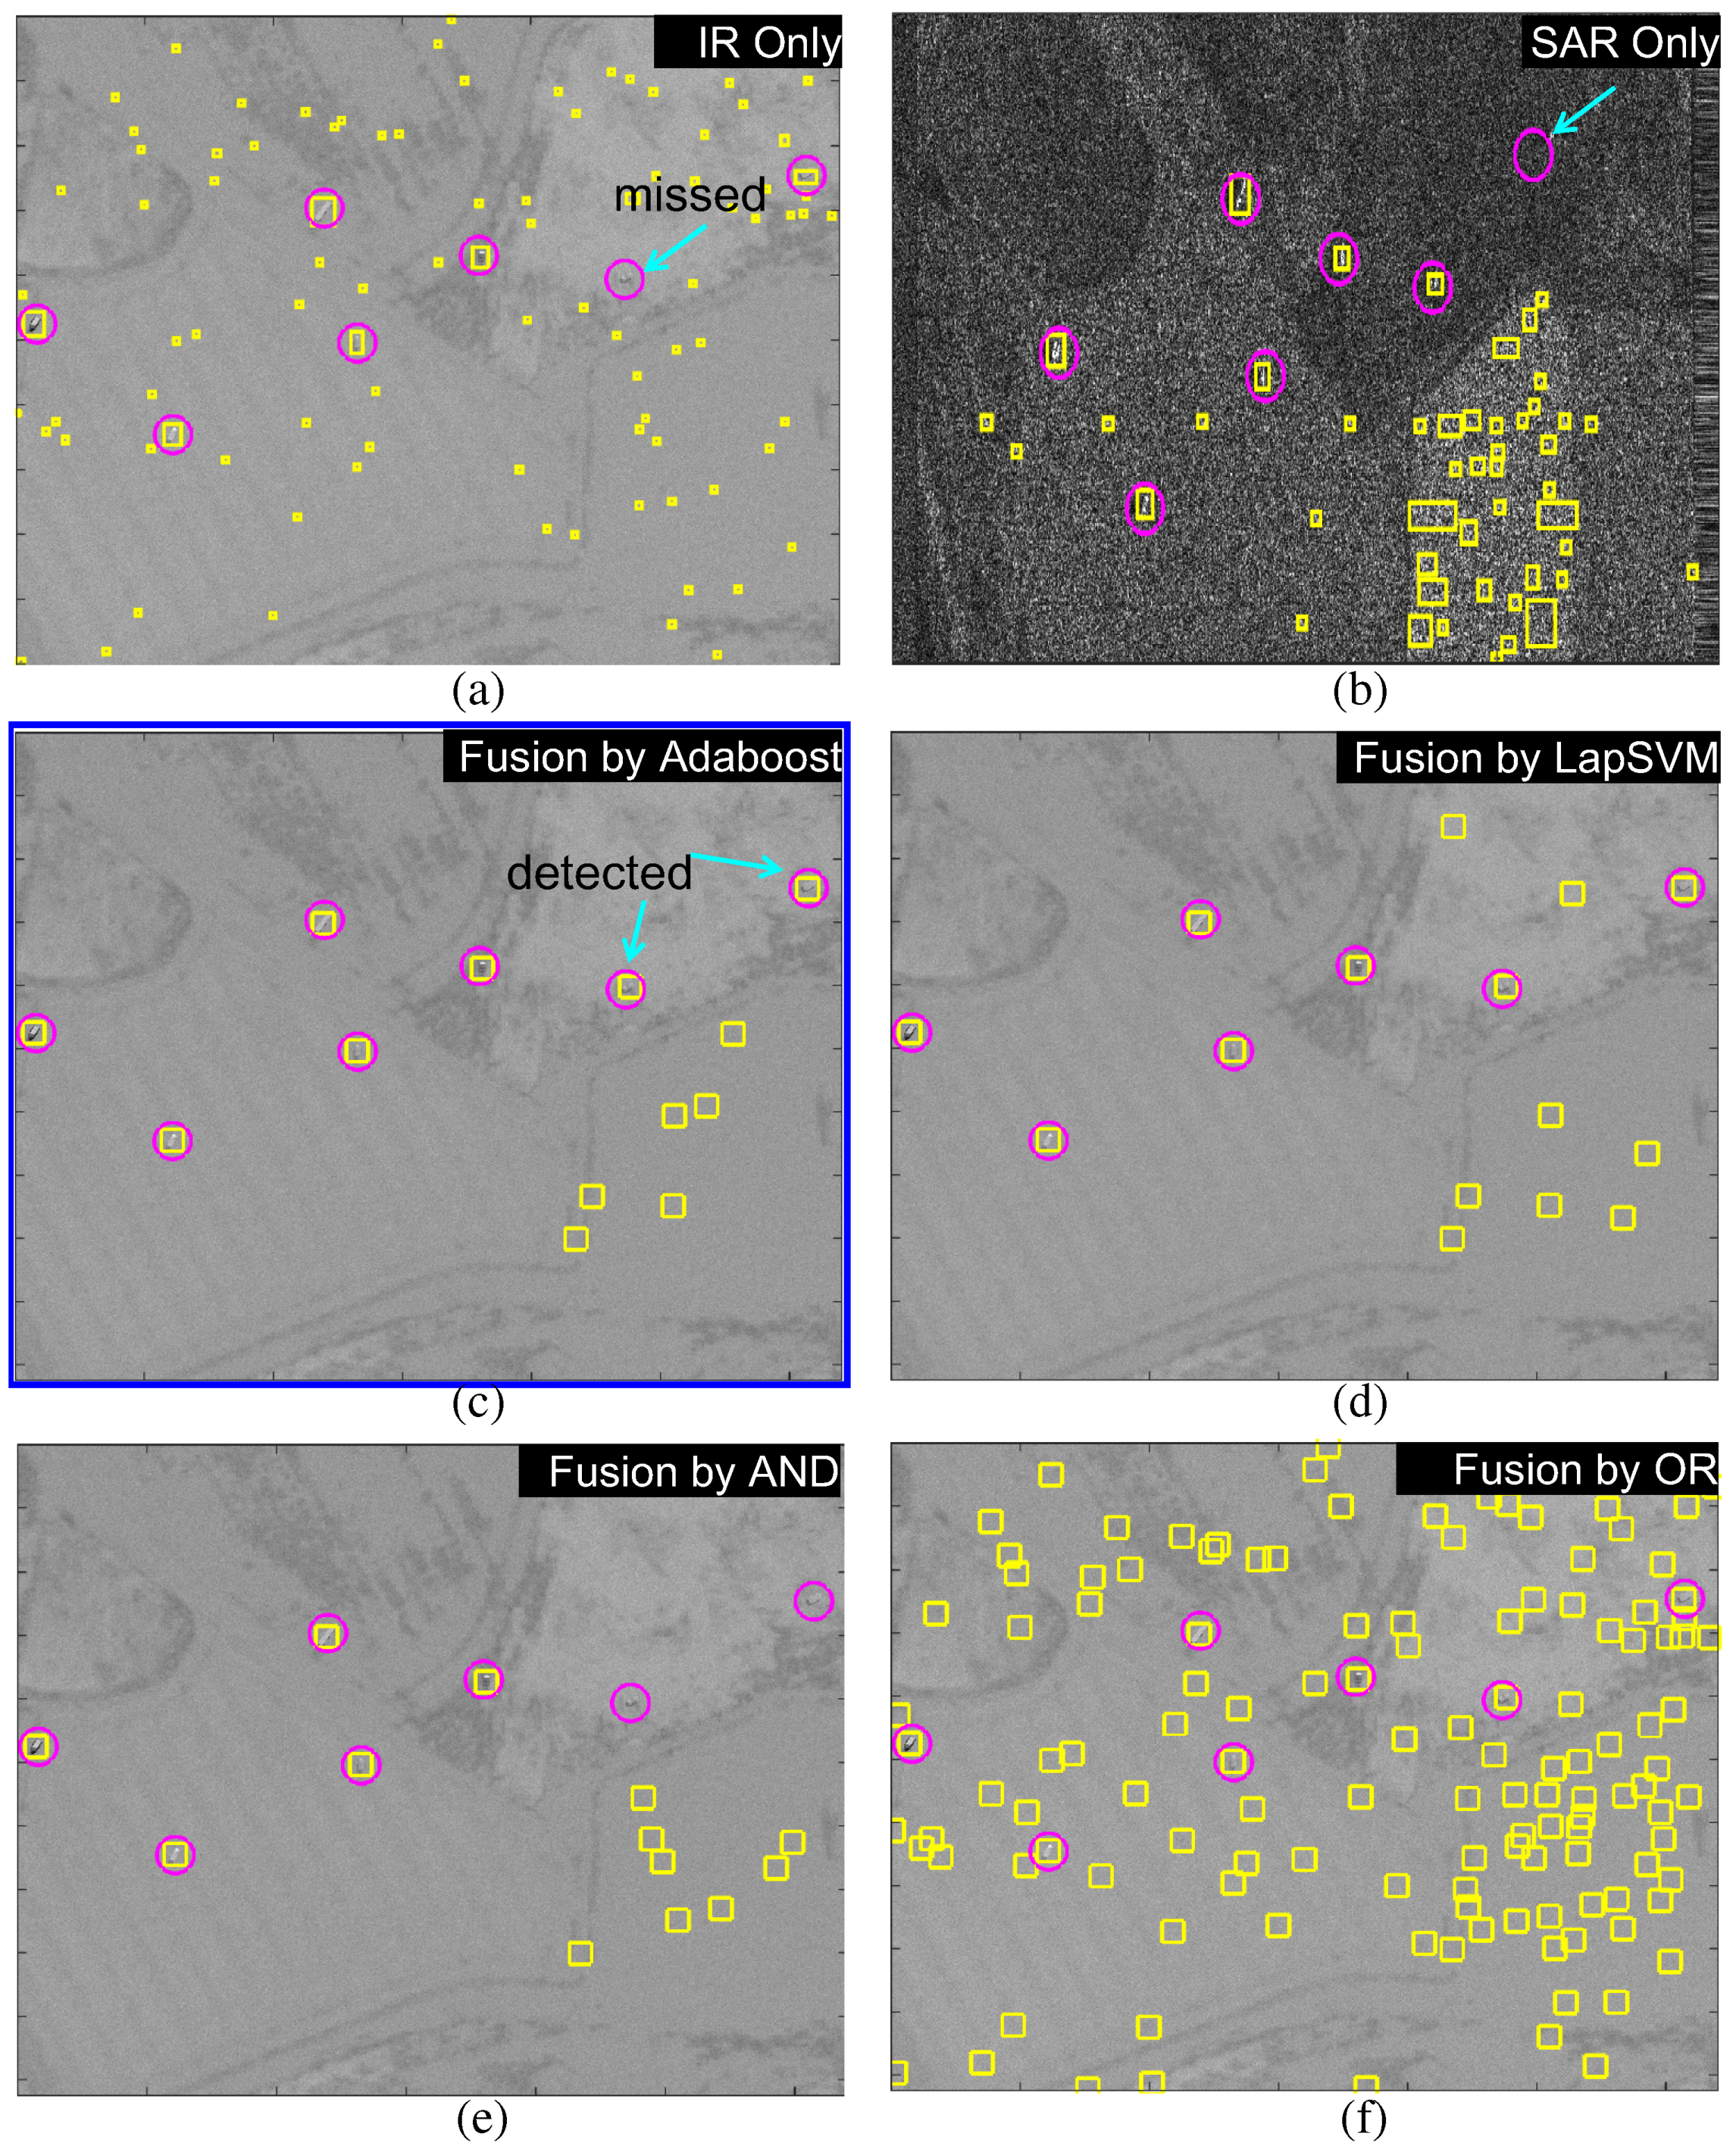
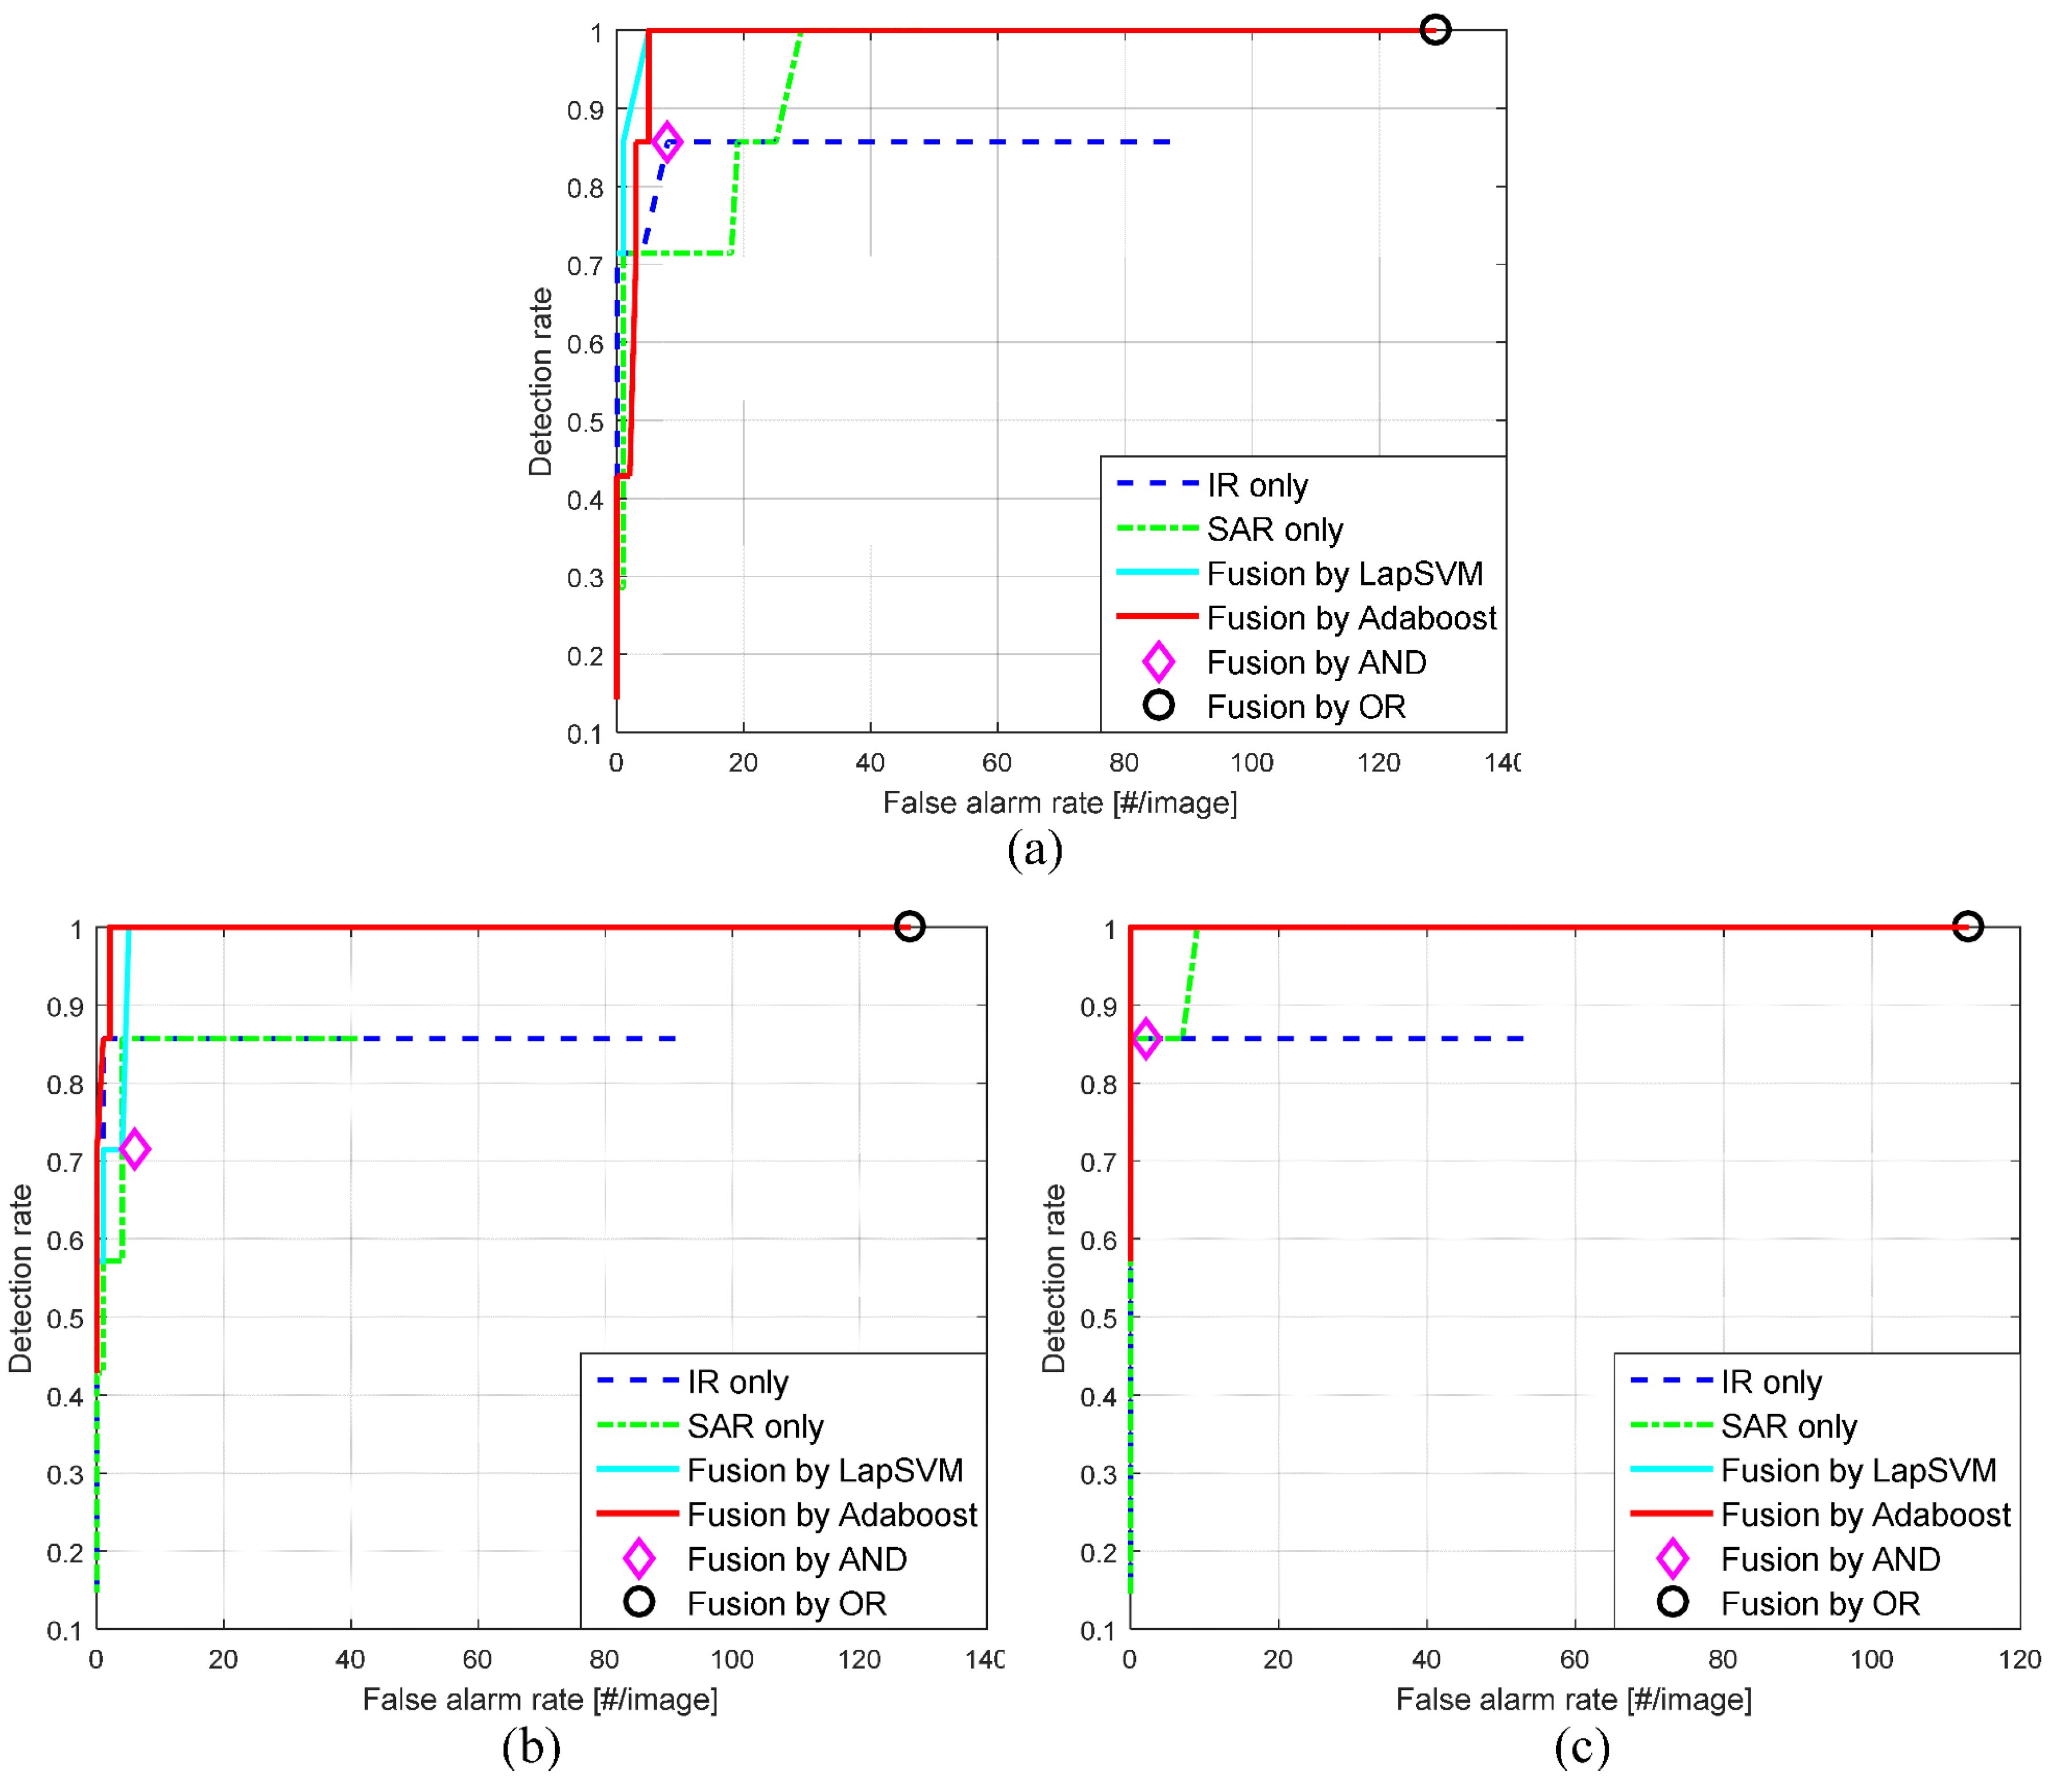
4.4. SAR/IR Fusion Based Final Target Detection
5. Conclusions and Discussion
Acknowledgments
Author Contributions
Conflicts of Interest
References
- Khan, J.F.; Alam, M.S. Target detection in cluttered forward-looking infrared imagery. Opt. Eng. 2005, 44, 076404. [Google Scholar] [CrossRef]
- Yang, D.; Li, X.; Xiao, S. Ground Targets Detection and Tracking Based on Integrated Information in Infrared Images. In Proceedings of the IEEE 10th International Conference on Signal Processing (ICSP), Beijing, China, 24–28 October 2010; pp. 910–915.
- Soyman, Y. Robust Automatic Target Recognition in FLIR imagery. In Proceedings of the International Society for Optics Engineering (SPIE), San Jose, CA, USA, 12–16 February 2012; Volume 8391.
- Yoon, S.P.; Song, T.L.; Kim, T.H. Automatic target recognition and tracking in forward-looking infrared image sequences with a complex background. Int. J. Control Autom. Syst. 2013, 11, 21–32. [Google Scholar] [CrossRef]
- Wegner, J.D.; Inglada, J.; Tison, C. Automatic Fusion of SAR and Optical Imagery based on Line Features. In Proceedings of the 7th European Conference on Synthetic Aperture Radar, Friedrichshafen, Germany, 2–5 June 2008; pp. 1–4.
- Lei, L.; Su, Y.; Jiang, Y. Feature-based Classification Fusion of Vehicles in High-resolution SAR and Optical Imagery. In Proceedings of the International Society for Optics Engineering (SPIE), Wuhan, China, 31 October 2005; Volume 6043.
- Kahler, B.; Blasch, E. Predicted radar/optical feature fusion gains for target identification. In Proceedings of the IEEE National Aerospace and Electronics Conference (NAECON), Dayton, OH, USA, 14–16 July 2010; pp. 405–412.
- Beaven, S.G.; Yu, X.; Hoff, L.E.; Chen, A.M.; Winter, E.M. Analysis of hyperspectral infrared and low frequency SAR data for target classification. In Signal and Data Processing of Small Targets, Proceedings of the International Society for Optics Engineering (SPIE), Orlando, FL, USA, 8 April 1996; Volume 2759, pp. 121–130.
- Bai, Q.; Jin, C. Image Fusion and Recognition Based on Compressed Sensing Theory. Int. J. Smart Sens. Intell. Syst. 2015, 8, 159–180. [Google Scholar]
- Lehureau, G.; Campedel, M.; Tupin, F.; Tison, C.; Oller, G. Combining SAR and Optical Features in a SVM Classifier for Man-Made Structures Detection. In Proceedings of the IEEE International Geoscience and Remote Sensing Symposium, Cape Town, South Africa, 12–17 July 2009; Volume 3, pp. 873–876.
- Dutkiewicz, M.; Davenport, M. Fusion of optical, infrared and radar imagery for coastal surveillanc. In Proceedings of the International Society for Optics Engineering (SPIE), Orlando, FL, USA, 8 April 1996; Volume 2744, pp. 165–175.
- Stephan, L.; Childs, M.; Pujara, N. Portable scalable architecture for model-based FLIR ATR and SAR/FLIR fusion. In Proceedings of the International Society for Optics Engineering (SPIE), Orlando, FL, USA, 17 August 2000; Volume 4050, pp. 79–87.
- Childs, M.B.; Carlson, K.M.; Pujara, N. Transition from lab to flight demo for model-based FLIR ATR and SAR-FLIR fusion. In Proceedings of the International Society for Optics Engineering (SPIE), Orlando, FL, USA, 5 April 1999; Volume 3718, pp. 294–305.
- Raghavan, S.; Poovendran, R.; Srinivasan, S.; Kanal, L. An Active Vision Based SAR-FLIR Fusion ATR System for Detection and Recognition of Ground Targets; AFRL Technical Report; LNK Corporation: Silver Spring, MD, USA, 1998; pp. 1–53. [Google Scholar]
- Hero, A.O.; Guillouet, C. Robust detection of SAR/IR targets via invariance. In Proceedings of the IEEE International Conference on Image Processing, Santa Barbara, CA, USA, 26–29 October 1997; Volume 3, pp. 472–475.
- Chen, Y. Registration of SAR and FLIR images for ATR applications. In Proceedings of the International Society for Optics Engineering (SPIE), Orlando, FL, USA, 16 April 2001; Volume 4380, pp. 127–134.
- Kim, S. High-Speed Incoming Infrared Target Detection by Fusion of Spatial and Temporal Detectors. Sensors 2015, 15, 7267–7293. [Google Scholar] [CrossRef] [PubMed]
- Rivest, J.F.; Fortin, R. Detection of Dim Targets in Digital Infrared Imagery by Morphological Image Processing. Opt. Eng. 1996, 35, 1886–1893. [Google Scholar] [CrossRef]
- Wang, Y.L.; Dai, J.M.; Sun, X.G.; Wang, Q. An efficient method of small targets detection in low SNR. J. Phys. Conf. Ser. 2006, 48, 427–430. [Google Scholar] [CrossRef]
- Kim, S. Double Layered-Background Removal Filter for Detecting Small Infrared Targets in Heterogenous Backgrounds. J. Infrared Millim. Terahertz Waves 2011, 32, 79–101. [Google Scholar] [CrossRef]
- Despande, S.D.; Er, M.H.; Venkateswarlu, R.; Chan, P. Max-Mean and Max-Median Filters for Detection of Small-targets. In Proceedings of the International Society for Optics Engineering (SPIE), Denver, CO, USA, 18 July 1999; Volume 3809, pp. 74–83.
- Kim, S.; Lee, J. Scale invariant small target detection by optimizing signal-to-clutter ratio in heterogeneous background for infrared search and track. Pattern Recognit. 2012, 45, 393–406. [Google Scholar] [CrossRef]
- Qi, S.; Ming, D.; Sun, X.; Ma, J.; Tian, J. Robust method for infrared small-target detection based on Boolean map visual theory. Appl. Opt. 2014, 53, 3929–3940. [Google Scholar] [CrossRef] [PubMed]
- Harris, C.; Buxton, B. Evolving edge detectors with genetic programming. In Proceedings of the 1st Annual Conference on Genetic Programming, Stanford, CA, USA, 28–31 July 1996; pp. 309–314.
- Cooke, T.; Redding, N.; Schroeder, J.; Zhang, J. Comparison of selected features for target detection in synthetic aperture radar imagery. Digit. Signal Process. 2000, 10, 286–296. [Google Scholar] [CrossRef]
- Kuttikkad, S.; Chellappa, R. Non-Gaussian CFAR techniques for target detection in high resolution SAR images. In Proceedings of the IEEE International Conference Image Processing, Austin, TX, USA, 13–16 November 1994; Volume 1, pp. 910–914.
- Kaplan, L. Improved SAR target detection via extended fractal feature. IEEE Trans. Aerosp. Electron. Syst. 2001, 37, 436–451. [Google Scholar] [CrossRef]
- Goldstein, G.B. False alarm regulation in log-normal and Weibull clutter. IEEE Trans. Aerosp. Electron. Syst. 1973, 9, 84–92. [Google Scholar] [CrossRef]
- Novak, L.M.; Hesse, S.R. On the performance of ordered-statistics CFAR detectors. In Proceedings of the Conference Record of the Twenty-Fifth Asilomar Conference on Signals, Systems and Computers, Pacific Grove, CA, USA, 4–6 November 1991; pp. 835–840.
- Pham, Q.; Brosnan, T.M.; Smith, M.J.T. Multistage algorithm for detection of targets in image data. In Proceedings of the International Society for Optics Engineering (SPIE), Orlando, FL, USA, 21 April 1997; Volume 3070.
- Subotic, N.S.; Thelen, B.J.; Gorman, J.D.; Reiley, R.F. Multiresolution detection of coherent radar targets. IEEE Trans. Image Process. 1997, 6, 21–35. [Google Scholar] [CrossRef] [PubMed]
- Ye, W.; Paulson, C.; Wu, D. Target detection for very high-frequency synthetic aperture radar ground surveillance. IET Comput. Vis. 2012, 6, 101–110. [Google Scholar] [CrossRef]
- Vard, A.; Jamshidi, K.; Movahhediniau, N. Small object detection in cluttered image using a correlation based active contour model. Pattern Recognit. Lett. 2012, 33, 543–553. [Google Scholar] [CrossRef]
- Ouyang, W.; Wang, X.; Zeng, X.; Qiu, S.; Luo, P.; Tian, Y.; Li, H.; Yang, S.; Wang, Z.; Loy, C.C.; et al. DeepID-Net: Deformable deep convolutional neural networks for object detection. In Proceedings of the IEEE Conference on Computer Vision and Pattern Recognition (CVPR), Boston, MA, USA, 7–12 June 2015; pp. 2403–2412.
- Tian, Y.; Luo, P.; Wang, X.; Tang, X. Deep Learning Strong Parts for Pedestrian Detection. In Proceedings of the IEEE International Conference on Computer Vision, Santiago, Chile, 7–13 December 2015.
- Huang, L.; Pashler, H. A Boolean map theory of visual attention. Psychol. Rev. 2007, 114, 599–631. [Google Scholar] [CrossRef] [PubMed]
- Goff, A.L.; Cathala, T.; Latger, J. New impressive capabilities of SE-workbench for EO/IR real-time rendering of animated scenarios including flares. In Proceedings of the International Society for Optics Engineering (SPIE), Toulouse, France, 21 September 2015; Volume 9653.
- Papoulis, A.; Pillai, S.U. Probalibity, Random Variables and Stochastic Processes, 4th ed.; McGraw-Hill: New York, NY, USA, 2001. [Google Scholar]
- Gao, G. Statistical Modeling of SAR Images: A Survey. Sensors 2010, 2010, 775–795. [Google Scholar] [CrossRef] [PubMed]
- Gonzalez, R.C.; Woods, R.E. Digital Image Processing, 3rd ed.; Prentice Hall: Upper Saddle River, NJ, USA, 2008. [Google Scholar]
- Hartley, R.I.; Zisserman, A. Multiple View Geometry in Computer Vision, 2nd ed.; Cambridge University Press: Cambridge, UK, 2004. [Google Scholar]
- Zhu, Y.; Cheng, S.; Stankovic, V.; Stankovic, L. Image registration using BP-SIFT. J. Vis. Commun. Image Represent. 2013, 24, 448–457. [Google Scholar] [CrossRef]
- Dung, L.R.; Huang, C.-M.; Wu, Y.Y. Implementation of RANSAC Algorithm for Feature-Based Image Registration. J. Comput. Commun. 2013, 1, 46–50. [Google Scholar] [CrossRef]
- Brooks, R.R.; Iyengar, S.S. Multi-Sensor Fusion: Fundamentals and Applications with Software; Prentice Hall: Upper Saddle River, NJ, USA, 1998. [Google Scholar]
- Klein, L.A. Sensor and Data Fusion: A Tool for Information Assessment and Decision Making, 2nd ed.; SPIE Press: Bellingham, WA, USA, 1998. [Google Scholar]
- Chureesampant, K.; Susaki, J. Multi-temporal SAR and Optical Data Fusion with Texture Measures for Land Cover Classification based on the Bayesian Theory. ISPRS SC Newsl. 2008, 5, 1183–1188. [Google Scholar]
- Foucher, S.; Germain, M.; Boucher, J.M.; Benie, G.B. Multisource Classification Using ICM and Dempster-Shafer Theory. IEEE Trans. Instrum. Meas. 2002, 51, 277–281. [Google Scholar] [CrossRef]
- Khoshelham, K.; Nedkov, S.; Nardinocchi, C. A Comparison of Bayesian and Evidence-based Fusion Methods for Automated Building Detection in Aerial Data. Int. Archi. Photogramm. Remote Sens. Spat. Inf. Sci. 2009, 37, 1183–1188. [Google Scholar]
- Melacci, S.; Belkin, M. Laplacian support vector machines trained in the primal. J. Mach. Learn. Res. 2011, 12, 1149–1184. [Google Scholar]
- Kim, S. Analysis of small infrared target features and learning-based false detection removal for infrared search and track. Pattern Anal. Appl. 2014, 17, 883–900. [Google Scholar] [CrossRef]
- Latger, J.; Cathala, T.; Douchin, N.; Goff, A.L. Simulation of active and passive infrared images using the SE-WORKBENCH. In Proceedings of the International Society for Optics Engineering (SPIE), Orlando, FL, USA, 9 April 2007; Volume 6543.
- Torralba, A.; Murphy, K.P.; Freeman, W.T. Sharing visual features for multiclass and multiview object detection. IEEE Trans. Pattern Anal. Mach. Intell. 2007, 29, 854–869. [Google Scholar] [CrossRef] [PubMed]
- Manifold Regularization: Laplacian SVM. Available online: http://www.dii.unisi.it/~melacci/lapsvmp/ (accessed on 19 July 2016).


| Fusion Scheme | Detection Rate (%) | False Alarms/Image |
|---|---|---|
| IR only | 84.8 (28/33) | 74.6 (448/6) |
| SAR only | 96.9 (32/33) | 50.1 (301/6) |
| Proposed (Adaboost) | 100.0 (33/33) | 4.1 (25/6) |
| LapSVM [49] | 100.0 (33/33) | 6.1 (37/6) |
| Logical AND [46] | 81.8 (27/33) | 4.8 (29/6) |
| Logical OR [46] | 100.0 (33/33) | 119.3 (716/6) |
© 2016 by the authors; licensee MDPI, Basel, Switzerland. This article is an open access article distributed under the terms and conditions of the Creative Commons Attribution (CC-BY) license (http://creativecommons.org/licenses/by/4.0/).
Share and Cite
Kim, S.; Song, W.-J.; Kim, S.-H. Robust Ground Target Detection by SAR and IR Sensor Fusion Using Adaboost-Based Feature Selection. Sensors 2016, 16, 1117. https://doi.org/10.3390/s16071117
Kim S, Song W-J, Kim S-H. Robust Ground Target Detection by SAR and IR Sensor Fusion Using Adaboost-Based Feature Selection. Sensors. 2016; 16(7):1117. https://doi.org/10.3390/s16071117
Chicago/Turabian StyleKim, Sungho, Woo-Jin Song, and So-Hyun Kim. 2016. "Robust Ground Target Detection by SAR and IR Sensor Fusion Using Adaboost-Based Feature Selection" Sensors 16, no. 7: 1117. https://doi.org/10.3390/s16071117
APA StyleKim, S., Song, W.-J., & Kim, S.-H. (2016). Robust Ground Target Detection by SAR and IR Sensor Fusion Using Adaboost-Based Feature Selection. Sensors, 16(7), 1117. https://doi.org/10.3390/s16071117