
Classification of Horse Gaits Using FCM-Based Neuro-Fuzzy Classifier from the Transformed Data Information of Inertial Sensor


Abstract
:1. Introduction
2. Construction of Horse Rider’s Motion Database
2.1. Building the Horse Riding Motion Database
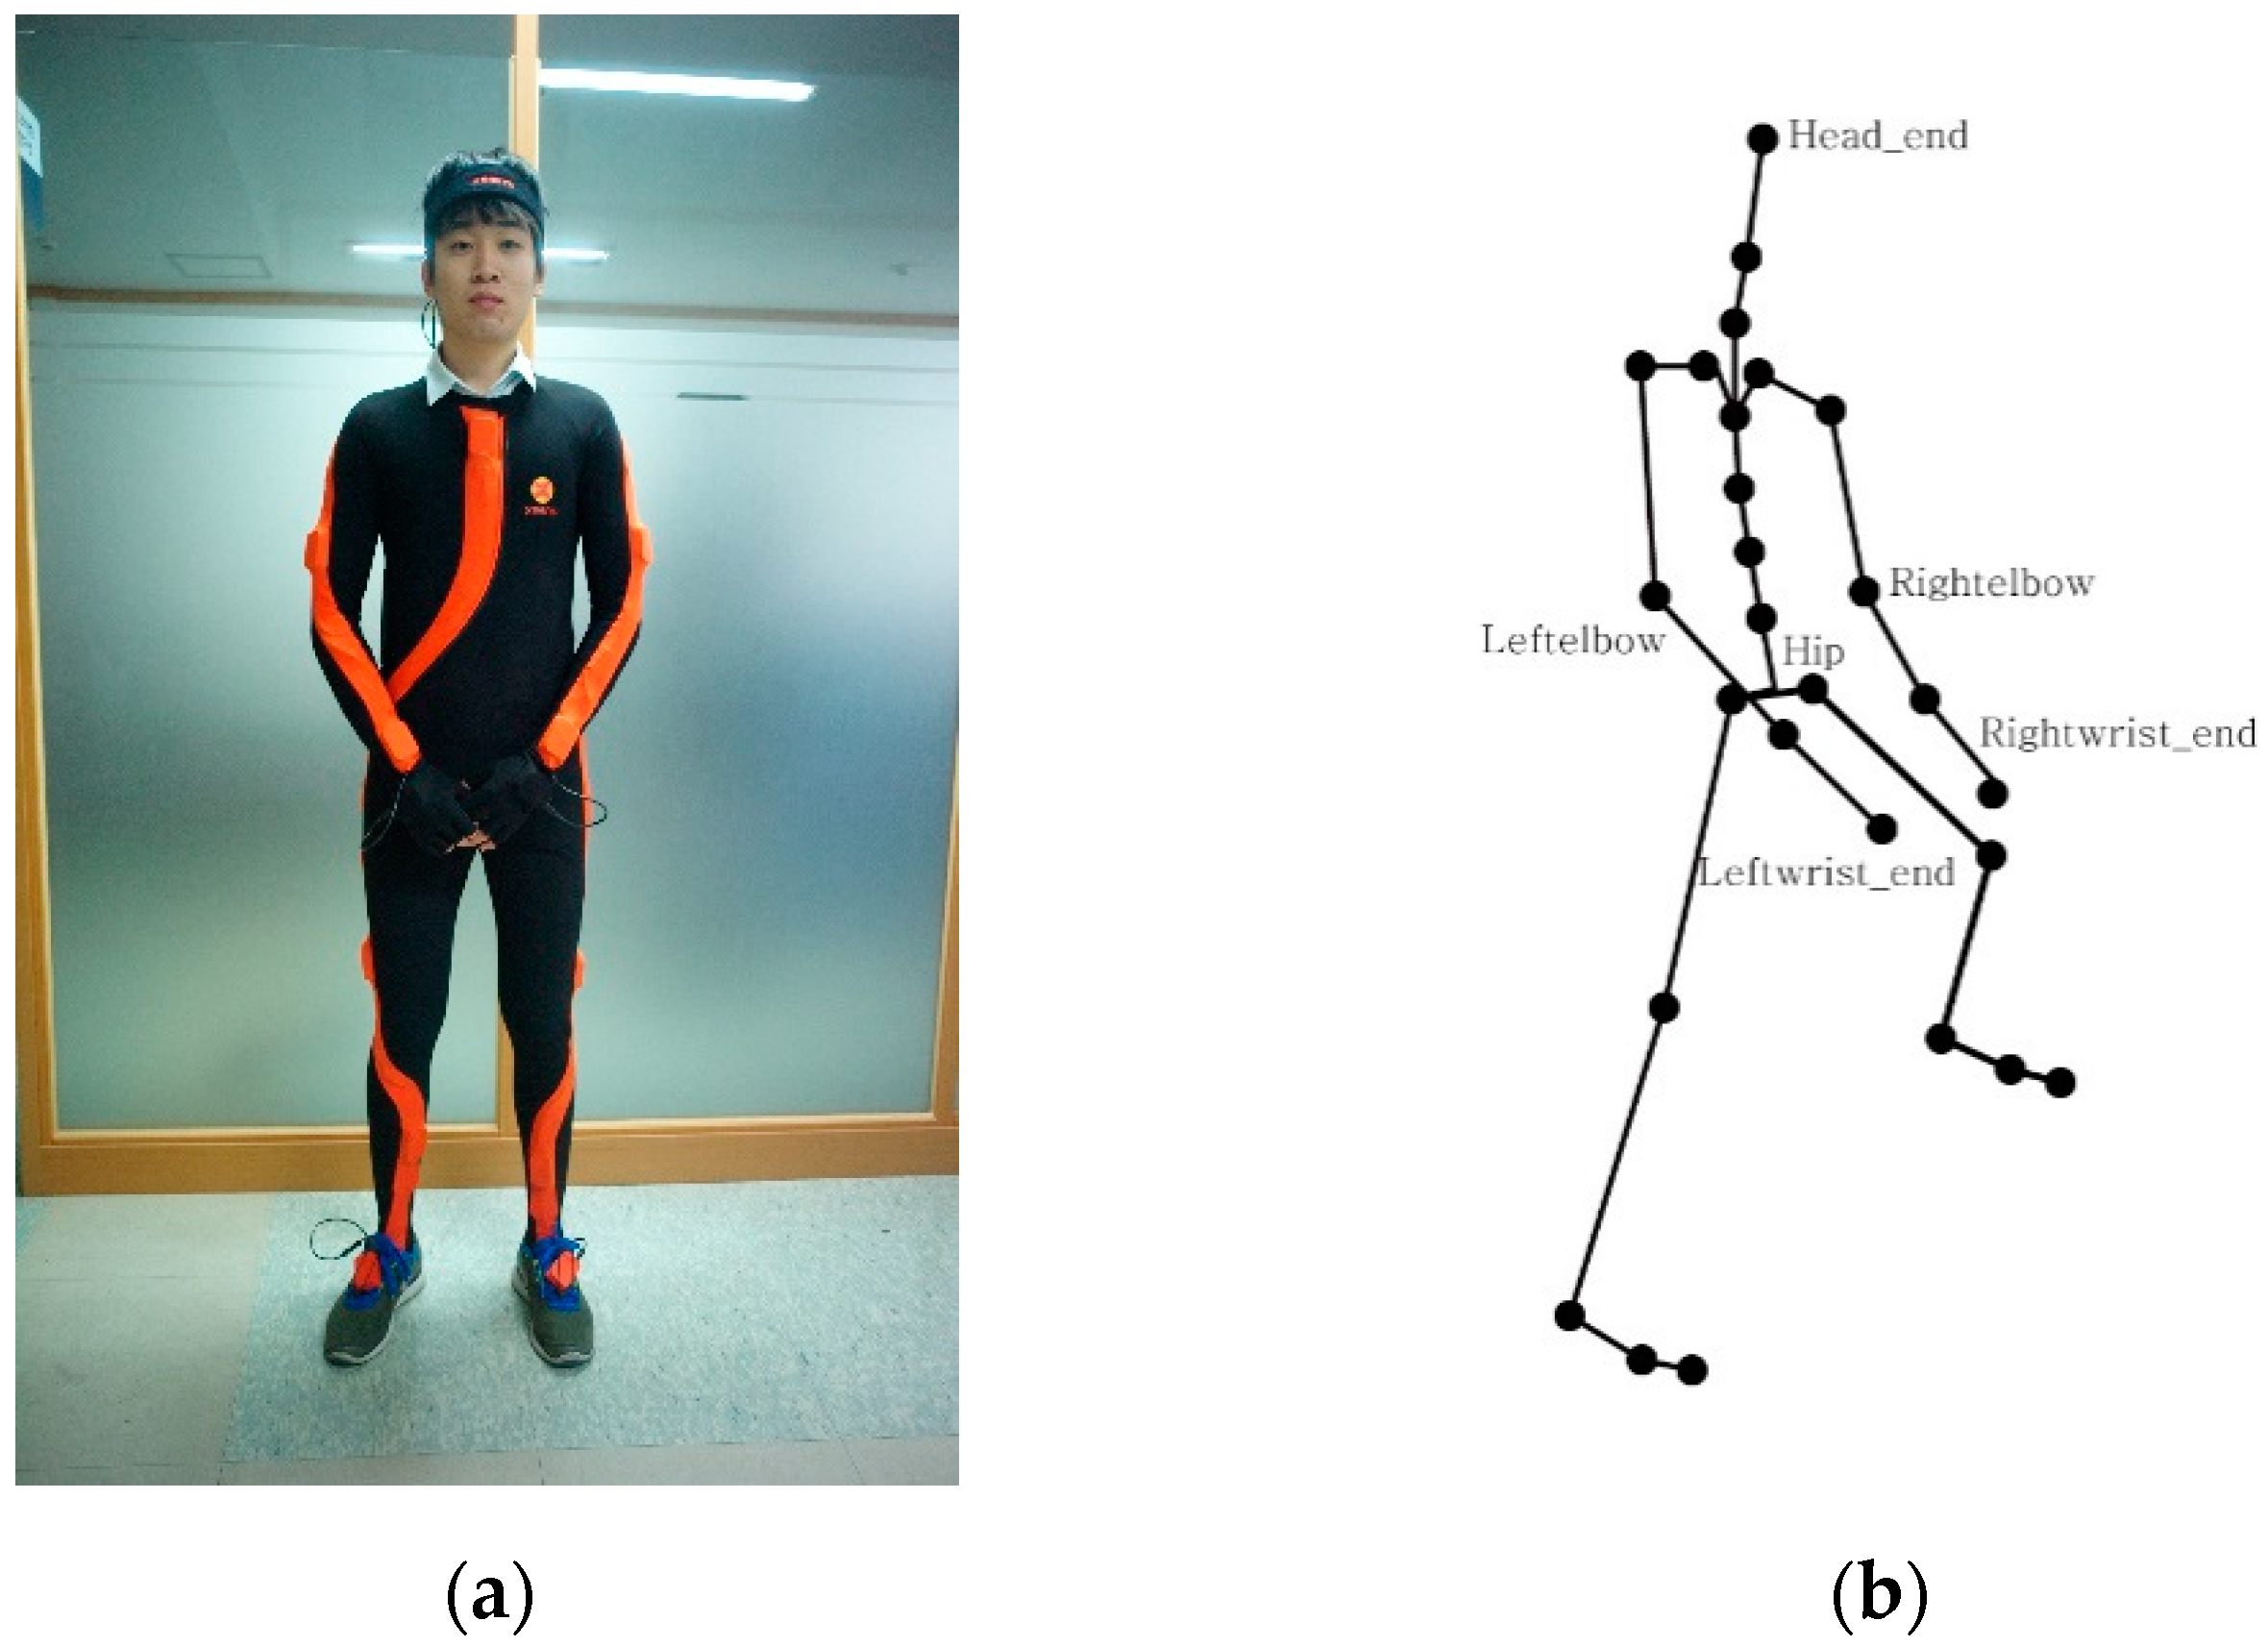
2.1.1. Motion Capture
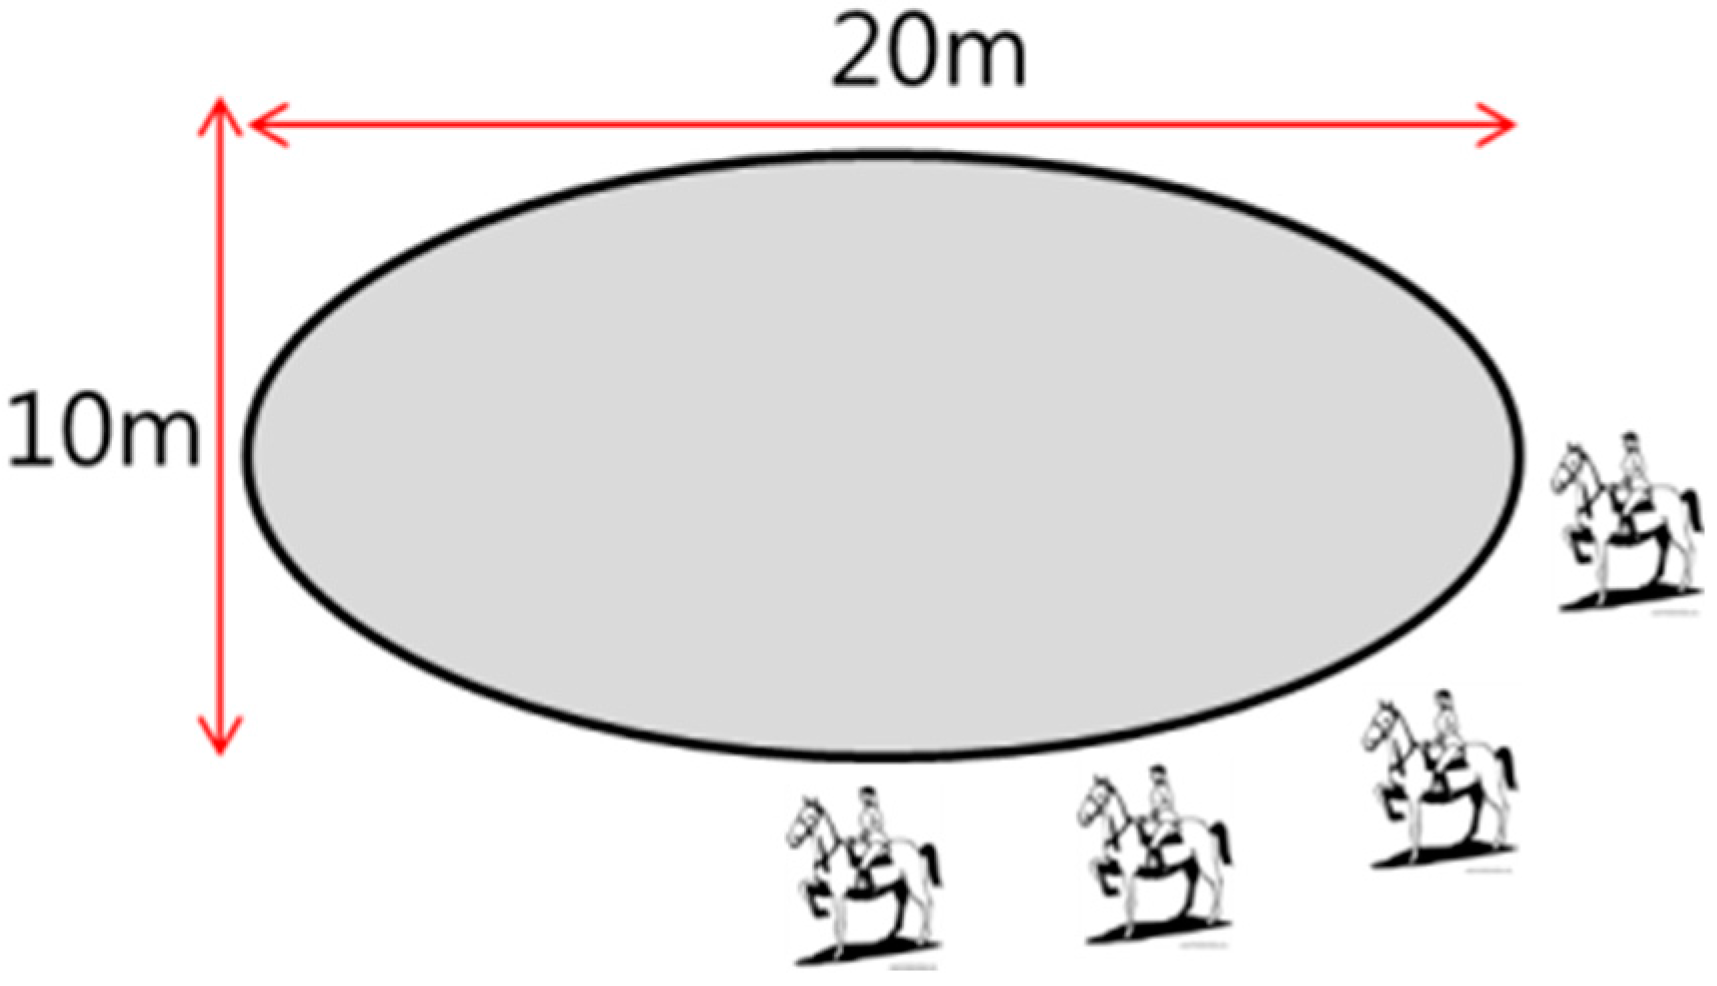
2.1.2. Database Construction in Horse Riding Environment
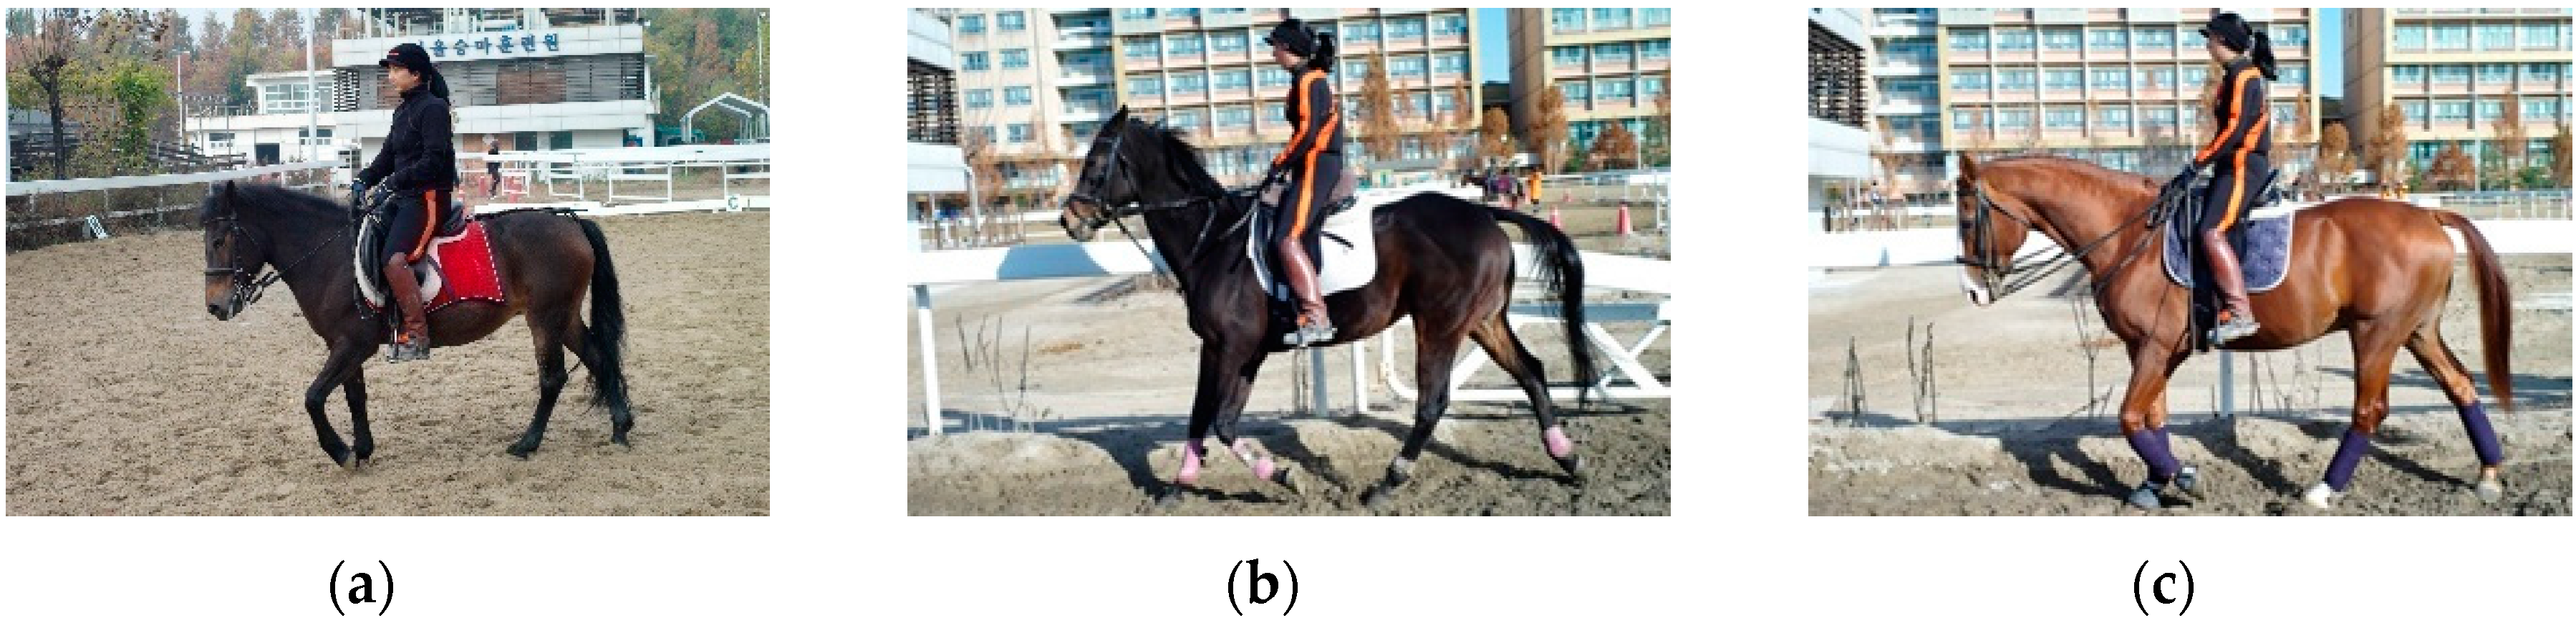
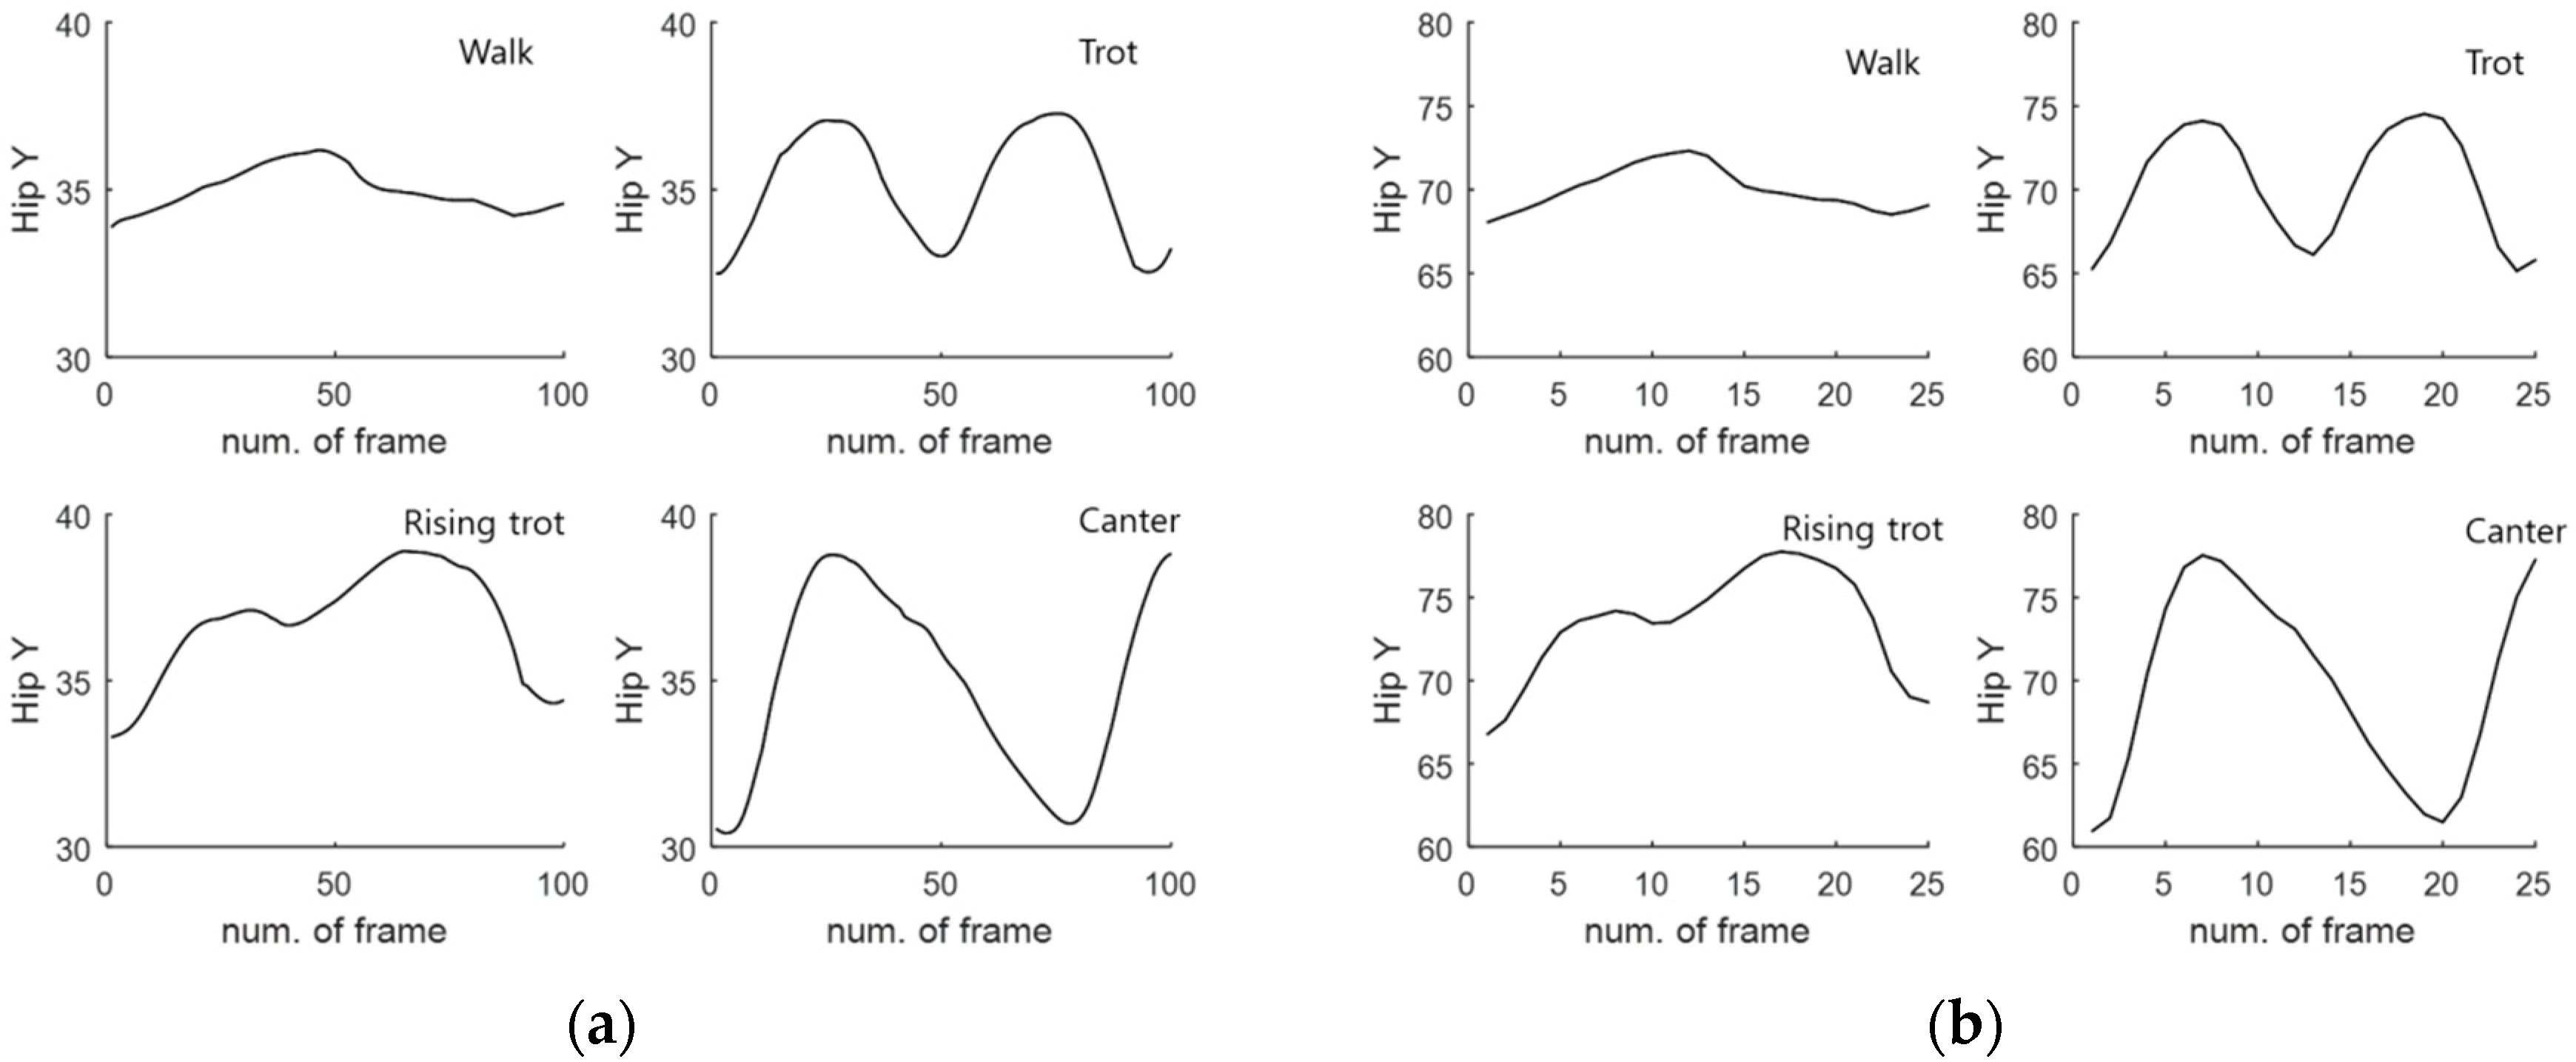
2.1.3. Gait-Specific Motions in Real Horse Riding Environment
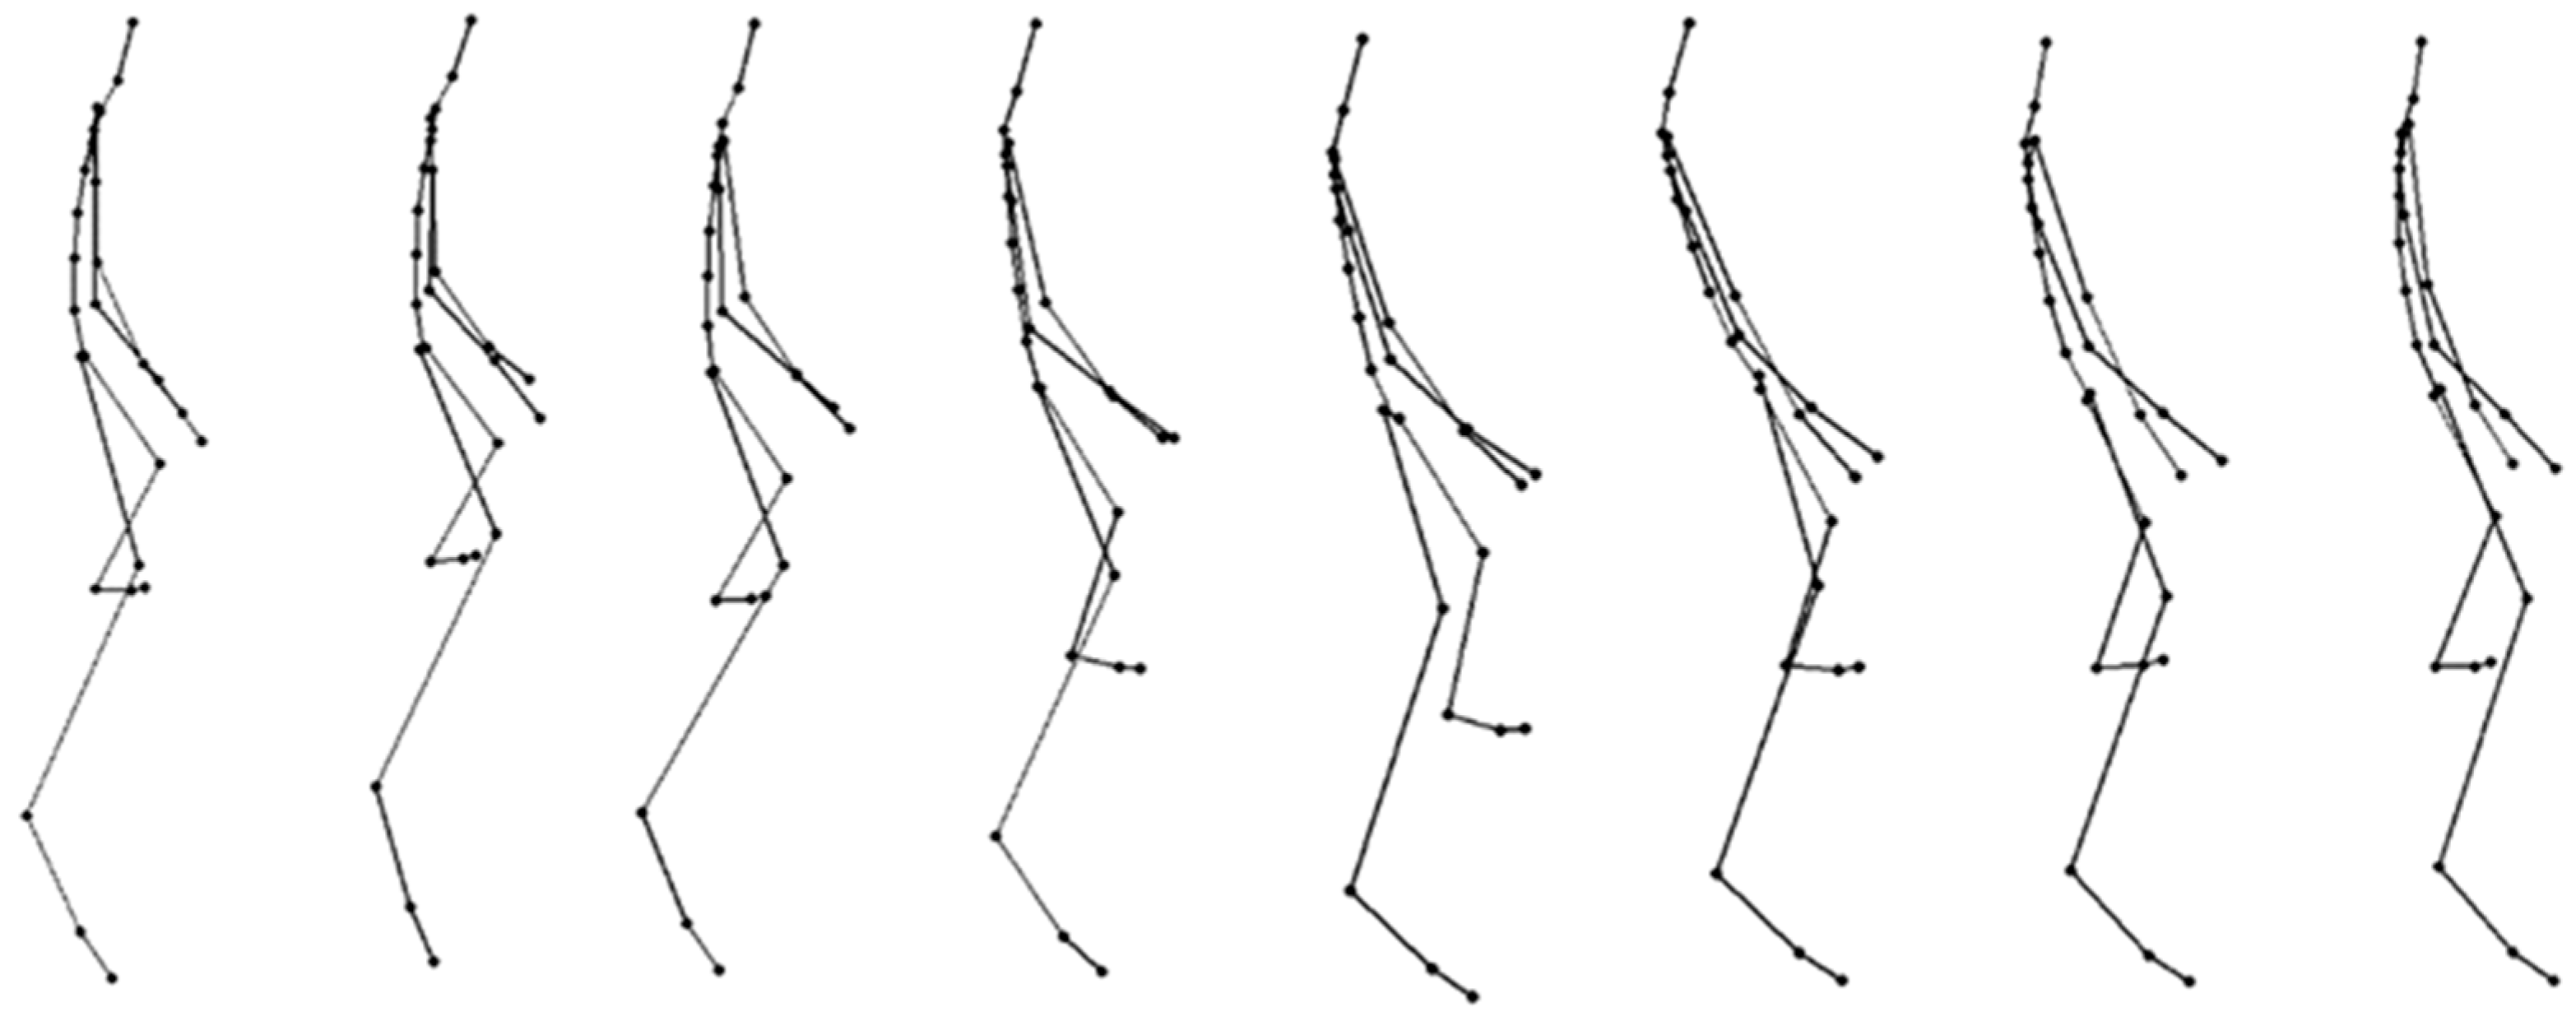
2.2. Method for Analyzing Real Horse Riding Postures
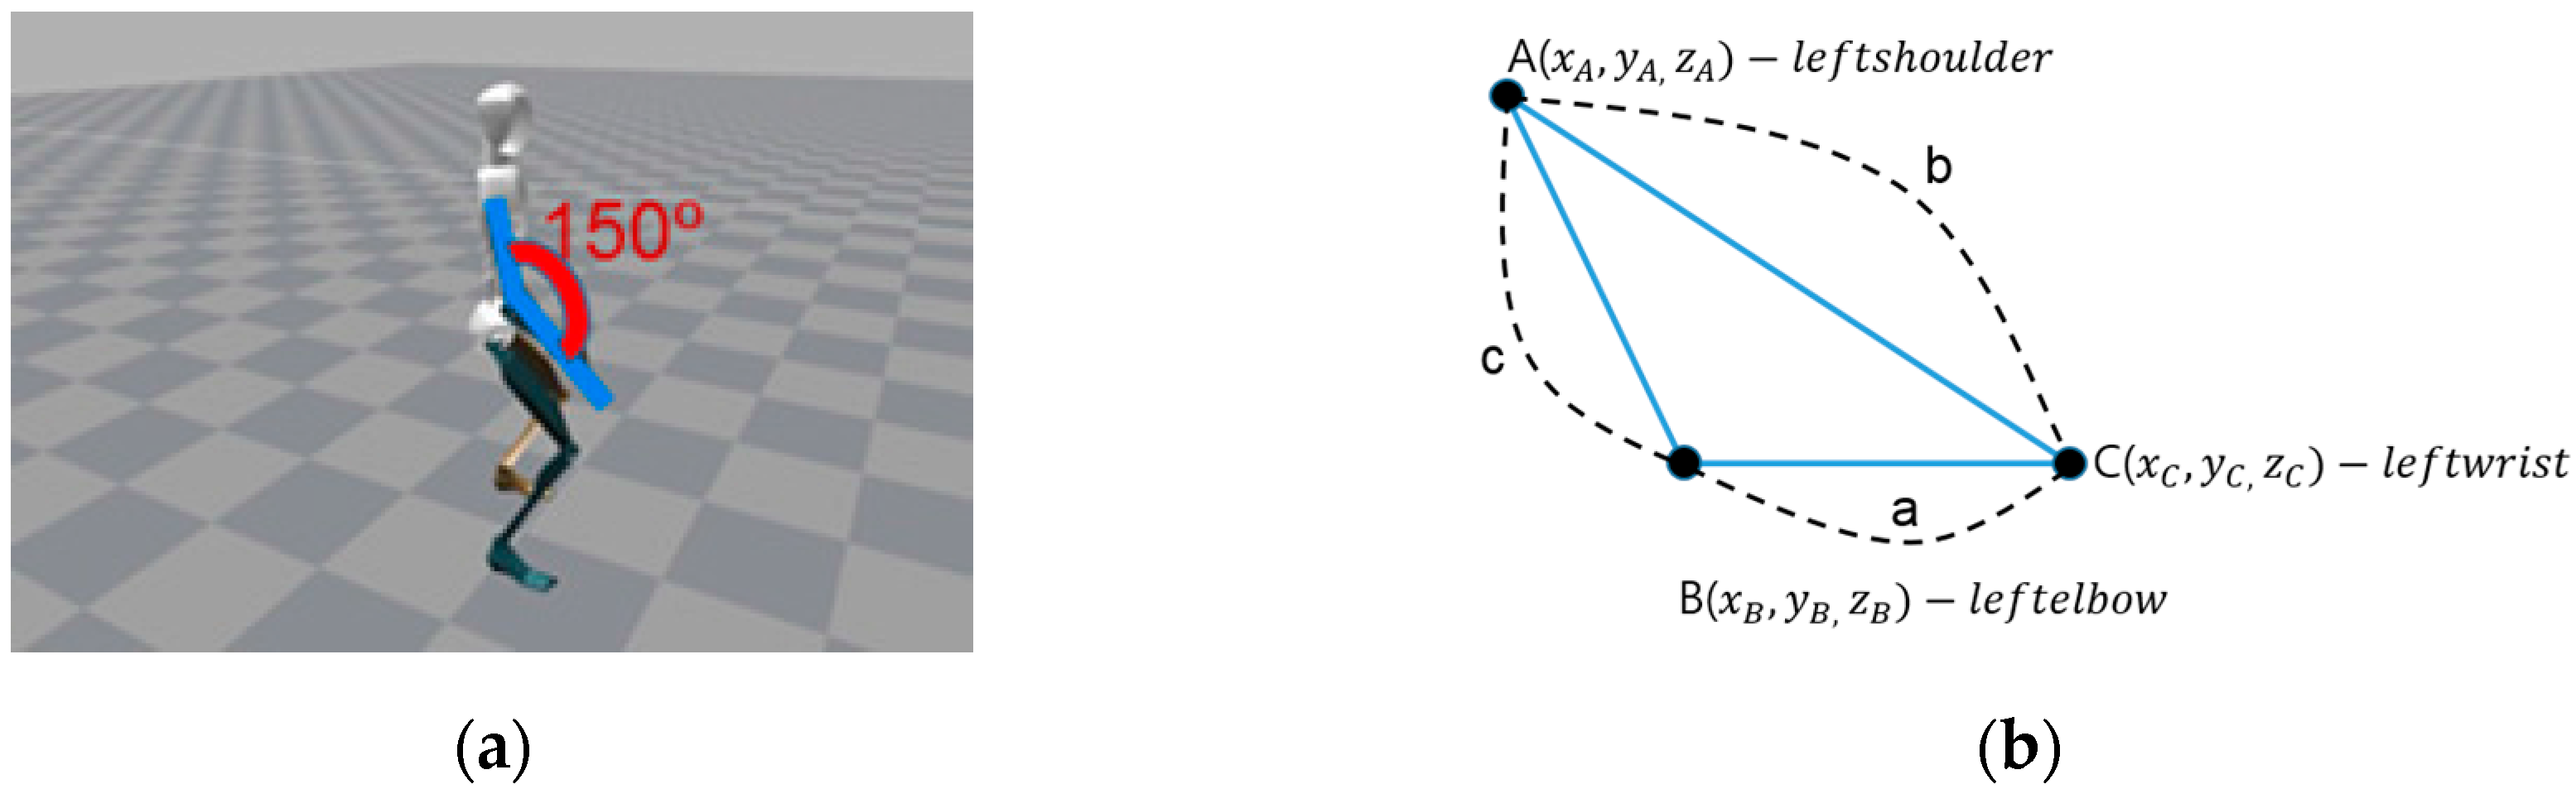
2.2.1. Elbow Angle
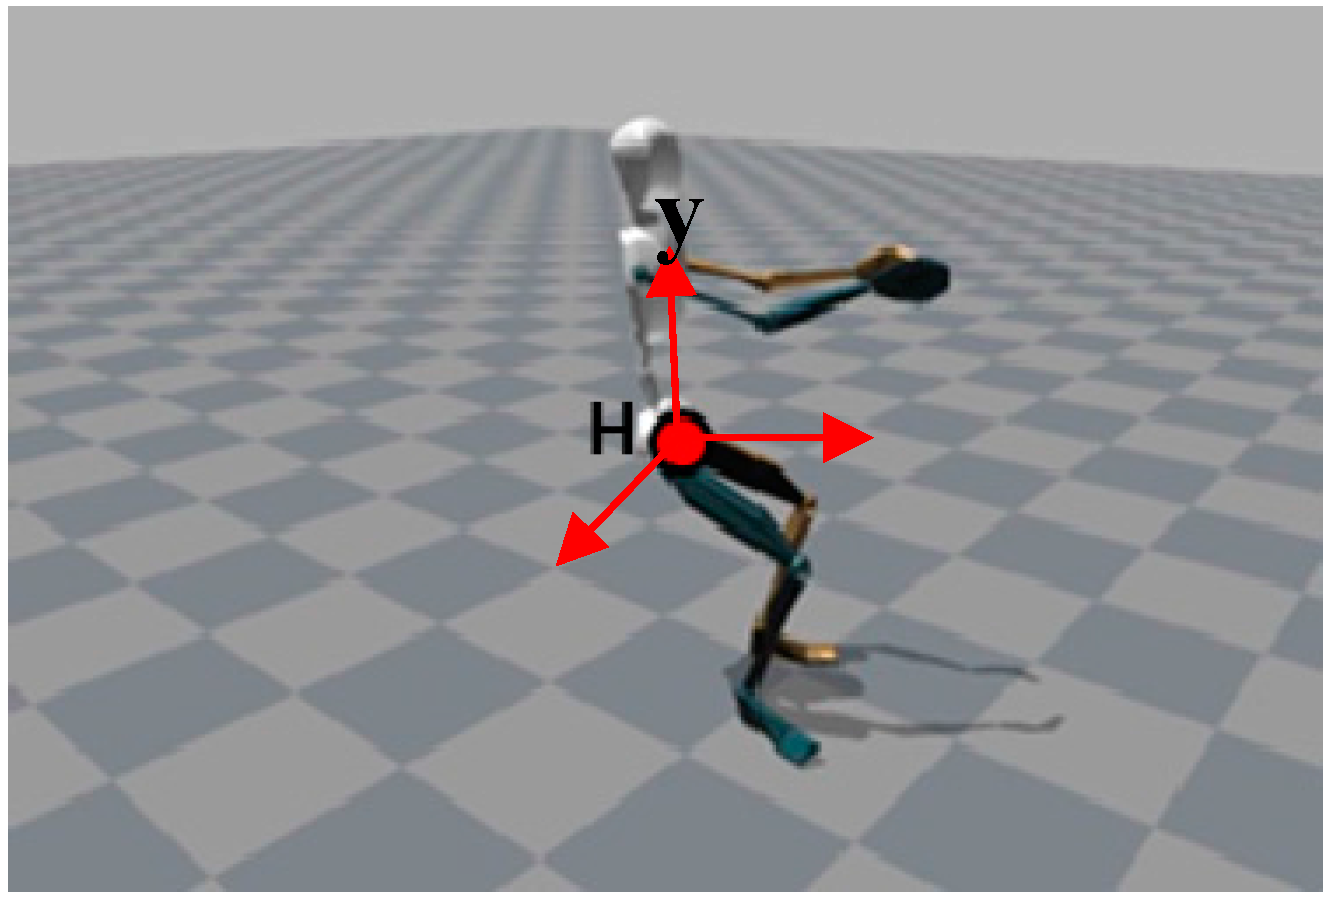
2.2.2. Location
2.3. Horse Simulator and Riding Coaching System
3. Machine Learning Algorithms
3.1. Dimension Reduction Algorithm
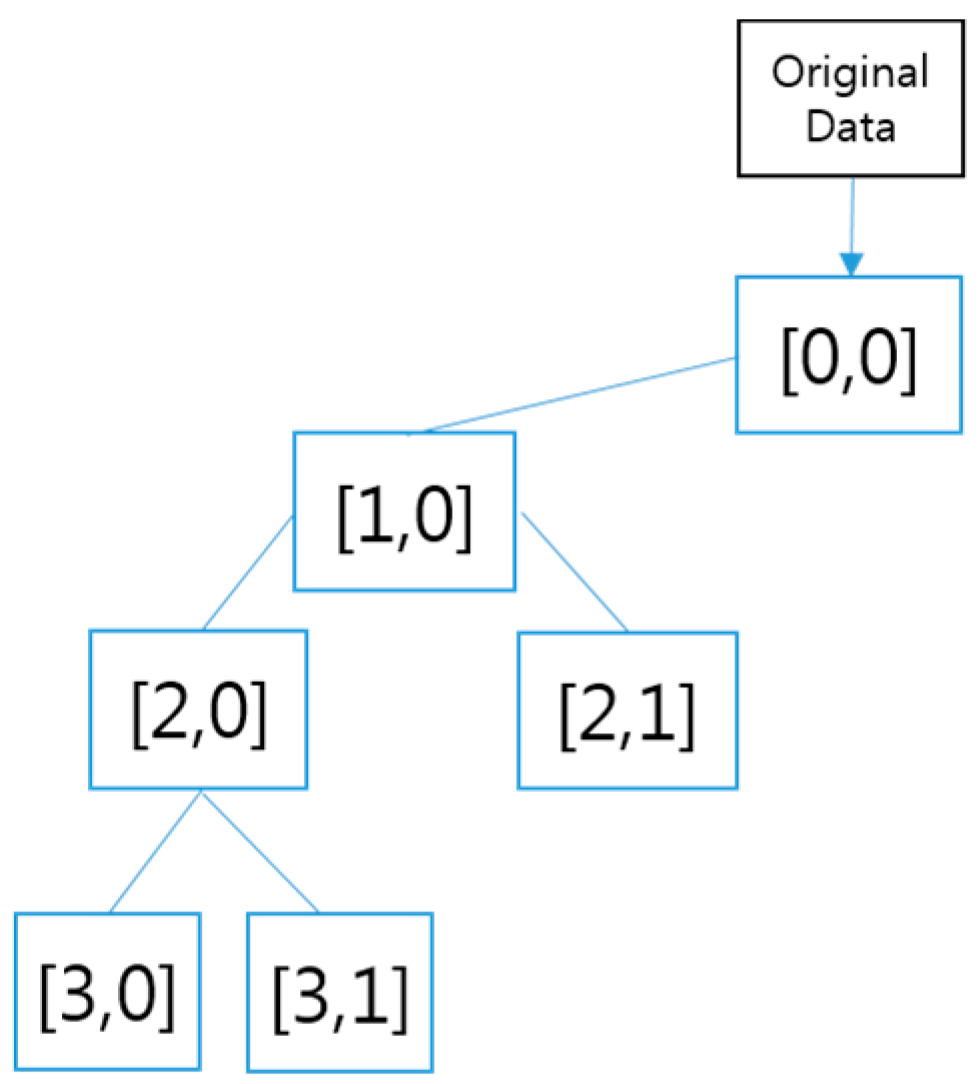
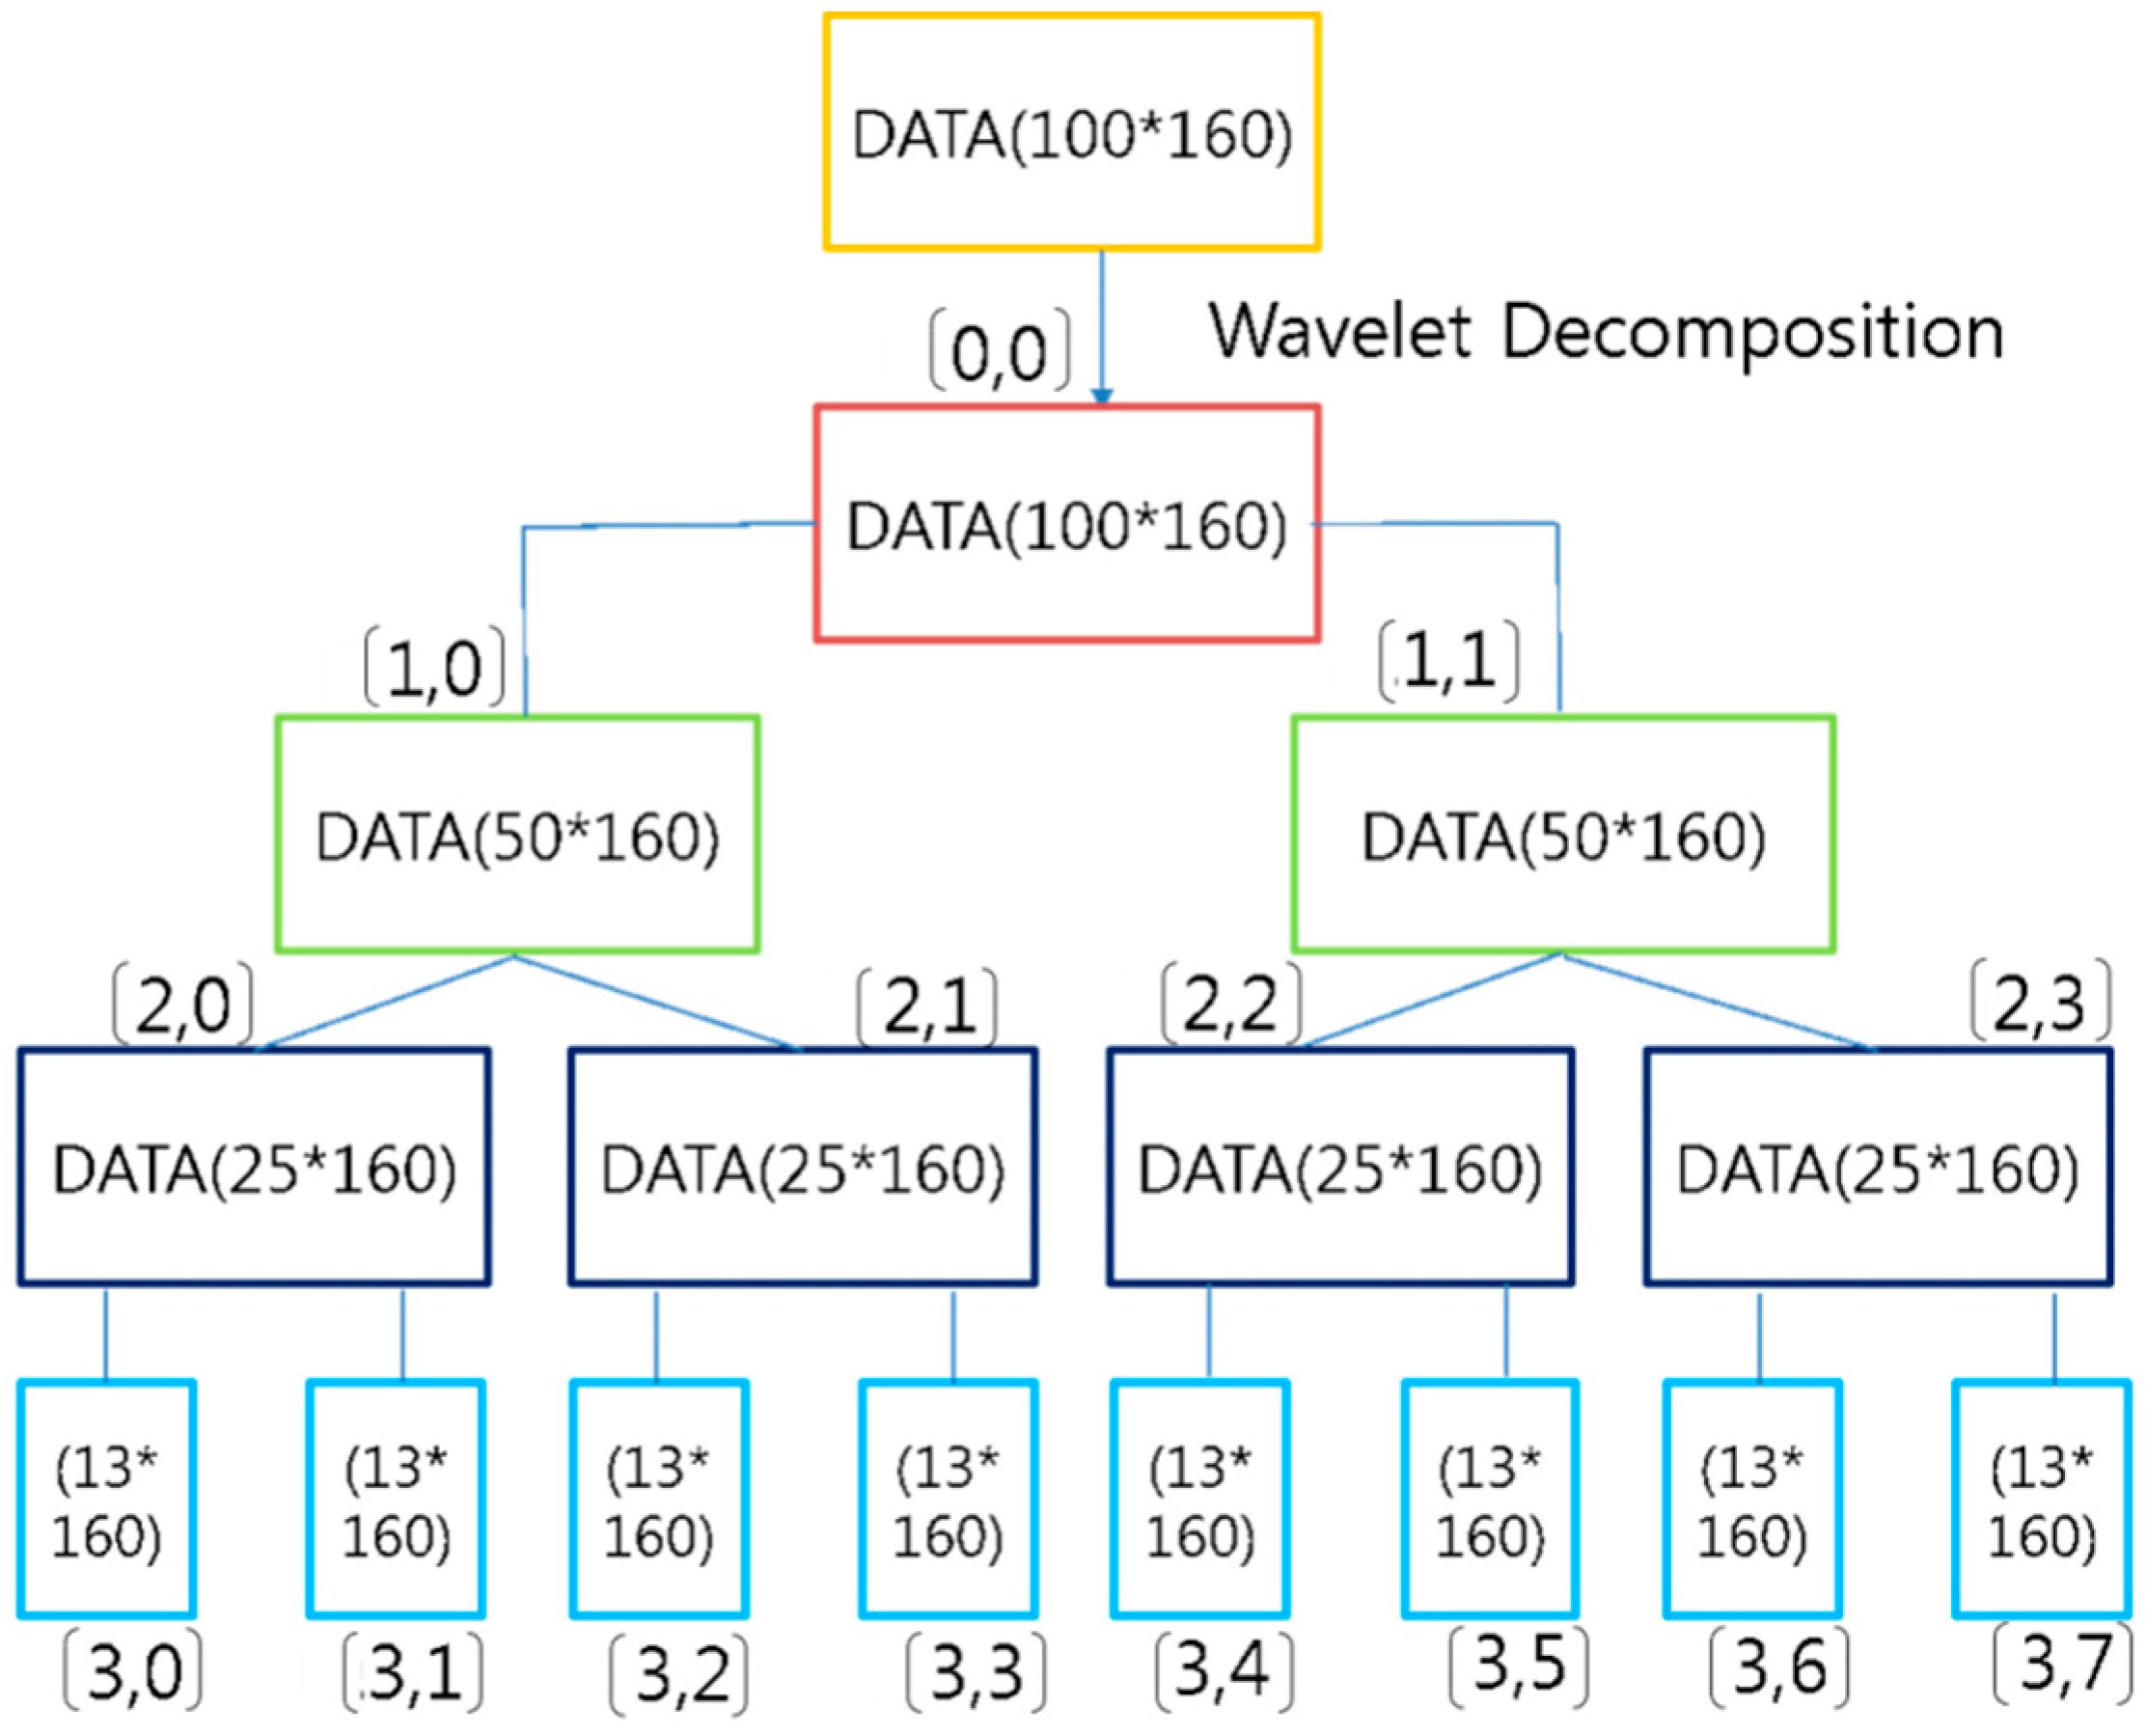
3.1.1. Wavelet
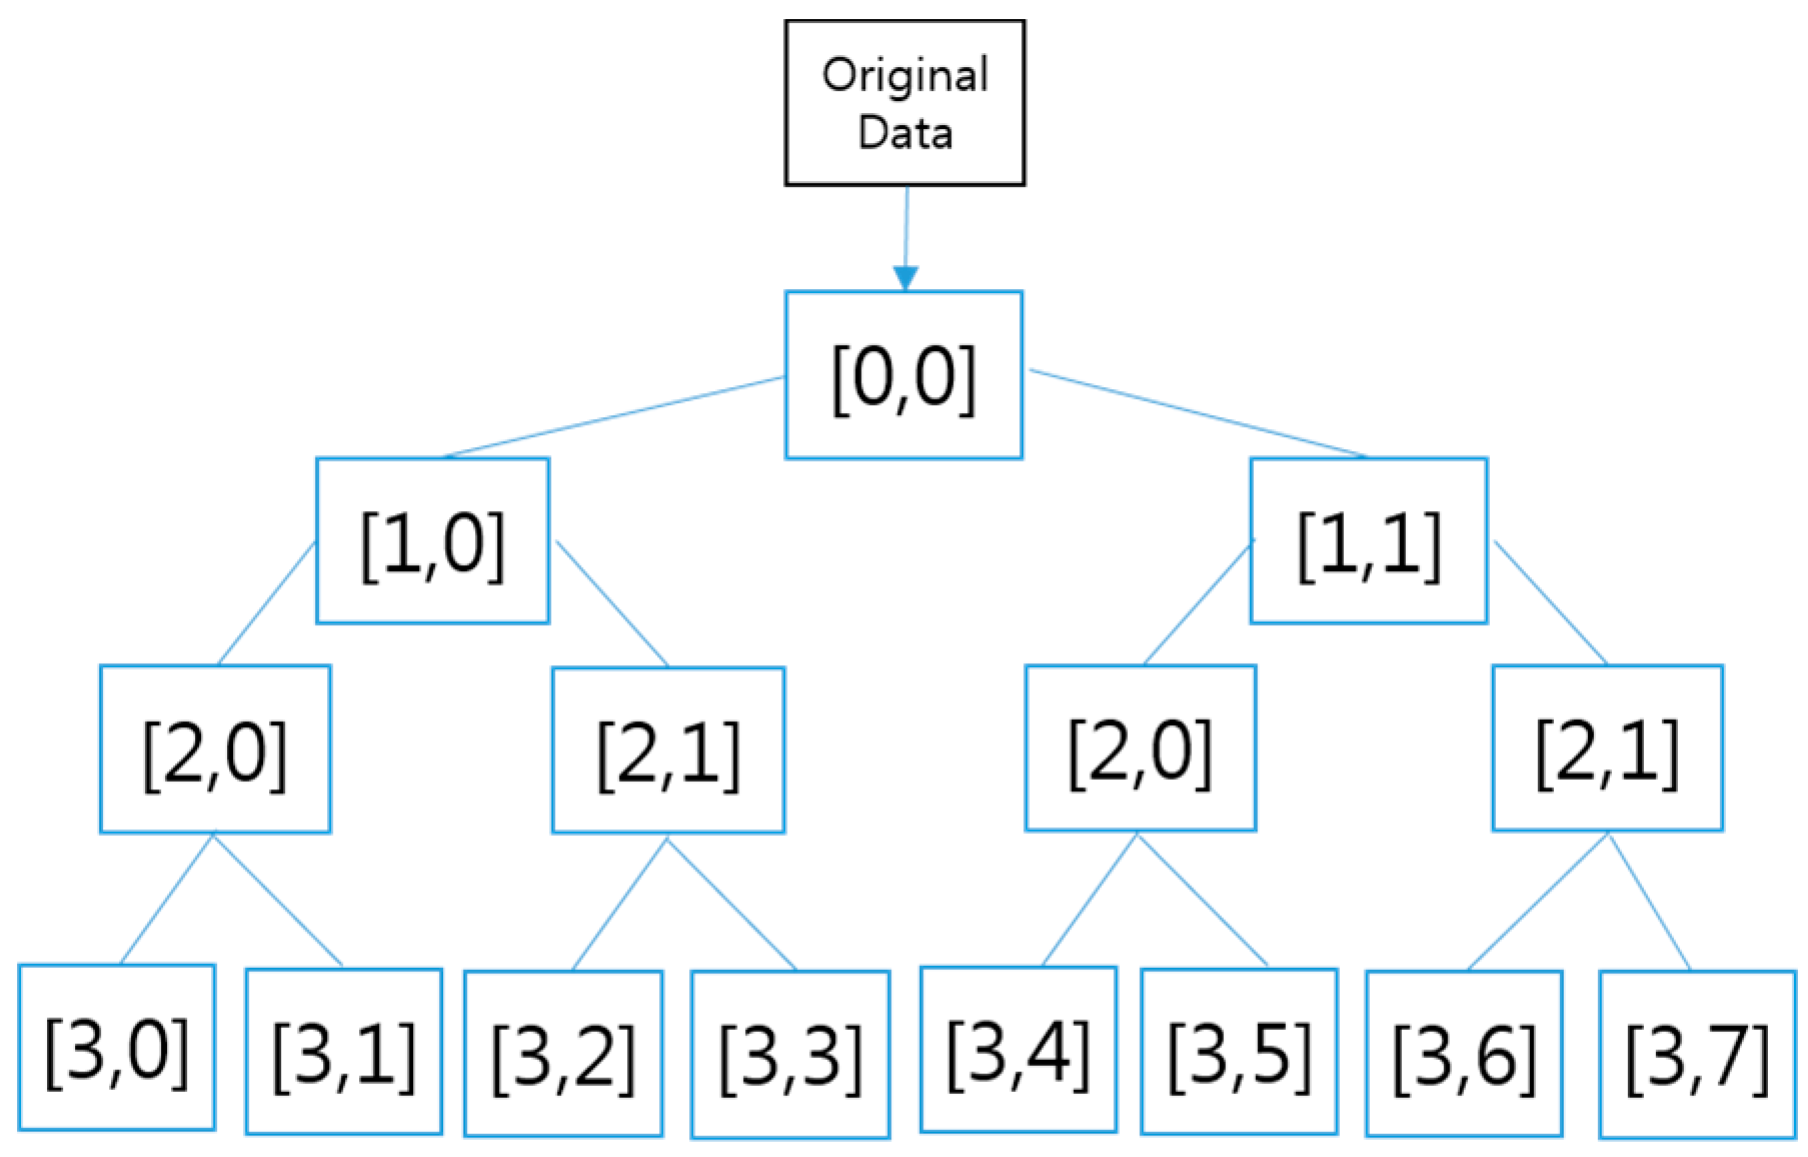
3.1.2. Wavelet vs. Wavelet Packet
3.2. Classifier Algorithms
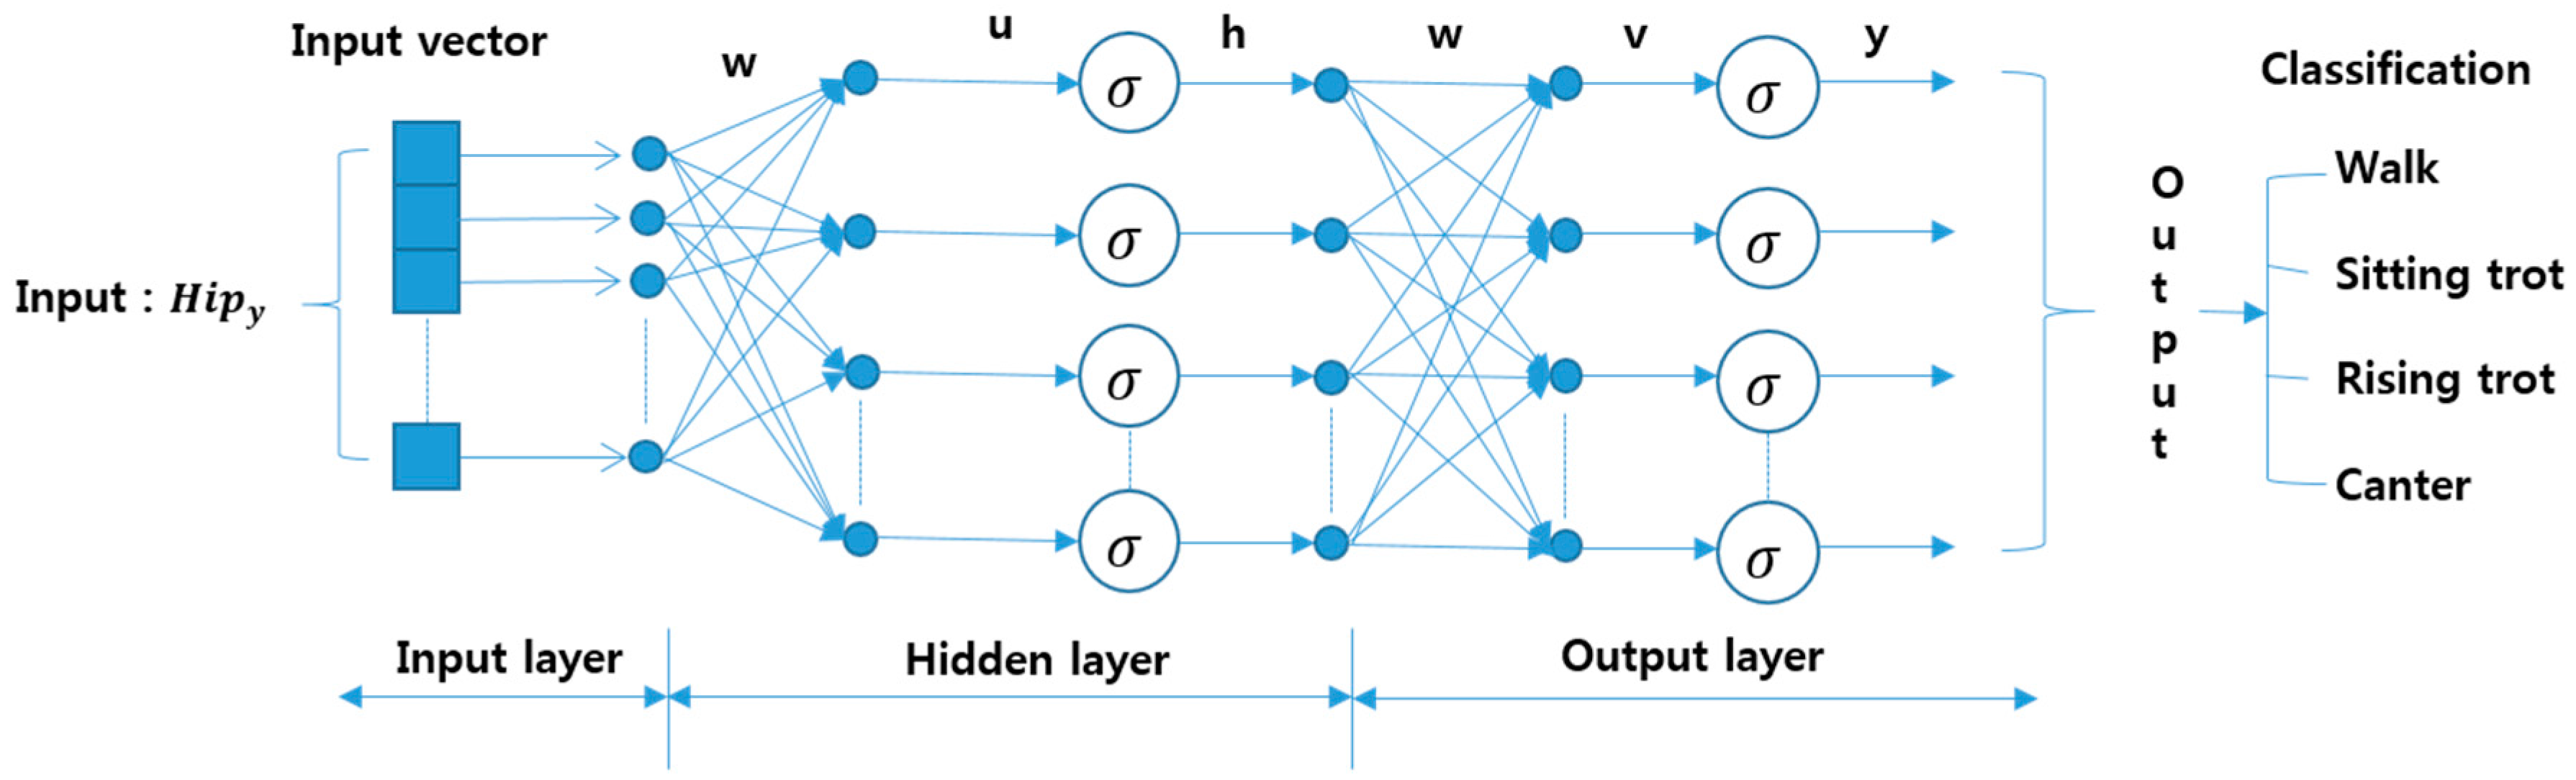
3.2.1. Neural Network Classifier
3.2.2. Naive Bayesian Classifier
3.2.3. Radial Basis Function Network Classifier
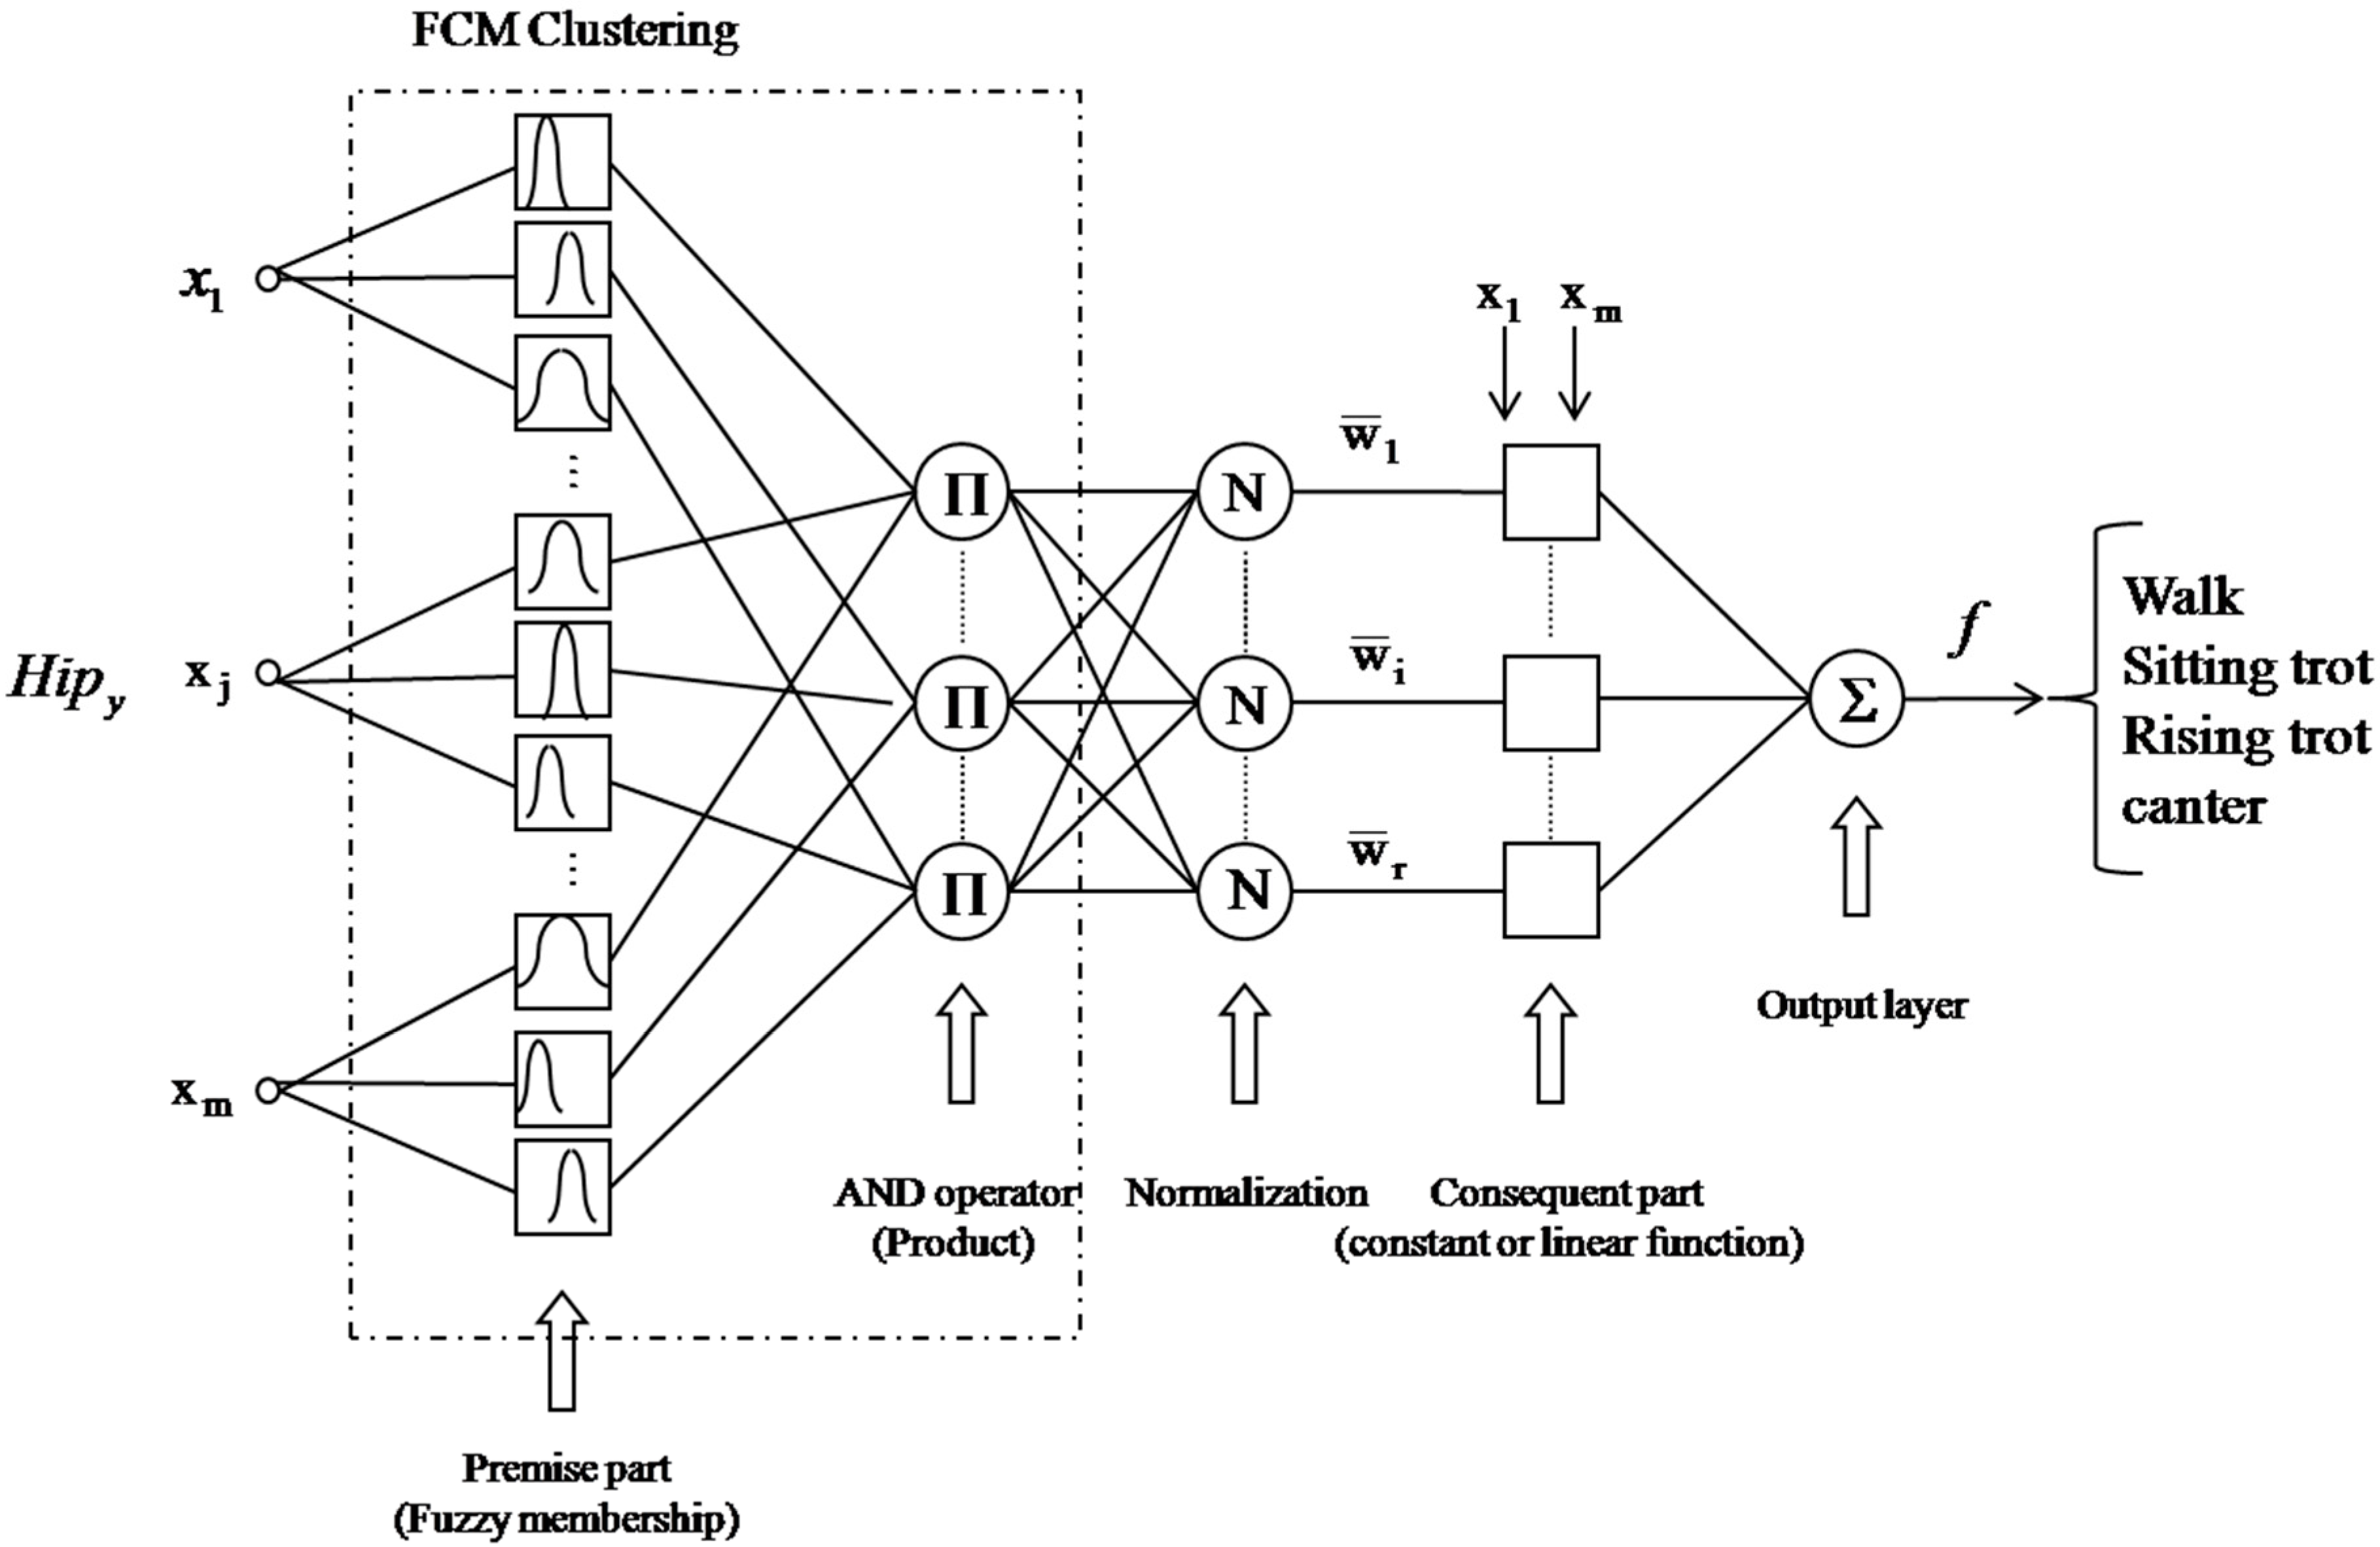
3.2.4. FCM-Based Neuro-Fuzzy Classifier (NFC)
Rule n: If x1 is An and … xm is Bn, and then f is f2
- [Step 1]
- Initialize U = [] matrix,
- [Step 2]
- At k-step : calculate the centers vectors
- [Step 3]
- Update
- [Step 4]
- If , then stop; otherwise, retun to Step 2.
4. Experiment and Results
4.1. Horse Rider’s Motion Database by Riding Gaits
4.1.1. Horse Riding Learning Data and Validation Data
4.1.2. Features Transformed by Wavelet Packet
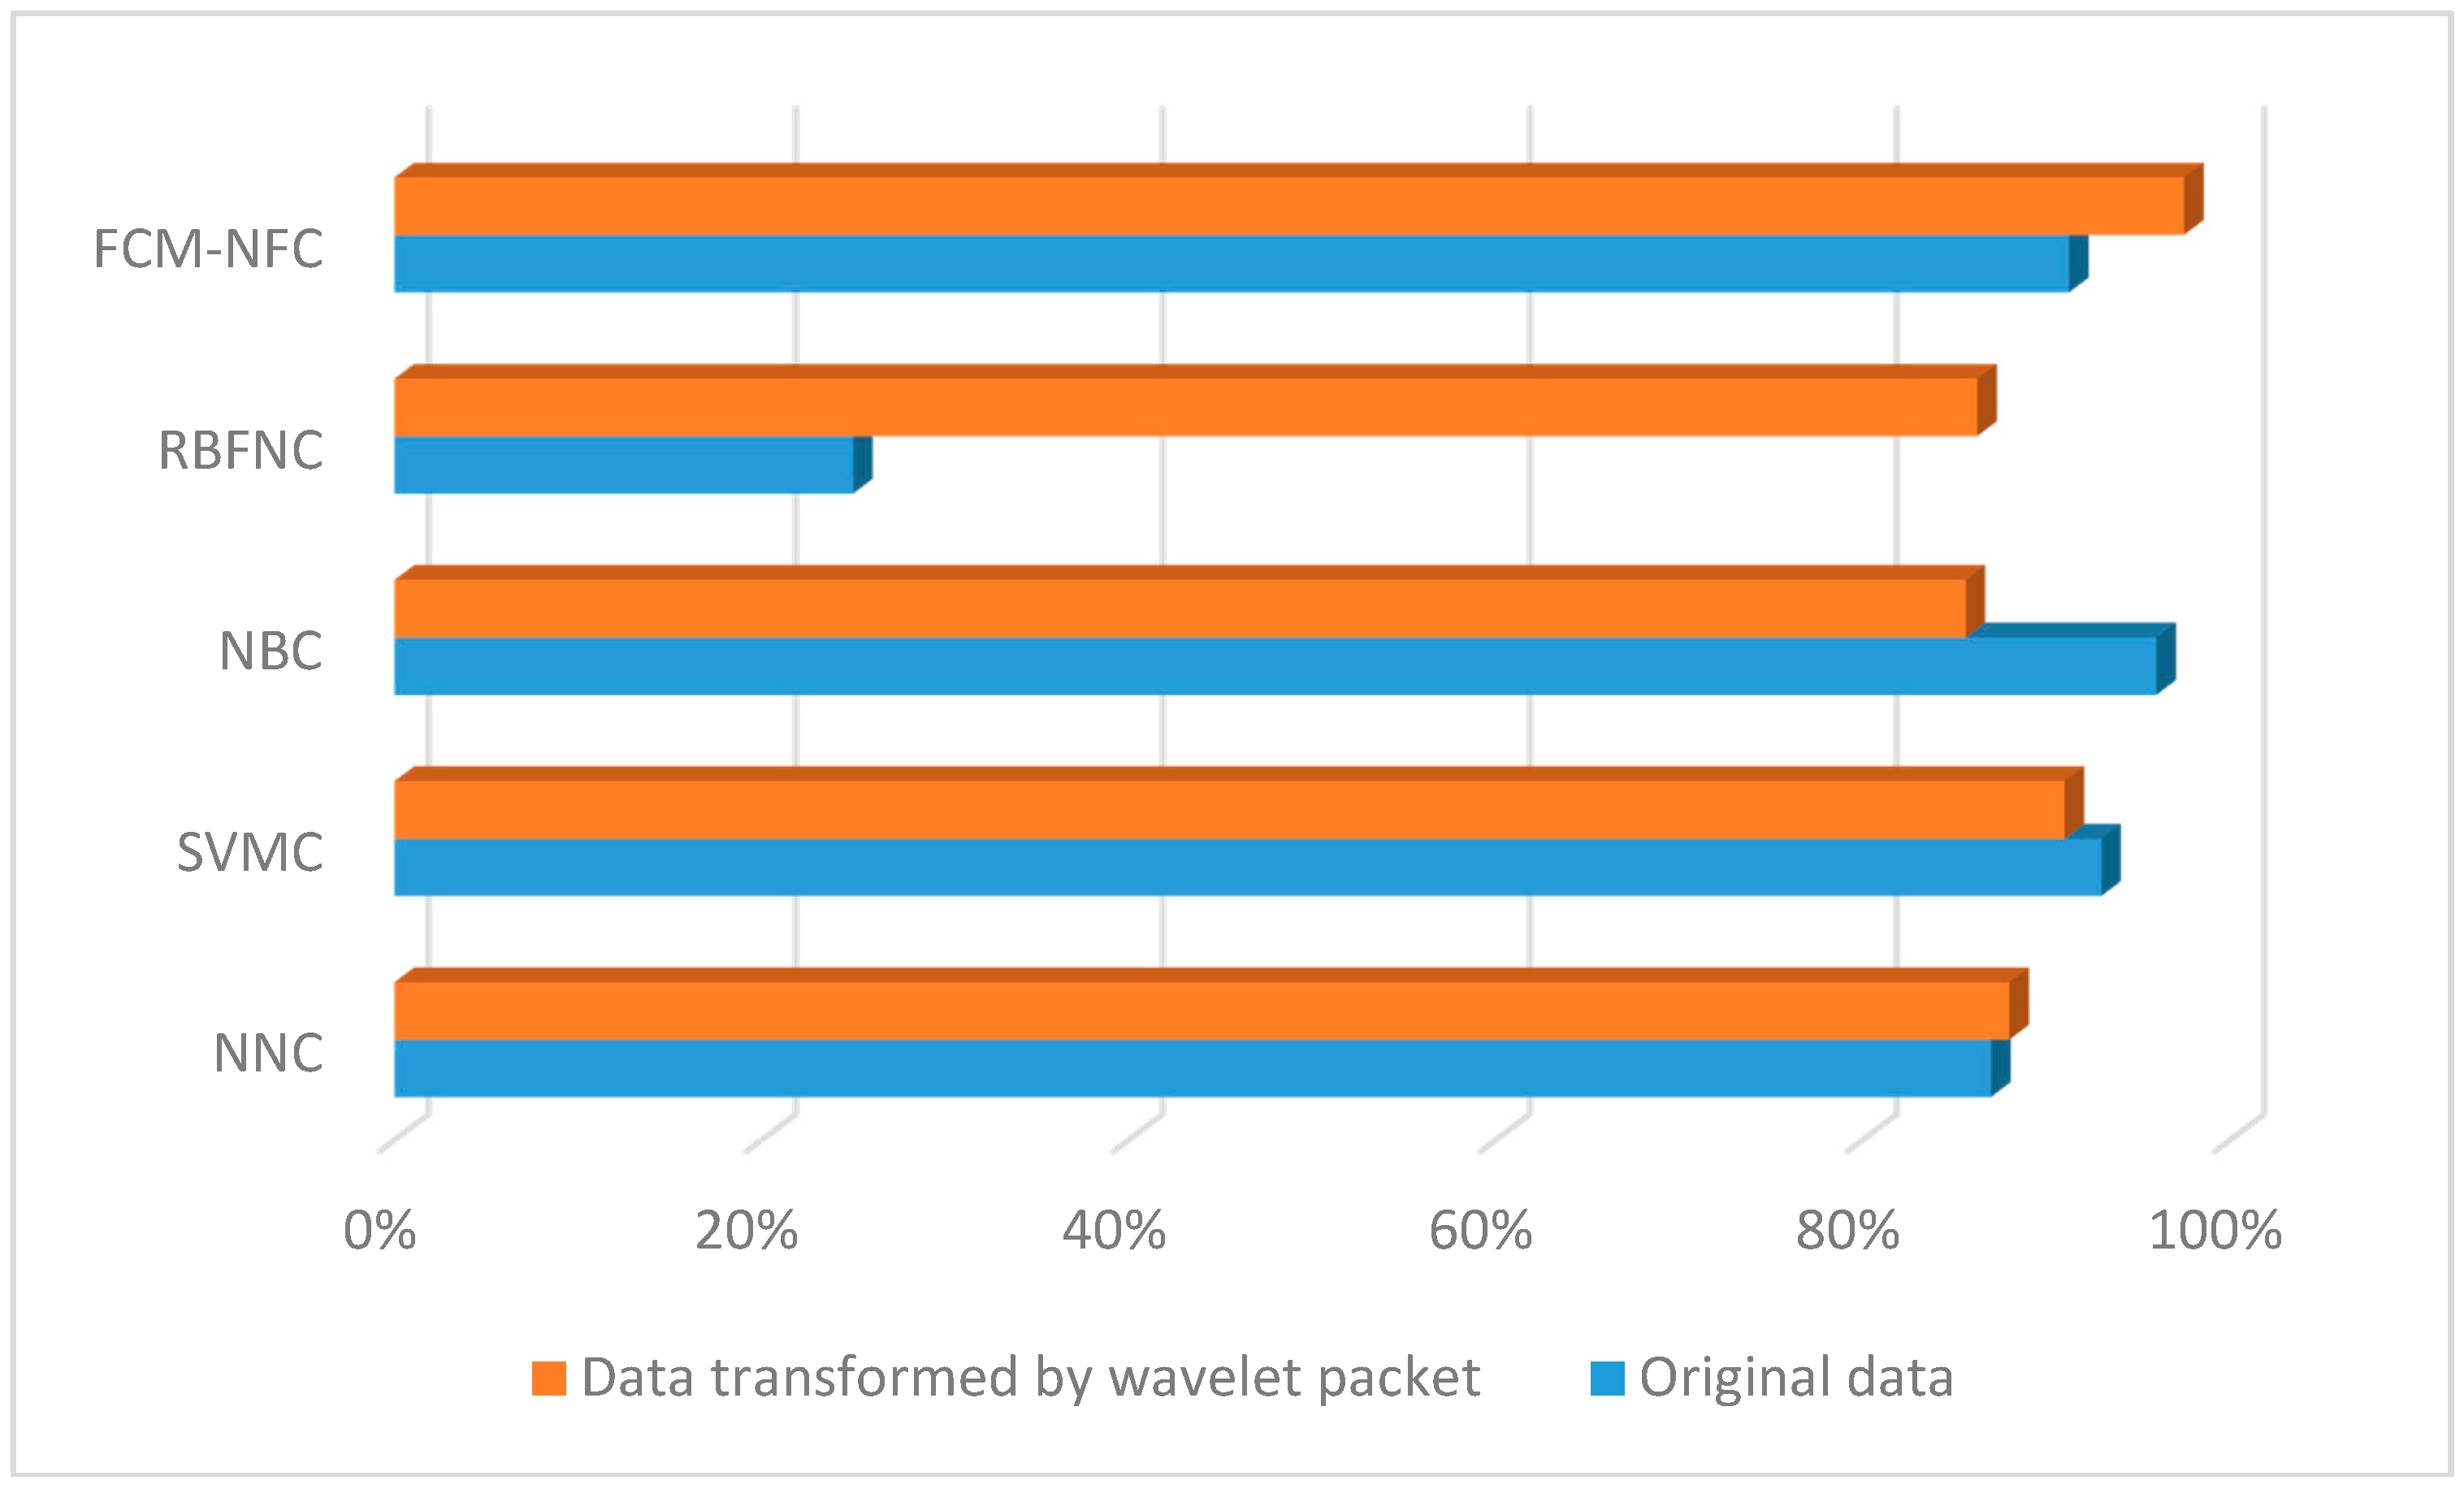
4.2. Experimental Results
5. Conclusions
Acknowledgments
Author Contributions
Conflicts of Interest
References
- Kim, D.H.; Kim, S.J.; Bae, S.S.; Kim, K. The Effect of Indoor Horseback-Riding Machine on the Balance of the Elderly with Dementia. J. Korean Soc. Phys. 2008, 3, 235–246. (In Korean) [Google Scholar]
- Lee, C.W.; Lee, I.S.; Kim, H.S. The Effect of Horse-Riding Exercise on Pain and Body Flexibility for the Patient with Chronic Low Back Pain. J. Korean Soc. Integr. Med. 2013, 1, 67–74. [Google Scholar] [CrossRef]
- Gang, Y.H.; Lee, D.Y.; Choi, D.S.; Yoon, B.K.; Lee, Y.J.; Rhyu, M.R. Effect of Korean Native Cimicifuga Species on Proliferation of Vascular Smooth Muscle Cells. J. Korean Soc. Menopause 2012, 18, 100–105. [Google Scholar]
- Luinge, H.; Veltink, P. Measuring Orientation of Human Body Segments Using Miniature Gyroscopes and Accelerometers. Med. Biol. Eng. Comput. 2005, 43, 273–282. [Google Scholar] [CrossRef] [PubMed]
- Zhou, H.; Stone, T.; Harris, N. Use of Multiple Wearable Inertial Sensors in Upper Limb Motion Tracking. Med. Eng. Phys. 2008, 30, 123–133. [Google Scholar] [CrossRef] [PubMed]
- Lee, J. Sensor fusion and calibration for motion captures using accelerometers. In Proceedings of the 1999 IEEE International Conference on Robotics and Automation, Detroit, MI, USA, 10–15 May 1999; Volume 3, pp. 1954–1959.
- Zhu, R.; Zhou, Z. A Real-Time Articulated Human Motion Tracking Using Tri-Axis Inertial/Magnetic Sensors Package. IEEE Trans. Neural Syst. Rehabil. Eng. 2004, 12, 295–302. [Google Scholar] [CrossRef] [PubMed]
- Venkatraman, S.; Long, J.; Pister, K.; Carmena, J. Wireless Inertial Sensors for Monitoring Animal Behaviour. IEEE Eng. Med. Biol. Soc. Conf. Proc. 2007, 2007, 378–381. [Google Scholar]
- Ghasemzadeh, H.; Loseu, V.; Guenterberg, E.; Jafari, R. Sport training using body sensor networks: A statistical approach to measure wrist rotation for golf swing. In Proceedings of the Fourth International Conference on Body Area Networks, Brussels, Belgium, 1 April 2009; pp. 1–8.
- Mariani, B.; Hoskovec, C.; Rochat, S.; Bula, C.; Penders, J.; Aminian, K. 3D gait assessment in young and elderly subjects using foot-worn inertial sensors. J. Biomech. 2010, 43, 2999–3006. [Google Scholar] [CrossRef] [PubMed]
- Jung, Y.J.; Kang, D.H.; Kim, J.W. Upper Body Motion Tracking With Inertial Sensors. In Proceedings of the 2010 IEEE International Conference on Robotics and Biomimetics (ROBIO), Tianjin, China, 14–18 December 2010; pp. 1746–1751.
- Song, L.J.; Qin, Y.Y. A Practical Calibration Method on MEMS Gyroscope. Piezoelectr. Acoustoopt. 2010, 32, 372–374. [Google Scholar]
- Wei, R.; Tao, Z.; Zhang, H.; Wang, L.; Zhou, Y.; Luan, M.; Liu, H.; Shi, J. A Research on Calibration of Low-Precision MEMS Inertial Sensors. In Proceedings of the 2013 25th Chinese Control and Decision Conference (CCDC), Guiyang, China, 25–27 May 2013; pp. 3243–3247.
- Joris, M.L.; Robert, F.K. Miniature Low-Power Inertial Sensors: Promising Technology for Implantable Motion Capture Systems. IEEE Trans. Neural Syst. Rehabil. Eng. 2014, 22, 1138–1147. [Google Scholar]
- Santana, D.D.; Furukawa, C.M.; Maruyama, N. Sensor Fusion with Low-Grade Inertial Sensors and Odometer to Estimate Geodetic Coordinates in Environments without GPS Signal. IEEE Latin Am. Trans. 2013, 11, 1015–1021. [Google Scholar] [CrossRef]
- Ziegler, T.; Bergner, P.; Hechenblaikner, G.; Brandt, N.; Fichter, W. Modeling and performance of contact-free discharge systems for space inertial sensors. IEEE Trans. Aerosp. Electron. Syst. 2014, 50, 1493–1510. [Google Scholar] [CrossRef]
- Buke, A.; Fang, G.; Wang, Y.; Yang, Z. Healthcare algorithms by wearable inertial sensors: A survey. China Commun. 2015, 12, 1–12. [Google Scholar] [CrossRef]
- Zhao, H.; Wang, Z. Motion Measurement Using Inertial Sensors, Ultrasonic Sensors, and Magnetometers with Extended Kalman Filter for Data Fusion. IEEE Sens. J. 2011, 12, 943–953. [Google Scholar] [CrossRef]
- Barry, R.G. Assessment and Classification of Early-Stage Multiple Sclerosis With Inertial Sensors: Comparison Against Clinical Measures of Disease State. IEEE J. Biomed. Health Inform. 2015, 19, 1356–1361. [Google Scholar]
- Mahomud, E.; James, M. Human Joint Angle Estimation with Inertial Sensors and Validation with A Robot Arm. IEEE Trans. Biomed. Eng. 2015, 62, 1759–1767. [Google Scholar]
- Cao, N.; Young, S.; Dang, K. 3D Dynamics Analysis of a Golf Full Swing by Fusing Inertial Sensor and Vision Data. In Proceedings of the 2013 13th International Conference on Control, Automation and Systems (ICCAS), Gwangju, Korea, 20–23 October 2013; pp. 1300–1303.
- Jung, P.G.; Lim, G.C.; Kong, K.C. A Mobile Motion Capture System Based on Inertial Sensors and Smart Shoes. In Proceedings of the 2013 IEEE International Conference on Robotics and Automation (ICRA), Karlsruhe, Germany, 6–10 May 2013; pp. 692–697.
- Chan, J.; Leung, H.; Tang, J.; Komura, T. A virtual reality dance training system using motion capture technology. IEEE Trans. Learn. Technol. 2011, 4, 187–195. [Google Scholar] [CrossRef]
- Ko, K.L.; Bae, S.B.; Choi, J.S.; Pan, S.B. Implementation of Inertial Sensor based Human Body Motion Capture System for the Self-Coaching. J. Korean Inst. Inf. Tech. 2014, 12, 171–179. (in Korean). [Google Scholar] [CrossRef]
- Lim, S.J. A Development of Golf Coaching using Human Motion Analysis. J. Korea Saf. Manag. Sci. 2013, 15, 55–61. [Google Scholar]
- Ko, K.L.; Chae, S.H.; Bae, S.B.; Choi, J.S.; Pan, S.B. A Study on the 4-Joint Based Motion Capture System for Spinal Disease Prevention. J. Korean Inst. Inf. Tech. 2014, 12, 157–165. (In Korean) [Google Scholar] [CrossRef]
- Cheng, L.; Hailes, S. Analysis of Wireless Inertial Sensing for Athlete Coaching Support. In Proceedings of the IEEE Global Telecommunications Conference (IEEE GLOBECOM 2008), New Orleans, LO, USA, 30 November–4 December 2008; pp. 1–5.
- Connaghan, D.; Kelly, P.; O’Connor, N.; Gaffney, M.; Walsh, M.; O’Mathuna, C. Multi-Sensor Classification of tennis strokes. In Proceedings of the 2011 IEEE Sensors, Limerick, Ireland, 28–31 October 2011; pp. 1437–1440.
- Burchfield, R.; Venkatesan, S. A Framework for Golf Training Using Low-Cost Inertial Sensors. In Proceedings of the 2010 International Conference on Body Sensor Networks, Singapore, 7–9 June 2010; pp. 267–272.
- Lee, M.W.; Kwak, K.C. 3D Motion Analysis of National Rider Athletes by Riding Types in Horse Simulator. In Proceedings of the 2013 Third International Conference on Innovative Computing Technology (INTECH), London, UK, 29–31 August 2013; pp. 12–16.
- Costa, F.B. Boundary Wavelet Coefficients for Real-Time Detection of Transients Induced by Faults and Power-Quality Disturbances. IEEE Trans. Power Deliv. 2014, 29, 2674–2687. [Google Scholar] [CrossRef]
- Quellec, G.; Lamard, M.; Cazuguel, G.; Cochener, B.; Roux, C. Fast Wavelet-Based Image Characterization for Highly Adaptive Image Retrieval. IEEE Trans. Image Process. 2011, 21, 1613–1623. [Google Scholar] [CrossRef] [PubMed]
- Lin, C.; Yang, Y.C.; Wang, J.; Yang, Y. A Wearable Sensor Module With a Neural-Network Based Activity Classification Algorithm for Daily Energy Expenditure Estimation. IEEE Trans. Inf. Technol. Biomed. 2012, 16, 991–998. [Google Scholar] [PubMed]
- Wang, D.; Leung, H.; Kurian, A.P.; Kim, H.K.; Yoon, H.S. A Deconvolutive Neural Network for Speech Classification with Applications to Home Service Robot. IEEE Trans. Instrum. Meas. 2010, 59, 3237–3243. [Google Scholar] [CrossRef]
- Domingos, P.; Pazzani, M. On the optimality of the simple Bayesian classifier under zero-one loss. Mach. Learn. Res. 1997, 29, 103–130. [Google Scholar] [CrossRef]
- Ling, C.; Zhang, H. The representational power of discrete Bayesian networks. Mach. Learn. Res. 2002, 3, 709–721. [Google Scholar]
- Kim, N.Y. Step-size control for width adaptation in radial basis function networks for nonlinear channel equalization. J. Commun. Netw. 2010, 12, 600–604. [Google Scholar] [CrossRef]
- Jang, R. ANFIS: Adaptive-Network-Based Fuzzy Inference System. IEEE Trans. Syst. 1993, 23, 665–685. [Google Scholar] [CrossRef]


| Walk | Sitting Trot | Rising Trot | Canter | Total | |
|---|---|---|---|---|---|
| Training data | 100 × 20 | 100 × 20 | 100 × 20 | 100 × 20 | 100 × 80 |
| Test data | 100 × 20 | 100 × 20 | 100 × 20 | 100 × 20 | 100 × 80 |
| Total | 100 × 40 | 100 × 40 | 100 × 40 | 100 × 40 | 100 × 160 |
| Walk | Sitting Trot | Rising Trot | Canter | Total | |
|---|---|---|---|---|---|
| Training data | 25 × 20 | 25 × 20 | 25 × 20 | 25 × 20 | 25 × 80 |
| Testing data | 25 × 20 | 25 × 20 | 25 × 20 | 25 × 20 | 25 × 80 |
| Total | 25 × 40 | 25 × 40 | 25 × 40 | 25 × 40 | 25 × 160 |
| NNC | SVM | NBC | RBFNC | FCM-NFC | |
|---|---|---|---|---|---|
| Original data | 87% | 93% | 96% | 25% | 91.25% |
| Transformed data by WP | 88% | 91% | 85.62% | 86.25% | 97.5% |
| NNC | NBC | RBFNC | FCM-NFC | |
|---|---|---|---|---|
| Original Data | 2.8 | 0.03 | 28.26 | 0.8 |
| Data transformed by WP | 2.5 | 0.028 | 5.13 | 0.61 |
© 2016 by the authors; licensee MDPI, Basel, Switzerland. This article is an open access article distributed under the terms and conditions of the Creative Commons Attribution (CC-BY) license (http://creativecommons.org/licenses/by/4.0/).
Share and Cite
Lee, J.-N.; Lee, M.-W.; Byeon, Y.-H.; Lee, W.-S.; Kwak, K.-C. Classification of Horse Gaits Using FCM-Based Neuro-Fuzzy Classifier from the Transformed Data Information of Inertial Sensor. Sensors 2016, 16, 664. https://doi.org/10.3390/s16050664
Lee J-N, Lee M-W, Byeon Y-H, Lee W-S, Kwak K-C. Classification of Horse Gaits Using FCM-Based Neuro-Fuzzy Classifier from the Transformed Data Information of Inertial Sensor. Sensors. 2016; 16(5):664. https://doi.org/10.3390/s16050664
Chicago/Turabian StyleLee, Jae-Neung, Myung-Won Lee, Yeong-Hyeon Byeon, Won-Sik Lee, and Keun-Chang Kwak. 2016. "Classification of Horse Gaits Using FCM-Based Neuro-Fuzzy Classifier from the Transformed Data Information of Inertial Sensor" Sensors 16, no. 5: 664. https://doi.org/10.3390/s16050664
APA StyleLee, J.-N., Lee, M.-W., Byeon, Y.-H., Lee, W.-S., & Kwak, K.-C. (2016). Classification of Horse Gaits Using FCM-Based Neuro-Fuzzy Classifier from the Transformed Data Information of Inertial Sensor. Sensors, 16(5), 664. https://doi.org/10.3390/s16050664