
Numerical Simulation of Output Response of PVDF Sensor Attached on a Cantilever Beam Subjected to Impact Loading

Abstract
:
1. Introduction
2. Theoretical Background
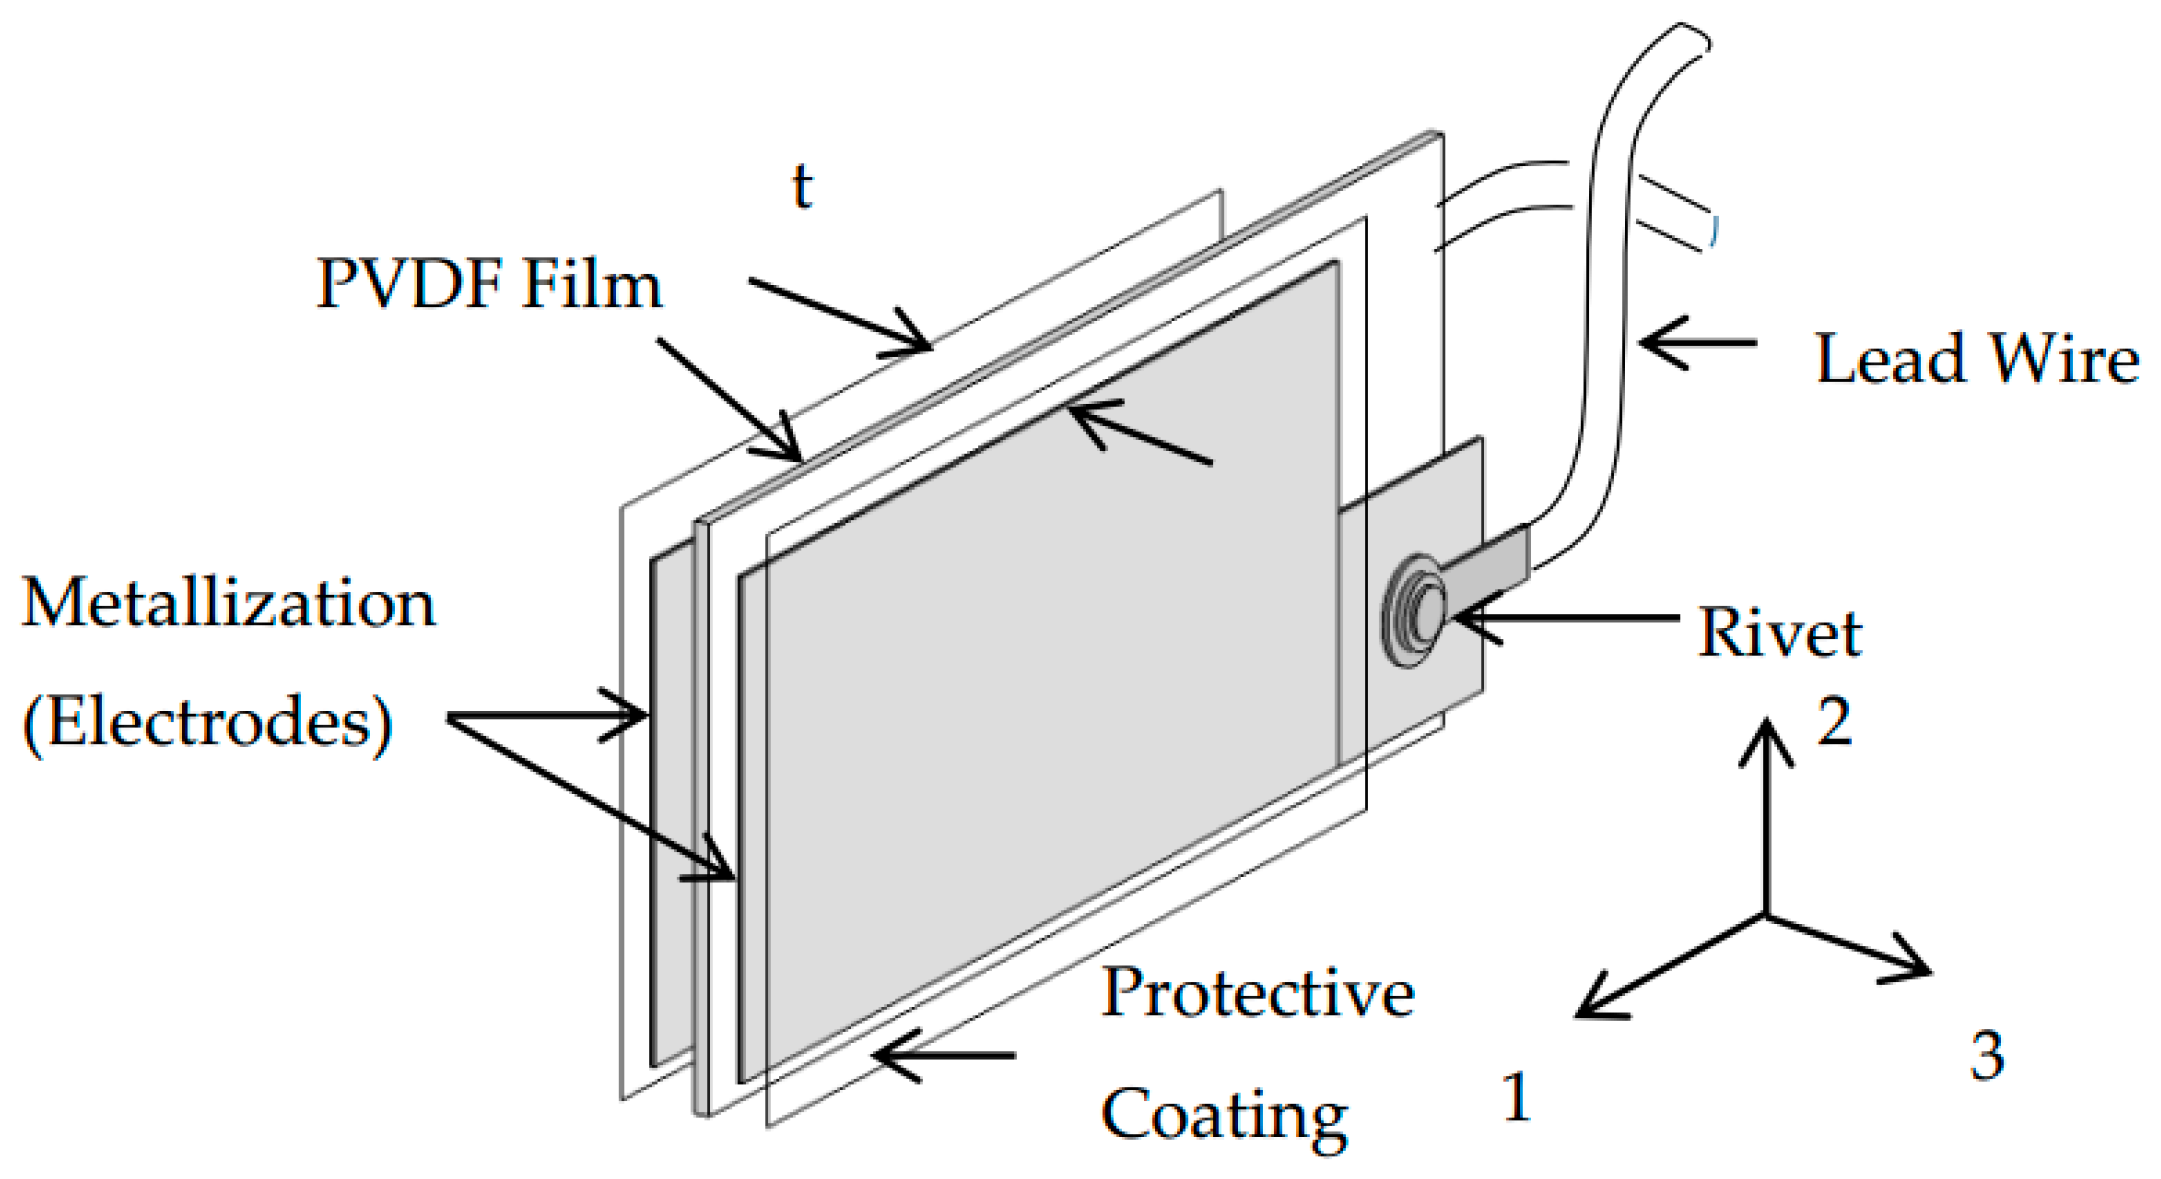
2.1. Governing Equation for Piezoelectricity
2.2. Governing Mechanical Equation
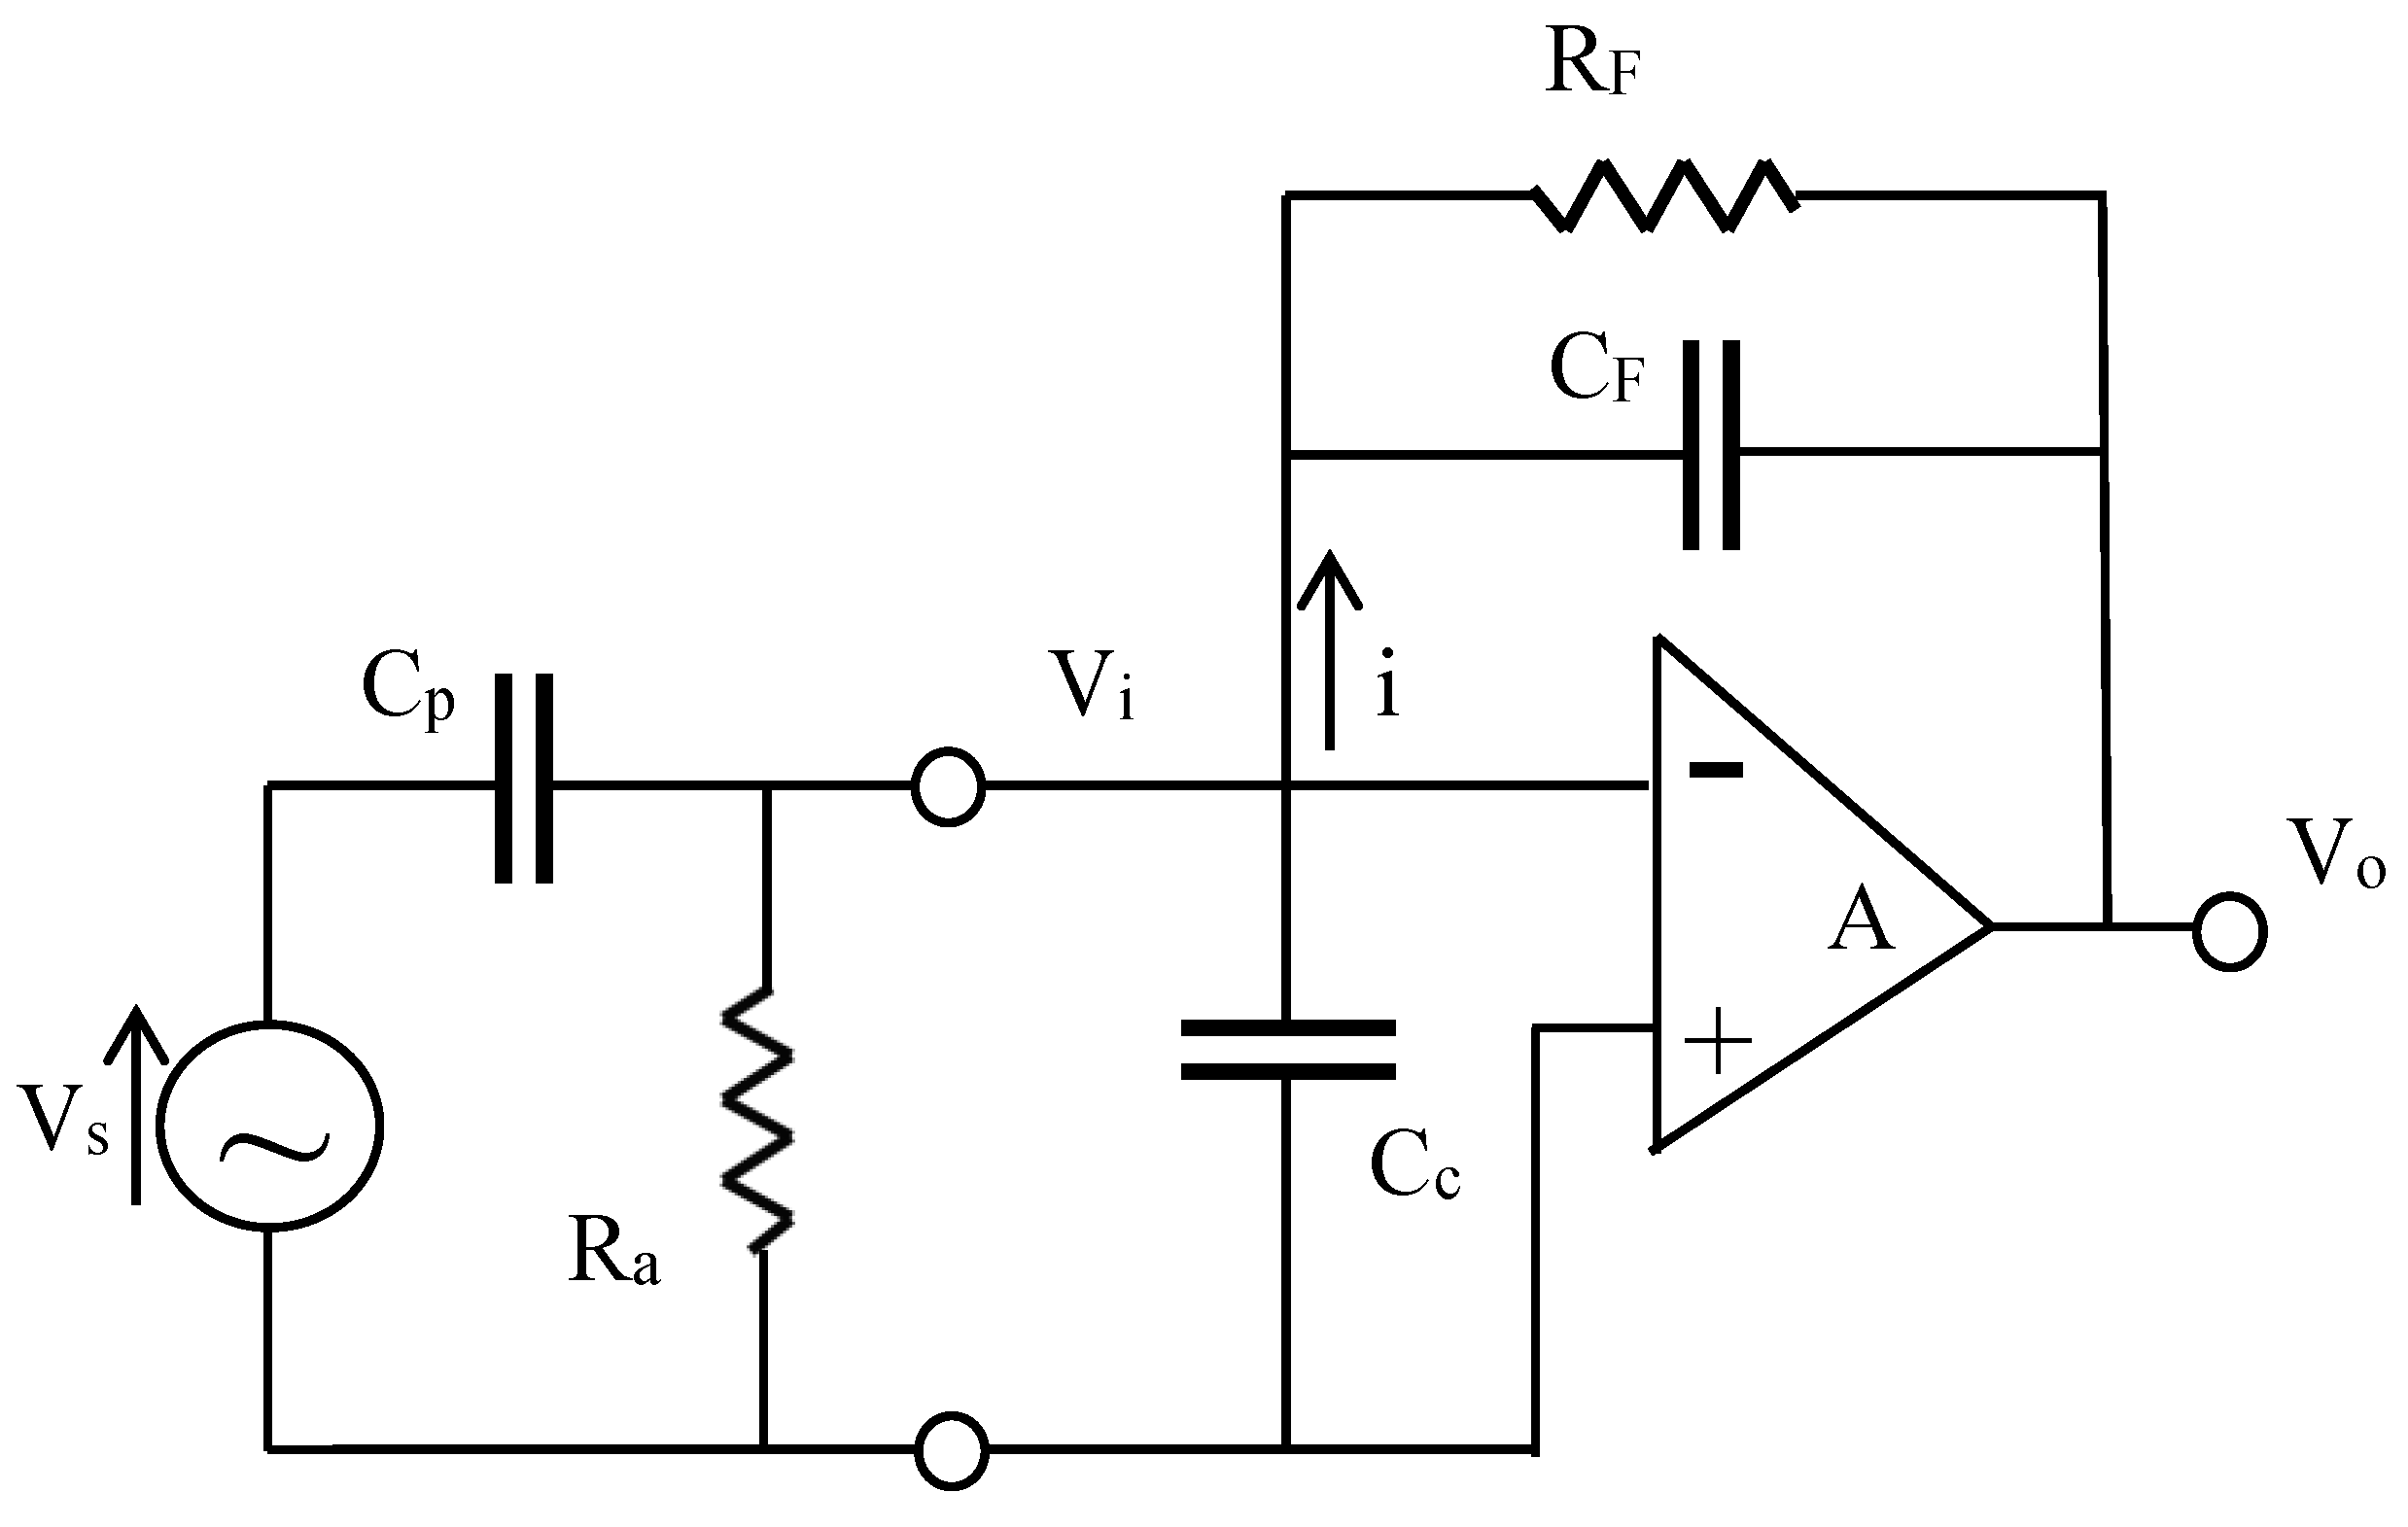
2.3. Governing Electrical Equation
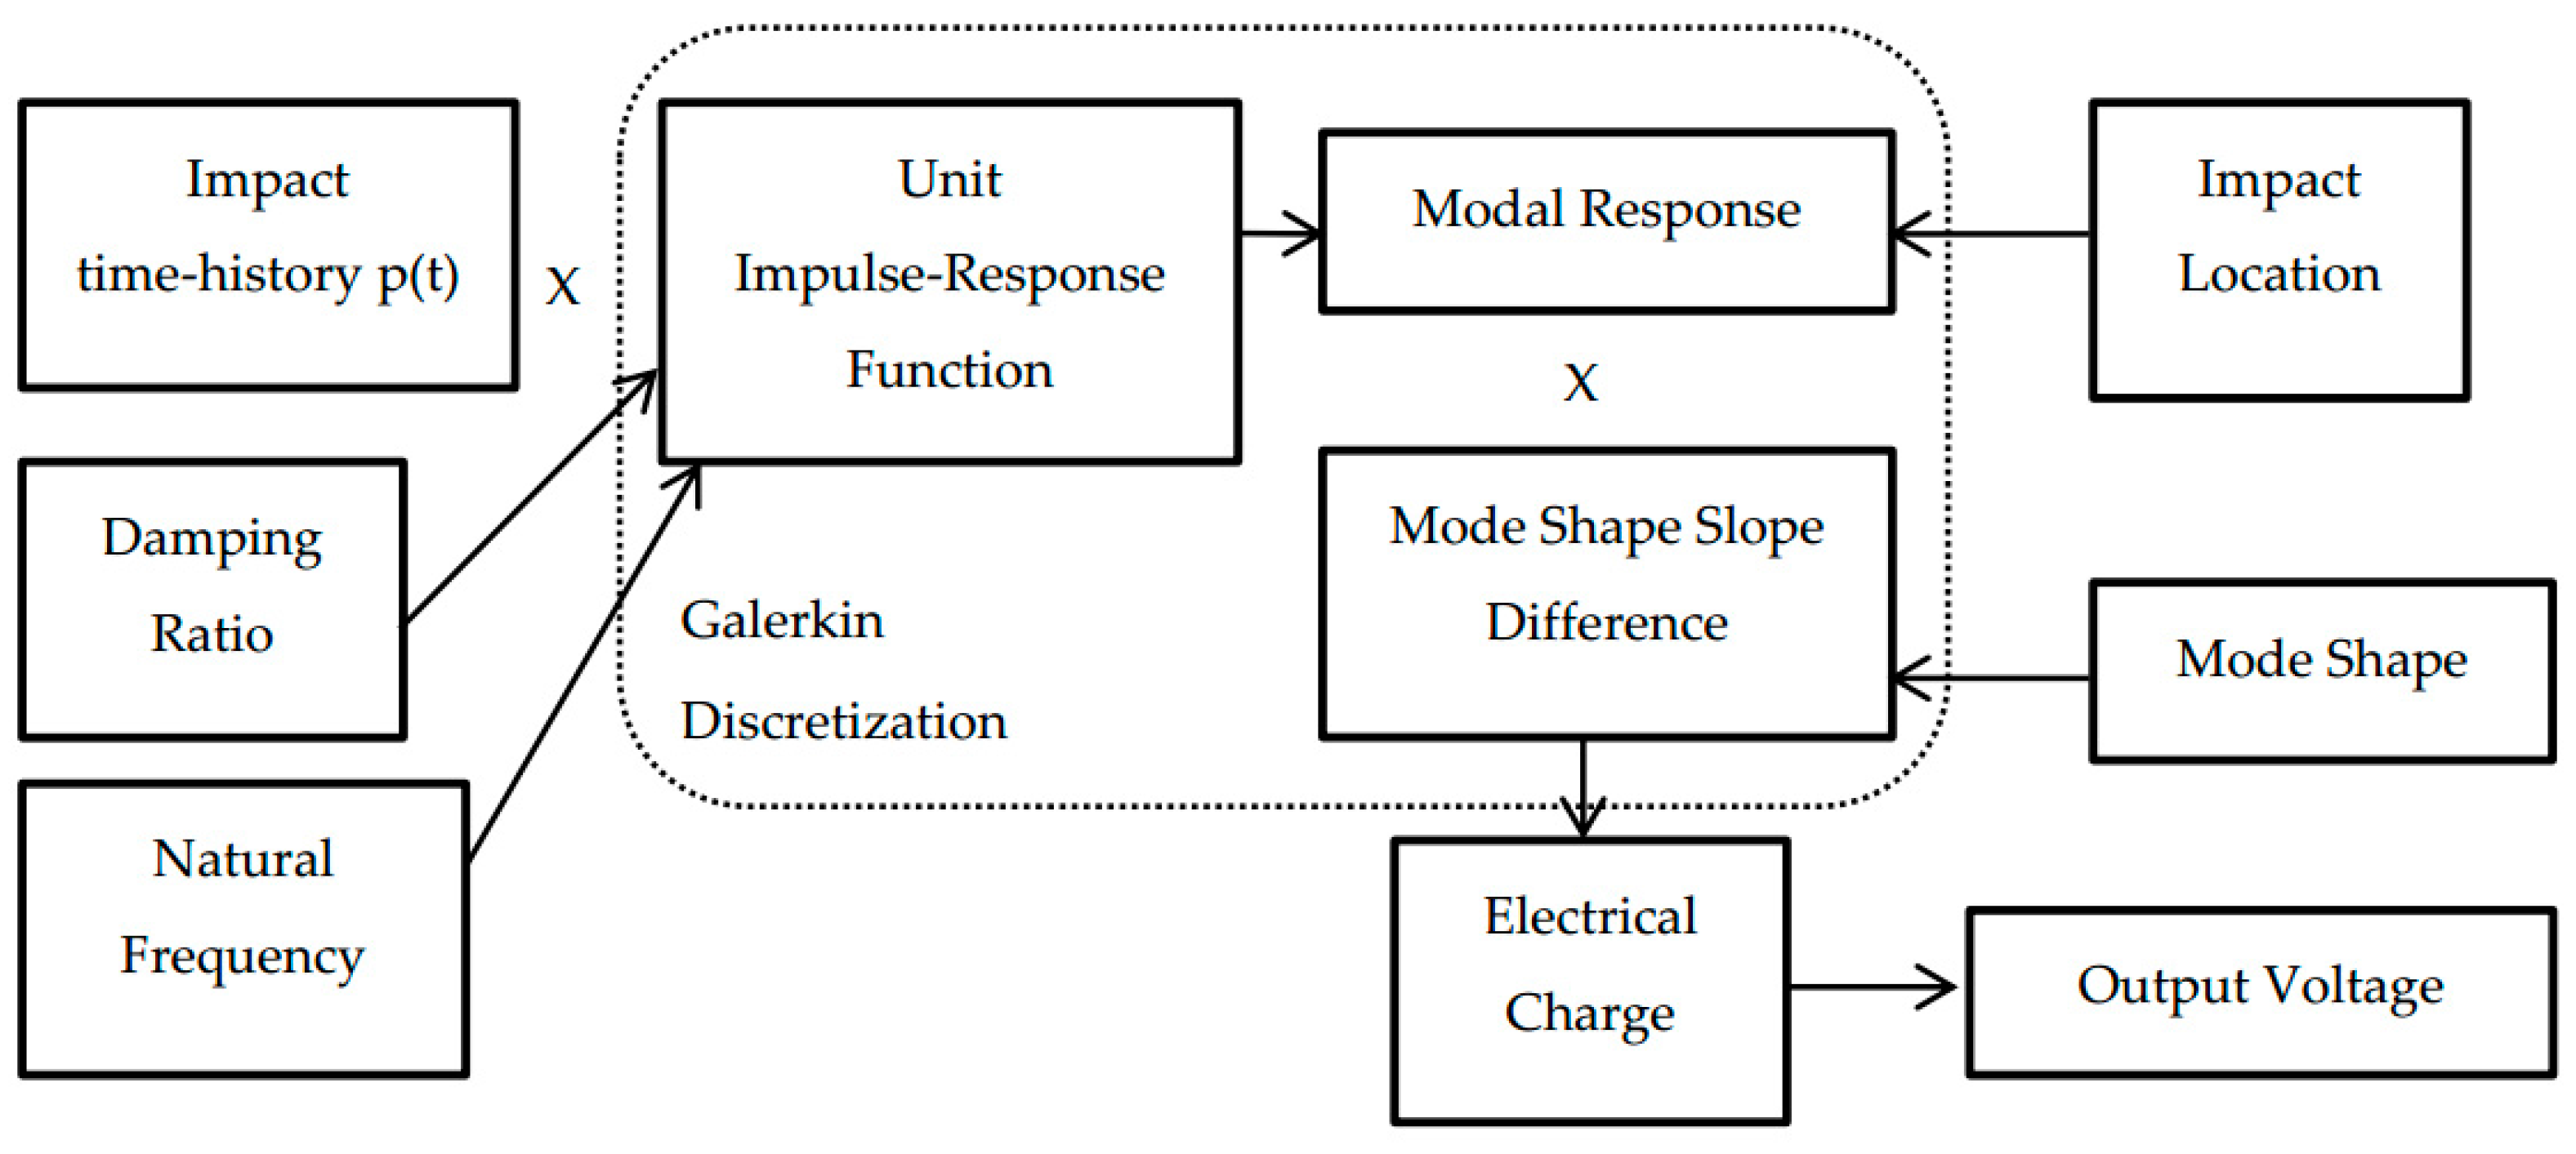
3. Numerical Simulation of PVDF Sensor’s Response to Impact Force
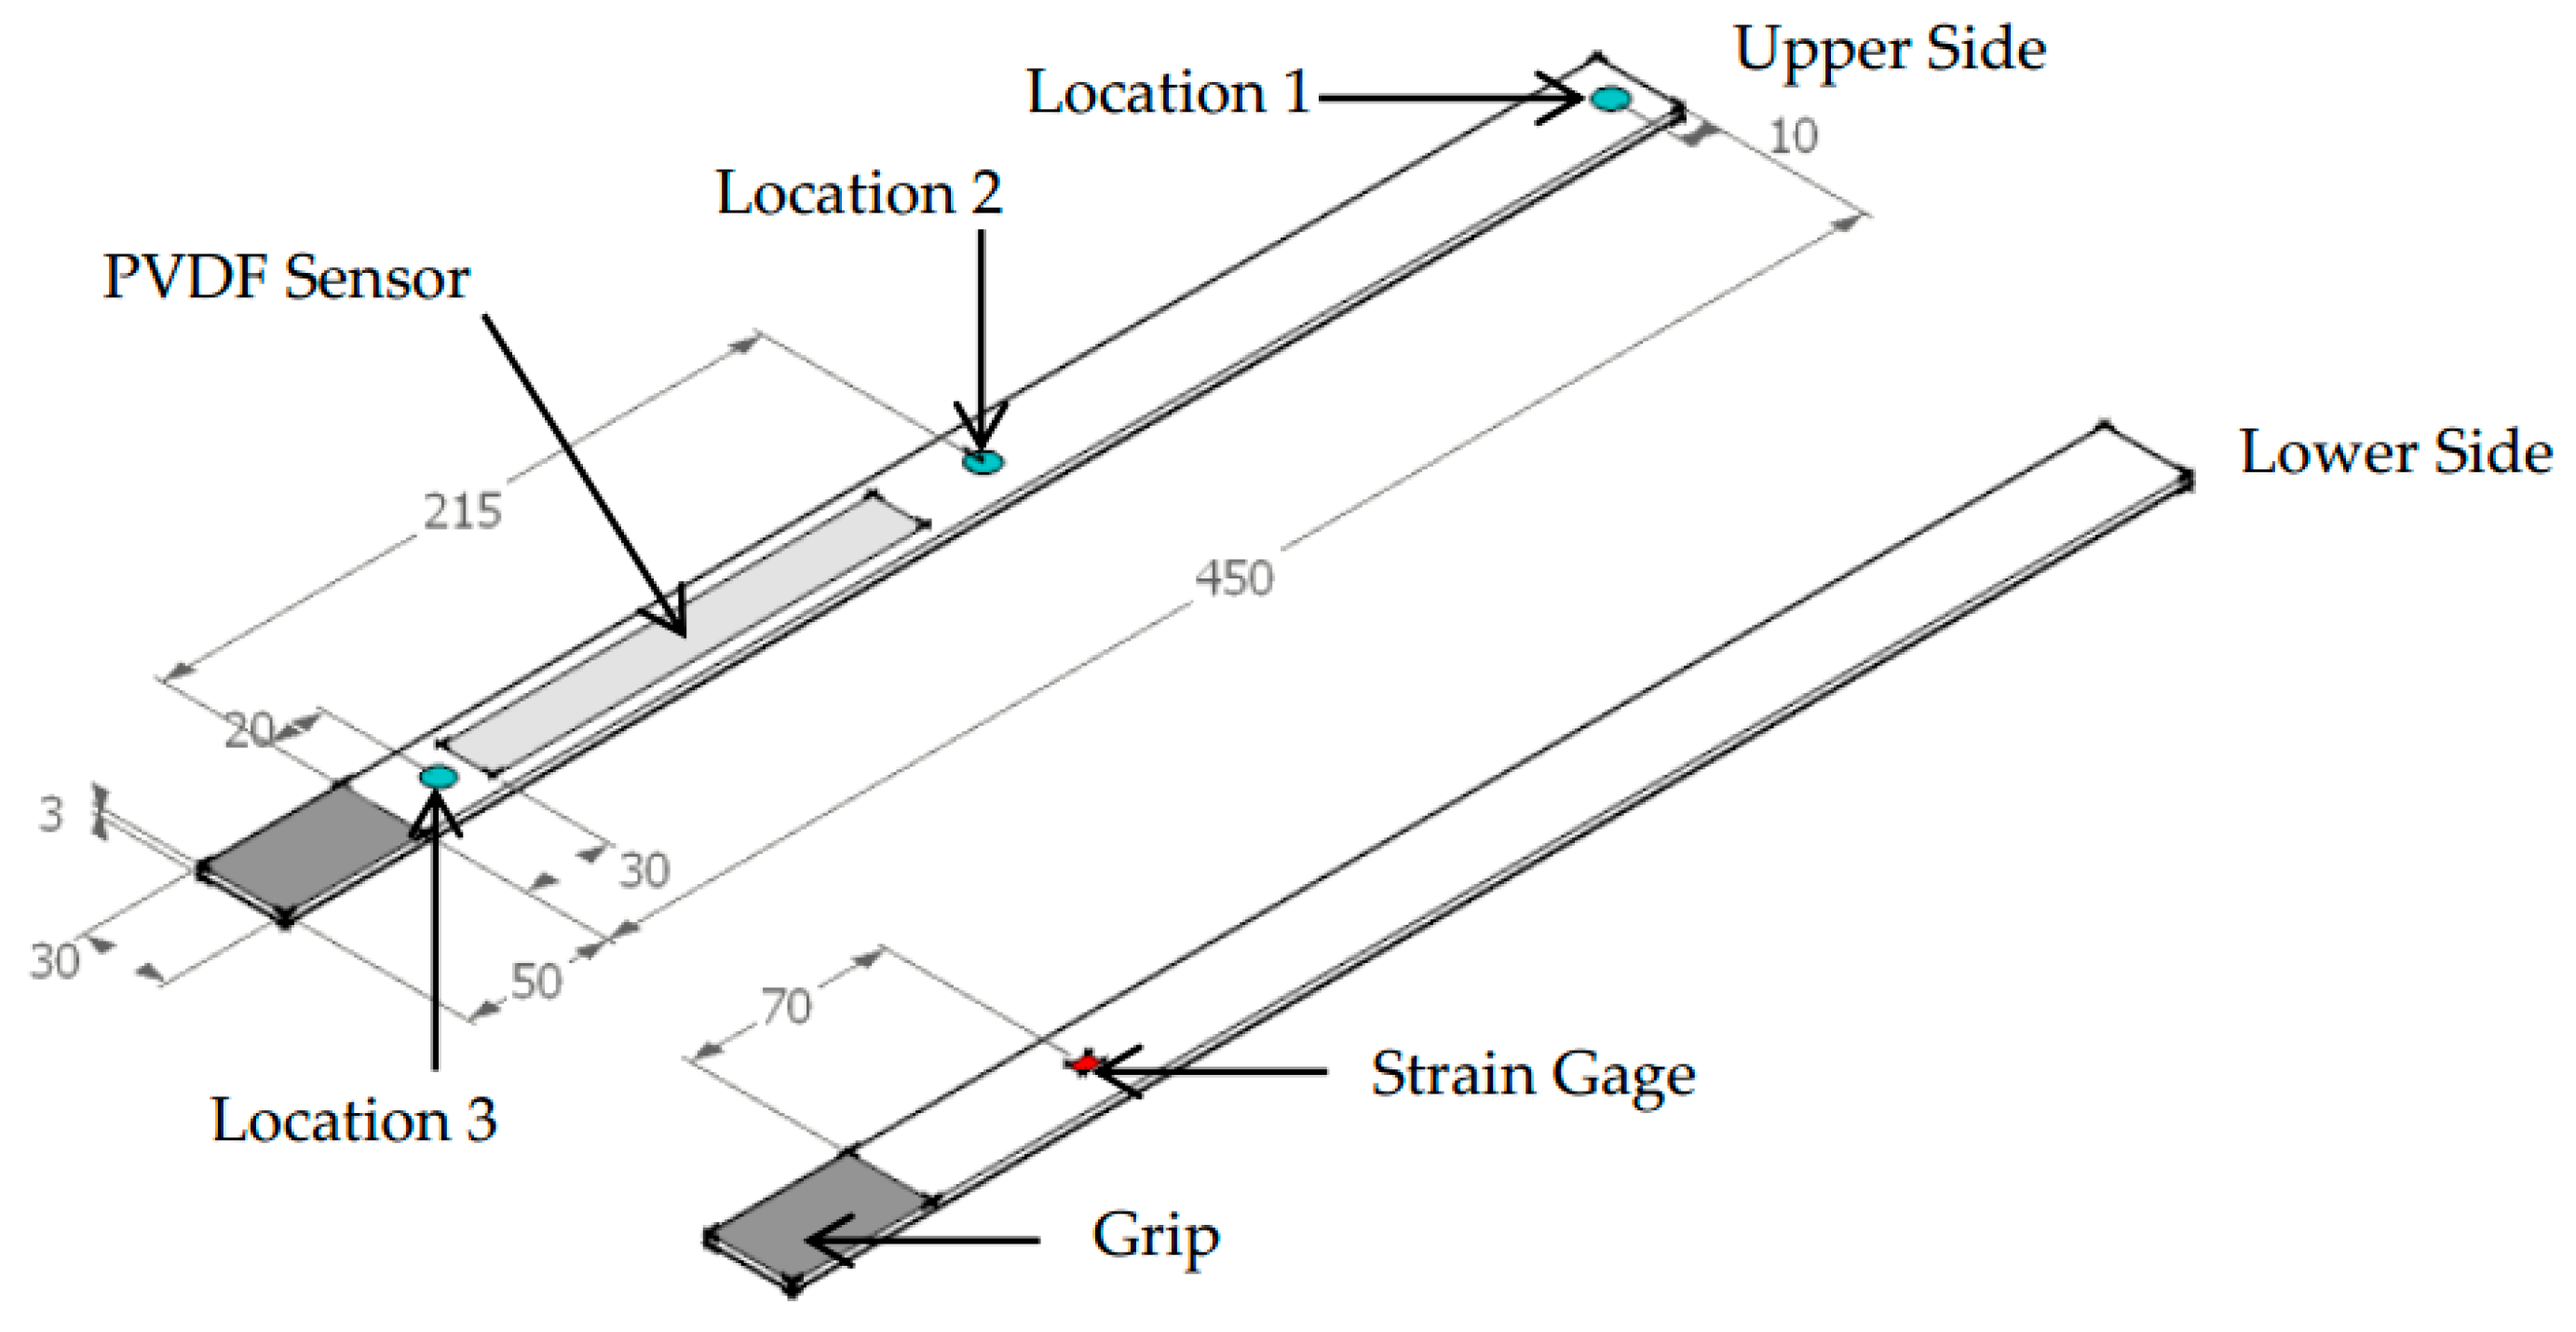
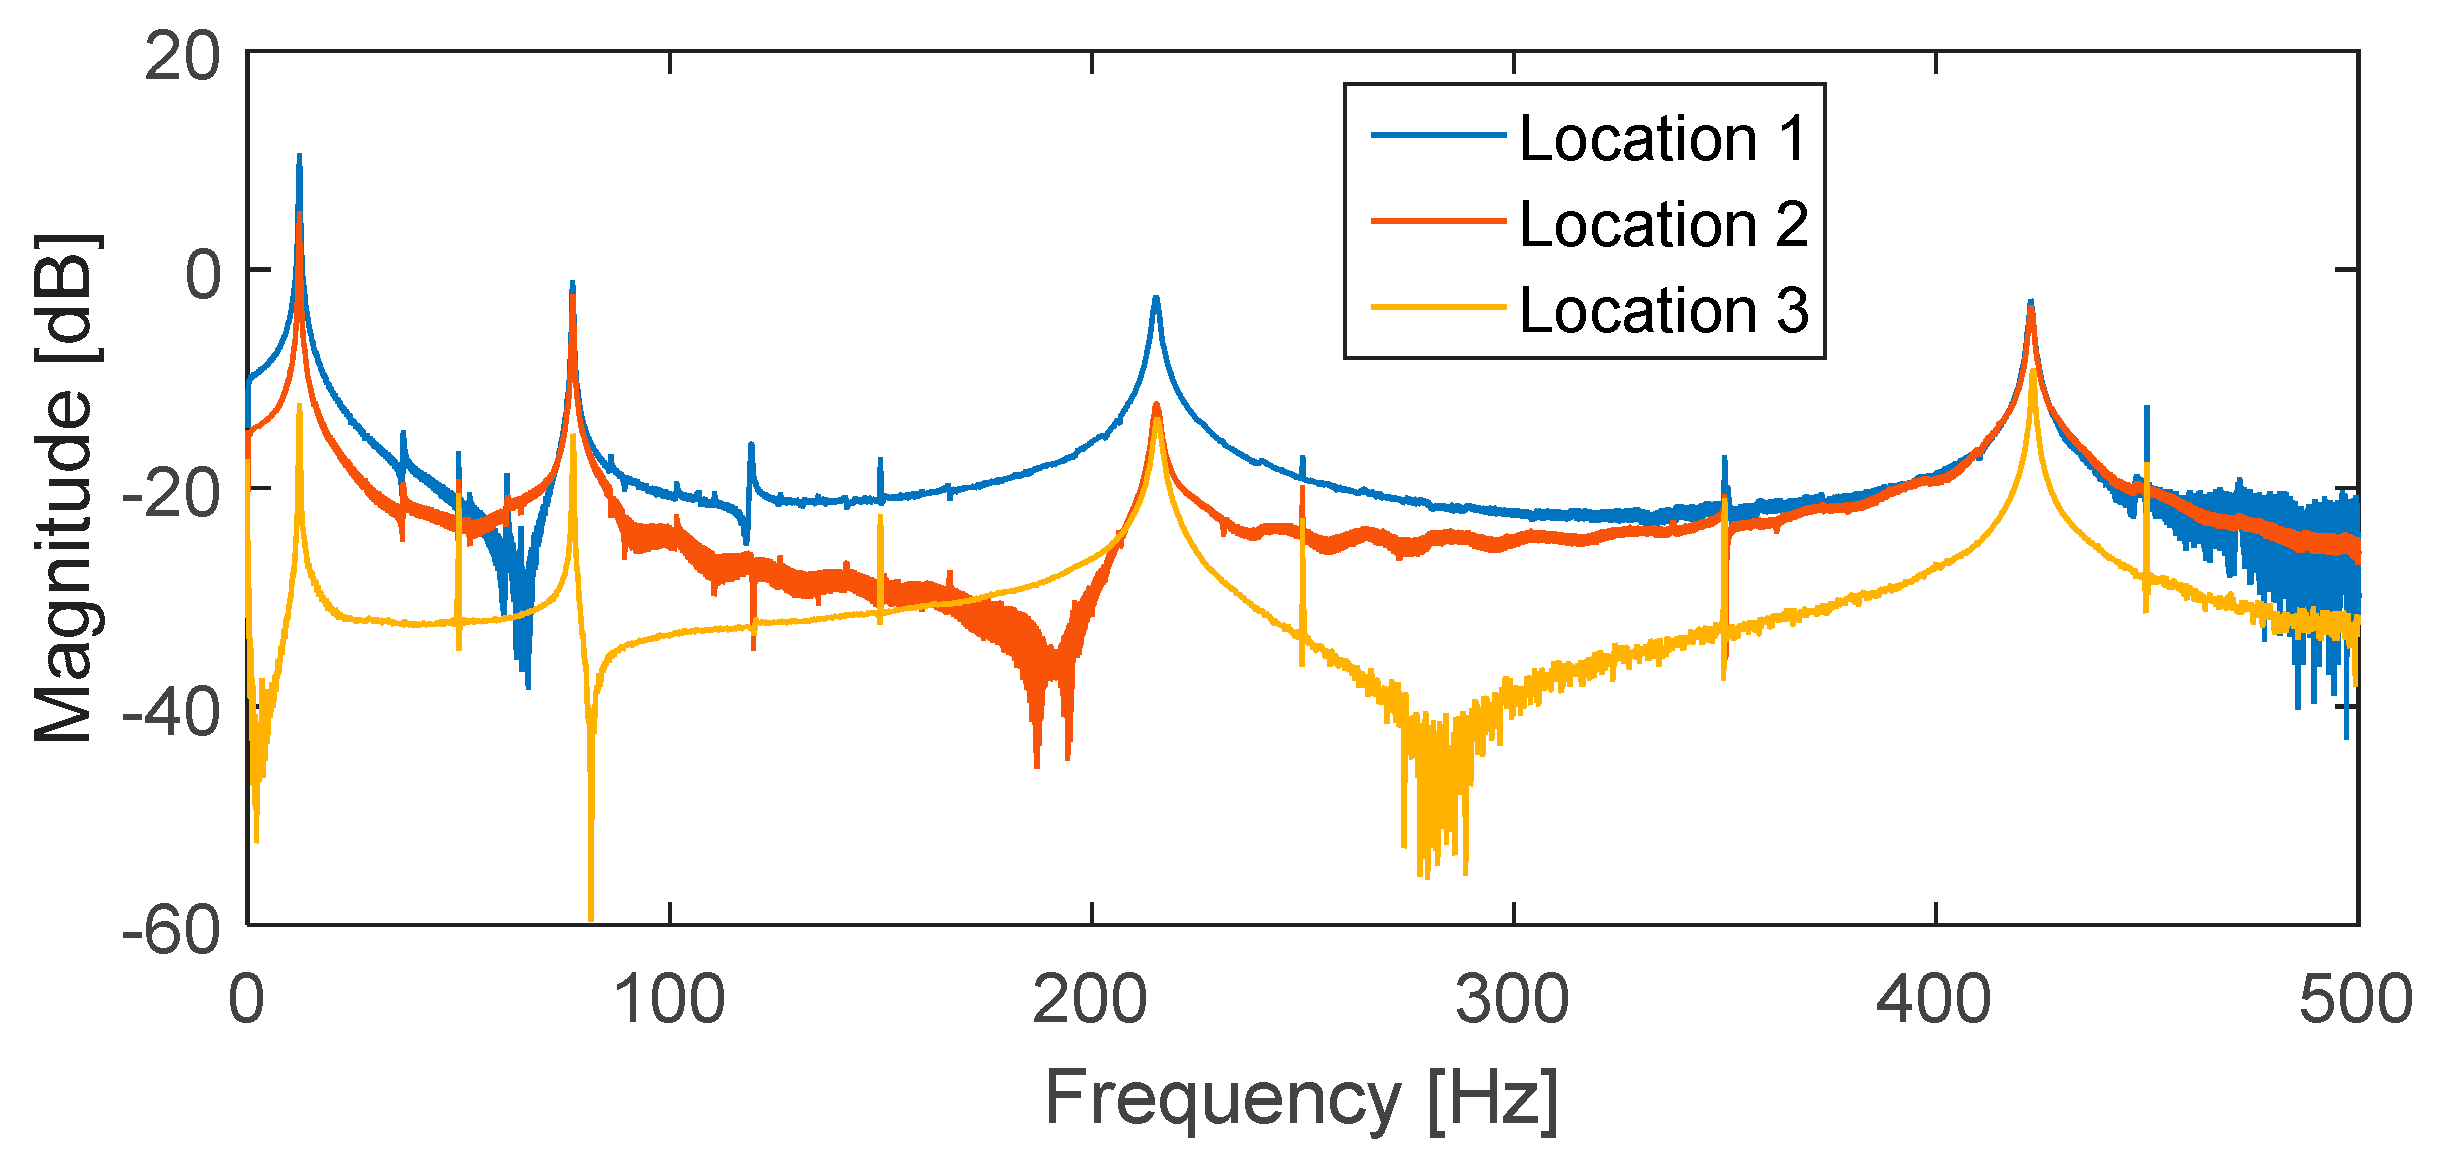
4. Impact Tests
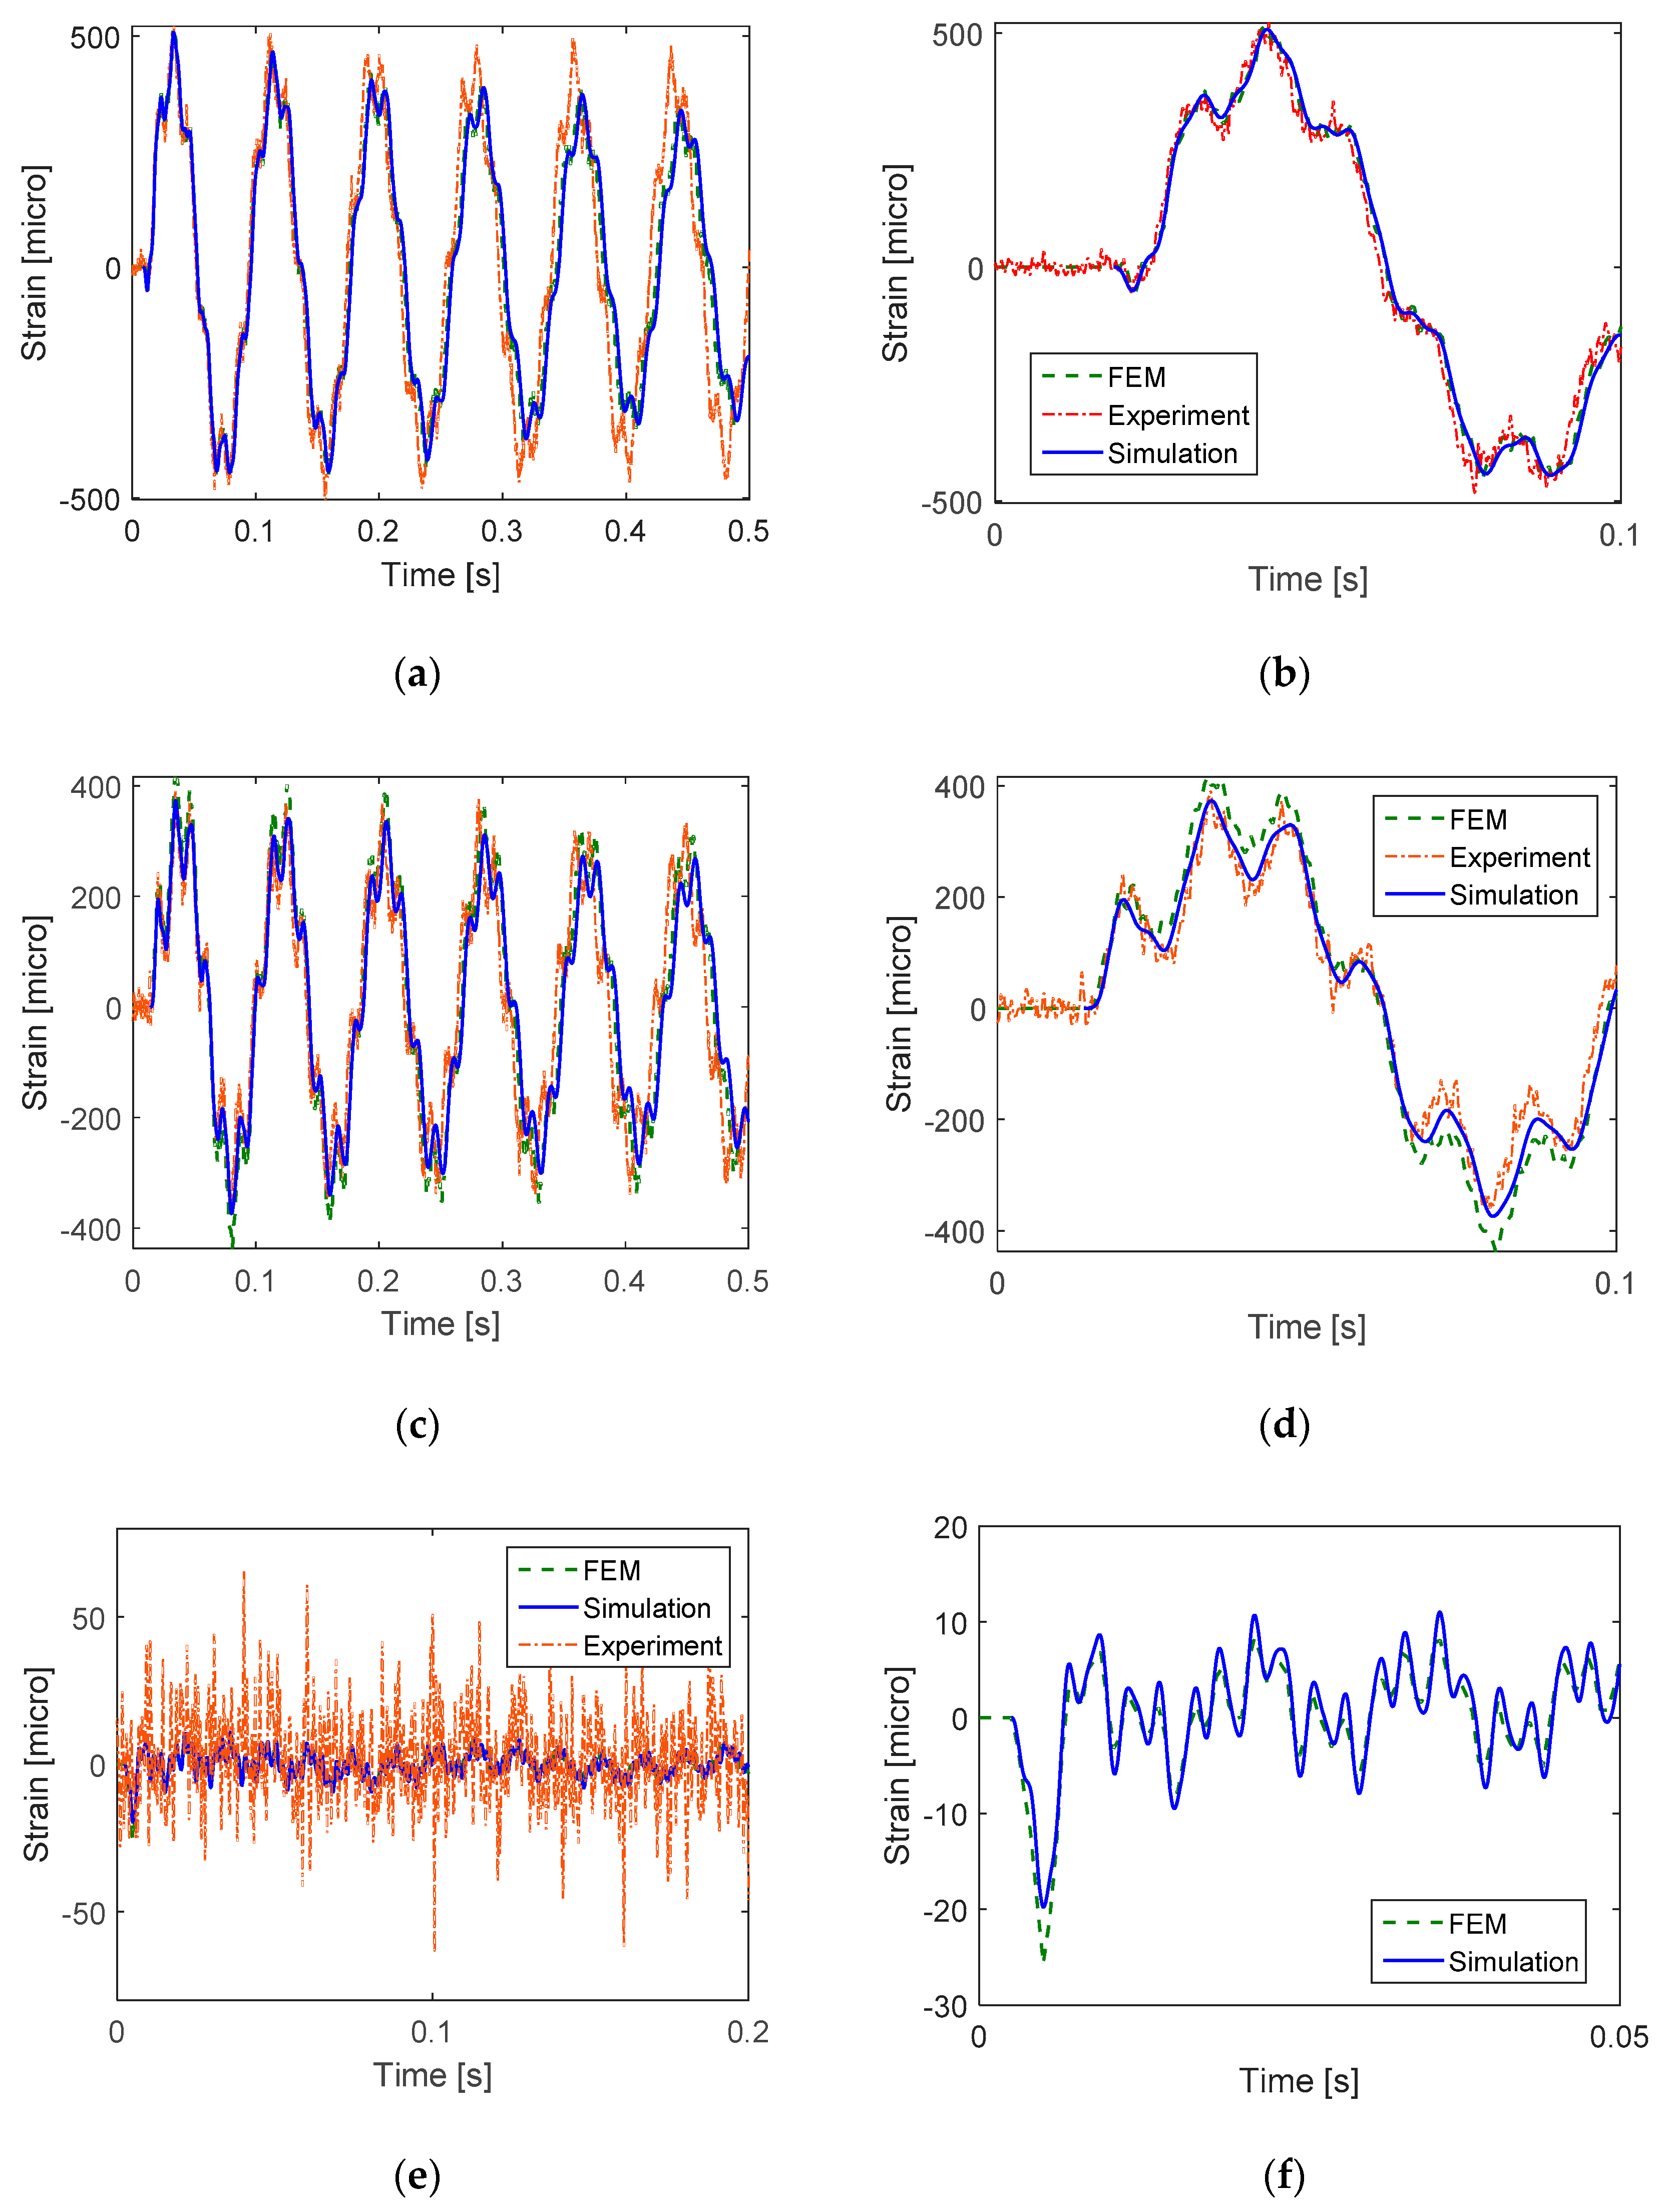
5. Verification of Numerical Simulation Results by FEM
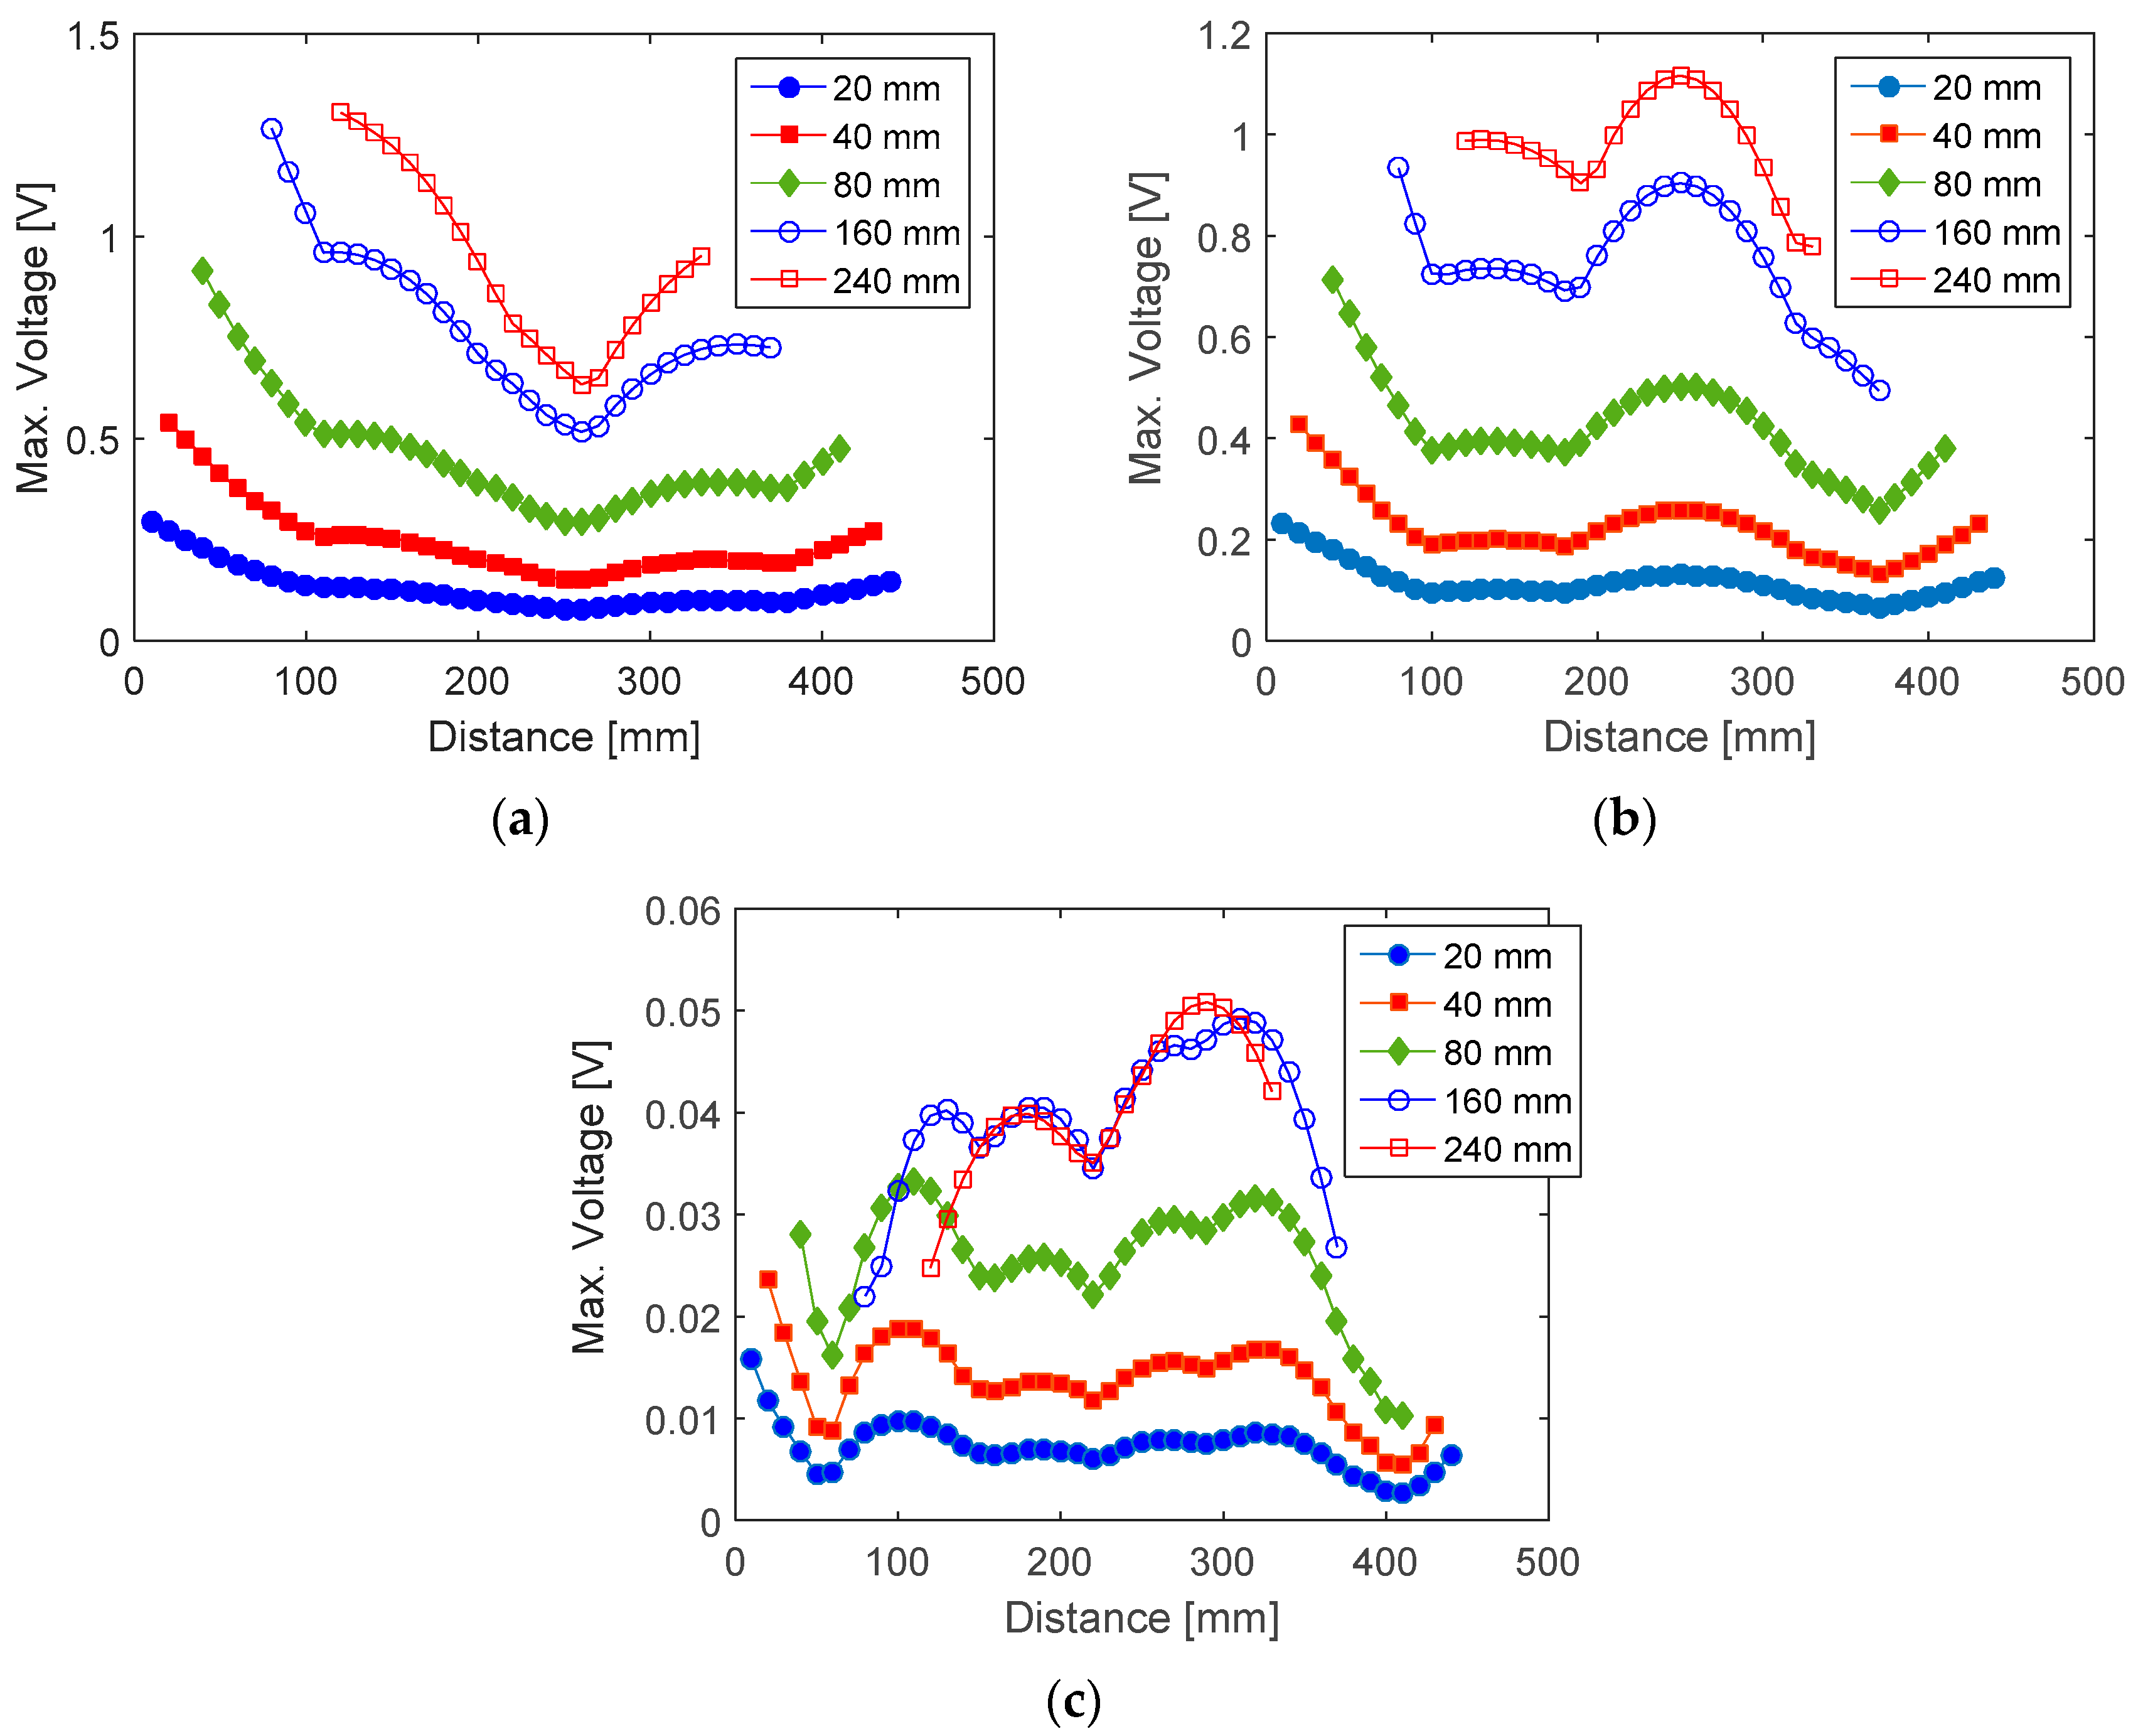
6. Results of Numerical Simulation
7. Conclusions
Author Contributions
Conflicts of Interest
References
- Kawai, H. The piezoelectricity of poly (vinylidene fluoride). Jpn. J. Appl. Phys. 1969, 8, 975–976. [Google Scholar] [CrossRef]
- Lando, J.B.; Olf, H.G.; Peterlin, A. Nuclear magnetic resonance and x-ray determination of the structure of poly (vinylidene fluoride). J. Polym. Sci. 1966, 4, 941–951. [Google Scholar] [CrossRef]
- Sessler, G.M. Piezoelectricity in polyvinylidenefluoride. J. Acoust. Soc. Am. 1981, 70, 1596–1608. [Google Scholar] [CrossRef]
- Darasawa, N.; Goddard, W.A. Force fields, structures, and properties of poly (vinylidene fluoride) crystals. Macromolecules 1992, 25, 7268–7281. [Google Scholar]
- Lee, L.M.; Graham, R.A.; Bauer, F.; Reed, R.P. Standardized Bauer PVDF piezoelectric polymer shock gauge. J. De Physique 1988, 9, 651–657. [Google Scholar] [CrossRef]
- Dutta, P.K.; Kalafut, J. Evaluation of PVDF Piezopolymer for Use as a Shock Gauge; Special Report; U.S. Army Corps of Engineers: Hanover, NH, USA, 1990; pp. 90–23. [Google Scholar]
- Bauer, F. Ferroelectric PVDF polymer for high pressure and shock compression sensors. In Proceedings of the 11th International Symposium on Electrets, Melbourne, Australia, 1–3 October 2002; pp. 219–222.
- Shirinov, A.V.; Schomburg, W.K. Pressure sensor from a PVDF film. Sens. Actuators A 2008, 142, 48–55. [Google Scholar] [CrossRef]
- Wang, F.; Tanaka, M.; Chonan, S. Development of a wearable mental stress evaluation system using PVDF sensor. J. Adv. Sci. 2006, 18, 170–173. [Google Scholar] [CrossRef]
- Kim, K.J.; Chang, Y.M.; Yoon, S.; Kim, H.J. A Novel Piezoelectric PVDF Film-Based Physiological Sensing Belt for a Complementary Respiration and Heartbeat Monitoring System. Integr. Ferroelectr. 2009, 107, 53–68. [Google Scholar] [CrossRef]
- Chiu, Y.; Lin, W.; Wang, H.; Huang, S.; Wu, H. Development of a piezoelectric polyvinylidene fluoride (PVDF) polymer-based sensor patch for simultaneous heartbeat and respiration monitoring. Sens. Actuators A 2013, 189, 328–334. [Google Scholar] [CrossRef]
- Woodward, B.; Chandra, R.C. Underwater acoustic measurements on polyvinylidene fluoride transducers. Electrocomponent Sci. Technol. 1978, 5, 149–157. [Google Scholar] [CrossRef]
- Xu, J. Microphone Based on Polyvinylidene Fluoride (PVDF) Micro-Pillars and Patterned Electrodes. Ph.D. Thesis, Ohio State University, Columbus, OH, USA, 2010. [Google Scholar]
- Headings, L.M.; Kotian, K.; Dapino, M.J. Speed of sound measurement in solids using polyvinylidene fluoride (PVDF) sensors. In Proceedings of the ASME 2013 Conference on Smart Materials, Adaptive Structures and Intelligent Systems, SMASIS2013, Snowbird, UT, USA, 16–18 September 2013.
- Xu, J.; Headings, L.M.; Dapino, M.J. High sensitivity polyvinylidene fluoride microphone based on area ratio amplification and minimal capacitance. IEEE Sens. J. 2015, 15, 2839–2847. [Google Scholar] [CrossRef]
- Lee, M.H.; Nicholls, H.R. Tactile sensing for mechatronics—A state of the art survey. Mechatronics 1999, 9, 1–31. [Google Scholar] [CrossRef]
- Dargahi, J. A piezoelectric tactile sensor with three sensing elements for robotic, endoscopic and prosthetic applications. Sens. Actuators A 2000, 80, 23–30. [Google Scholar] [CrossRef]
- Seminara, L.; Capurro, M.; Cirill, P.; Cannata, G.; Valle, M. Electromechanical characterization of piezoelectric PVDF polymer films for tactile sensors in robotics applications. Sens. Actuators A 2011, 169, 49–58. [Google Scholar] [CrossRef]
- Ma, C.; Chuang, K.; Pan, S. Polyvinylidene Fluoride Film Sensors in Collocated Feedback Structural Control: Application for Suppressing Impact-Induced Disturbances. IEEE Trans. Ultrason. Ferroelectr. Freq. Control 2011, 12, 2539–2554. [Google Scholar] [CrossRef] [PubMed]
- Matsumoto, E.; Biwa, S.; Katsumi, K.; Omoto, Y.; Iguchi, K.; Shibata, T. Surface strain sensing with polymer piezoelectric film. NDT&E Int. 2004, 37, 57–64. [Google Scholar]
- Kurata, M.; Li, X.; Fujita, K.; He, L.; Yamaguchi, M. PVDF Piezo Film as Dynamic Strain Sensor for Local Damage Detection of Steel Frame Buildings. In Proceedings of the SPIE Sensors and Smart Structures Technologies for Civil, Mechanical, and Aerospace Systems, San Diego, CA, USA, 10 March 2013.
- Bloomfield, P.E. Piezoelectric Polymer Transducers for Detection of Structural Defects in Aircraft; Final Report; Naval Air Development Center: Warminster, PA, USA, 1977. [Google Scholar]
- Lee, C.K.; O’Sullivan, T.C. Piezoelectric strain rate gages. J. Acoust. Soc. Am. 1991, 2, 945–953. [Google Scholar] [CrossRef]
- Wang, B.; Wang, C. Feasibility analysis of using piezoceramic transducers for cantilever beam modal testing. Smart Mater. Struct. 1997, 6, 106–116. [Google Scholar] [CrossRef]
- Sirohi, J.; Chopra, I. Fundamental Understanding of Piezoelectric Strain Sensors. J. Intell. Mater. Syst. Struct 2000, 11, 246–257. [Google Scholar] [CrossRef]
- Ma, C.; Huang, Y.; Pan, S. Investigation of the Transient Behavior of a Cantilever Beam Using PVDF Sensors. Sensors 2012, 12, 2088–2117. [Google Scholar] [CrossRef] [PubMed]
- Kotian, K.; Headings, L.M.; Dapino, M.J. Stress Averaging in PVDF Sensors for in-Plane Sinusoidal and Impact-Induced Stresses. IEEE Sens. J. 2013, 11, 4444–4451. [Google Scholar] [CrossRef]
- Standards Committee of IEEE Ultrasonics. Ferroelectrics, and Frequency Control Society; IEEE Standard on Piezoelectricity: New York, NY, USA, 1987. [Google Scholar]
- Beer, F.P.; Johnston, E.R.; Dewolf, J.T. Mechanics of materials, 5th ed.; McGraw-Hill Inc.: New York, NY, USA, 2006. [Google Scholar]
- Caughey, T.K.; O’Kelly, M.E.J. Classical Normal Modes in Damped Linear Dynamic Systems. ASME J. Appl. Mech. 1965, 32, 583–588. [Google Scholar] [CrossRef]
- Erturk, A.; Inman, D.J. A Distributed Parameter Electromechanical Model for Cantilevered Piezoelectric Energy Harvesters. J. Vib. Acoust. 2008, 130, 1–15. [Google Scholar] [CrossRef]
- Erturk, A. Electromechanical Modeling of Piezoelectric Energy Harvesters. Ph.D. Thesis, Virginia Polytechnic Institute and State University, Blacksburg, VA, USA, 2008. [Google Scholar]
- Measurement Specialties Inc. Piezo Film Sensors Technical Manual. Available online: http://www.meas-spec.com/downloads/Piezo_Technical_Manual.pdf (accessed on 7 July 2015).
- Measurement Specialties Inc. Piezo Film Lab Amplifier. Available online: http://www.meas-spec.com/downloads/Piezo_Film_Lab_Amplifier.pdf (accessed on 25 March 2015).
- Measurement Specialties Inc. DT Series Elements with Lead Attachment. Available online: http://www.meas-spec.com/downloads/DT_Series_LeadAttach.pdf (accessed on 5 March 2015).
- Butterworth, J.; Lee, J.H.; Davidson, B. Experimental determination of modal damping from full-scale testing. In Proceedings of the 13th World Conference on Earthquake Engineering, Vancouver, BC, Canada, 1–6 August 2004.


| Item | Symbol | Parameter | Value |
|---|---|---|---|
| Sensor | Lp | Length | 155 mm |
| bp | Width | 19 mm | |
| tp | Thickness | 0.028 mm | |
| d31 | Piezoelectric constant | 23 × 10−12 (C/N) | |
| Ep | Young’s modulus | 4 GPa | |
| Cp | Capacitance | 11 nF | |
| Charge Amplifier | fc | Cut-off frequency | 0.1 Hz |
| CF | Feedback capacitance | 100 nF | |
| Cantilever beam | ρ | Density | 7860 kg/m3 |
| E | Young’s modulus | 200 GPa |
| Mode No. | Mode Type | FEM | Theory | Modal Test | Maximum Difference (%) | ||
|---|---|---|---|---|---|---|---|
| Location 1 | Location 2 | Location 3 | |||||
| 1 | 1st Flexural | 12.135 | 12.071 | 12.29 | 12.3 | 12.32 | 2.02 |
| 2 | 2nd Flexural | 76.029 | 75.651 | 77.06 | 77.08 | 77.15 | 1.94 |
| 3 | 1st Lateral | 120.44 | n/a | 119.5 | n/a | n/a | 0.79 |
| 4 | 3rd Flexural | 212.89 | 211.85 | 215.2 | 215.4 | 215.5 | 1.69 |
| 5 | 1st Torsional | 341.41 | n/a | n/a | n/a | n/a | n/a |
| 6 | 4th Flexural | 417.28 | 415.14 | 422.4 | 422.5 | 422.9 | 1.83 |
| 7 | 5th Flexural | 690.06 | 686.19 | 698.3 | 698.3 | 698.9 | 1.81 |
| 8 | 2nd Lateral | 739.77 | n/a | n/a | n/a | n/a | n/a |
| 9 | 2nd Torsional | 1026.7 | n/a | n/a | n/a | n/a | n/a |
| 10 | 6th Flexural | 1031.3 | 1025.1 | 1044 | 1044 | 1044 | 1.81 |
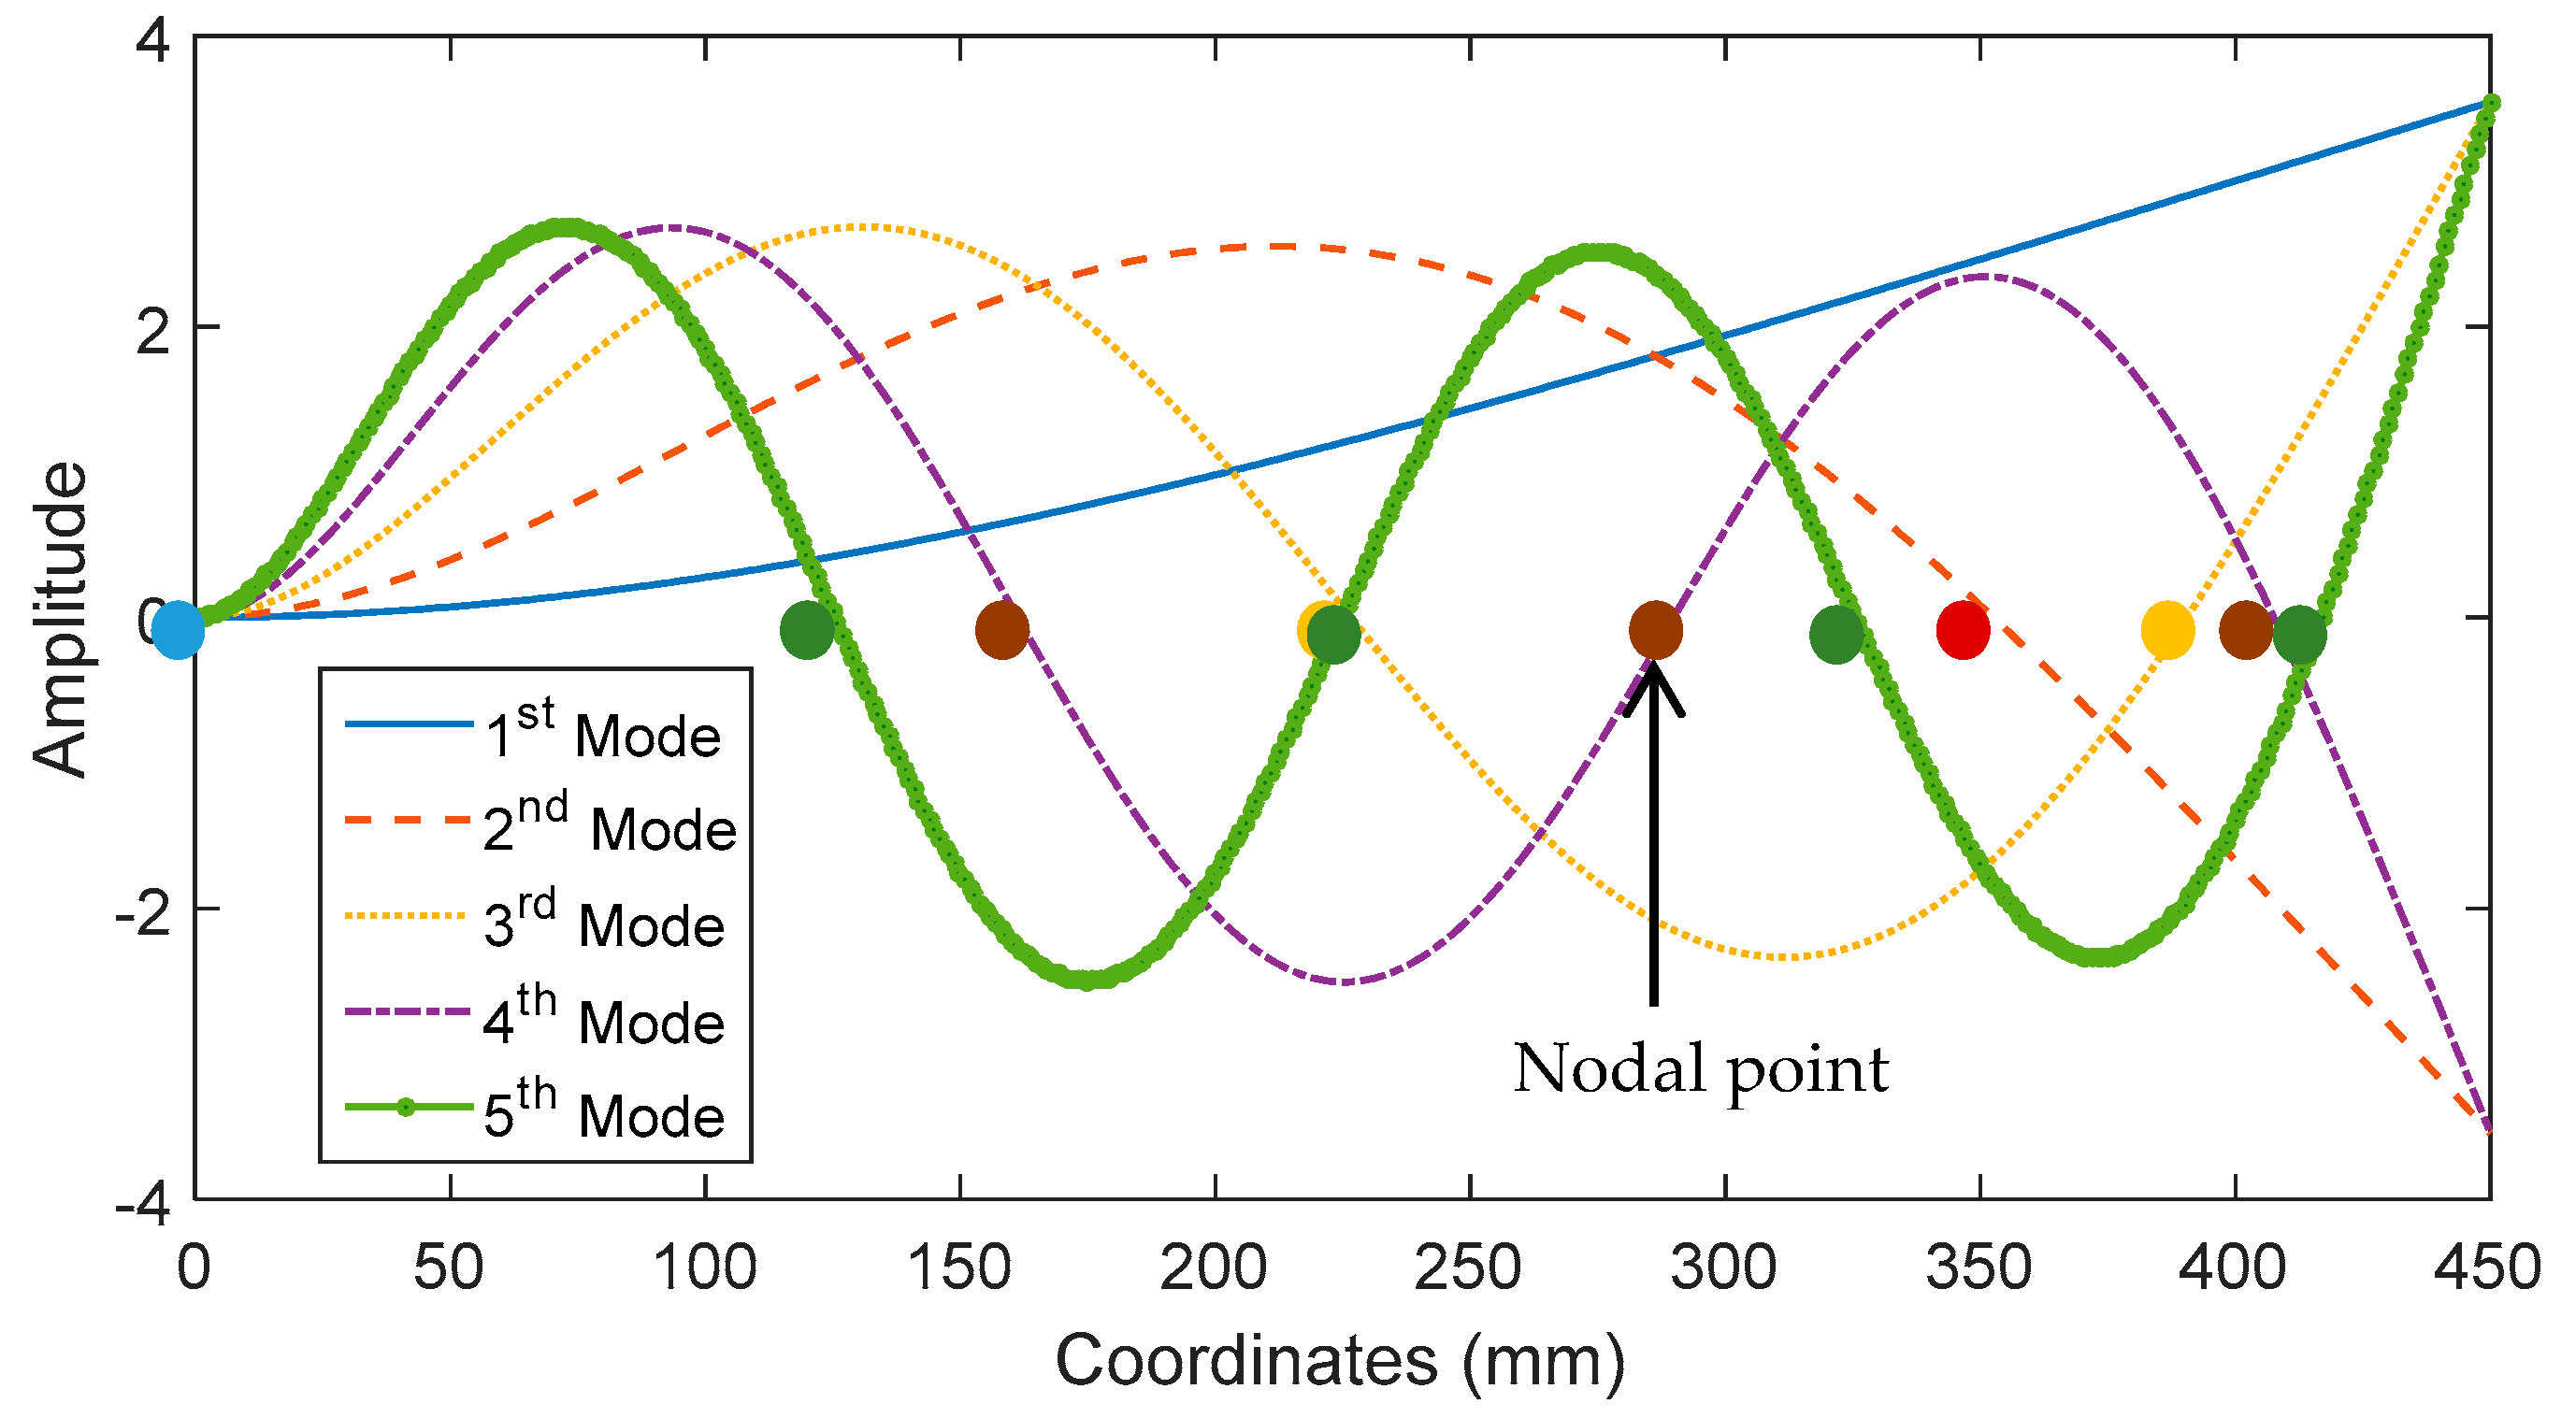
| 1st Mode | 2nd Mode | 3rd Mode | 4th Mode | 5th Mode | |
|---|---|---|---|---|---|
| Impact at 1 | 0.011159 | 0.002566 | 0.005434 | - | - |
| Impact at 2 | 0.009391 | 0.002647 | 0.006121 | - | - |
| Impact at 3 | 0.013542 | 0.002346 | 0.005920 | 0.001362 | 0.002831 |
© 2016 by the authors; licensee MDPI, Basel, Switzerland. This article is an open access article distributed under the terms and conditions of the Creative Commons Attribution (CC-BY) license (http://creativecommons.org/licenses/by/4.0/).
Share and Cite
Dung, C.V.; Sasaki, E. Numerical Simulation of Output Response of PVDF Sensor Attached on a Cantilever Beam Subjected to Impact Loading. Sensors 2016, 16, 601. https://doi.org/10.3390/s16050601
Dung CV, Sasaki E. Numerical Simulation of Output Response of PVDF Sensor Attached on a Cantilever Beam Subjected to Impact Loading. Sensors. 2016; 16(5):601. https://doi.org/10.3390/s16050601
Chicago/Turabian StyleDung, Cao Vu, and Eiichi Sasaki. 2016. "Numerical Simulation of Output Response of PVDF Sensor Attached on a Cantilever Beam Subjected to Impact Loading" Sensors 16, no. 5: 601. https://doi.org/10.3390/s16050601
APA StyleDung, C. V., & Sasaki, E. (2016). Numerical Simulation of Output Response of PVDF Sensor Attached on a Cantilever Beam Subjected to Impact Loading. Sensors, 16(5), 601. https://doi.org/10.3390/s16050601