
A Novel Arc Fault Detector for Early Detection of Electrical Fires

 ,
,
Abstract
:
1. Introduction
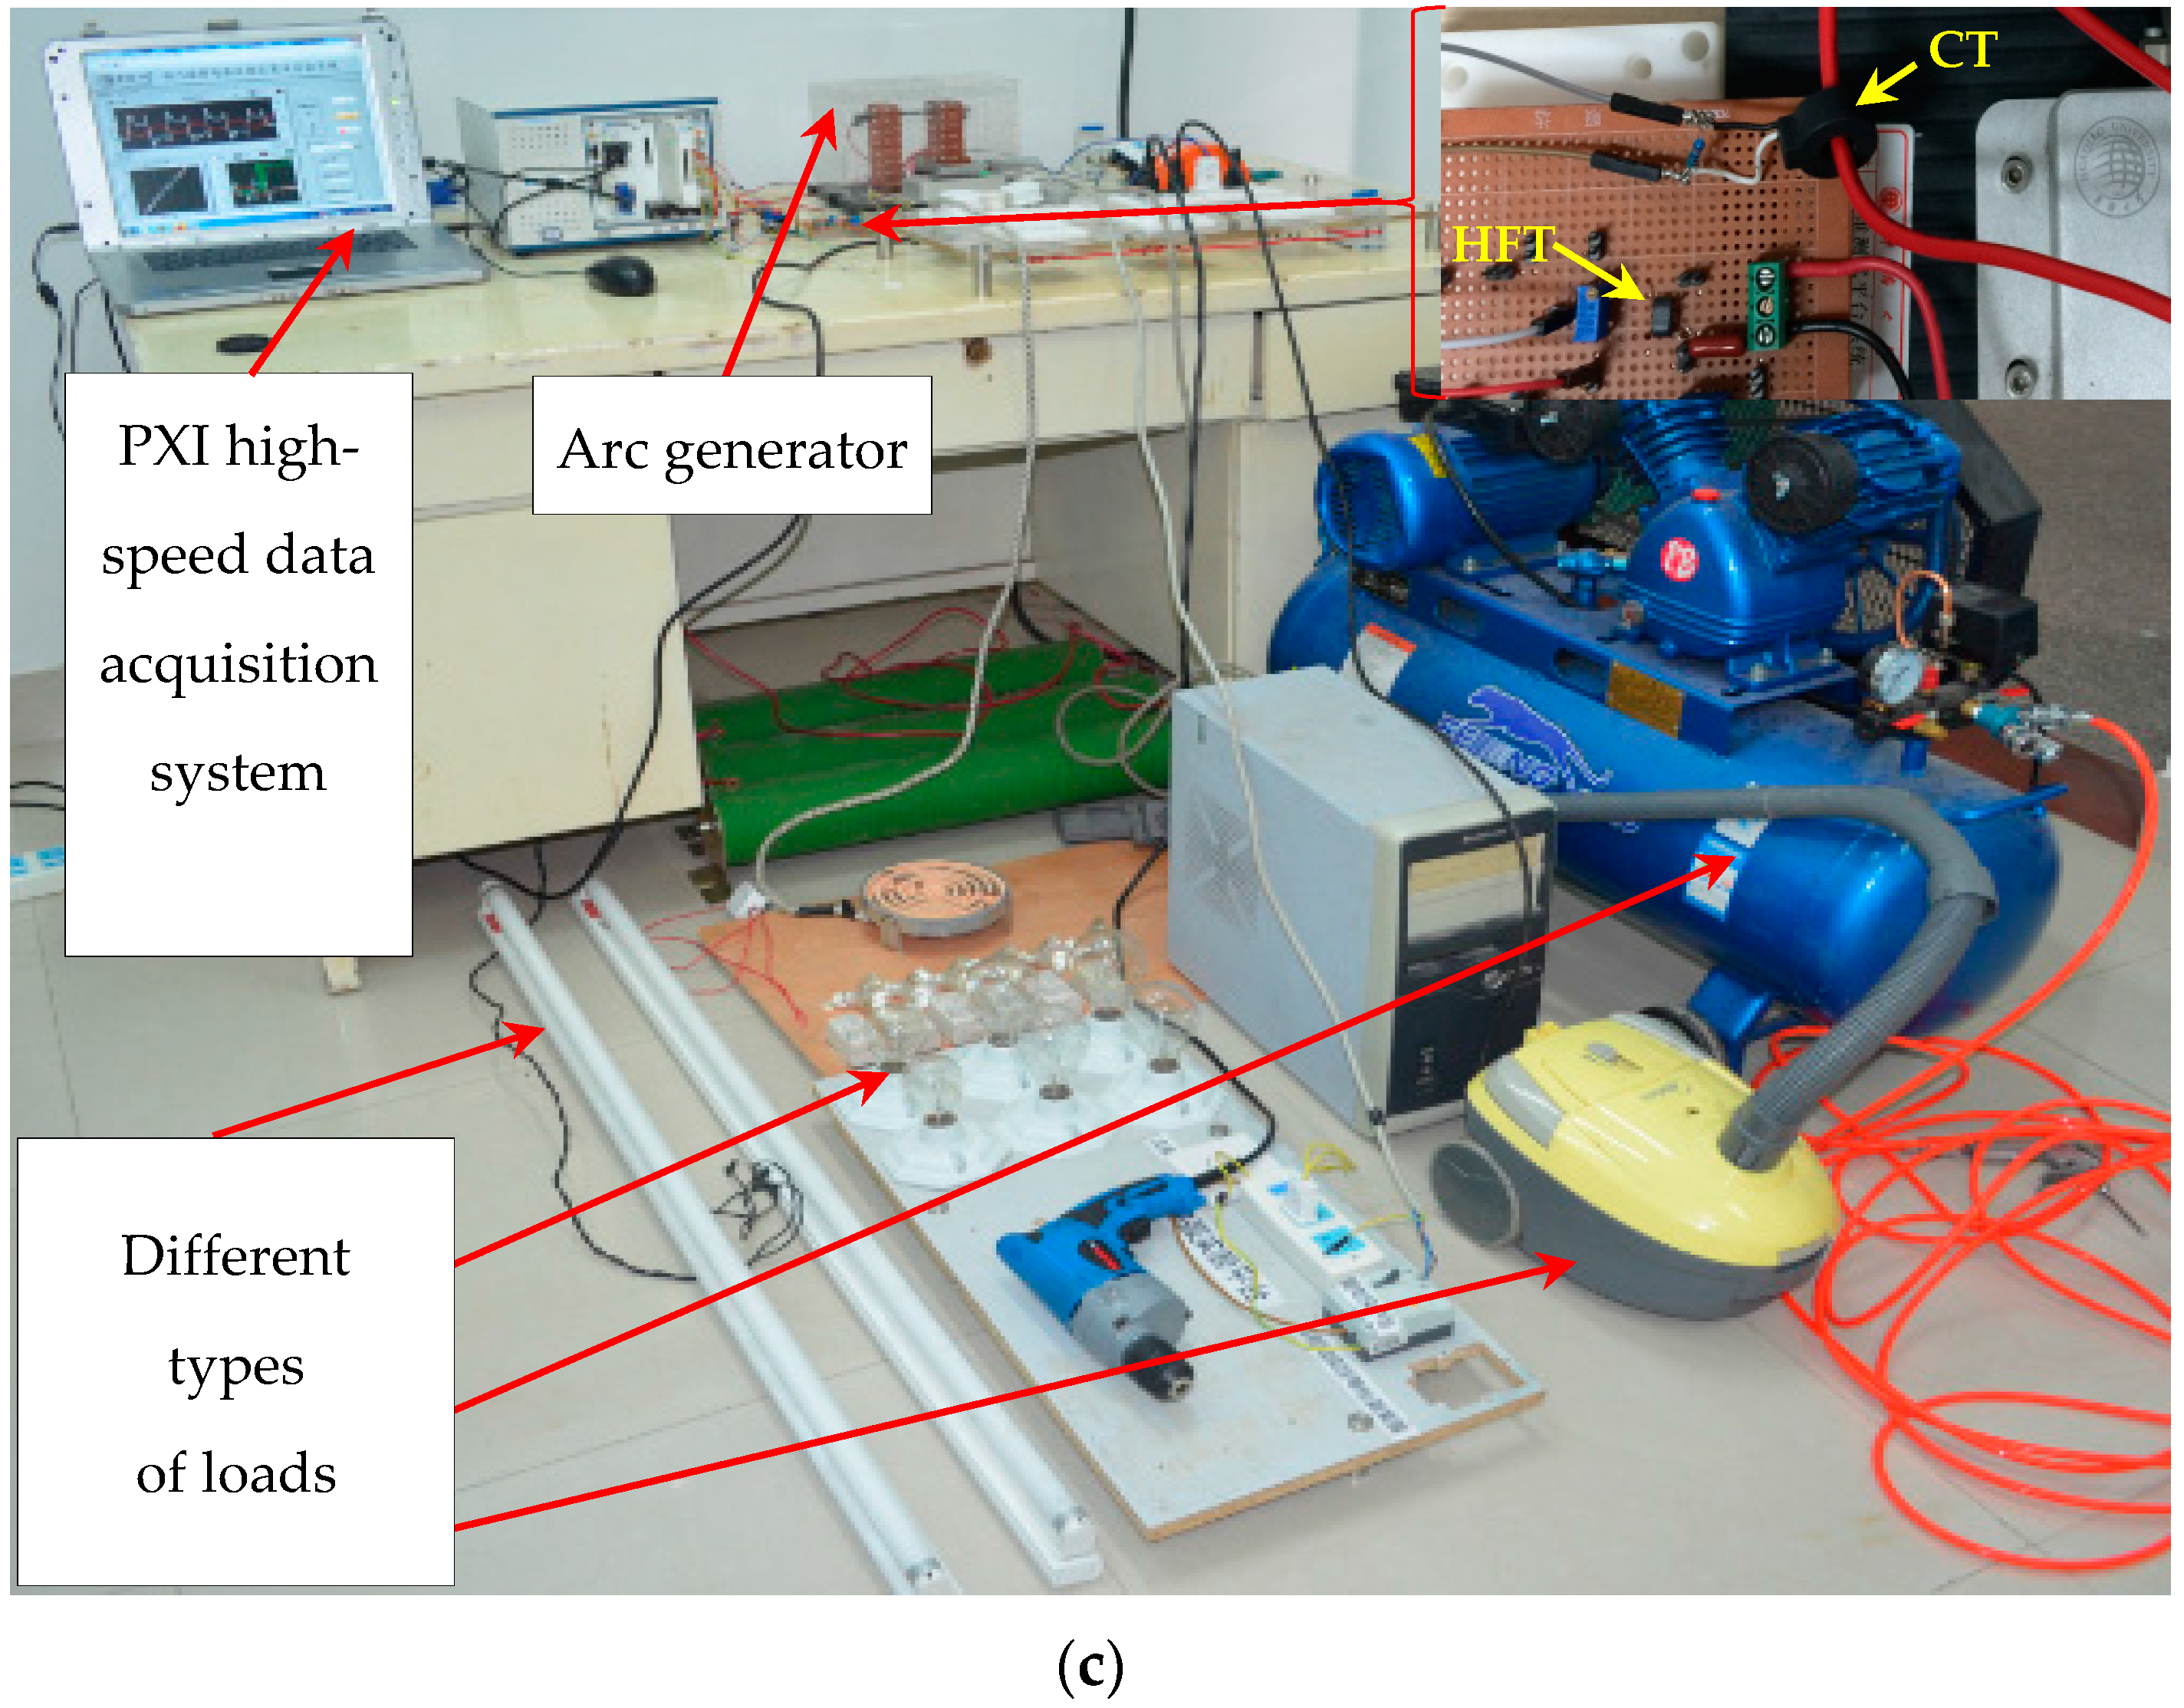
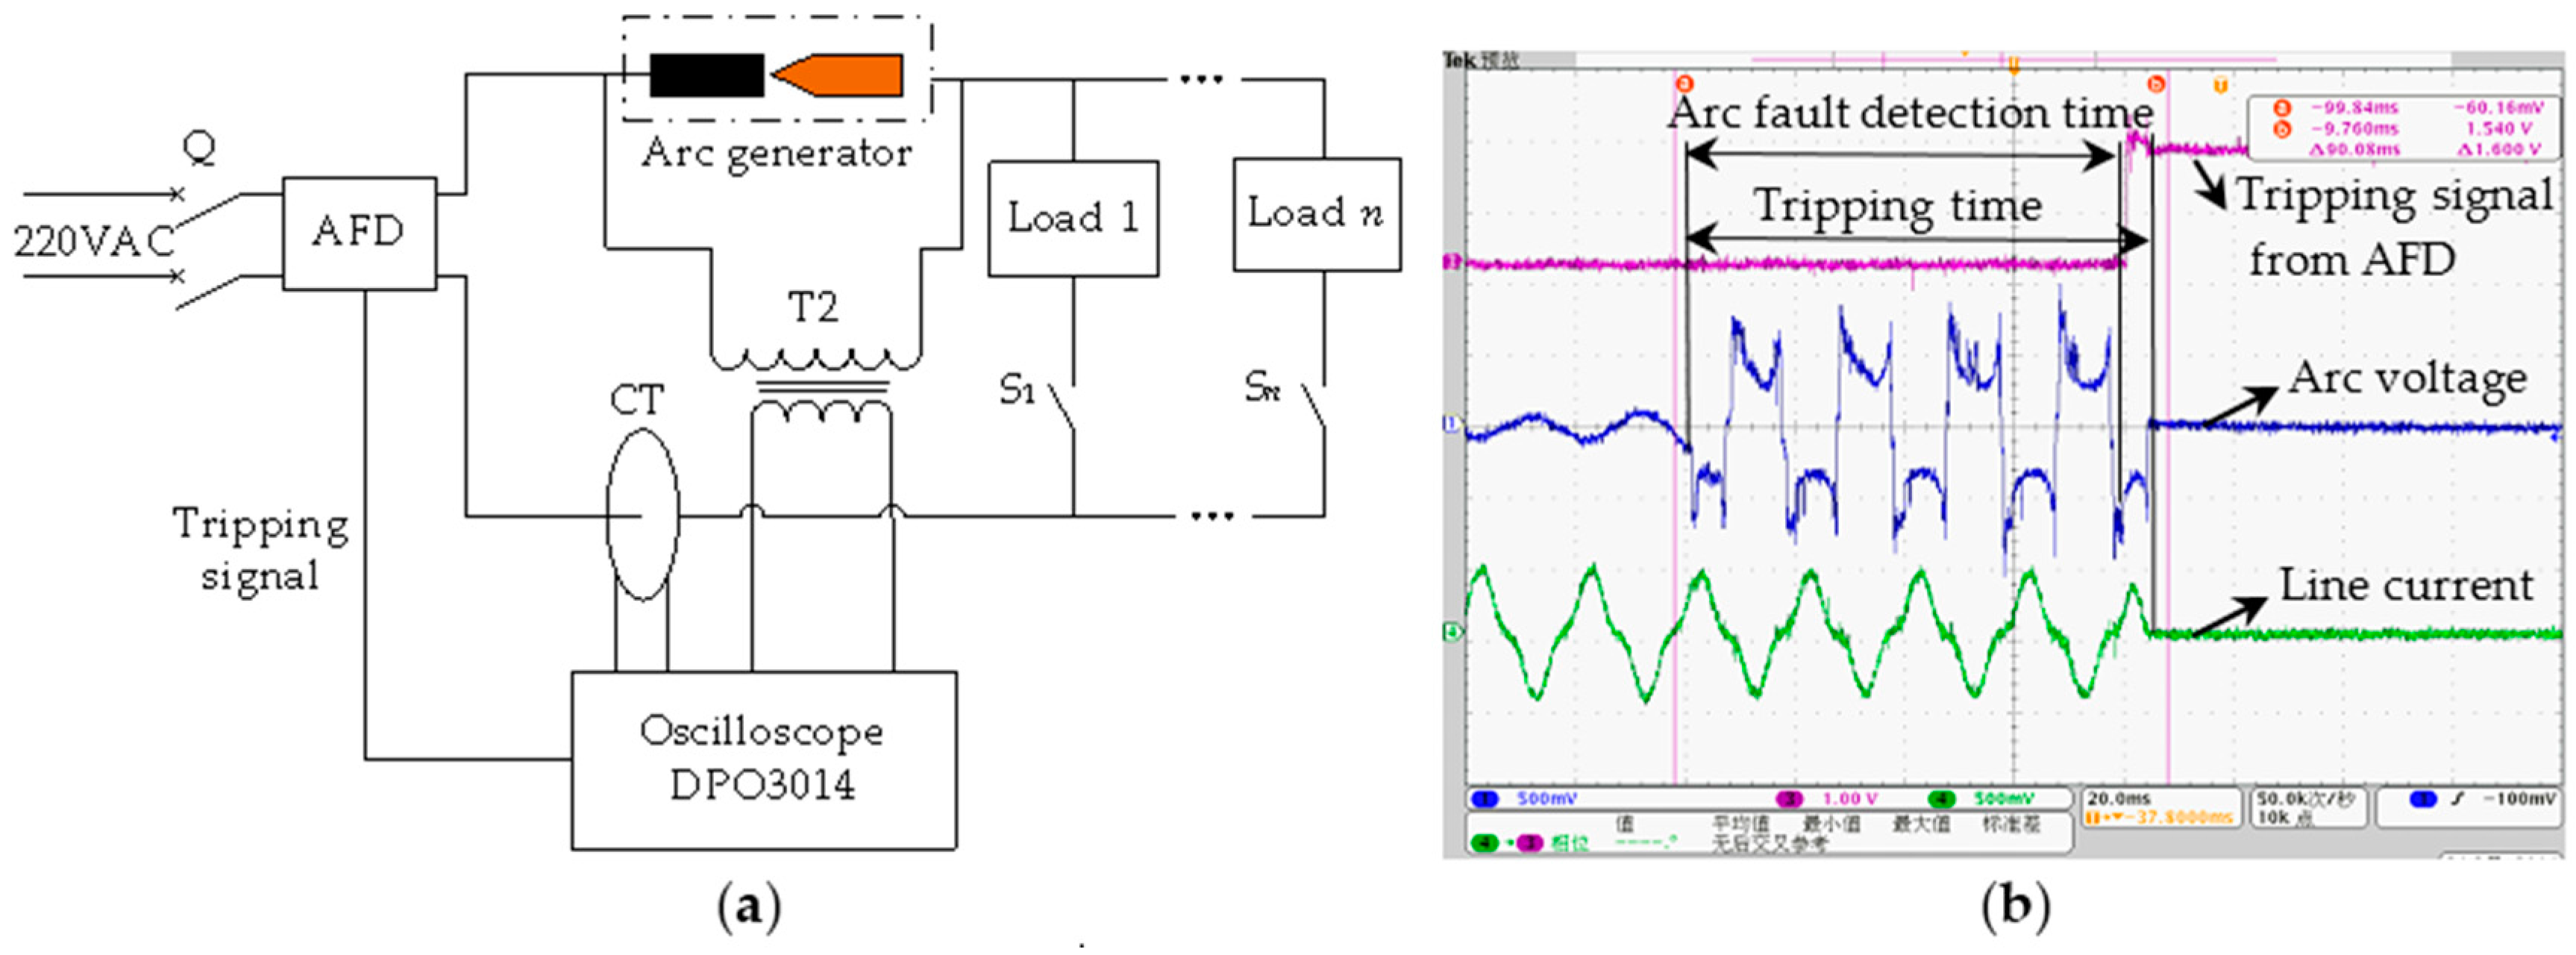
2. Experiments
3. Analysis of Experimental Results
3.1. High-Frequency Signal Analysis
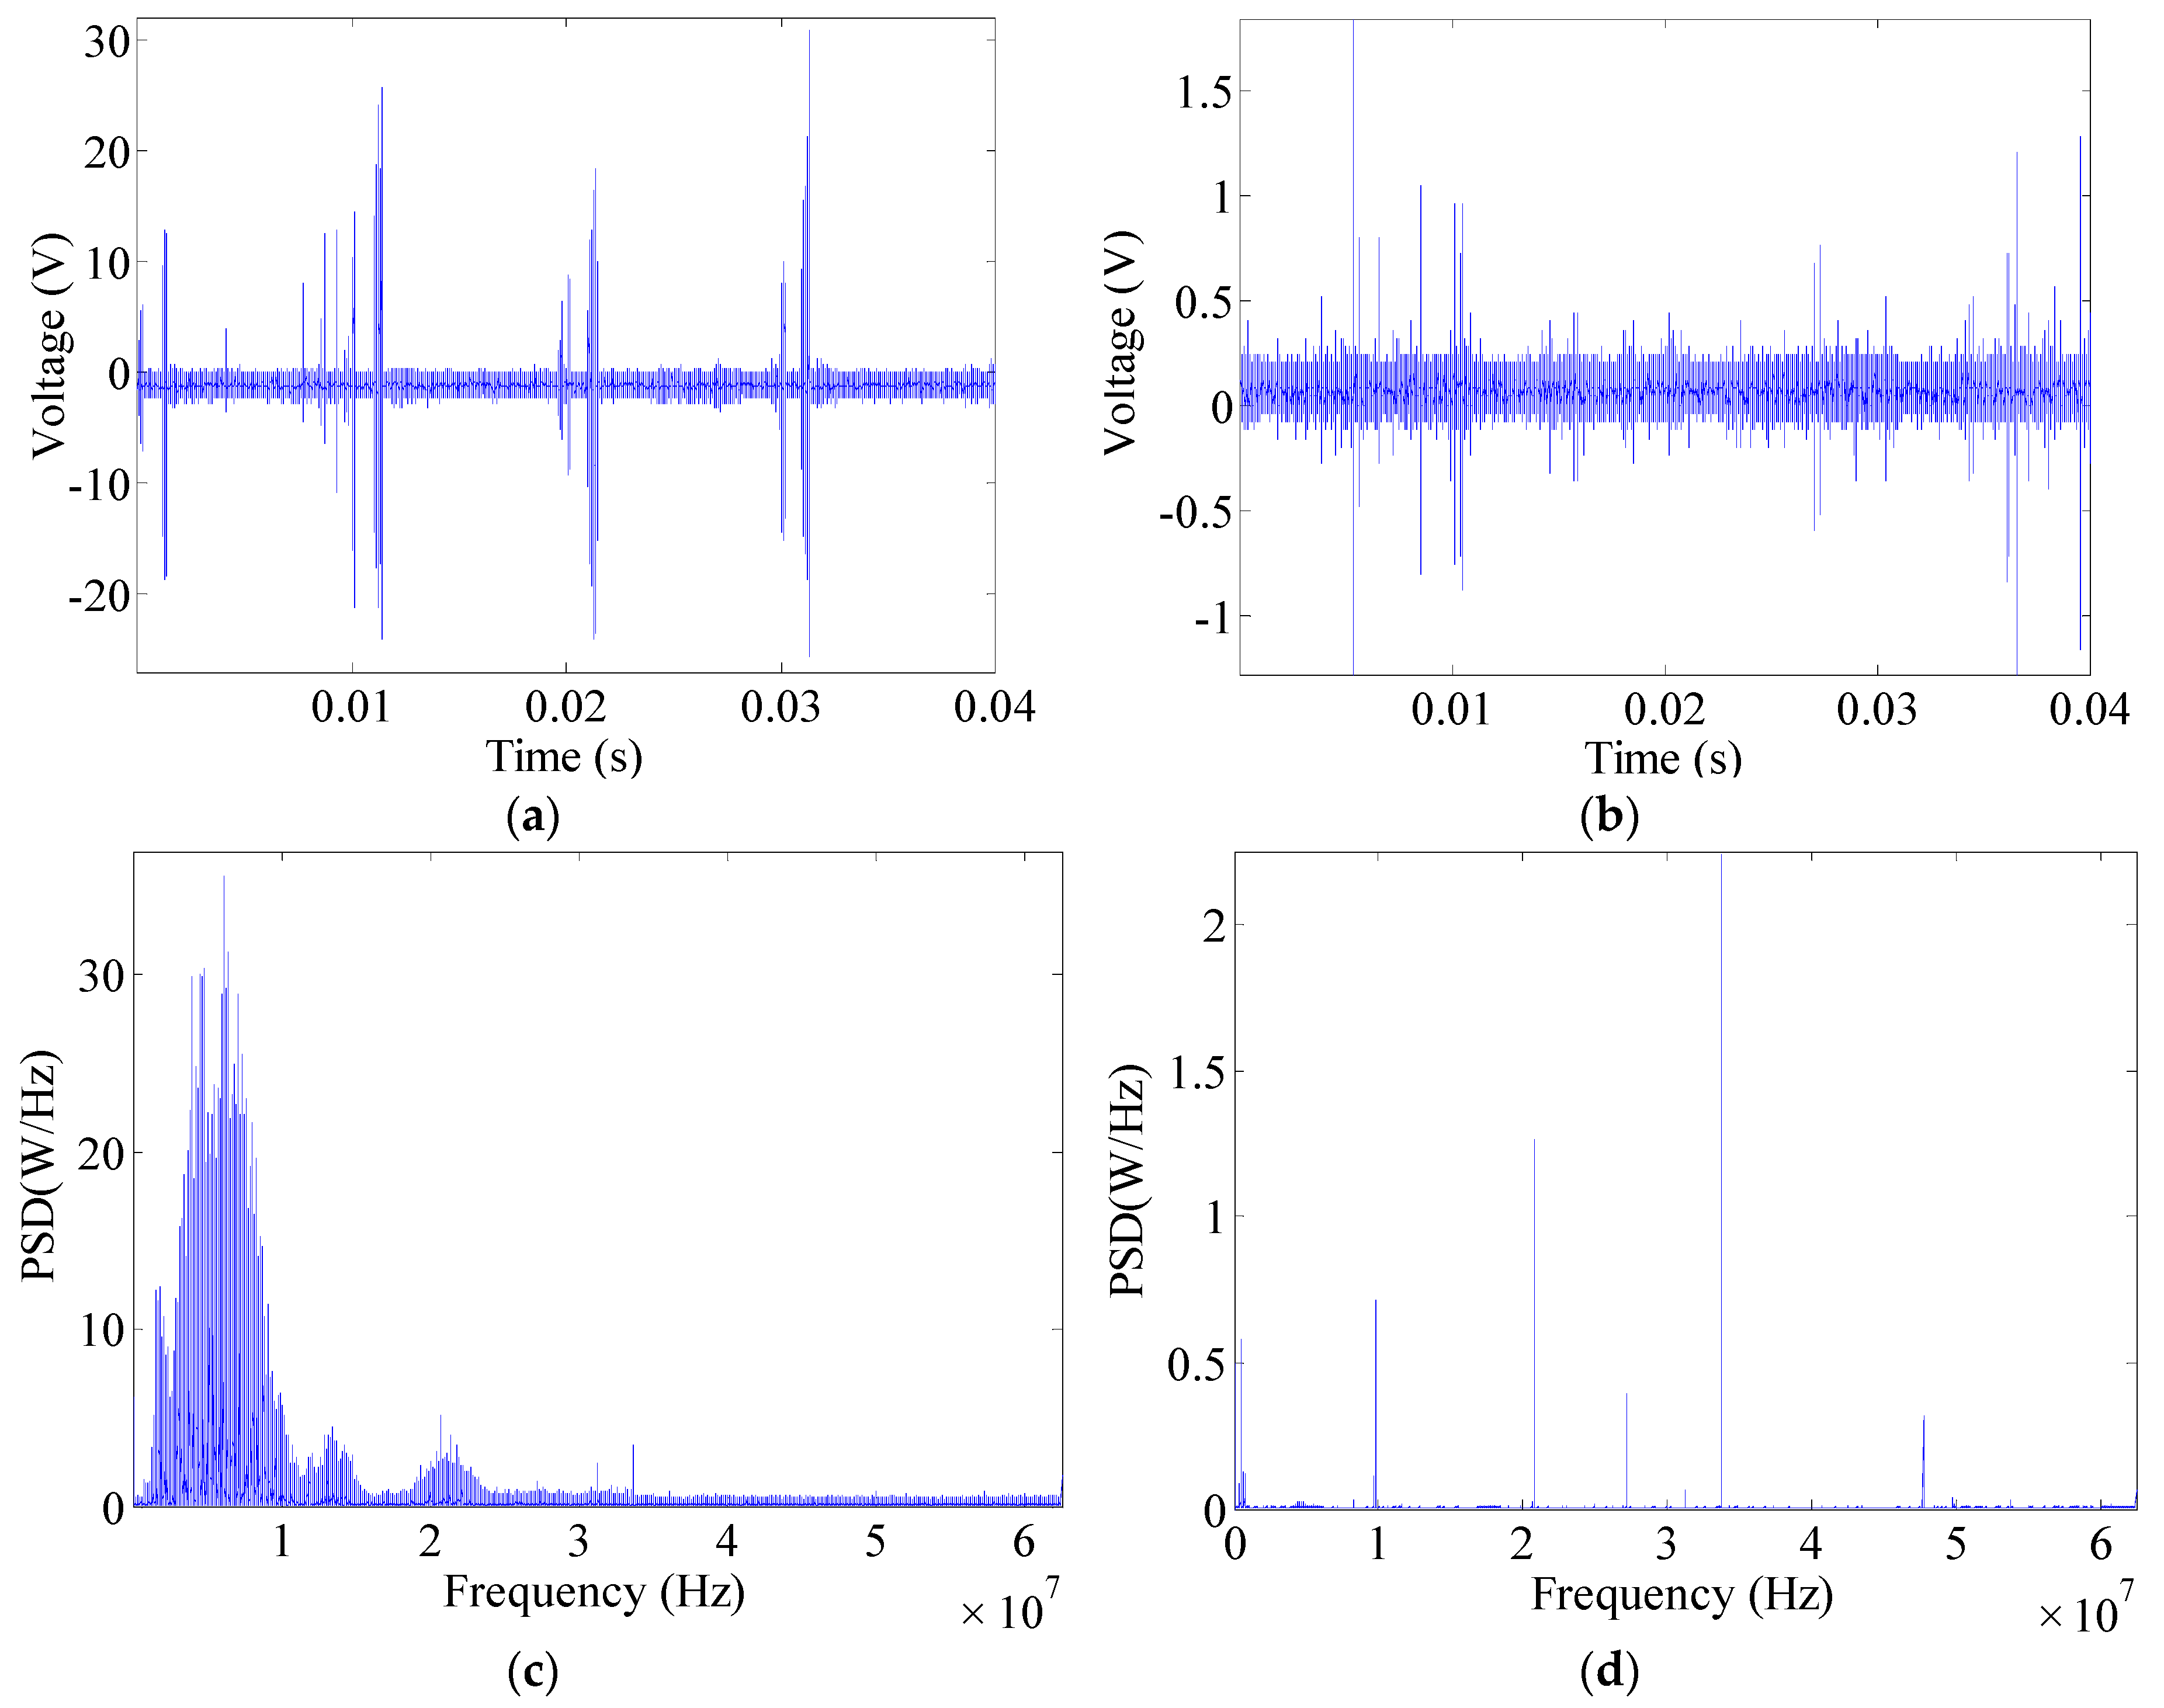
3.1.1. High-Frequency Signals and Power Spectra
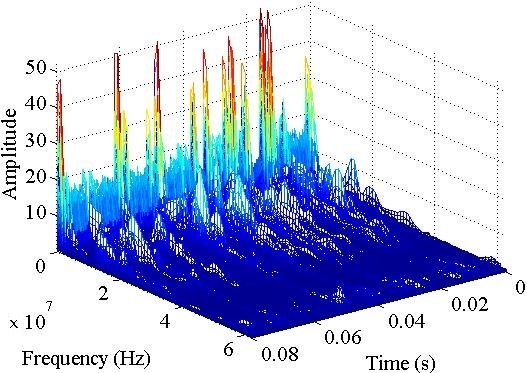
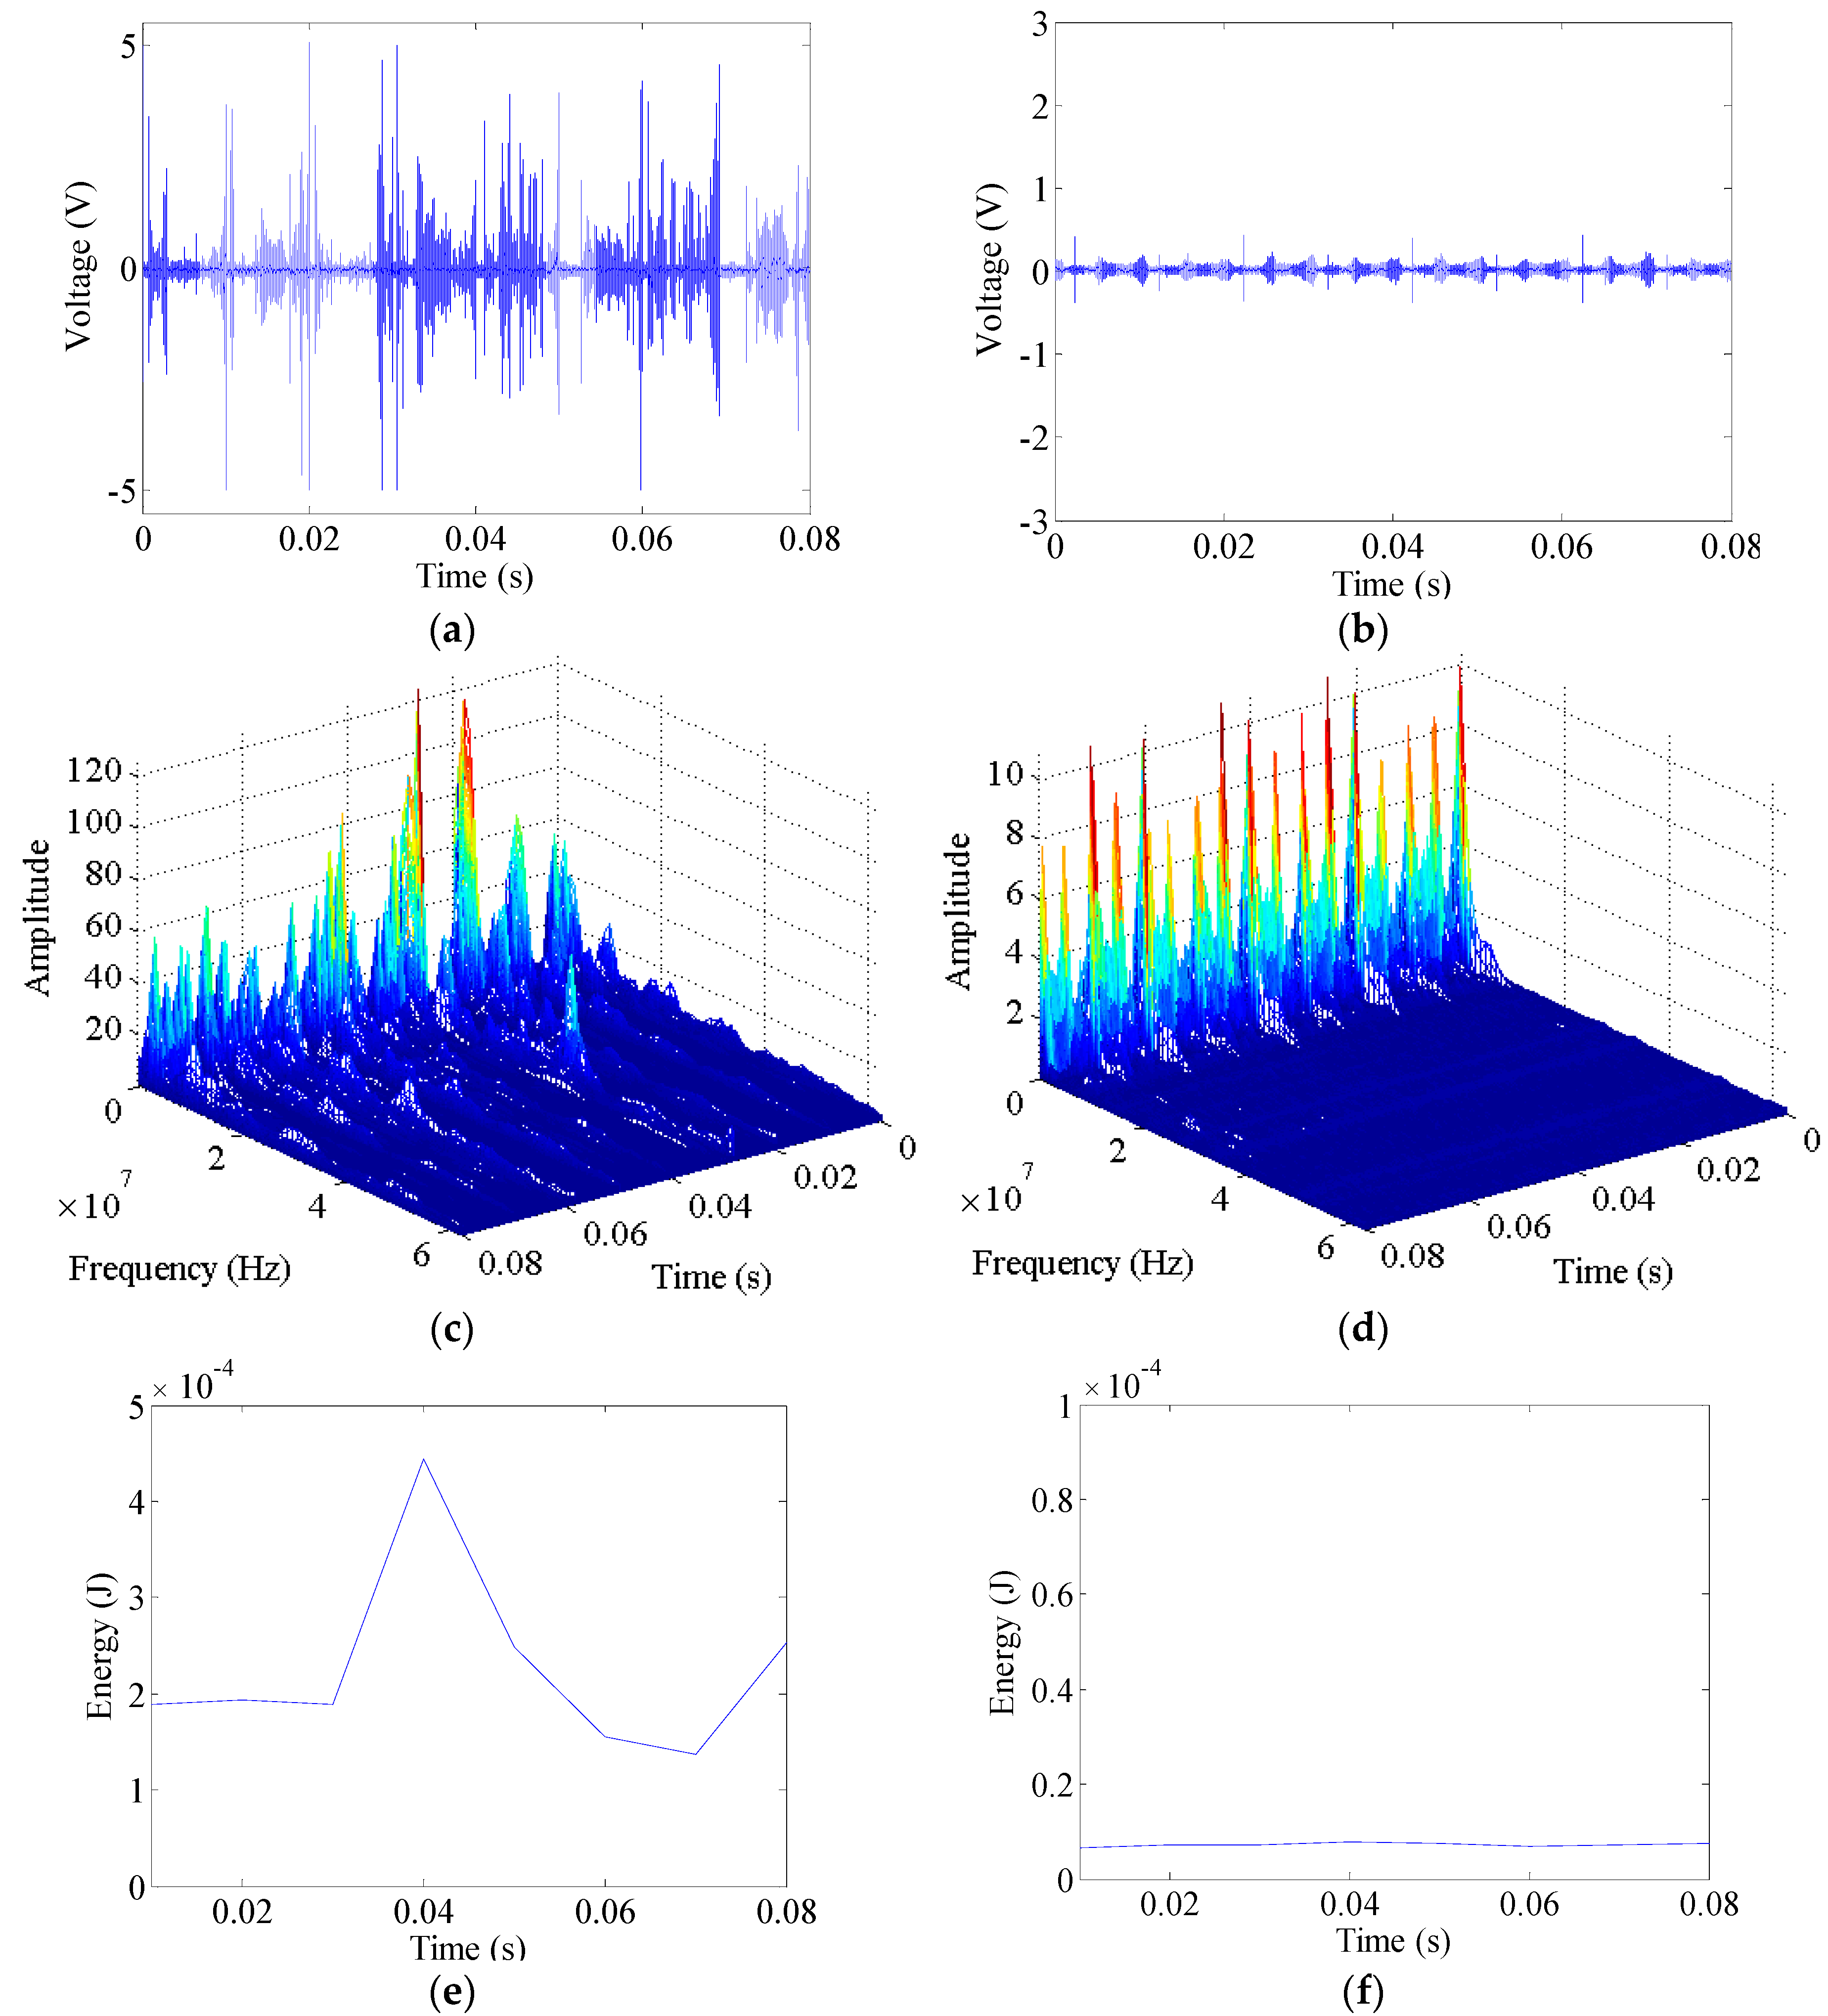
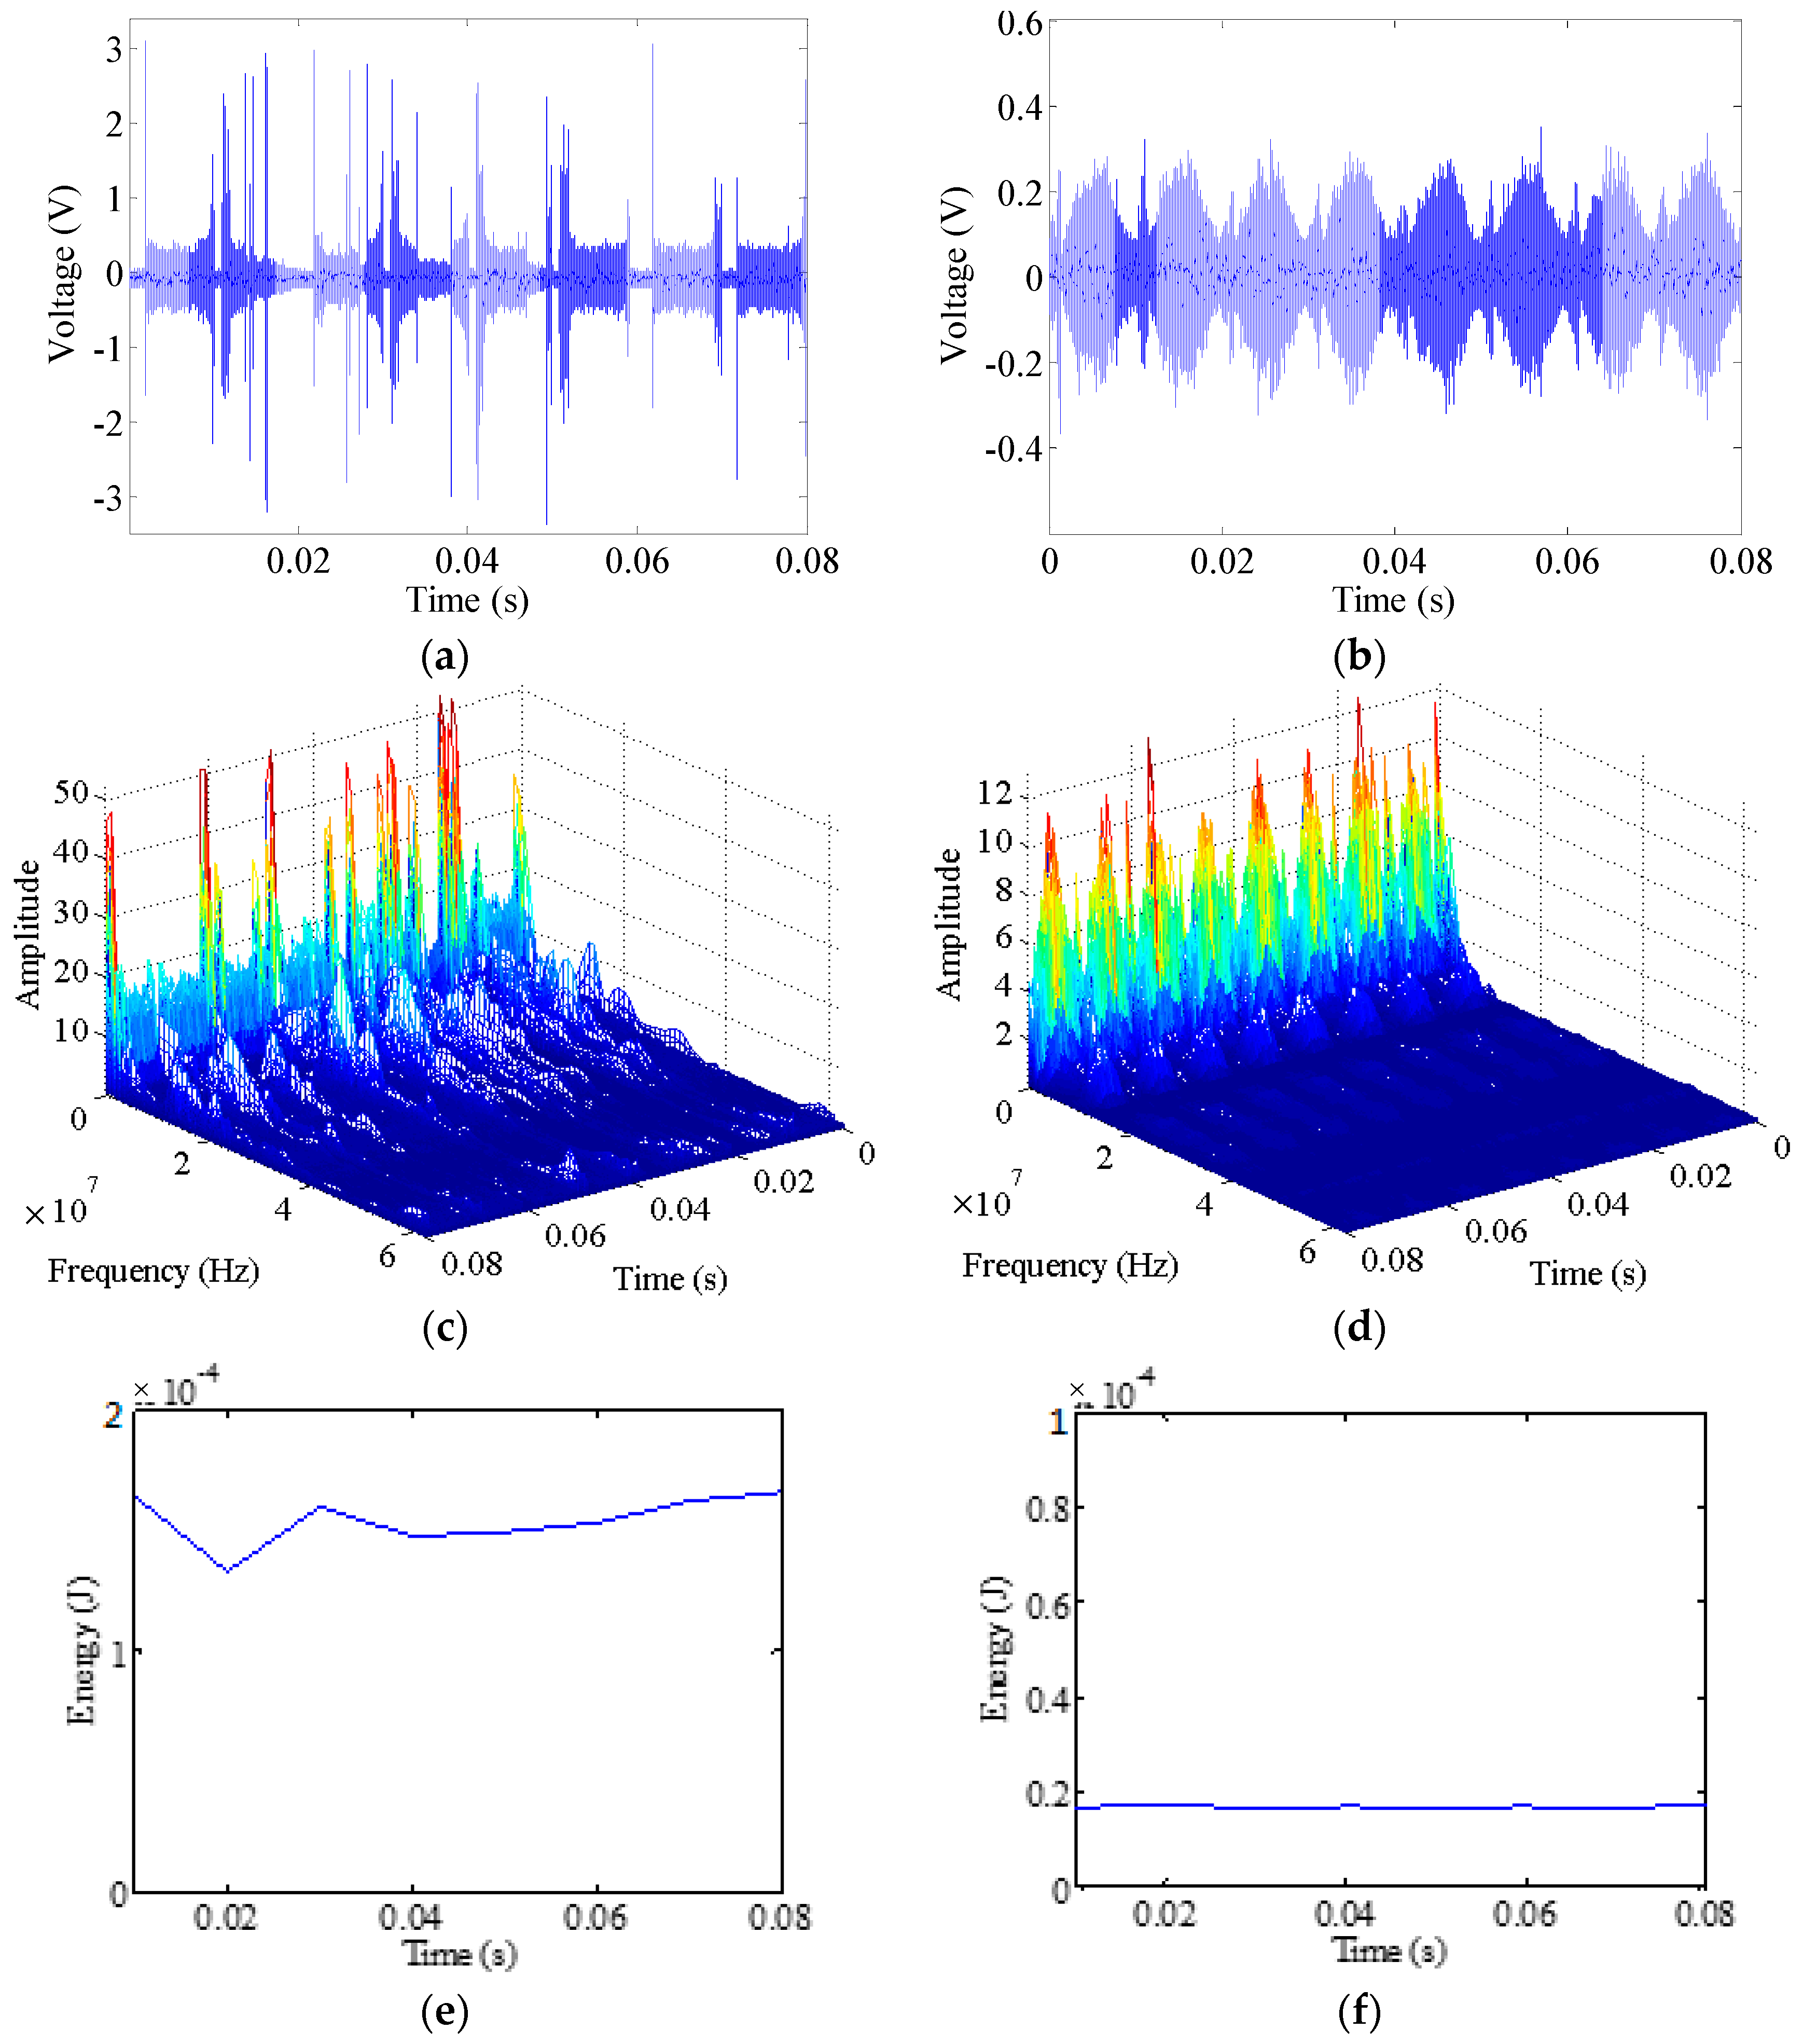
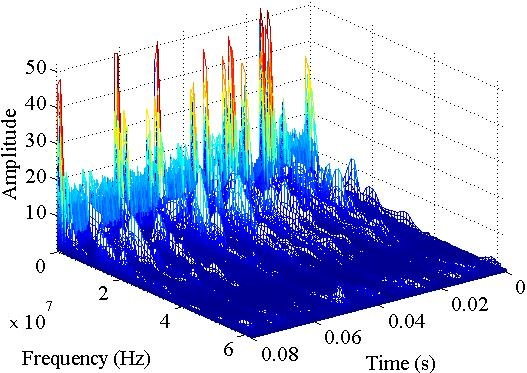
3.1.2. Short-Time Fourier Transform (STFT) of High-Frequency Signals
3.1.3. The Periodic Energy of High-Frequency Signals
3.2. Current Analysis
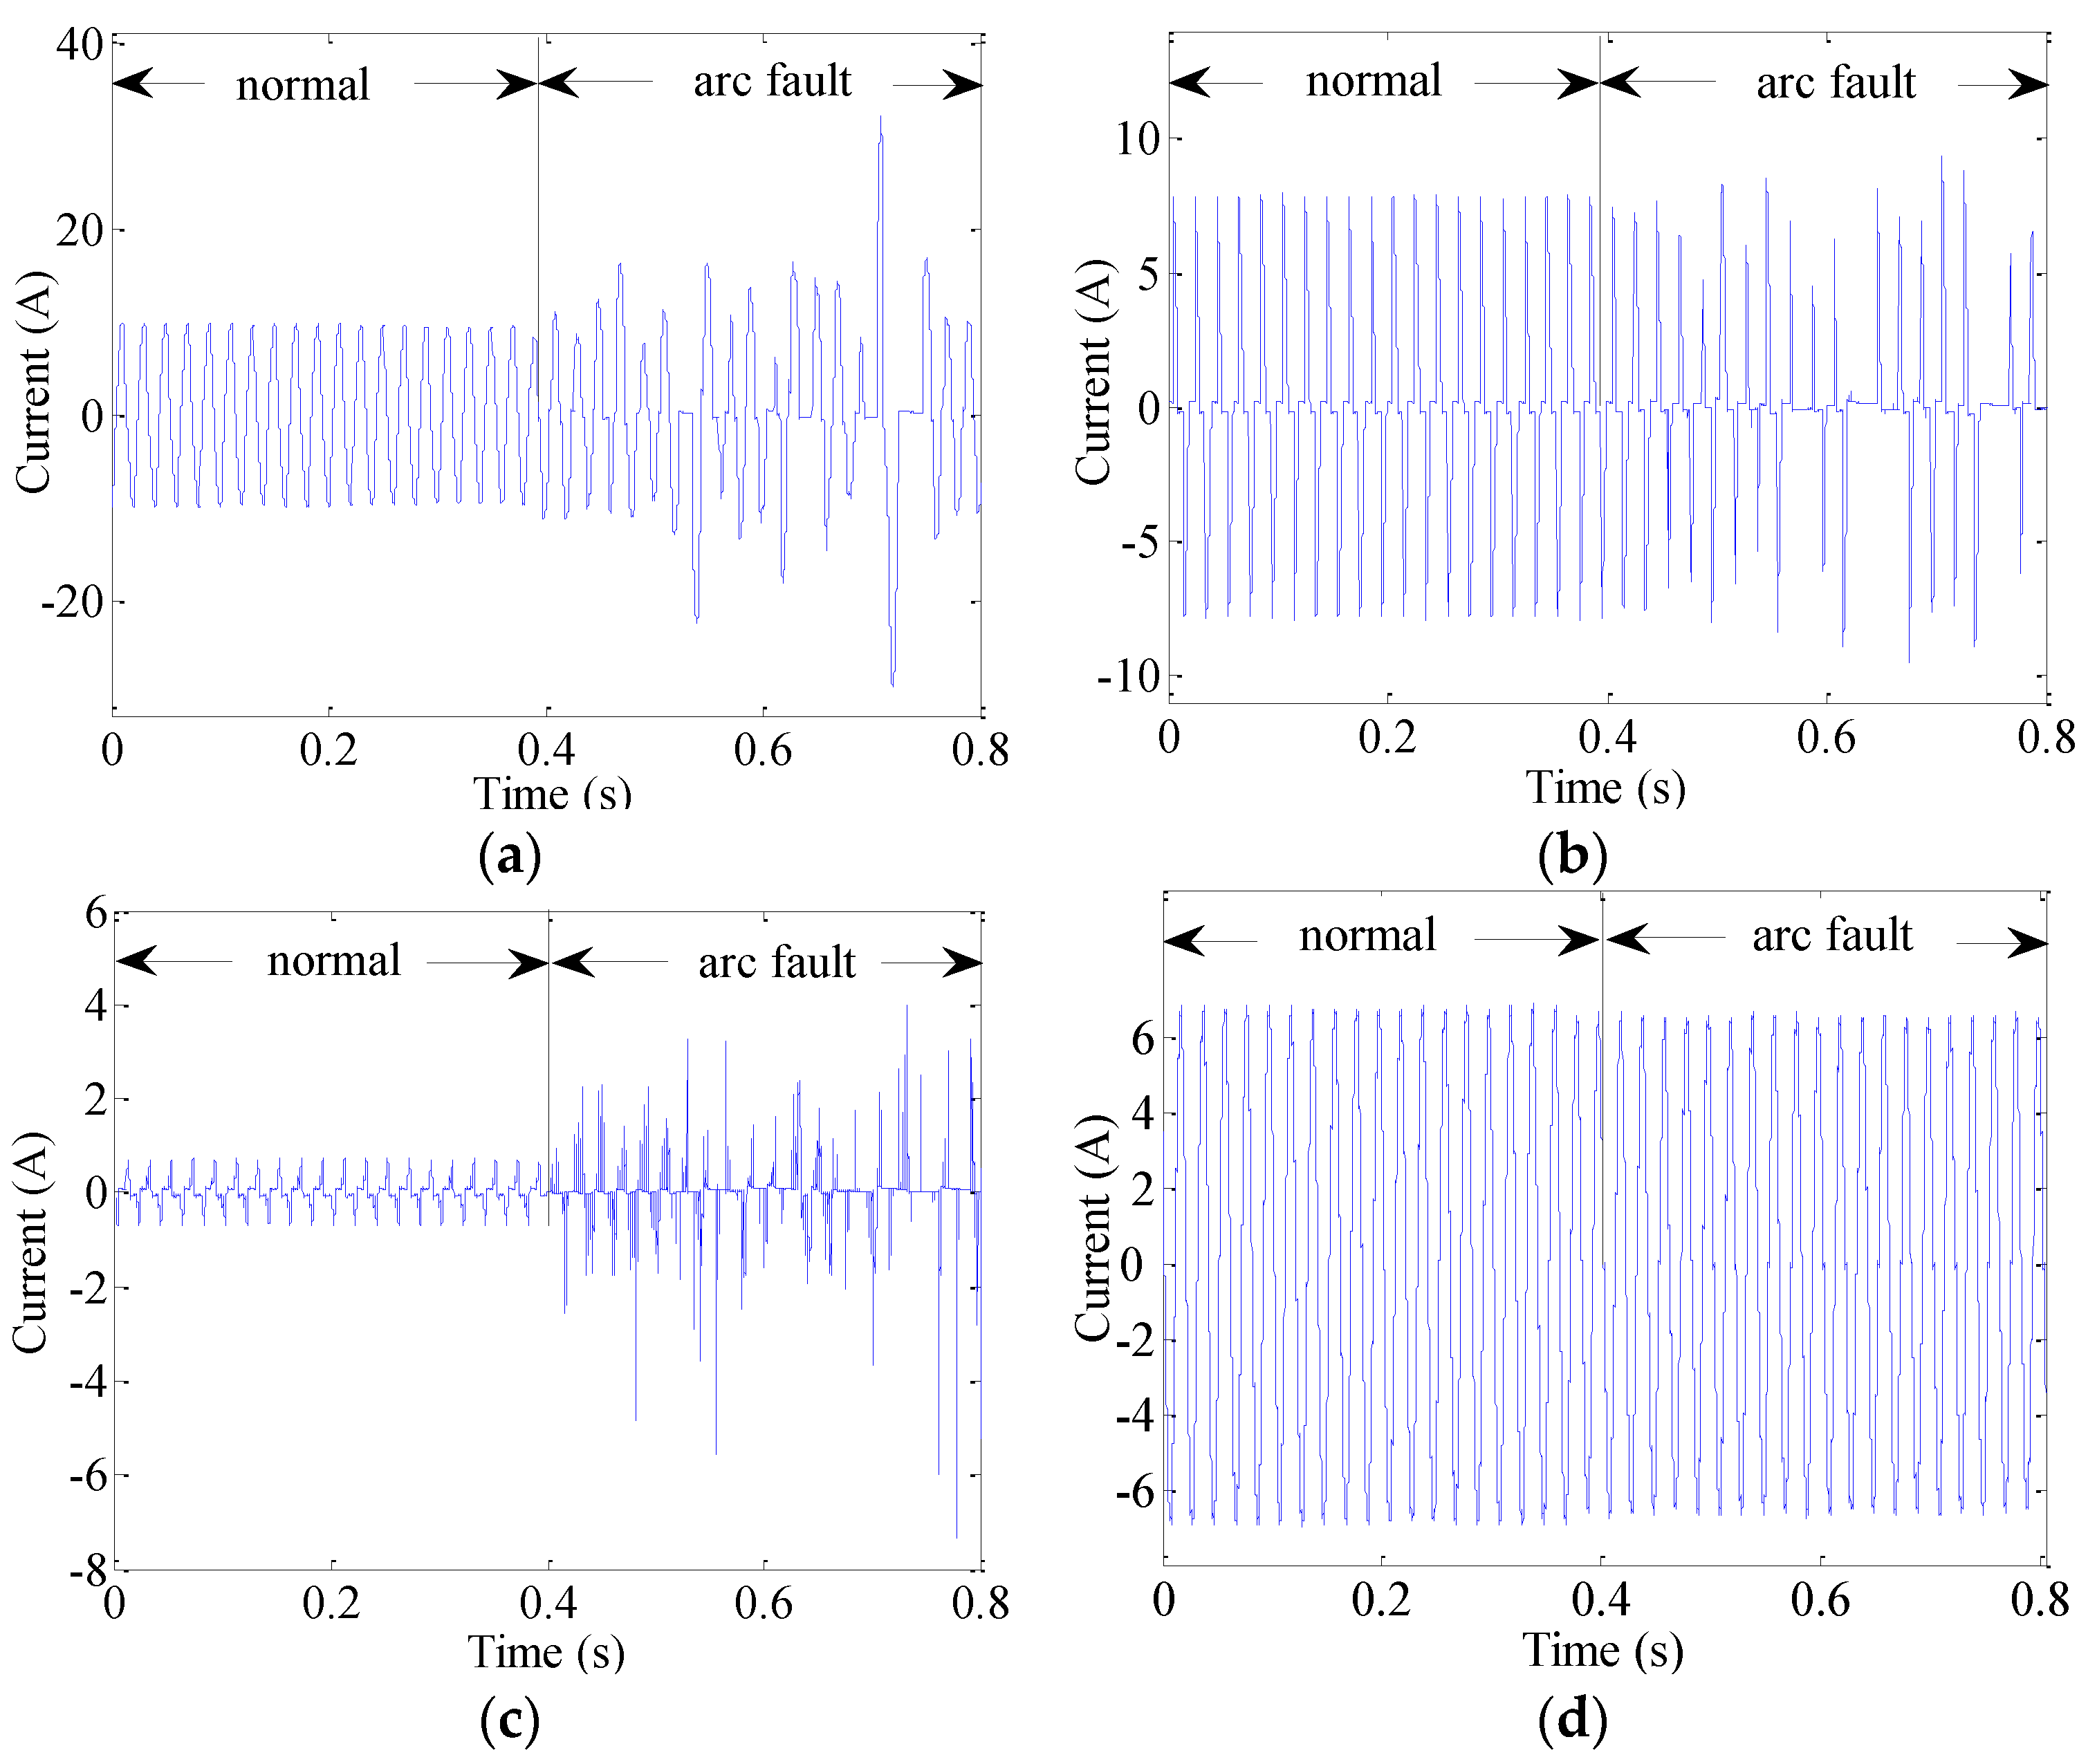
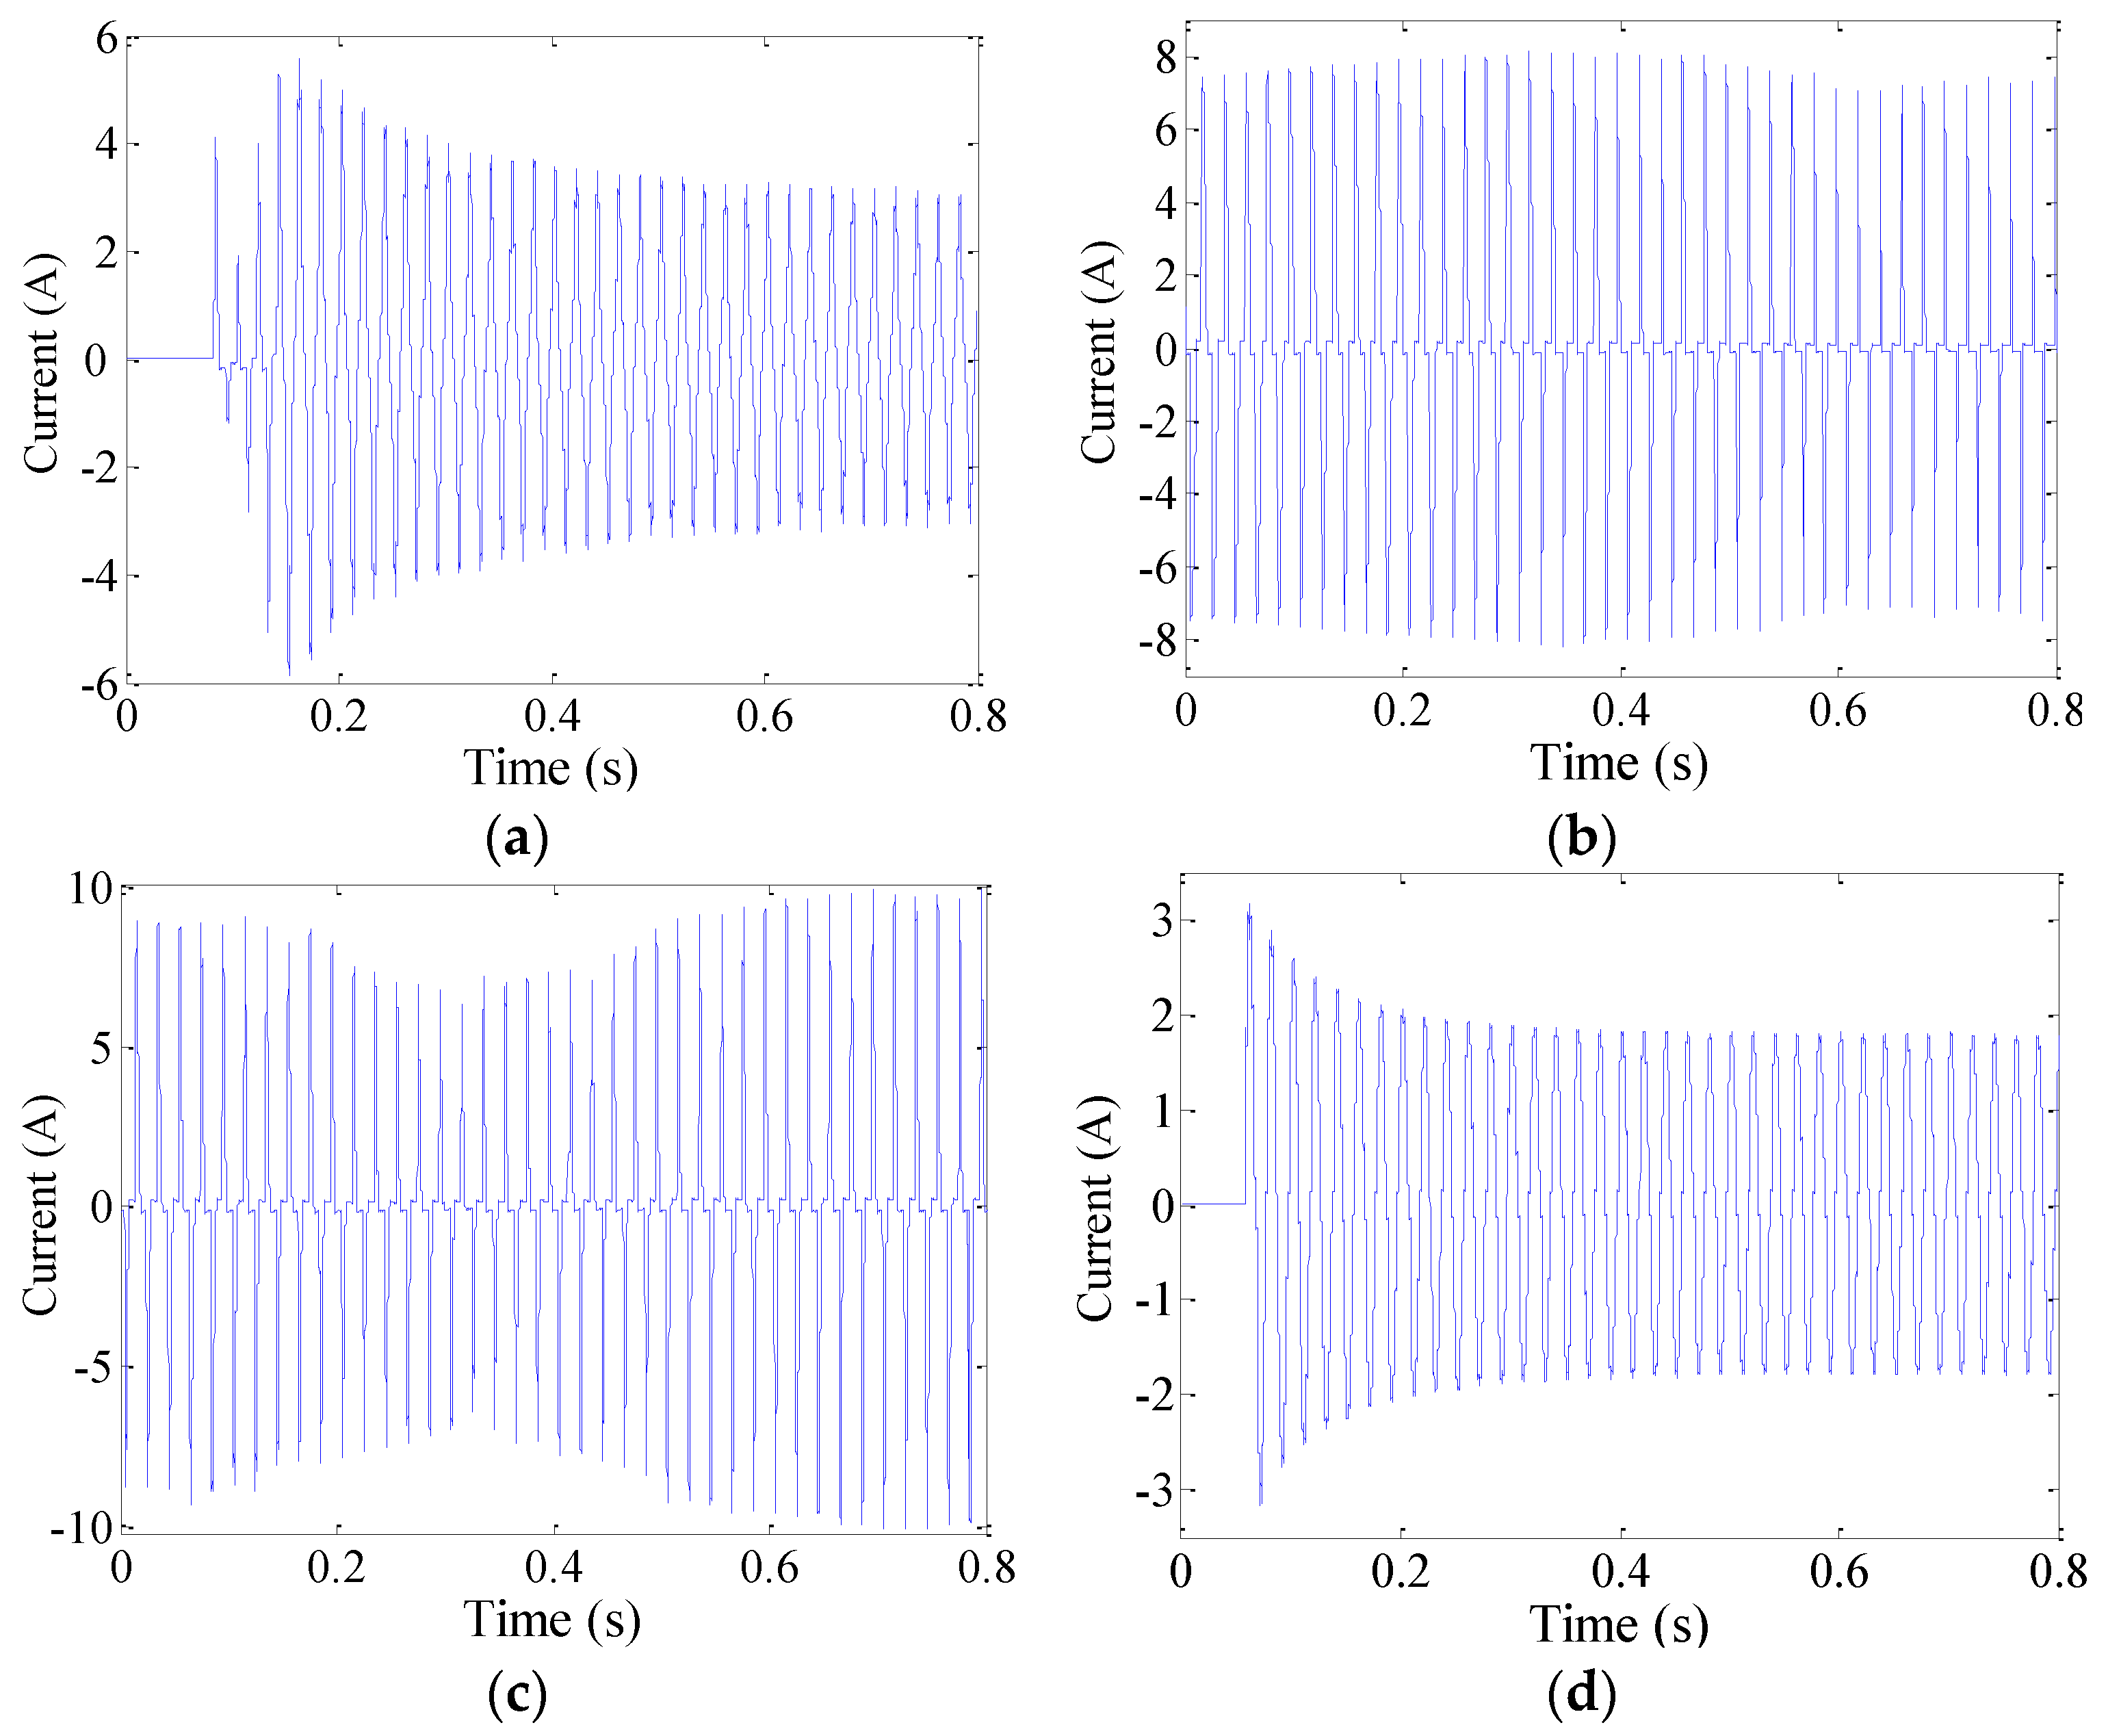
3.2.1. Typical Load Currents
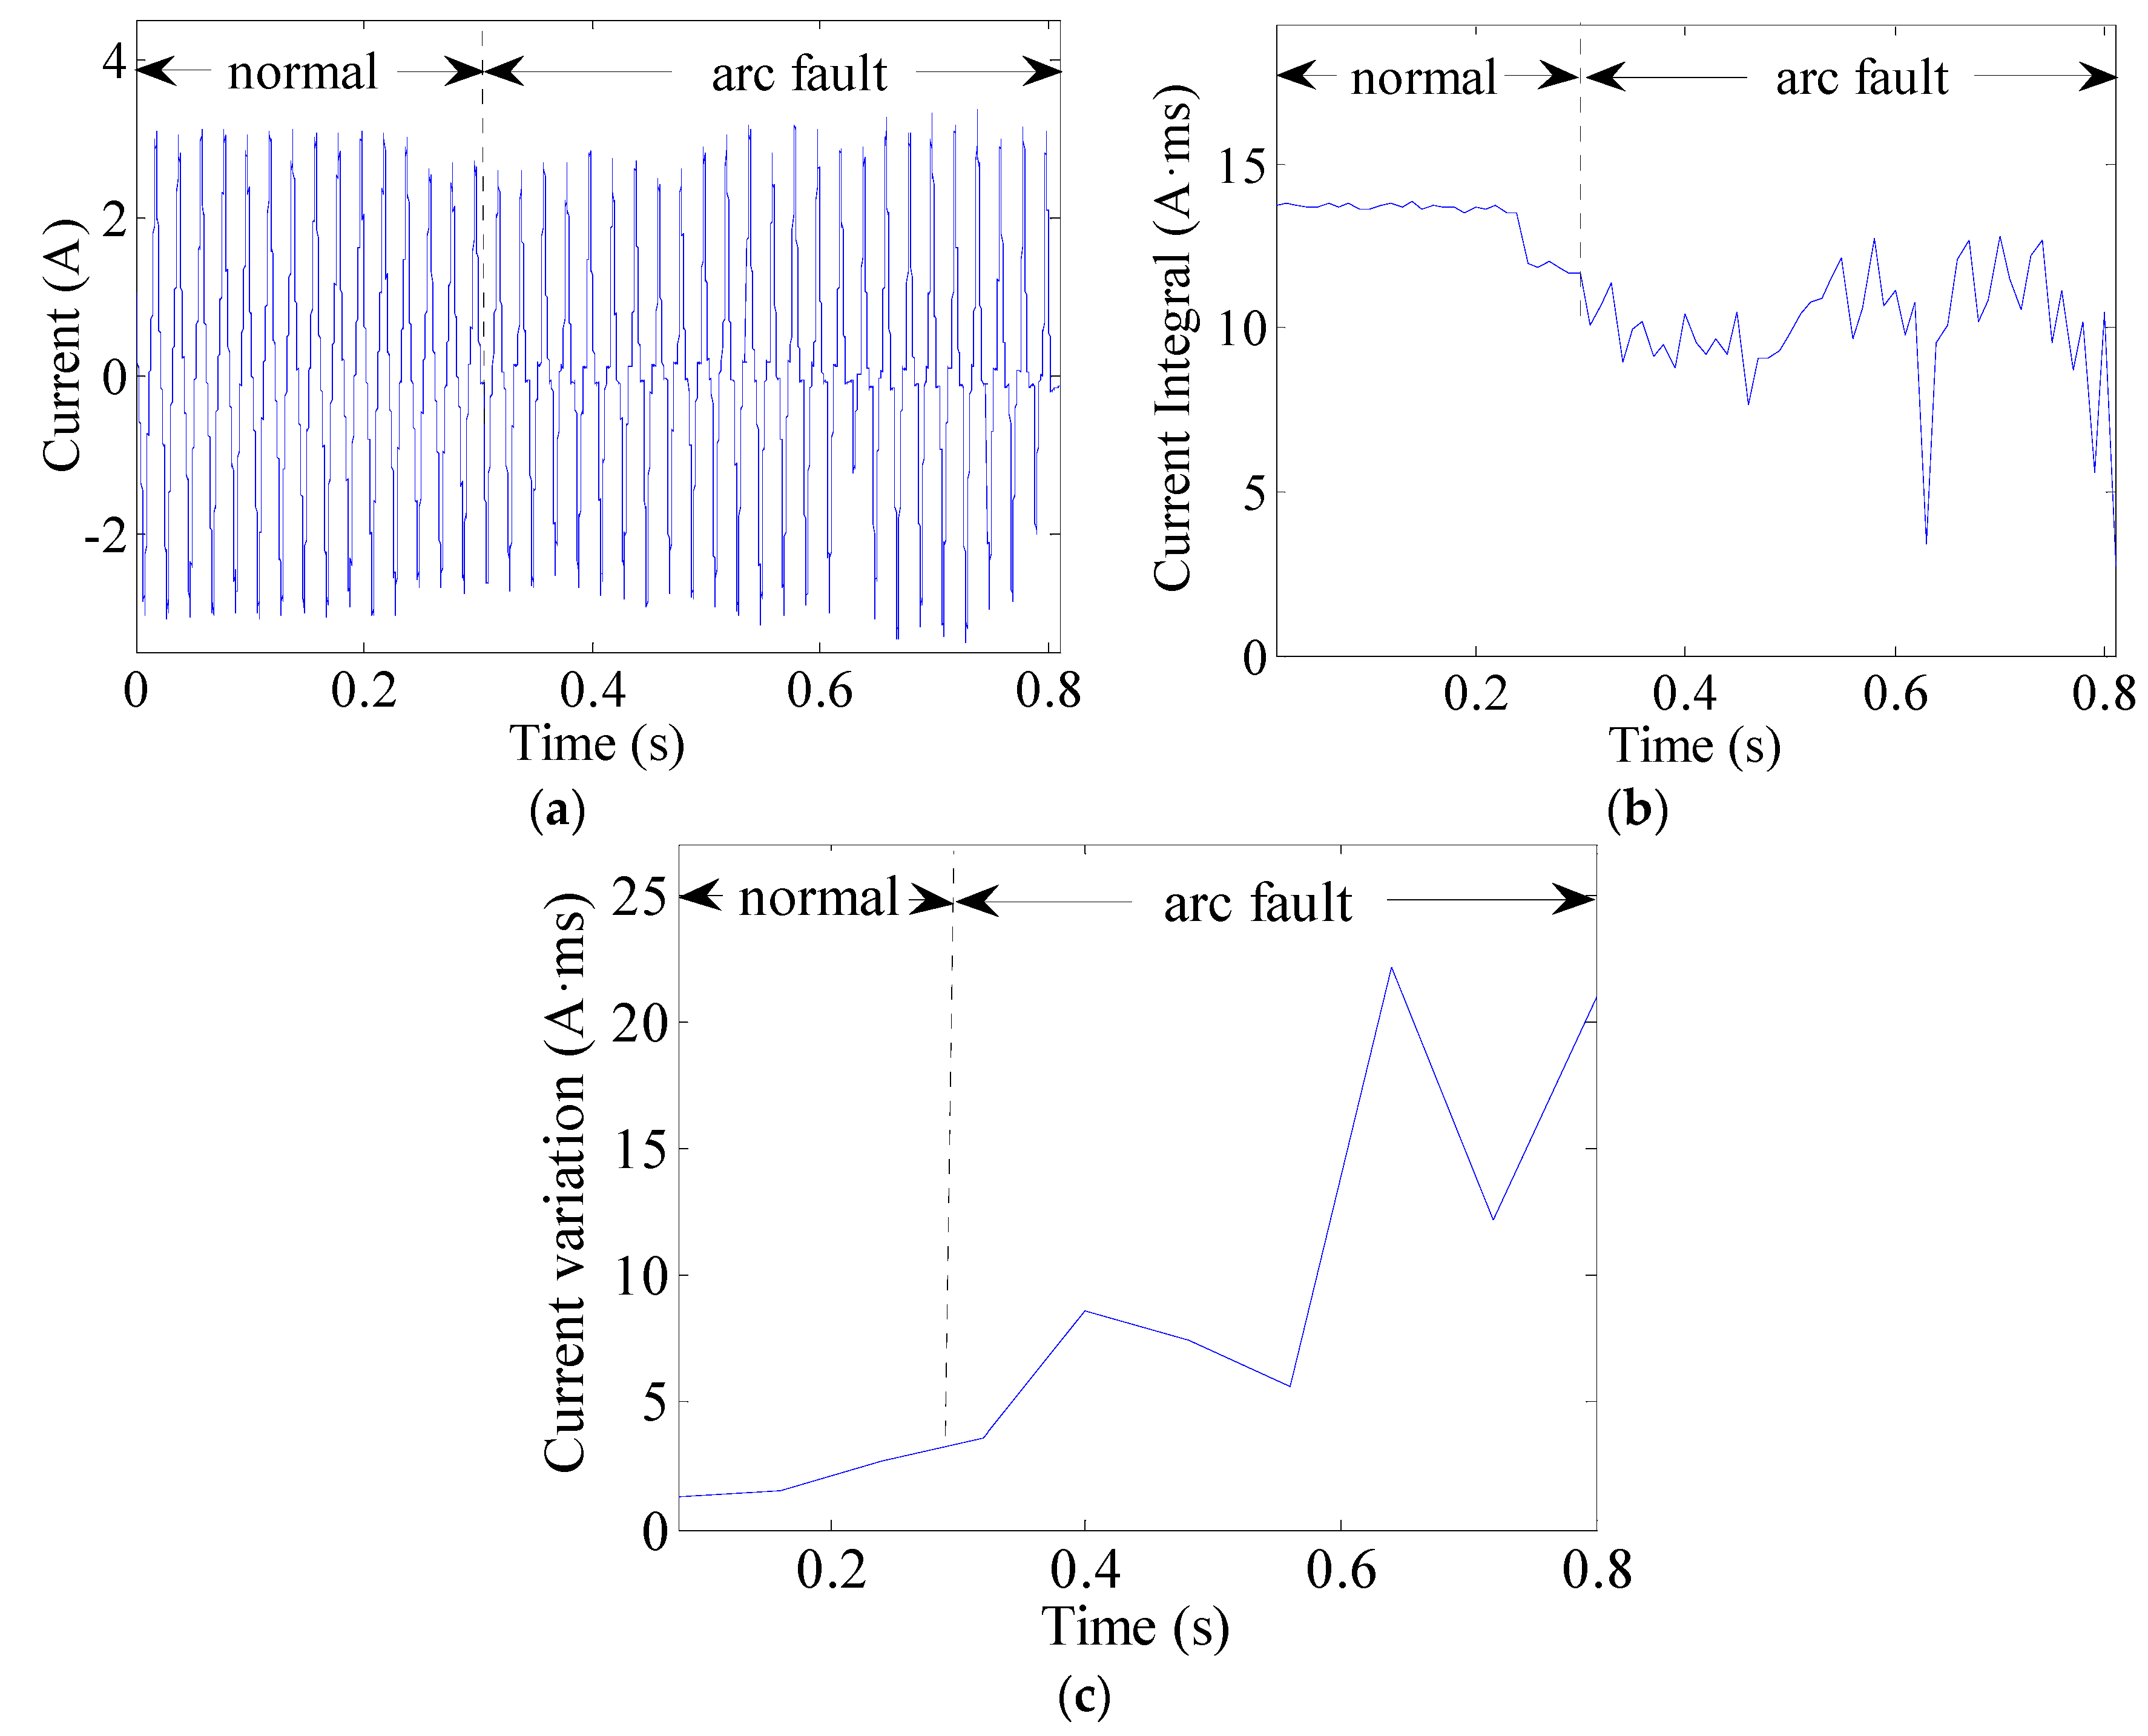
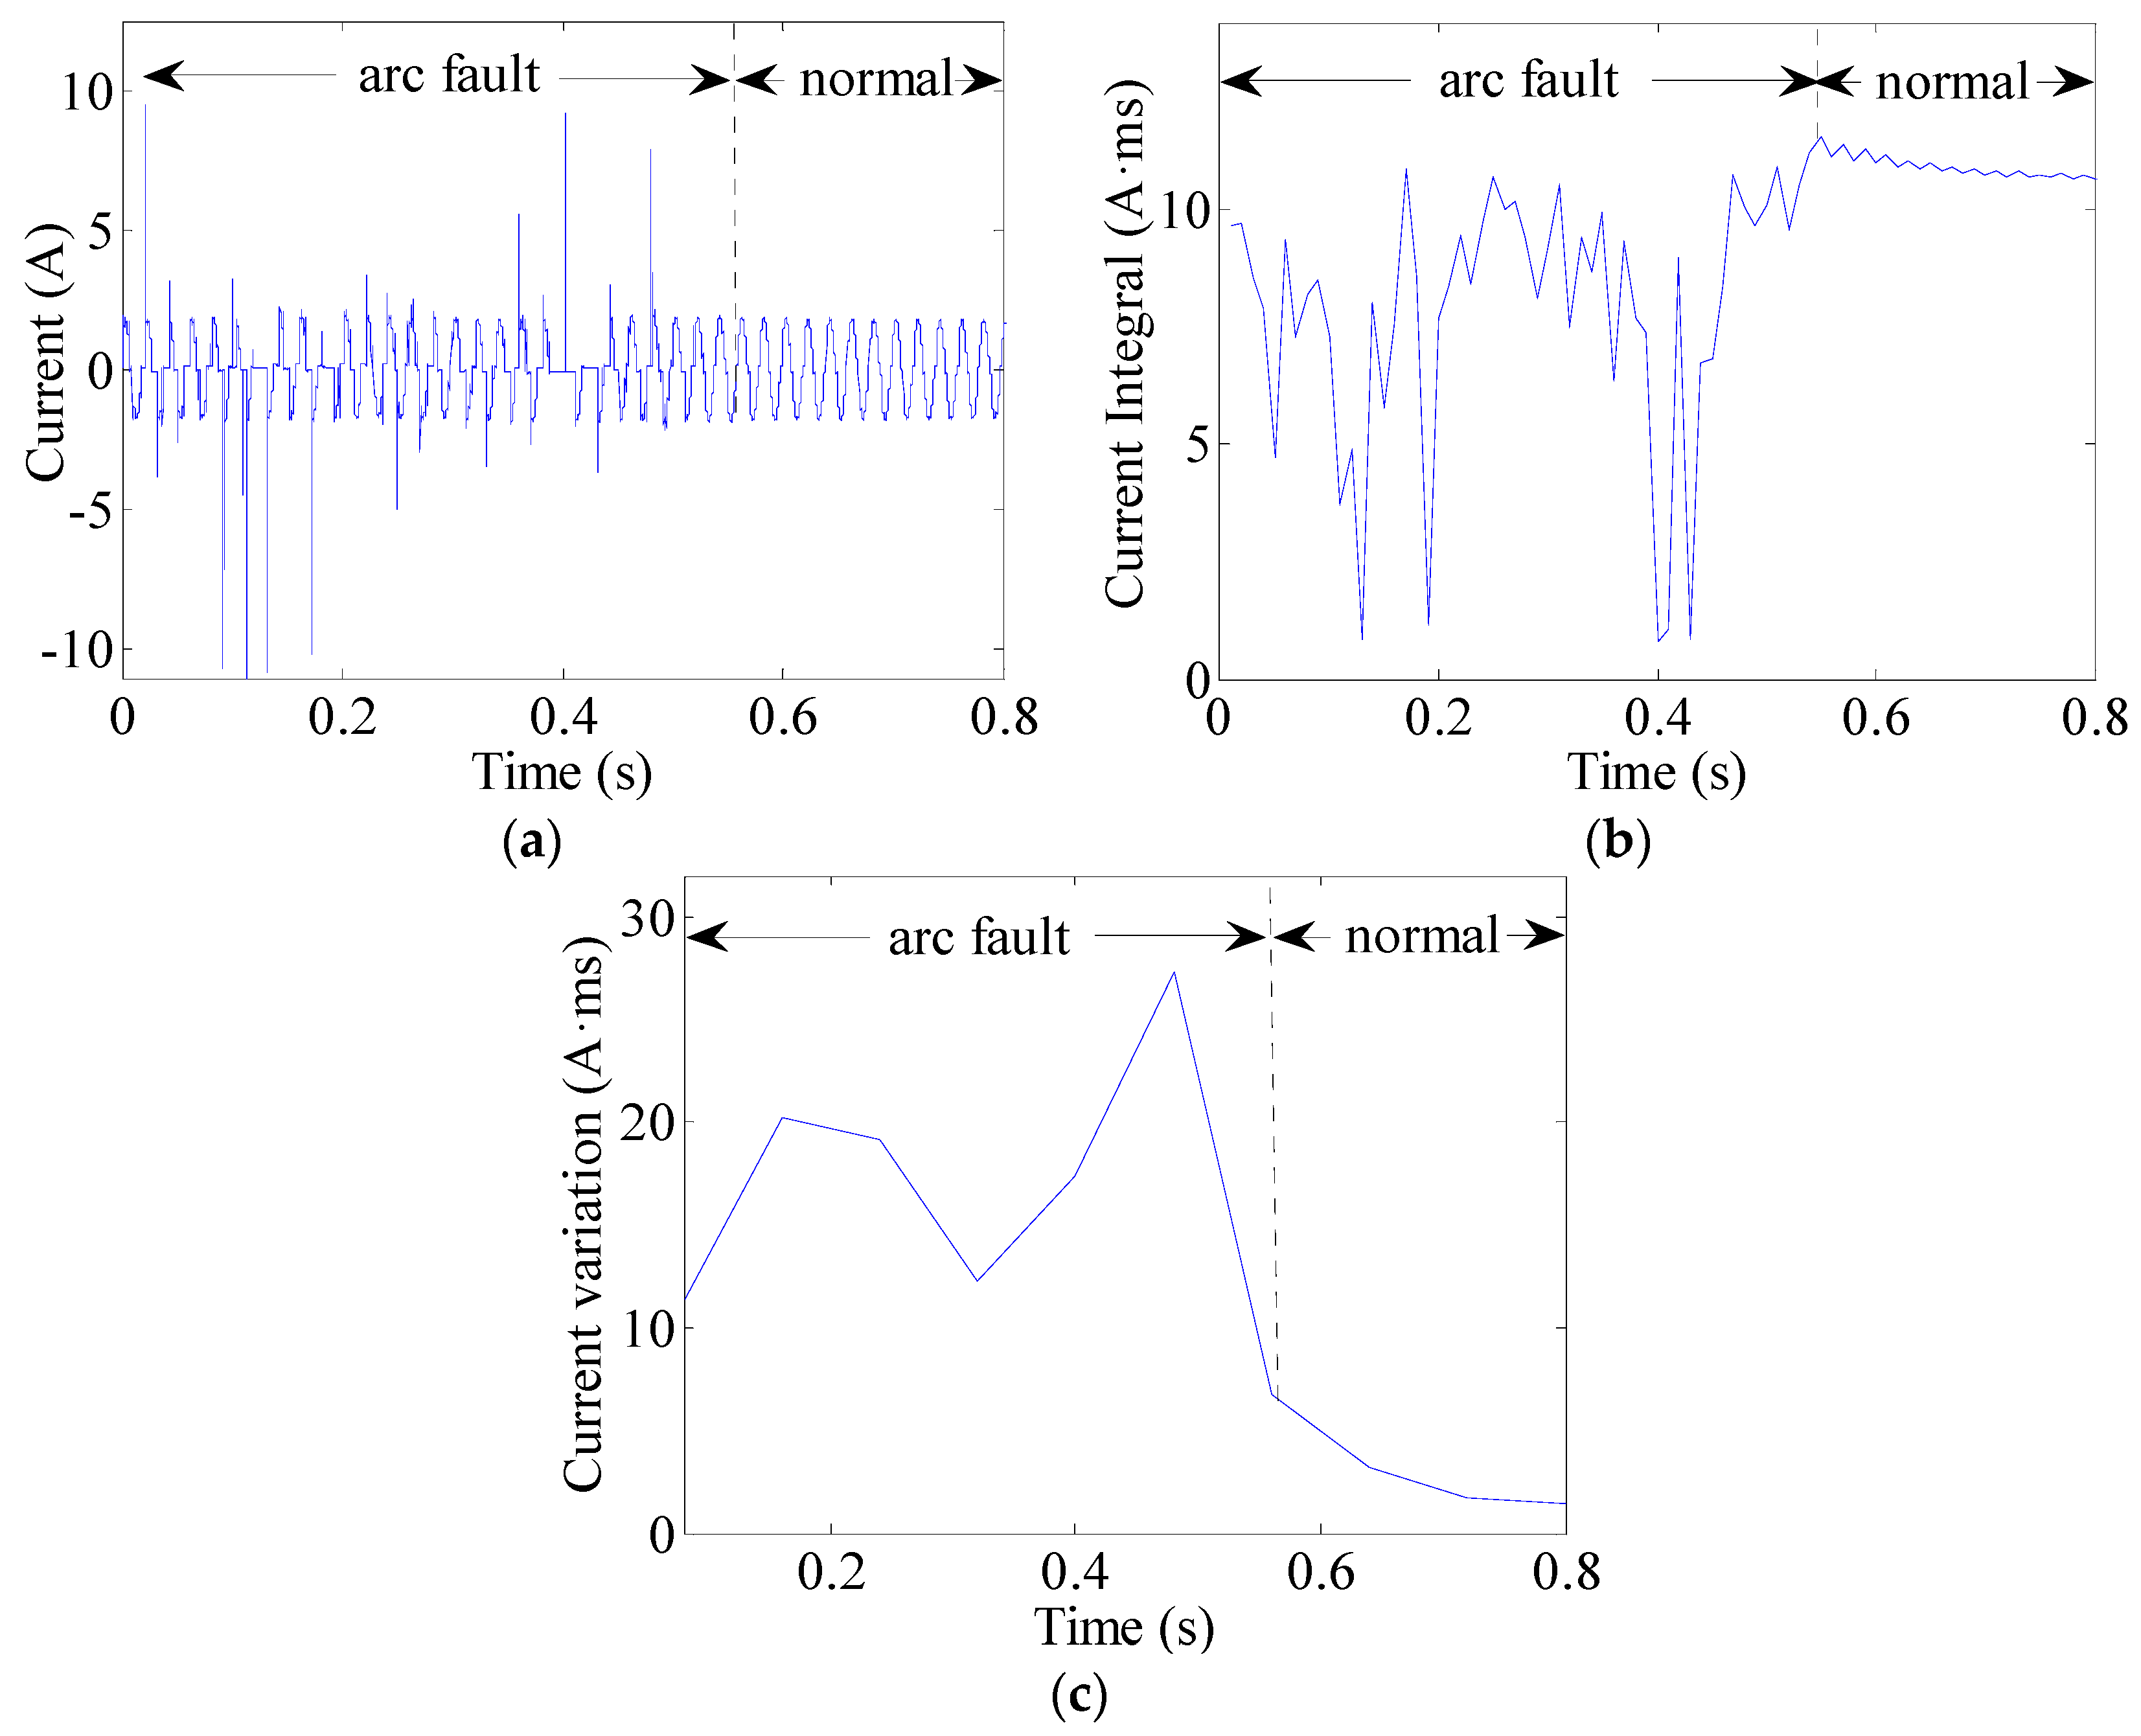
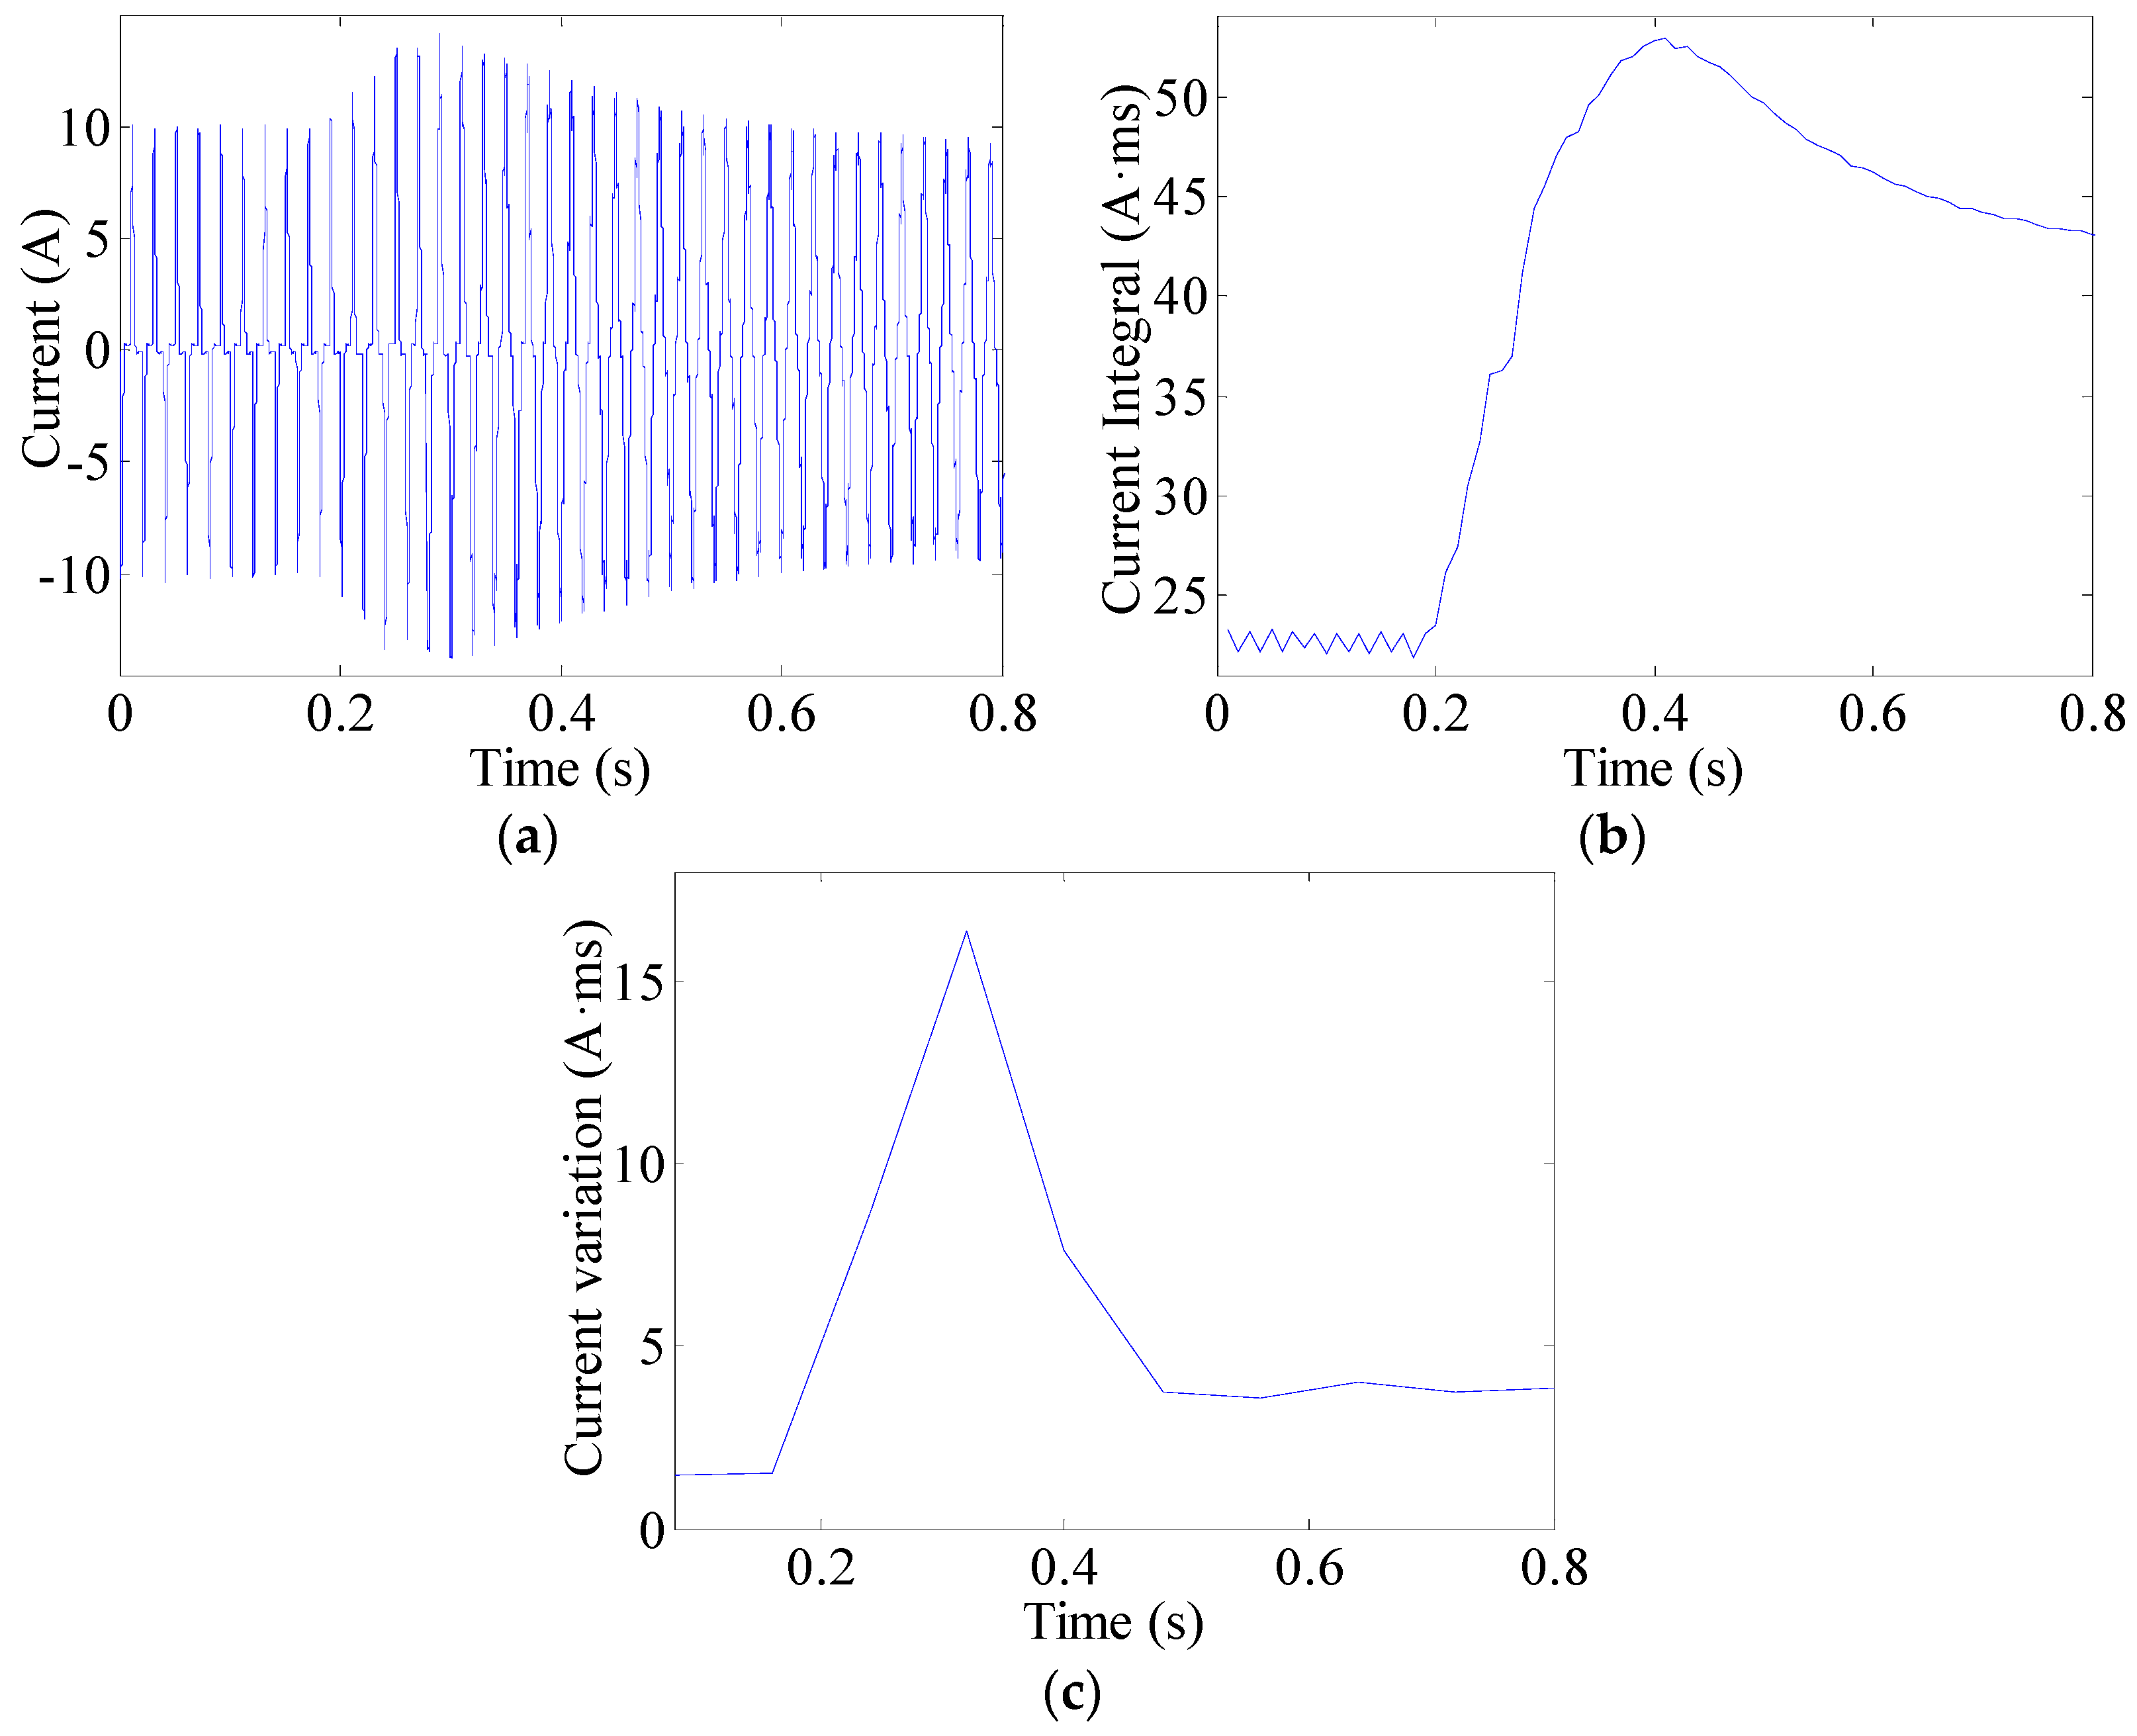
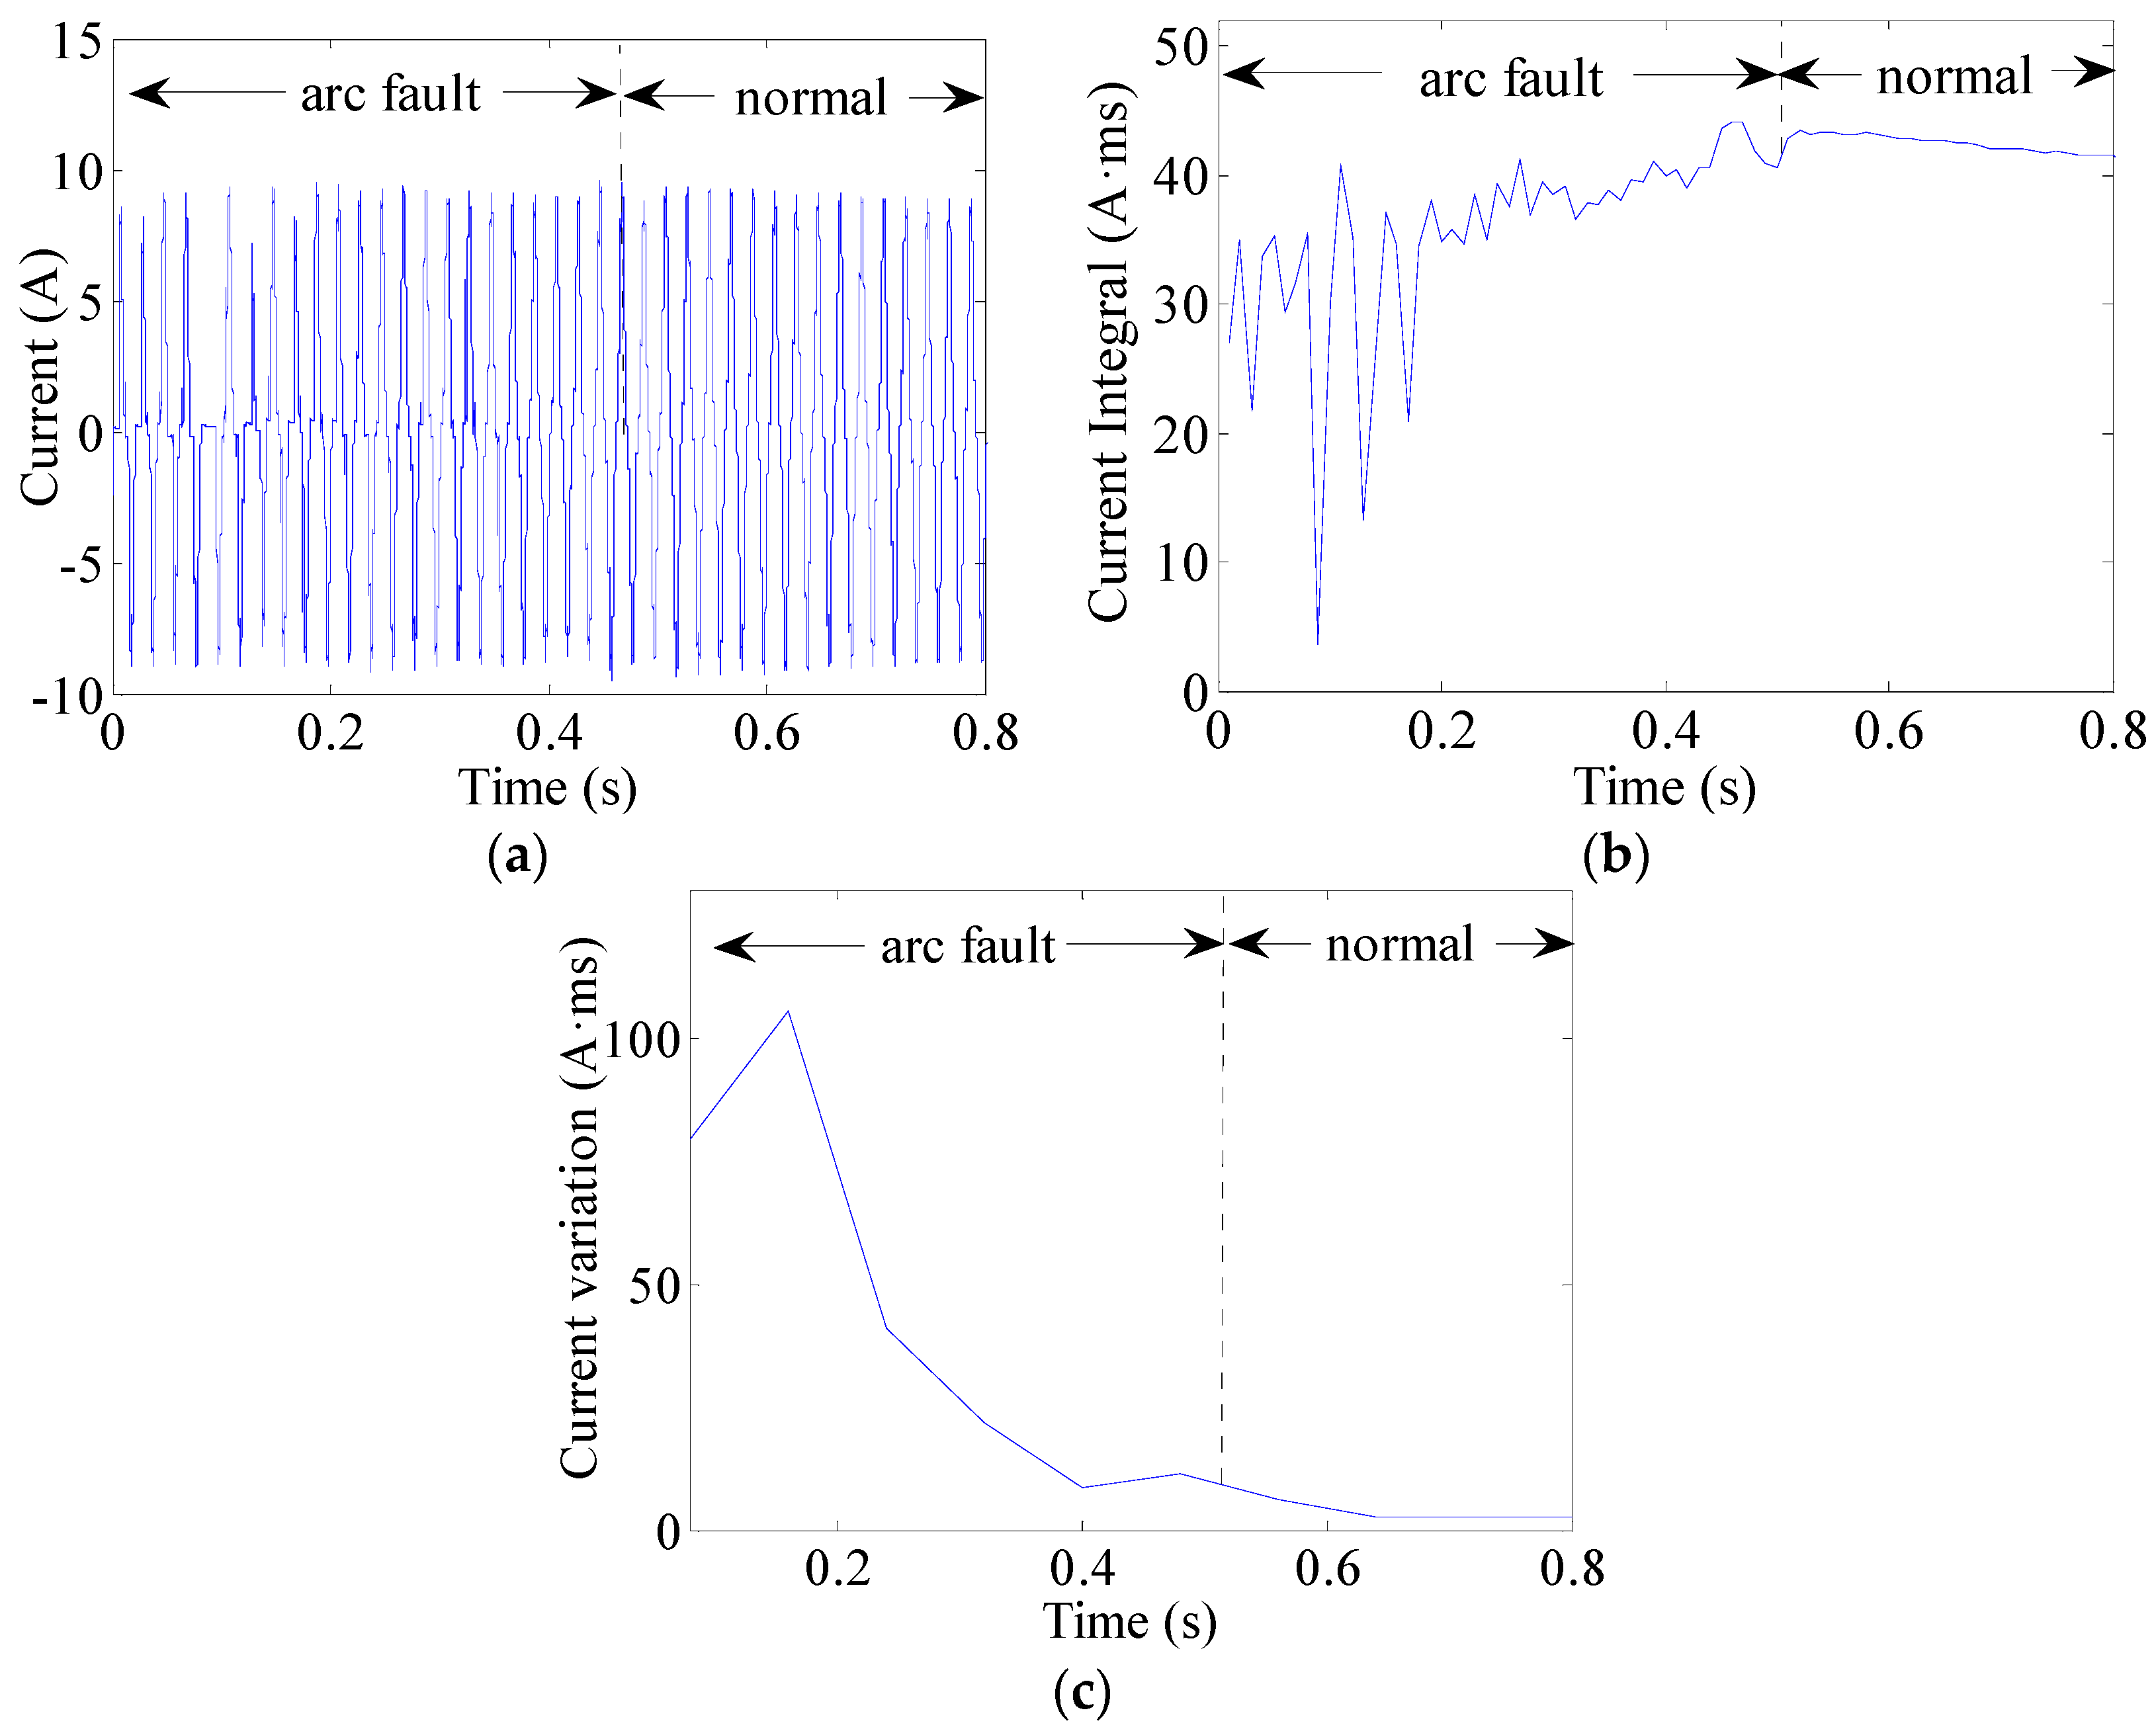
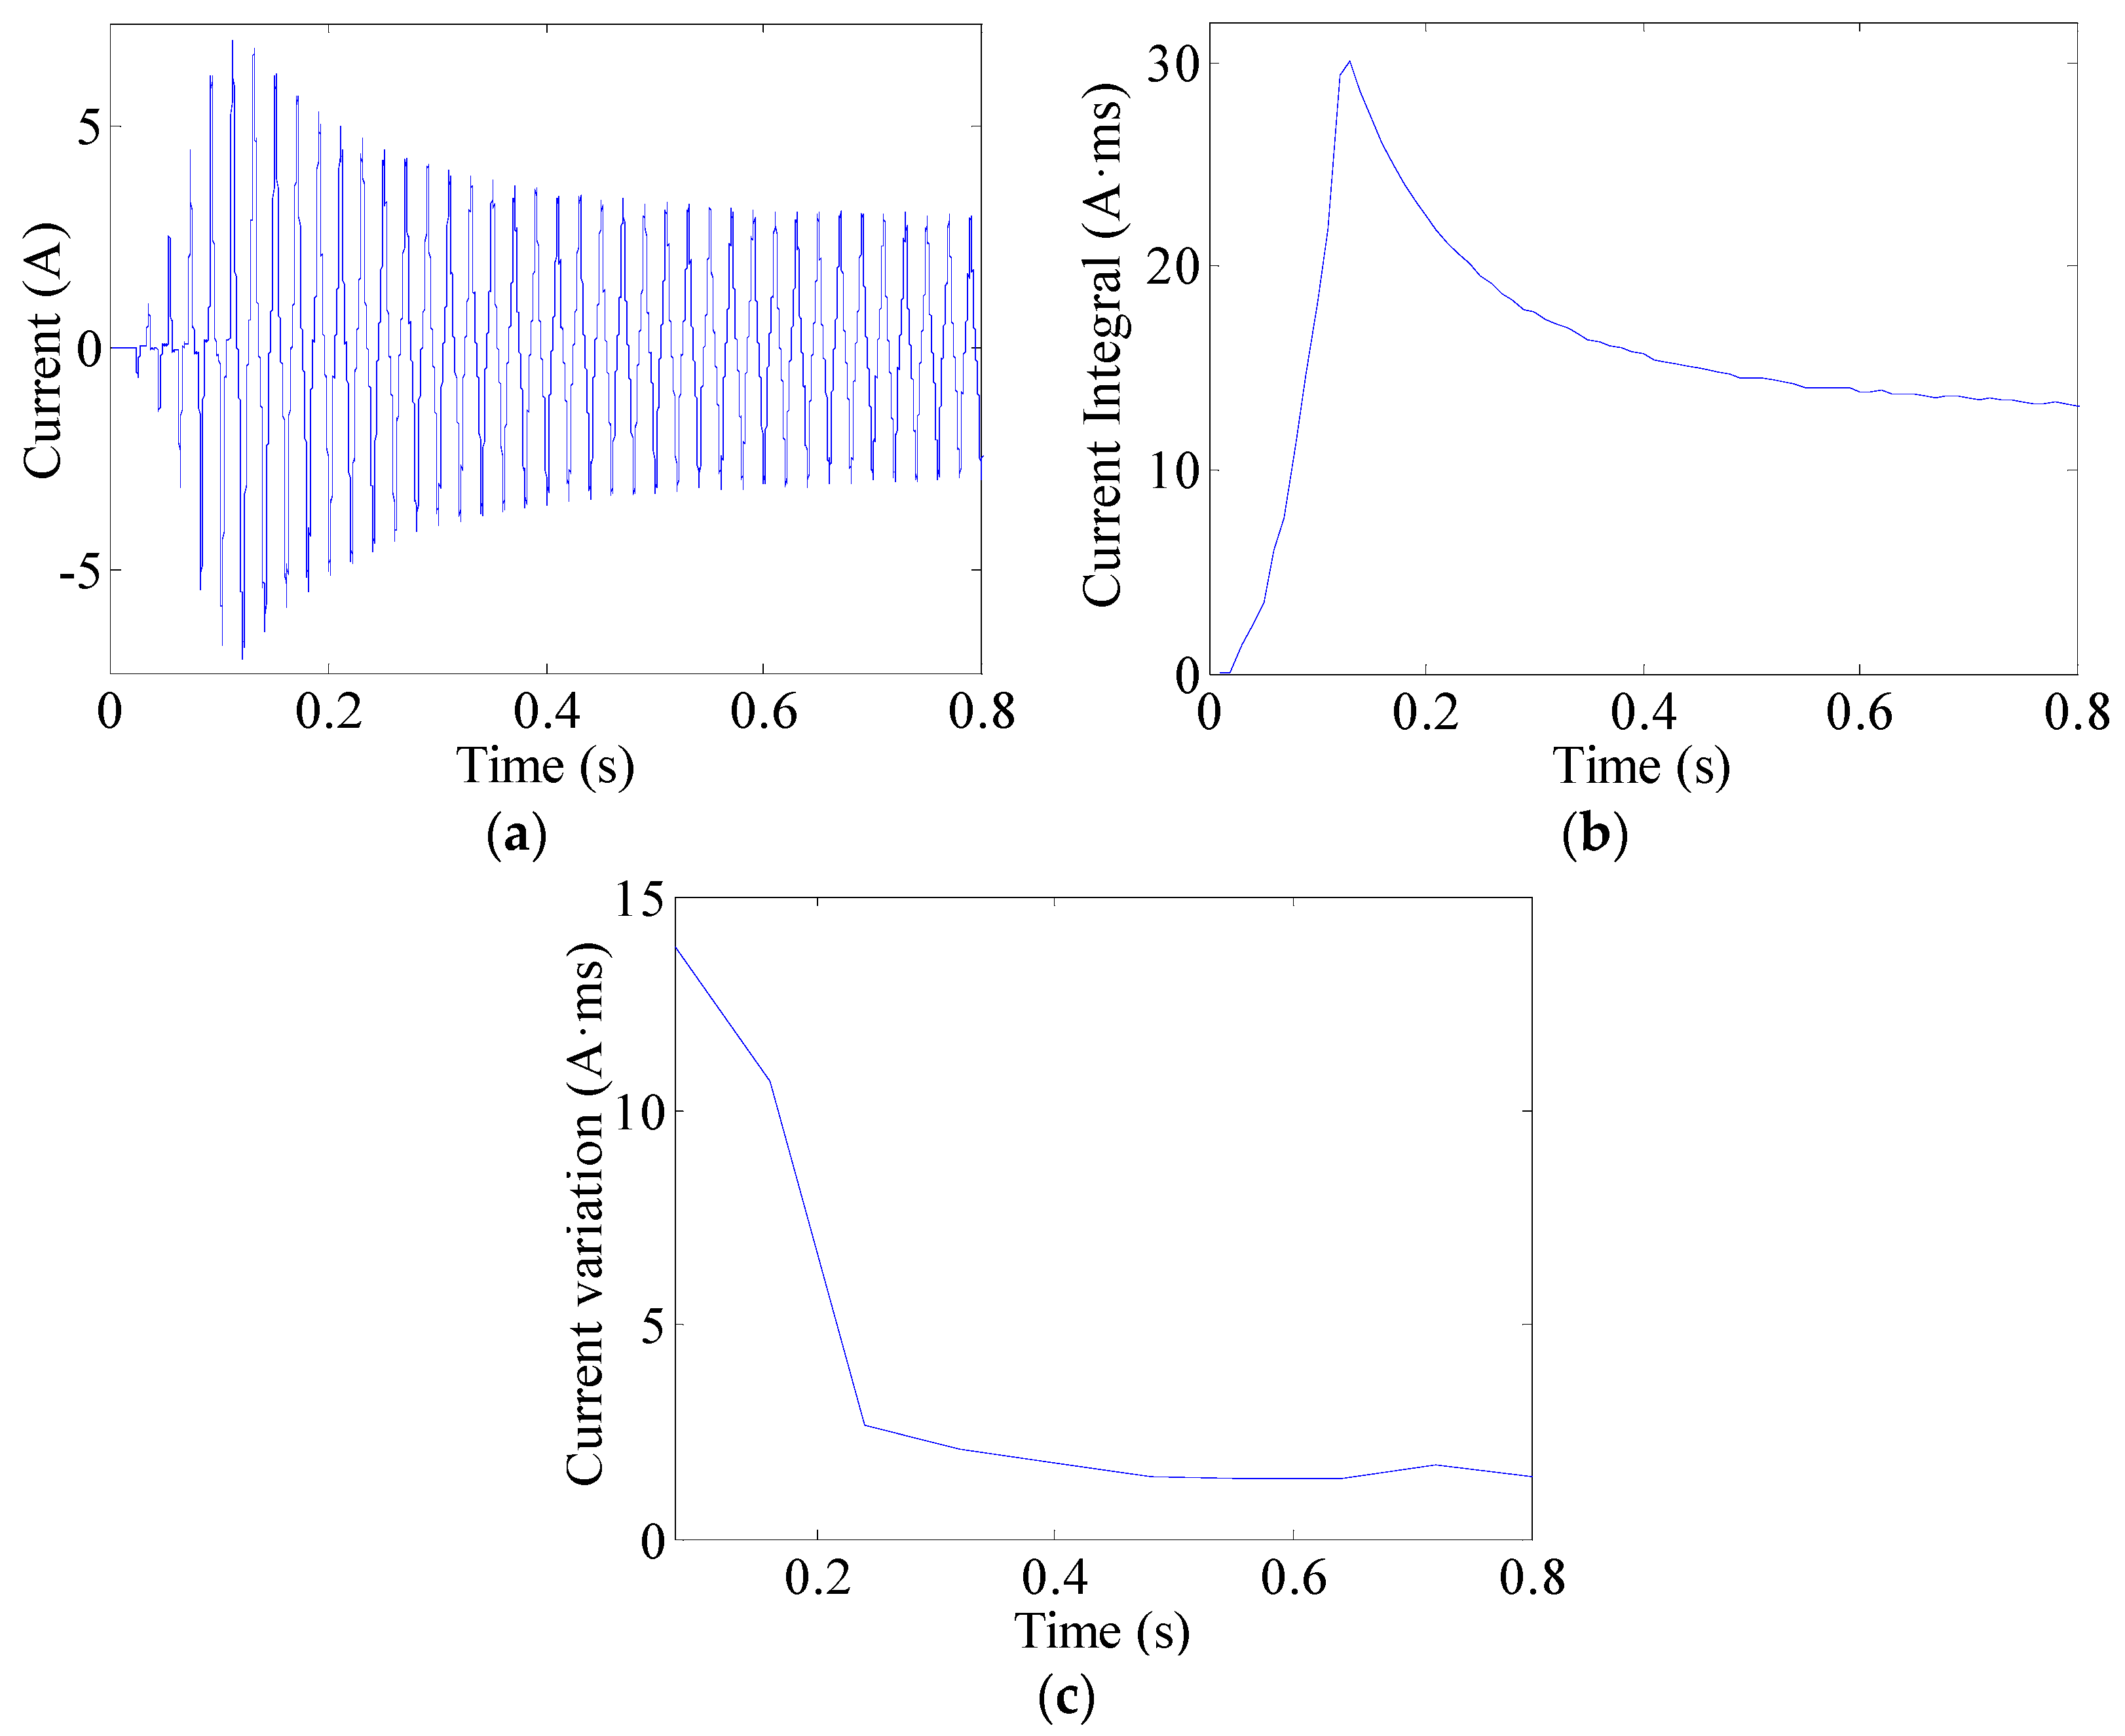
3.2.2. Current Feature Extraction
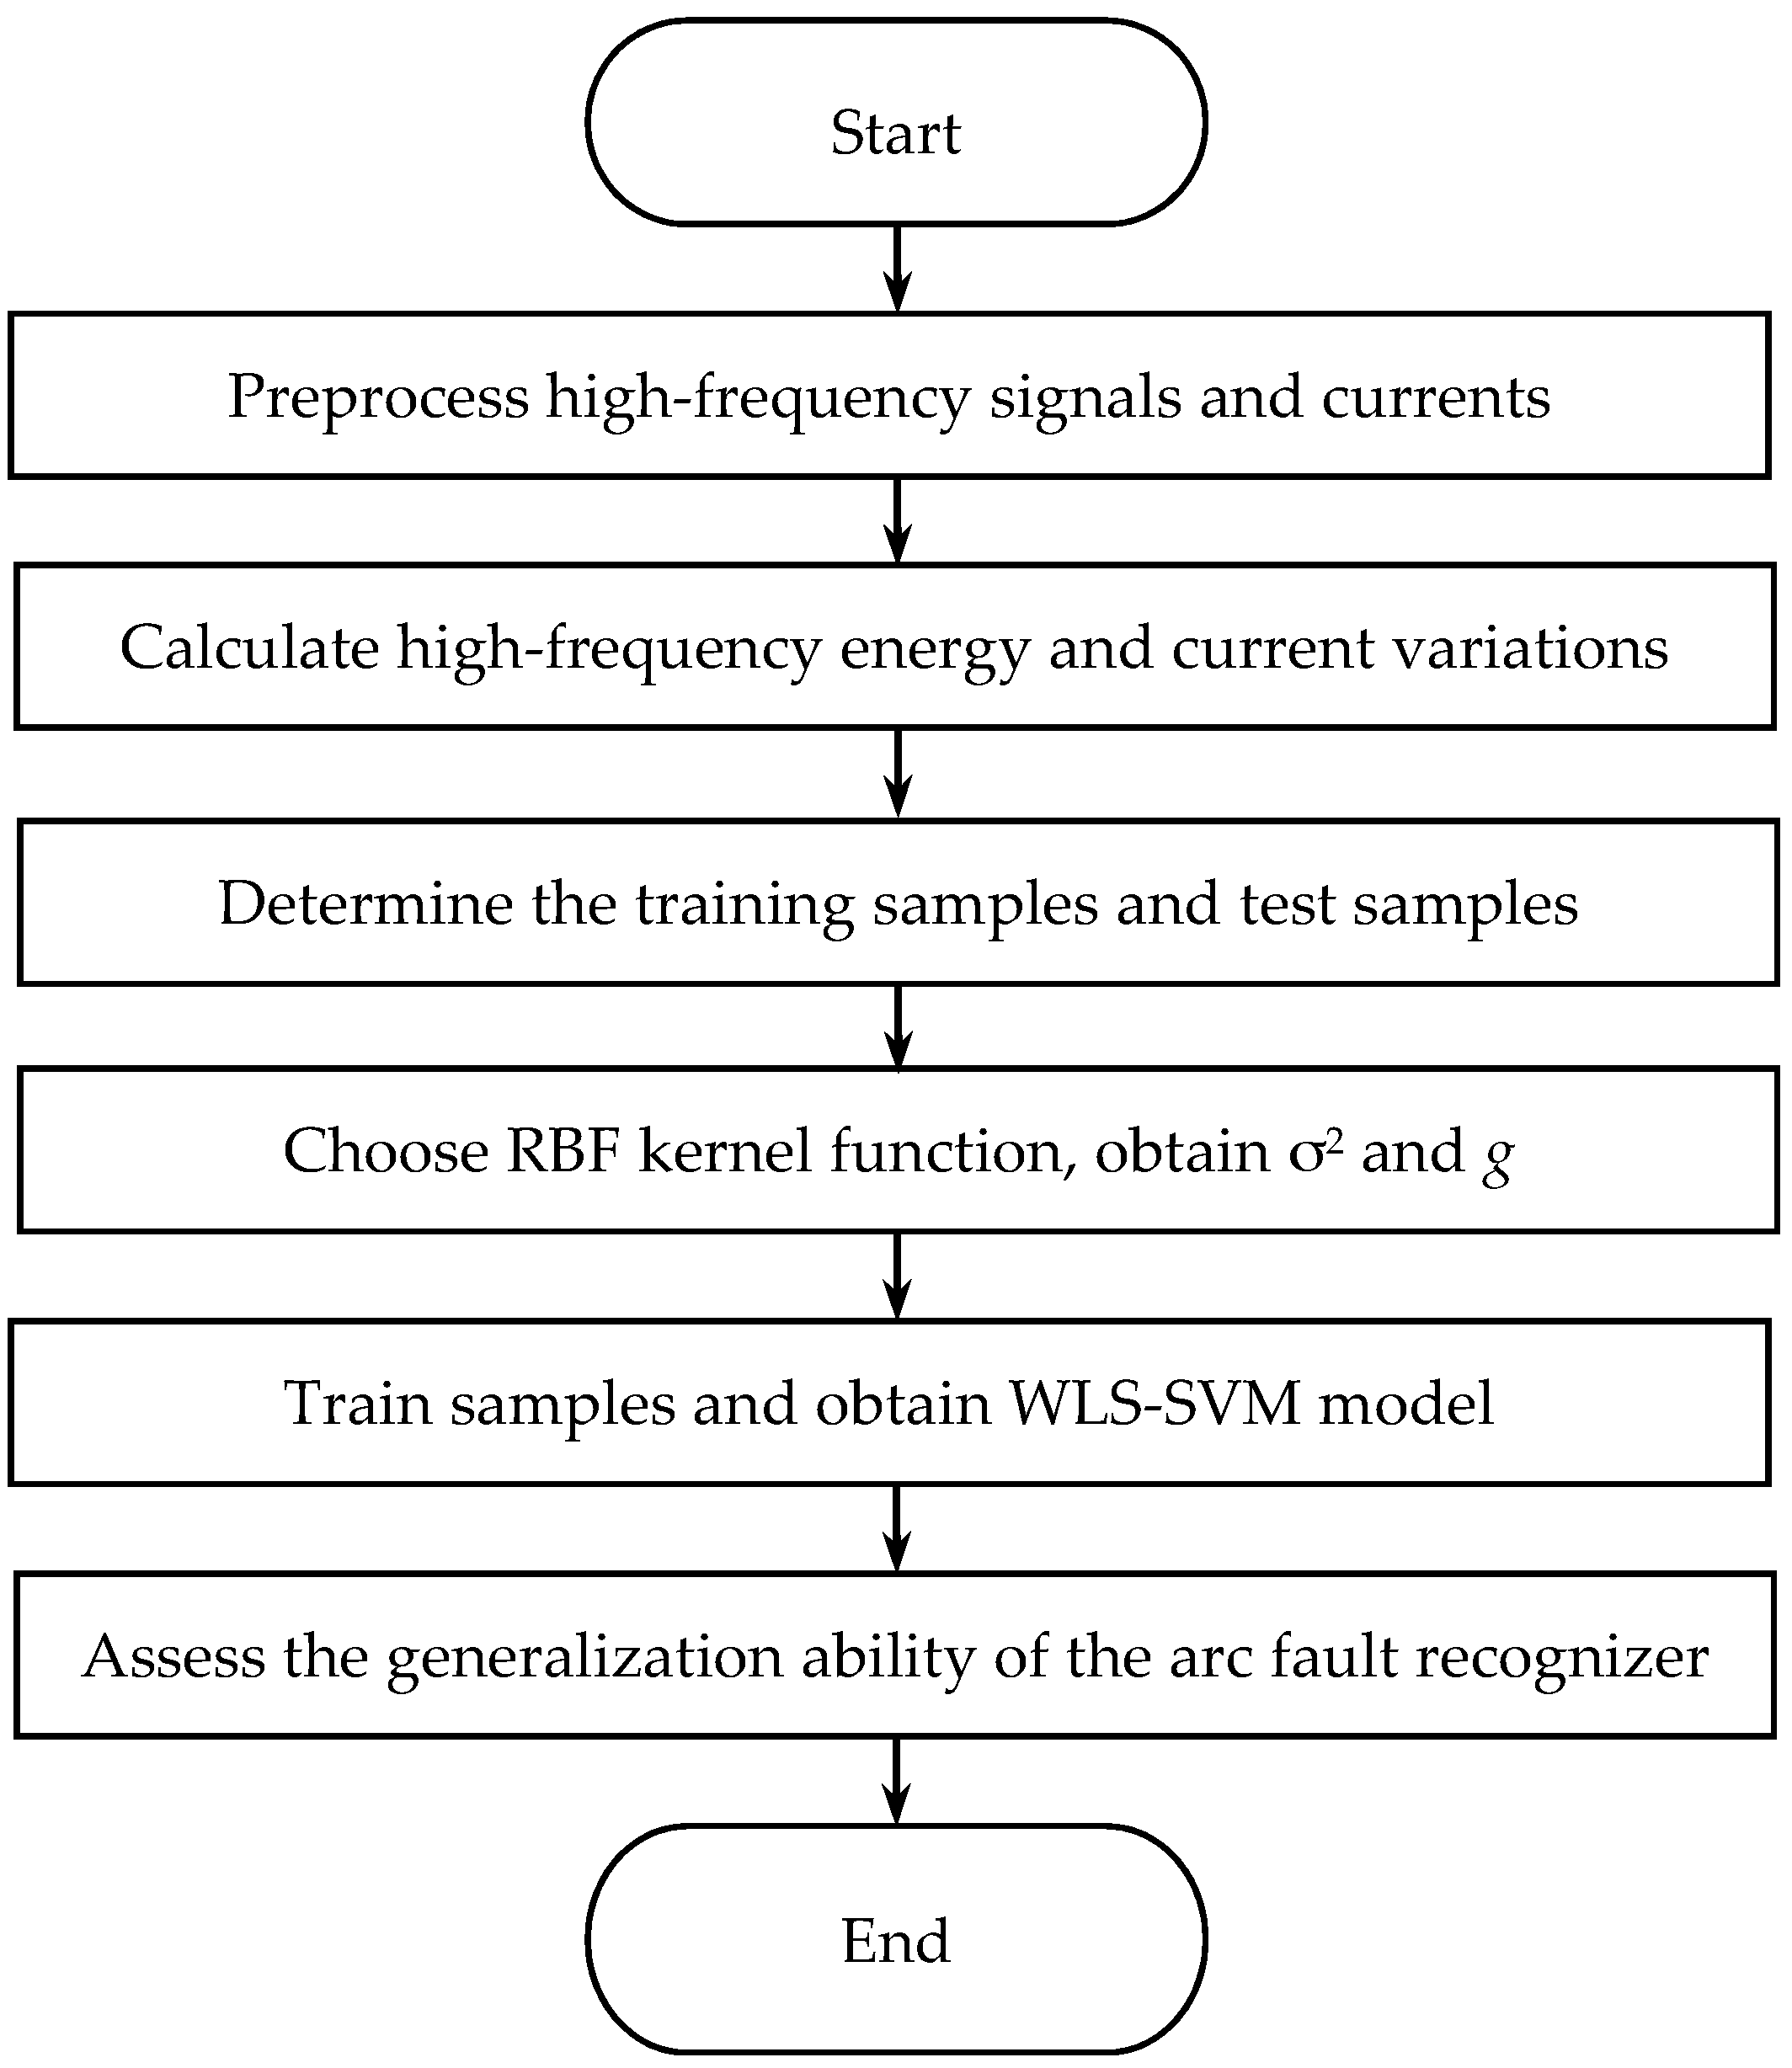
4. Arc Fault Detection Algorithm
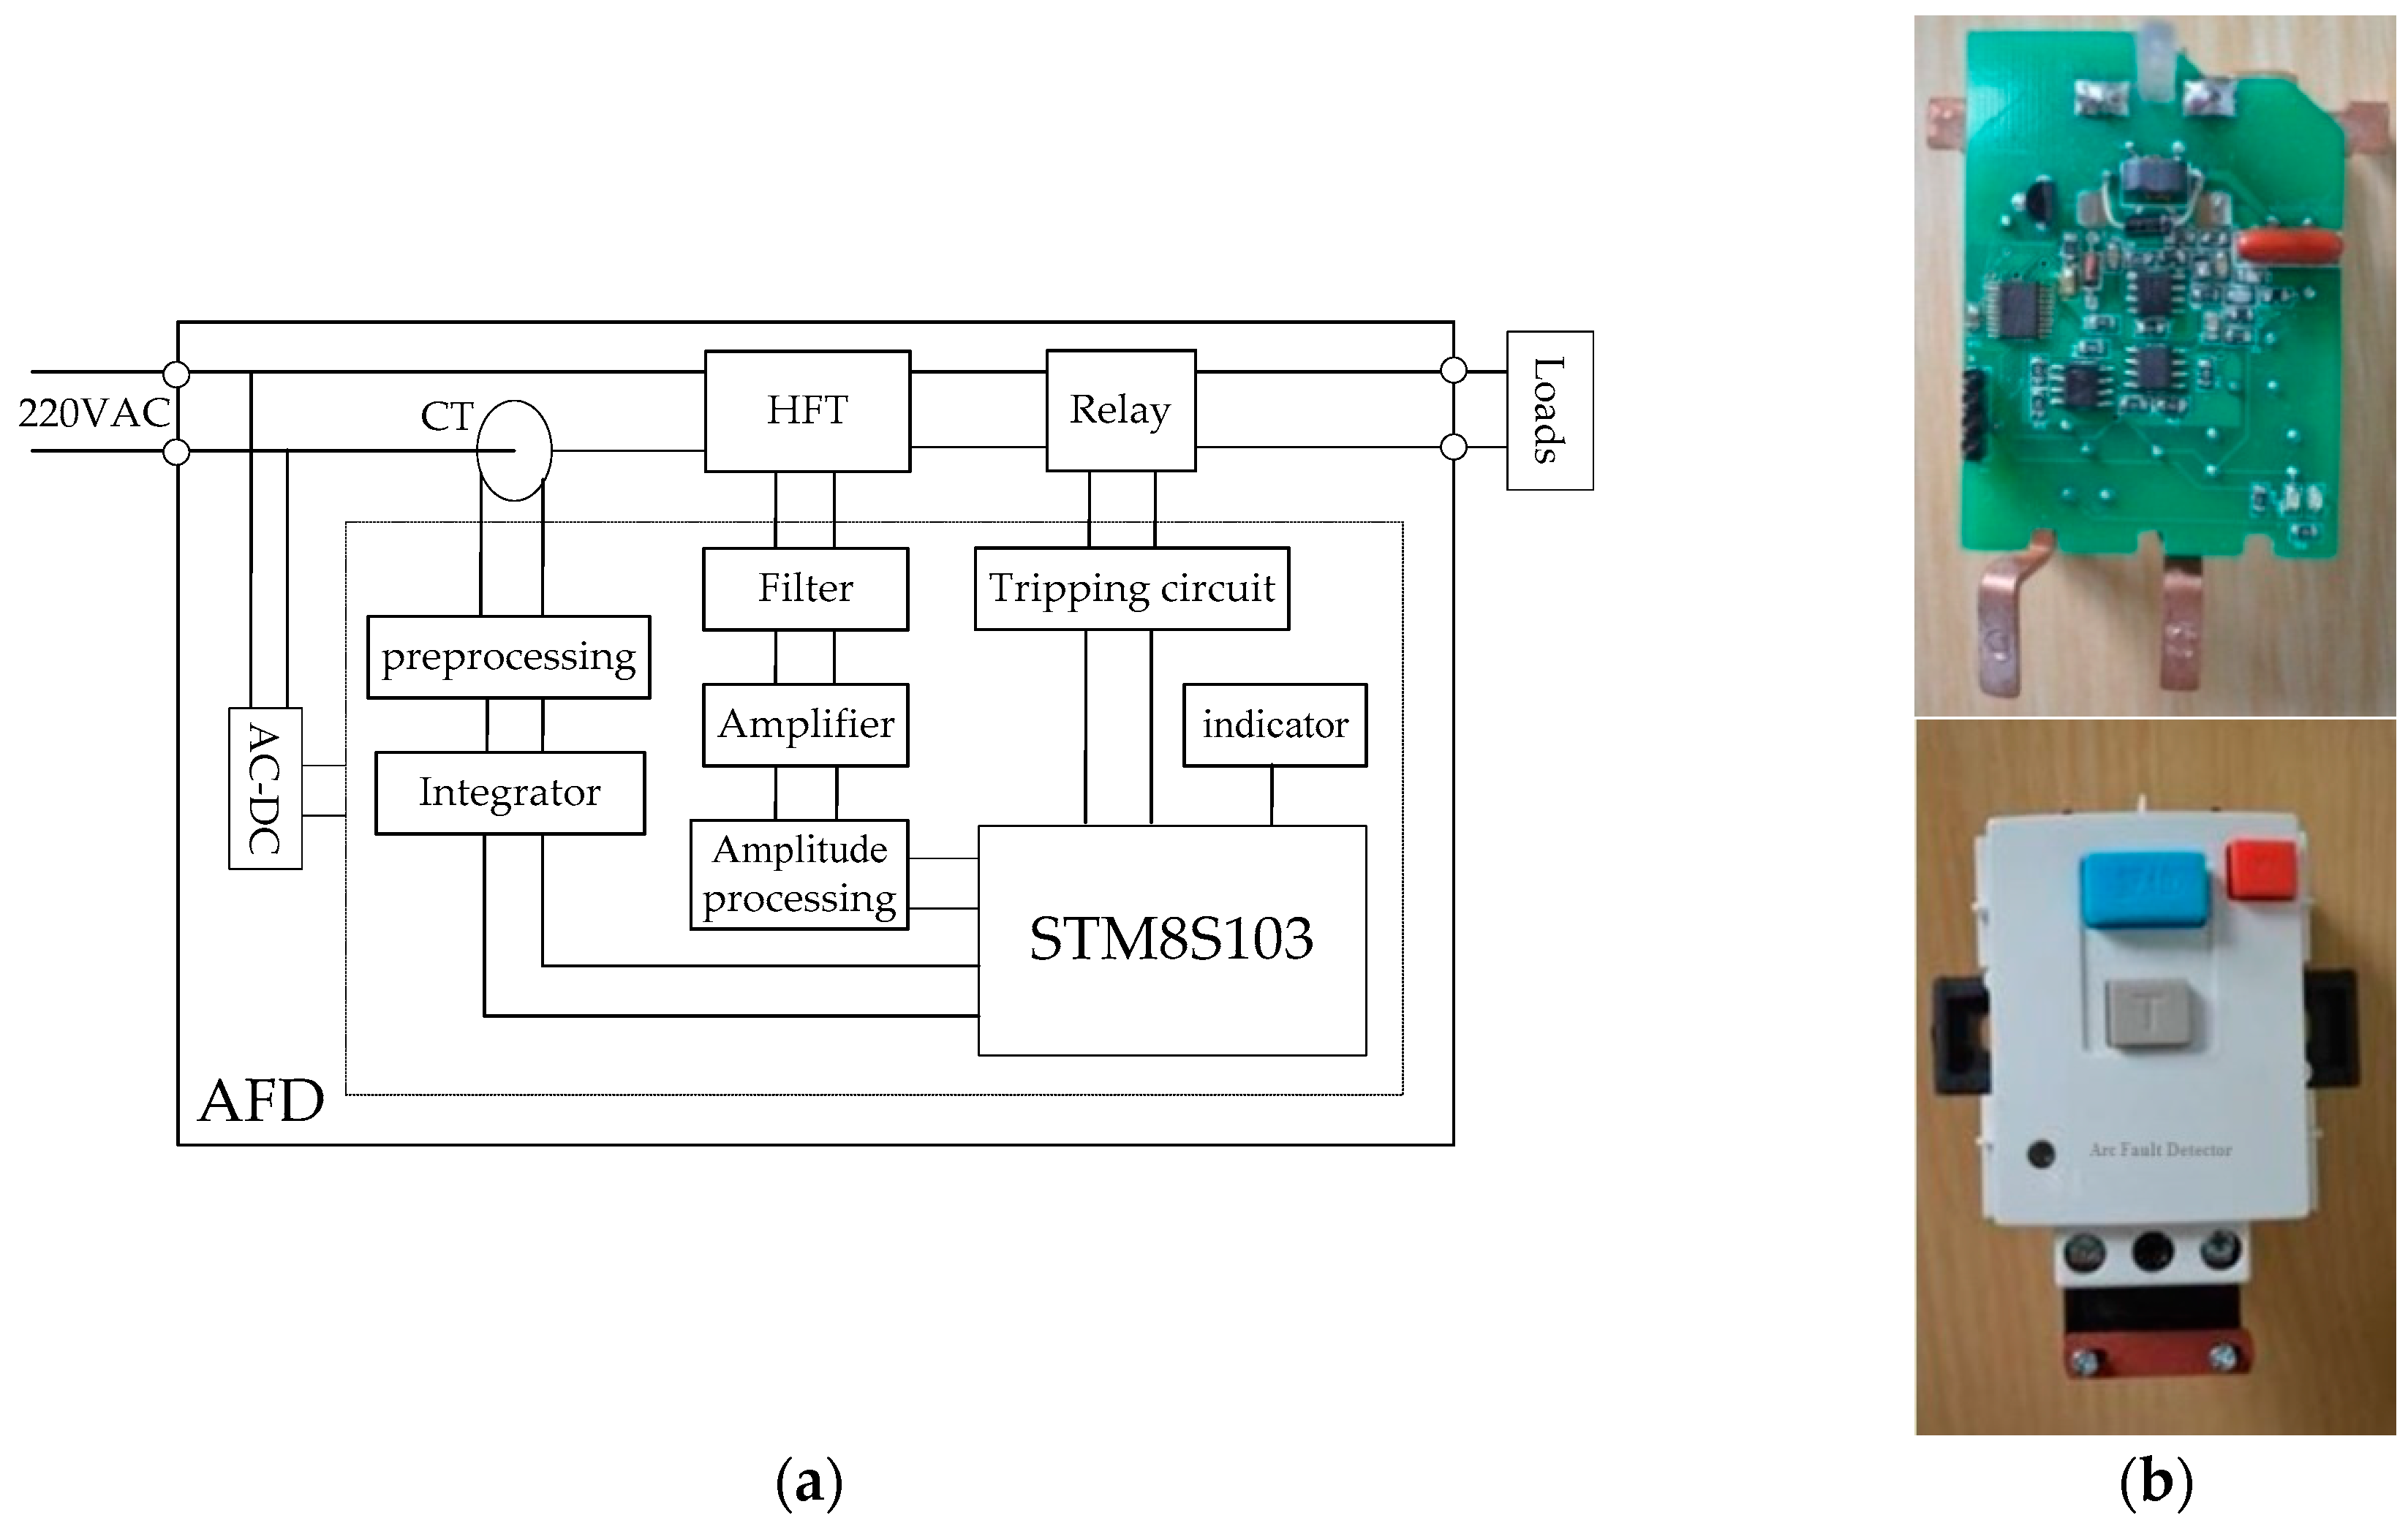
5. Designing AFD for the Early Detection of Electrical Fires
6. Conclusions
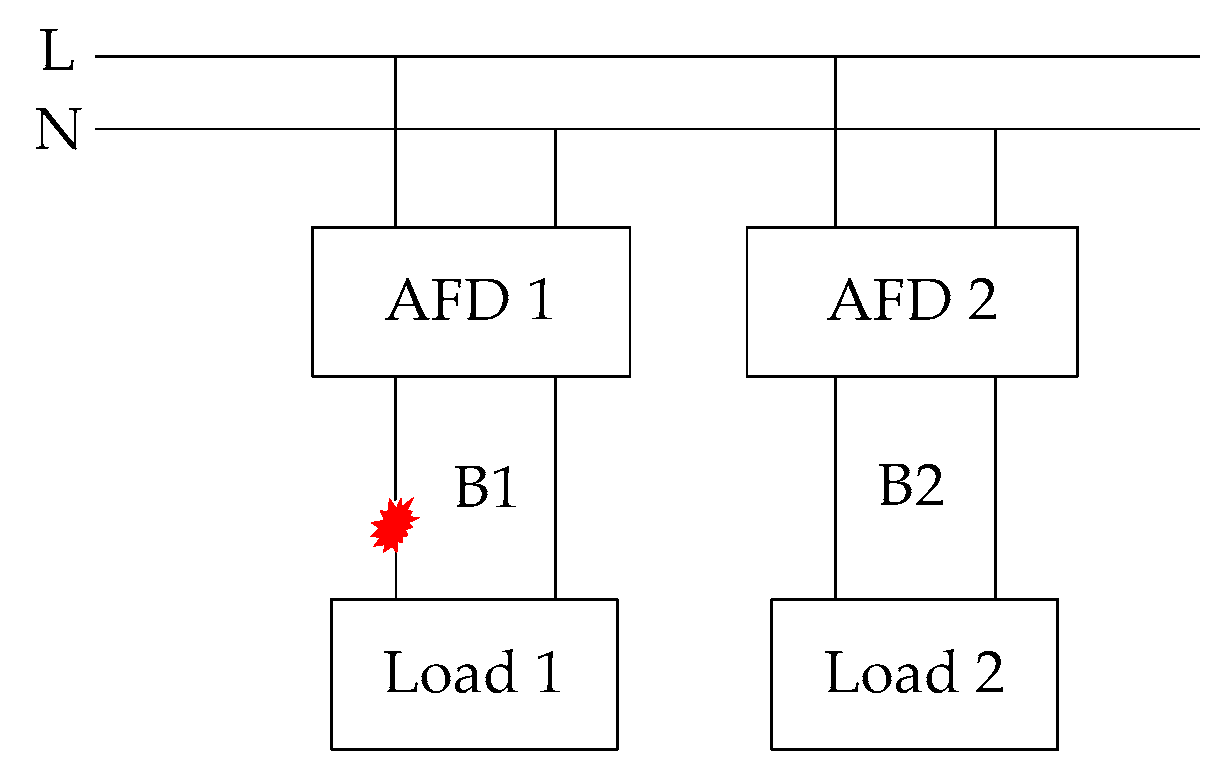
- High-frequency signals collected by an HFT noticeably increase when arc faults occur in circuits. However, they are strongly affected by cross talk.
- The line currents of arc faults are often distorted or become unstable; however, current periodic integrals also clearly change under normal states, especially during transient processes.
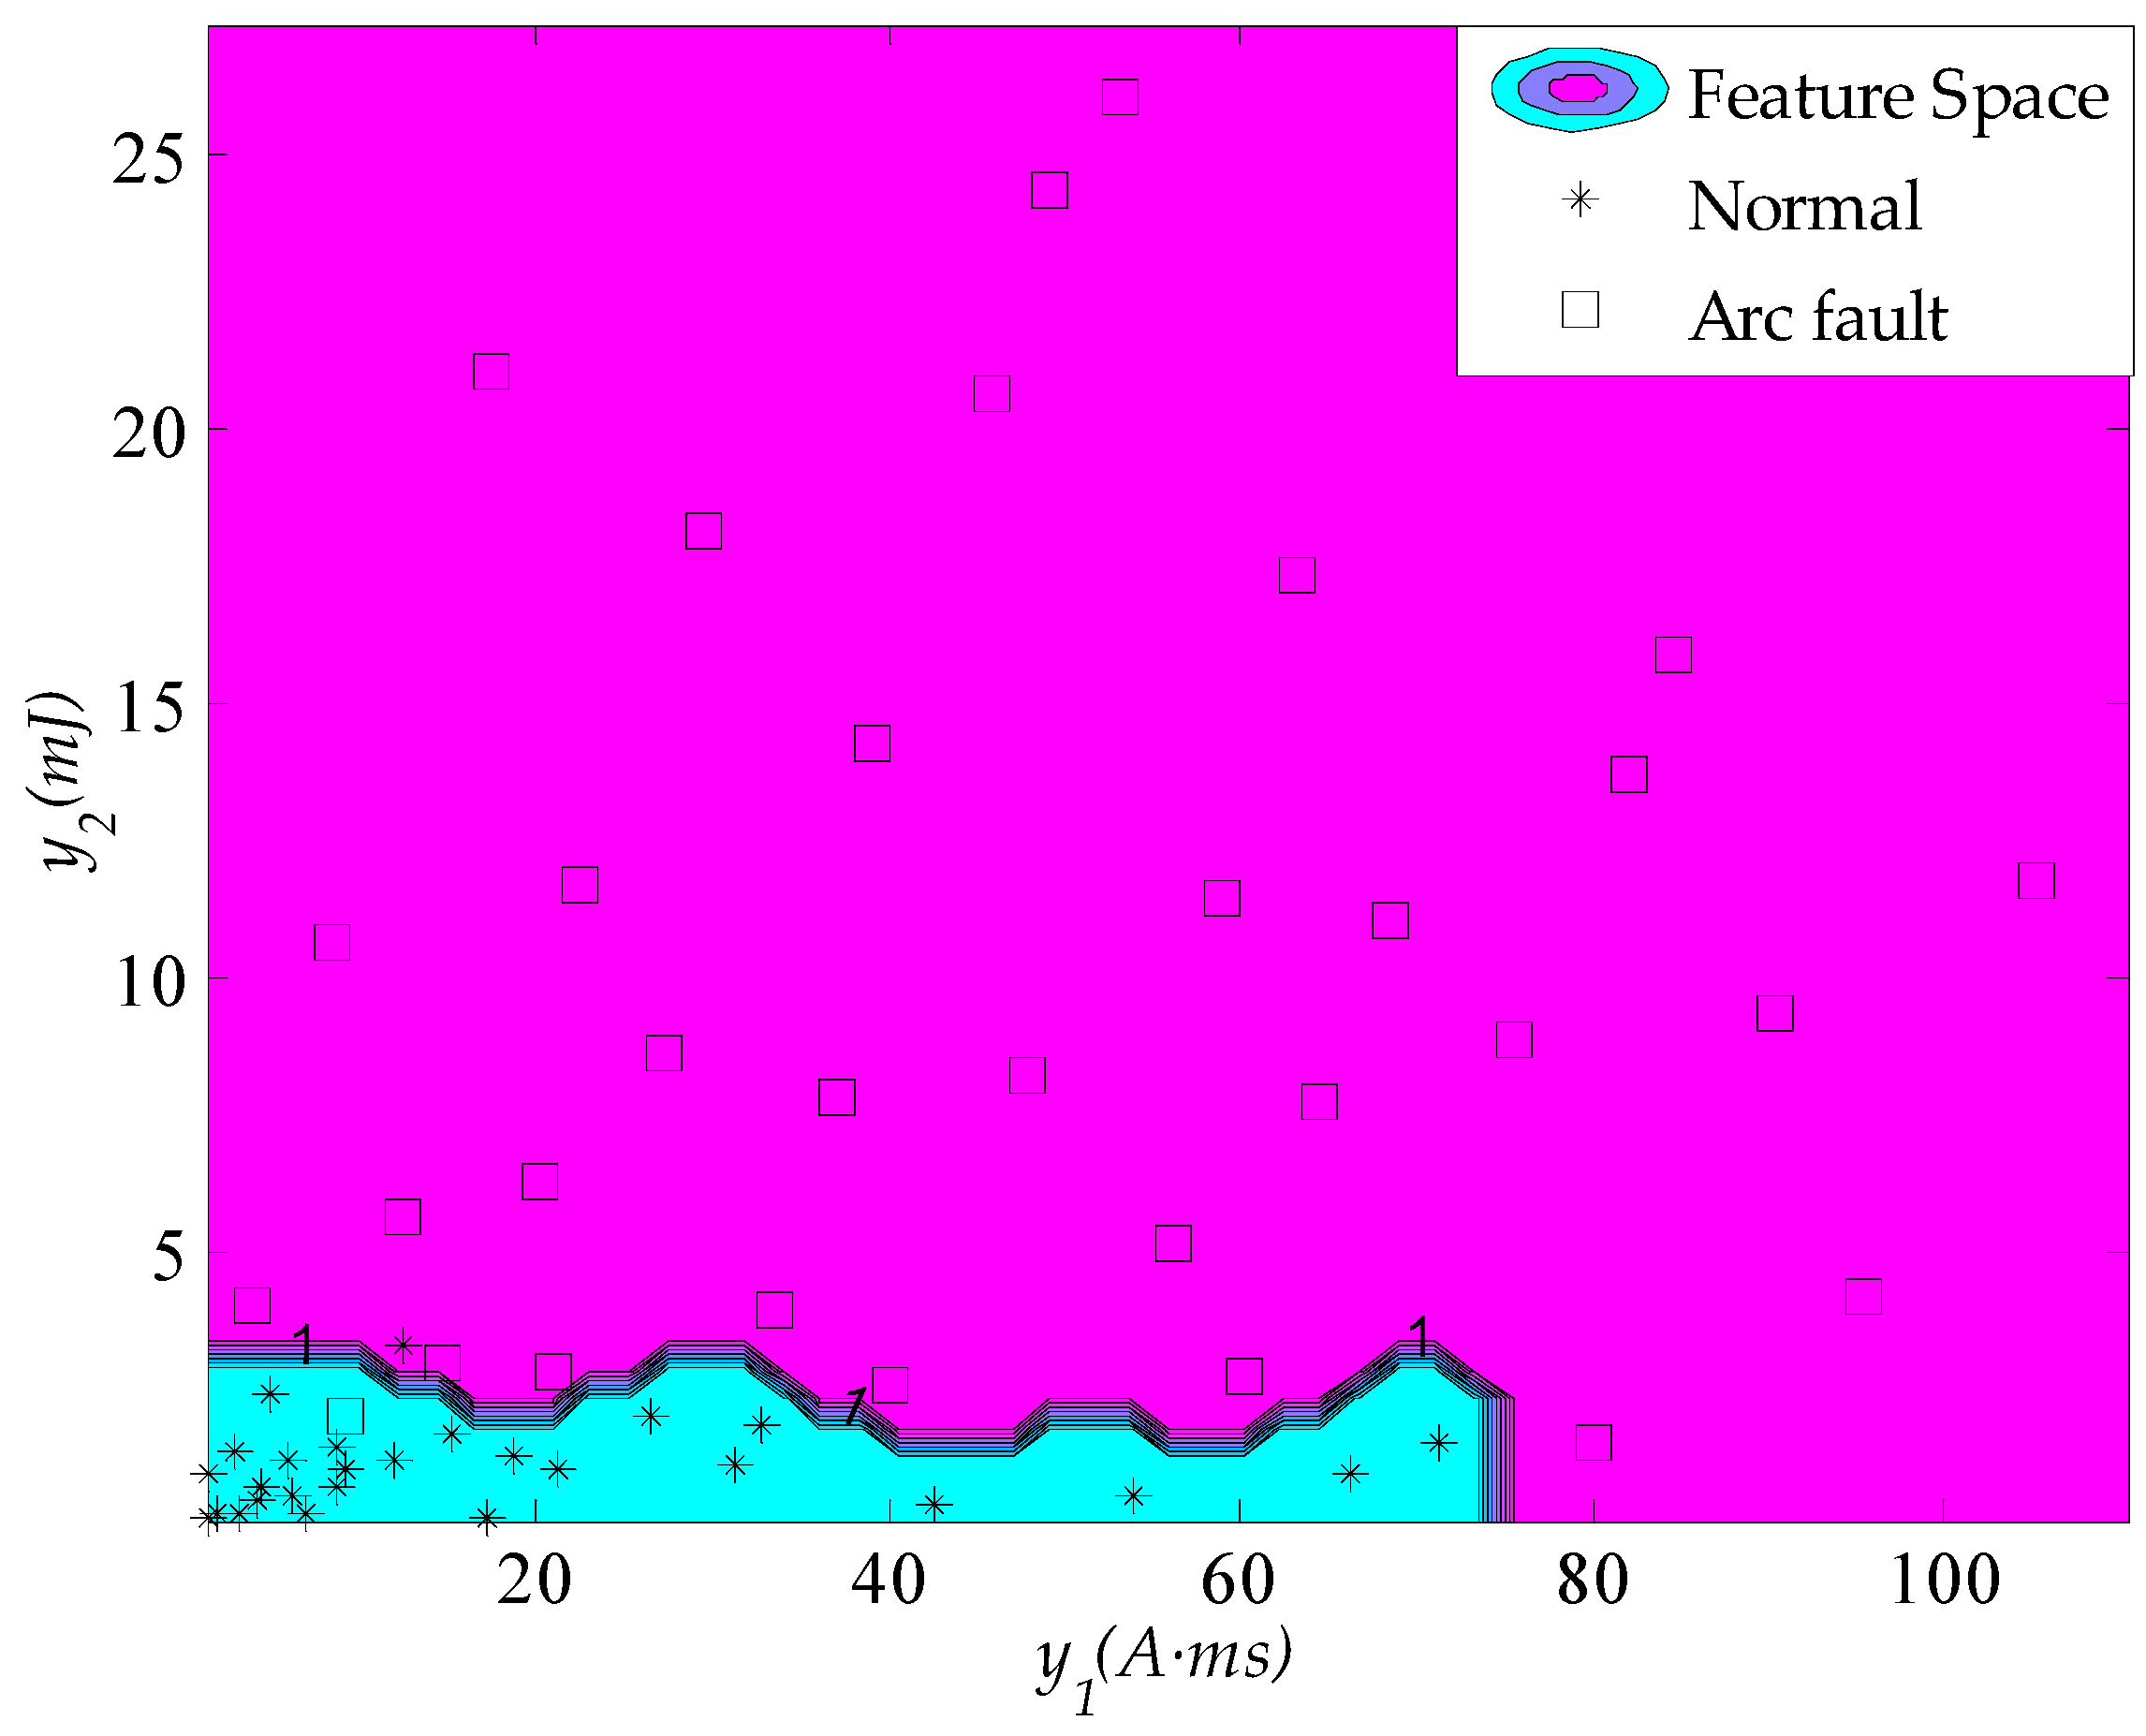
- High-frequency signal energy and current variations were extracted as the input eigenvector of the arc fault detection algorithm. An algorithm based on WLS-SVM was designed to identify arc faults from load states.
- The arc fault detection algorithm was successfully applied in a STM8S103 microprocessor, and an AFD prototype was developed. The AFD was able to detect arc faults in a timely manner and interrupt the circuit power supply before electrical fires could be produced during testing. The prototype was not influenced by cross talk or transient processes. The detection accuracy was very high, and the AFD exhibited good generalizability under different loads.
Acknowledgments
Author Contributions
Conflicts of Interest
References
- United States Fire Administration National Fire Data Center. Residential building fires (2011–2013). Top. Fire Rep. Ser. 2015, 16, 1–15. [Google Scholar]
- Fire Department of Ministry of Public Security. China Fire Services (2014); Yunnan People’s Publishing House: Kunming, China, 2014; pp. 396–407. (In Chinese) [Google Scholar]
- Si, G. Analysis on China’s electrical fire situation and feature from 2008 to 2012. Fire Sci. Technol. 2014, 33, 569–572. (In Chinese) [Google Scholar]
- Vadoli, C.N. Lessons learned from electrical circuit analysis in support of a fire probabilistic risk assessment. In Proceedings of the International Topical Meeting on Probabilistic Safety Assessment and Analysis, Wilmington, NC, USA, 13–17 March 2011; pp. 711–720.
- Lee, D.A.; Trotta, A.M.; King, W.H., Jr. New Technology for preventing residential electrical fires: Arc-fault circuit interrupters (AFCIs). Fire Technol. 2000, 36, 146–162. [Google Scholar] [CrossRef]
- United States Fire Administration National Fire Data Center. Residential building fires (2009–2011). Top. Fire Rep. Ser. 2014, 14, 1–11. [Google Scholar]
- Wang, X.G.; Lo, S.M.; Zhang, H.P. Exploring the role of feature subset combinations on performance of multisensor fire detection. J. Appl. Fire Sci. 2013, 23, 179–192. [Google Scholar] [CrossRef]
- Veselovskii, I.; Whiteman, D.N.; Korenskiy, M.; Suvorina, A.; Kolgotin, A.; Lyapustin, A.; Wang, Y.; Chin, M.; Bian, H.; Kucsera, T.L.; et al. Characterization of forest fire smoke event near Washington, DC in summer 2013 with multi-wavelength lidar. Atmos. Chem. Phys. 2015, 15, 1647–1660. [Google Scholar] [CrossRef]
- Hangauer, A.; Chen, J.; Strzoda, R.; Fleischer, M.; Amann, M.C. Performance of a fire detector based on a compact laser spectroscopic carbon monoxide sensor. Opt. Express 2014, 22, 13680–13690. [Google Scholar] [CrossRef] [PubMed]
- Luis, J.A.; Galán, J.A.G.; Espigado, J.A. Low power wireless smoke alarm system in home fires. Sensors 2015, 15, 20717–20729. [Google Scholar] [CrossRef] [PubMed]
- Yang, J.; Zhou, J.; Lv, Z.; Wei, W.; Song, H. A real-time monitoring system of industry carbon monoxide based on wireless sensor networks. Sensors 2015, 15, 29535–29546. [Google Scholar] [CrossRef] [PubMed]
- Jee, S.W. Distinction of fire source from smoke using discrete probability distribution and neural networks. Fire Technol. 2014, 51, 887–904. [Google Scholar] [CrossRef]
- Underwriters Laboratories Inc. UL Standard for Safety Arc-Fault Circuit-Interrupters, 2nd ed.; Underwriters Laboratories Inc.: New York, NY, USA, 2011. [Google Scholar]
- Lee, R.H. The other electrical hazard: Electric arc flash. IEEE Trans. Ind. Appl. 1982, IA-18, 246–251. [Google Scholar] [CrossRef]
- Fuller, J.F.; Hanna, W.J.; Kallenbach, G.A. Arcing faults in metallic conduit at 120 and 240 V. IEEE Trans. Ind. Appl. 1985, IA-21, 820–825. [Google Scholar] [CrossRef]
- Gregory, G.D.; Wong, K.; Dvorak, R. More about arc-fault circuit interrupters. IEEE Trans. Ind. Appl. 2004, 40, 1006–1011. [Google Scholar] [CrossRef]
- What Others Are Saying. Available online: http://www.afcisafety.org/endorsements.html (accessed on 8 May 2013).
- International Electrotechnical Commission. General Requirements for Arc Fault Detection Devices; IEC 62606; International Electrotechnical Commission: Geneva, Switzerland, 9 July 2013. [Google Scholar]
- Gammon, T.; Matthews, J. Arcing-fault models for low-voltage power systems. In Proceedings of the IEEE Industrial and Commercial Power Systems Technical Conference, Clearwater Beach, FL, USA, 7–11 May 2000; pp. 119–126.
- Wu, H.R.; Li, X.H.; Stade, D.; Schau, H. Arc fault model for low voltage AC systems. IEEE Trans. Power Deliv. 2005, 20, 1204–1205. [Google Scholar] [CrossRef]
- Kizilcay, M.; Pniok, T. Digital simulation of fault arcs in power systems. Eur. Trans. Electr. Power Eng. 1991, 1, 55–60. [Google Scholar] [CrossRef]
- Song, Y.H.; Aggarwal, R.K.; Johns, A.T. Digital simulation of fault arcs on long-distance compensated transmission systems with particular reference to adaptive autoreclosure. Eur. Trans. Electr. Power 1995, 5, 315–324. [Google Scholar] [CrossRef]
- Parise, G.; Martirano, L.; Laurini, M. Simplified arc-fault model: The reduction factor of the arc current. IEEE Trans. Ind. Appl. 2013, 49, 1703–1710. [Google Scholar] [CrossRef]
- Andrea, J.; Schweitzer, P.; Martel, J.M. Arc fault model of conductance application to the UL 1699 tests modeling. In Proceedings of the 57th IEEE Holm Conference on Electrical Contacts, Minneapolis, MN, USA, 11–14 September 2011; pp. 37–42.
- Charles, J.K. Electromagnetic radiation behavior of low-voltage arcing fault. IEEE Trans. Power Deliv. 2009, 24, 416–423. [Google Scholar]
- Yang, J.H.; Zhang, R.C.; Du, J.H. Study on application of arcing protective system faults based on multiple information fusion. High Volt. Appar. 2007, 43, 194–196. (In Chinese) [Google Scholar]
- Zhang, R.C.; Yang, J.H.; Du, J.H. Study on in-process detection and diagnosis of faults arc based on early sounds signature and intermittent chaos. Key Eng. Mat. 2008, 381, 611–614. [Google Scholar] [CrossRef]
- Lin, Y.H.; Liu, C.W.; Chen, C.S. A new PMU-based fault detection location technique for transmission lines with consideration of arcing fault discrimination-part I theory and algorithms. IEEE Trans. Power Deliv. 2004, 19, 1587–1593. [Google Scholar] [CrossRef]
- Meyar-Naimi, H.; Hasanzadeh, S.; Sanaye-Pasand, M. Discrimination of arcing faults on overhead transmission lines for single-pole auto-reclosure. Int. Trans. Elecr. Energy Sys. 2013, 23, 1523–1535. [Google Scholar] [CrossRef]
- Boksiner, J.; Silverman, E.J. Electrical Cable Arcing Fault Detection by Monitoring Power Spectrum in Distribution Line. U.S. Patent 5,359,293, 25 October 1994. [Google Scholar]
- Li, J.C.; Kohler, J.L. New insight into the detection of high-impedance arcing faults on DC trolley systems. IEEE Trans. Ind. Appl. 1999, 35, 1169–1173. [Google Scholar]
- Wang, S.C.; Wu, C.J.; Wang, Y.J. Detection of arc fault on low voltage power circuits in time and frequency domain approach. IEEE Trans. Ind. Appl. 2012, 6, 324–331. [Google Scholar]
- Koziy, K.; Gou, B.; Aslakson, J. A low-cost power-quality meter with series arc-fault detection capability for smart. IEEE Trans. Power Deliv. 2013, 28, 1548–1591. [Google Scholar] [CrossRef]
- Lezama, J.; Schweitzer, P.; Tisserand, E.; Humbert, J.B.; Weber, S.; Joyeux, P. An embedded system for AC series arc detection by inter-period correlations of current. Electr. Power Syst. Res. 2015, 129, 227–234. [Google Scholar] [CrossRef]
- Haun, A.A.; Coats, A.G.; Wong, K.B.; Dvorak, R.F.; Scott, G.W. Arc Fault Circuit Interrupter. U.S. Patent 6,414,829, 2 July 2002. [Google Scholar]
- Dvorak, R.F.; Wong, K.B. Arc Fault Circuit Interrupter System. U.S. Patent 7,151,656 B2, 19 December 2006. [Google Scholar]
- Li, C.L.; Yue, G.L. Arc Fault Circuit Interrupter. U.S. Patent 20150155698, 4 June 2015. [Google Scholar]
- Nicolescu, A.D.; Orr, R.K. Arc Fault Detection and Extinguishing. European Patent EP2,960,947, 30 December 2015. [Google Scholar]
- Su, W.Y.; Wu, C.J. The Assessment of Introduction of the Arc Fault Circuit Interrupters; IOSH98-S302; Report prepared for Institute of Occupational Safety and Health: Taipei, Taiwan, 2010. [Google Scholar]
- Zhang, S.; Zhang, F.; Liu, P.; Han, Z. Identification of low voltage AC series arc faults by using Kalman filtering algorithm. Elektronika ir Elektrotechnika 2014, 20, 51–56. [Google Scholar] [CrossRef]
- Sidhu, T.S.; Singh, G.; Sachdev, M.S. Arcing fault detection using artificial neural networks. Neurocomputing 1998, 23, 225–241. [Google Scholar] [CrossRef]
- Rivers, C., Jr. Arc Fault Detection Using Fuzzy Logic. U.S. Patent 8,054,592 B2, 8 November 2011. [Google Scholar]
- Zhang, R.C.; Yang, J.H.; Li, X.H. Low-Voltage Arc Fault Detection Apparatus. Available online: http://www.pss-system.gov.cn/sipopublicsearch/search/search/showViewList.shtml (accessed on 16 January 2013).
- Cho, Y.; Lim, J.; Seo, H.; Bang, S.B.; Choe, G.H. A series arc fault detection strategy for single-phase boost PFC rectifiers. J. Power Electr. 2015, 15, 1664–1672. [Google Scholar] [CrossRef]
- Liu, Y.L.; Guo, F.Y.; Wang, Z.Y.; Chen, C.K.; Li, Y. Research on the Spectral Characteristics of Series Arc Fault Based on Information entropy. Trans. China Electrotech. Soc. 2015, 30, 488–495. [Google Scholar]
- Kim, C.H.; Kim, H.; Ko, Y.H.; Byun, S.H.; Aggarwal, R.K.; Johns, A.T. A novel fault-detection technique of high-impedance arcing faults in transmission lines using the wavelet transform. IEEE Trans. Power Deliv. 2002, 17, 921–929. [Google Scholar] [CrossRef]
- Jamali, S.; Ghaffarzadeh, N. A new method for arcing fault location using discrete wavelet transform and wavelet networks. Eur. Trans. Electr. Power 2012, 22, 601–615. [Google Scholar] [CrossRef]
- Kawady, T.A.; Elkalashy, N.I.; Ibrahim, A.E.; Taalab, A.M.I. Arcing fault identification using combined Gabor Transform-neural network for transmission lines. Int. J. Electr. Power Energy Syst. 2014, 61, 248–258. [Google Scholar] [CrossRef]
- Kolker, D.; Campolo, S.; DiSalvo, N. A study of time/current characteristics of the ignition processes in cellulosic material caused by electrical arcing for application in 240 V arc-fault circuit interrupters. In Proceedings of the 53th IEEE Holm Conference on Electrical Contacts, Pittsburgh, PA, USA, 16–19 September 2007; pp. 105–114.
- Shea, J.J. Comparing 240 Vrms to 120 Vrms series arcing faults in residential wire. In Proceedings of the 54th IEEE Holm Conference on Electrical Contacts, Orlando, FL, USA, 27–29 October 2008; pp. 218–224.
- Carvou, E.; Ben Jemaa, N.; Tian, S.; Belhaja, Z.; Jusselin, B. Electrical arc characterization for ac-arc fault applications. In Proceedings of the 55th IEEE Holm Conference on Electrical Contacts, Vancouver, BC, Canada, 14–16 September 2009; pp. 21–26.
- Ko, W.S.; Moon, W.S.; Bang, S.B.; Kim, J.C. Analysis of ignition time/current characteristics and energy when series arc-fault occurs at rated 220 V. Trans. Korean Inst. Electr. Eng. 2013, 62, 1184–1191. [Google Scholar] [CrossRef]
- Suykens, J.A.K.; Vandewalle, J. Least squares support vector machine classifiers. Neural Process. Lett. 1999, 9, 293–300. [Google Scholar] [CrossRef]
- Cheng, Q.; Tezcan, J.; Cheng, J. Confidence and prediction intervals for semiparametric mixed-effect least squares support vector machine. Pattern Recogn. Lett. 2014, 40, 88–95. [Google Scholar] [CrossRef]
- Si, L.; Wang, Z.B.; Liu, X.H.; Tan, C.; Liu, Z.; Xu, J. Identification of shearer cutting patterns using vibration signals based on a least squares support vector machine with an improved fruit fly optimization algorithm. Sensors 2016, 16, 90. [Google Scholar] [CrossRef] [PubMed]
- General Administration of Quality Supervision, Inspection and Quarantine of the People’s Republic of China; Standardization Administration of the People’s Republic of China. Electrical Fire Monitoring System –Part 4: Arcing Fault Detectors; Standards Press of China: Beijing, China, 2014. [Google Scholar]
- Bondiou, A.; Labaune, G.; Marque, J.P. Electromagnetic radiation associated with the formation of an electric breakdown in air at atmospheric pressure. J. Appl. Phys. 1987, 61, 503–509. [Google Scholar] [CrossRef]
- Damas, M.C.; Robiscoe, R.T. Detection of radio-frequency signals emitted by an arc discharge. J. Appl. Phys. 1988, 64, 566–574. [Google Scholar] [CrossRef]
- Zhang, W.X.; Zhang, J.; Xu, X.Y. Analysis on line noise characteristics of low voltage grid. North China Electr. Power 2012, 4, 27–30. [Google Scholar]
- Zhu, Z.S.; Zheng, Y.S. The frequency range of switching power supply. TV Eng. 1994, 6, 43–49. [Google Scholar]
- Cheng, W.B.; Zhong, Y.R.; Jin, S. Study of spread spectrum in suppressing acoustic resonance. Trans. China Electrotech. Soc. 2006, 21, 83–88. [Google Scholar]
- Wang, Q.M. A Study of Conducted Interference Testing and Corrective Measures for House Appliances; Suzhou University: Suzhou, China, 2012. [Google Scholar]
- Pontil, M.; Verri, A. Properties of support vector machines. Neural Comput. 1998, 10, 955–974. [Google Scholar] [CrossRef] [PubMed]
- Yang, X.W.; Tan, L.J.; He, L.F. A robust least squares support vector machine for regression and classification with noise. Neurocomputing 2014, 140, 41–52. [Google Scholar] [CrossRef]
- Suykens, J.A.K.; De Brabanter, J.; Lukas, L.; Vandewalle, J. Weighted least squares support vector machines robustness and sparse approximation. Neurocomputing 2002, 48, 85–105. [Google Scholar] [CrossRef]
- Han, X.H.; Du, S.H.; Su, J.; Guan, H.O.; Shao, L.M. Determination method of electric shock current based on parameter-optimized least squares support vector machine. Trans. Chin. Soc. Agric. Eng. 2014, 30, 238–245. (In Chinese) [Google Scholar]


| Number | Load Name | Quantity | Unit Power (W) | Total Power (W) |
|---|---|---|---|---|
| 1 | Fluorescent lamp | 2 | 40 | 80 |
| 2 | Halogen lamp | 6 | 50 | 300 |
| 3 | Computer | 1 | 350 | 350 |
| 4 | Electrical drill | 1 | 750 | 750 |
| 5 | Dimming lamp | 5 | 200 | 1000 |
| 6 | Electric stove | 1 | 1000 | 1000 |
| 7 | Vacuum cleaner | 1 | 1200 | 1200 |
| 8 | Air conditioner | 1 | 1500 | 1500 |
| 9 | Air compressor | 1 | 2200 | 2200 |
| Sample Number | 1 | 2 | 3 | … | 260 |
|---|---|---|---|---|---|
| y1 (A·ms) | 1.5513 | 22.1634 | 8.6517 | … | 40.6125 |
| y2 (mJ) | 0.9726 | 11.7258 | 1.4209 | … | 14.2903 |
| z | 0 | 1 | 0 | … | 1 |
| Actual Classifications | Calculative Classifications | |
|---|---|---|
| Normal | Arc Fault | |
| Normal | 27 | 1 |
| Arc Fault | 1 | 31 |
| Number | Load Name | Start or Stop Condition | Arc Fault Detection Accuracy |
|---|---|---|---|
| 1 | Computer | without tripping | 98% |
| 2 | Halogen lamp | without tripping | 100% |
| 3 | Electrical drill | without tripping | 96% |
| 4 | Dimming lamp | without tripping | 100% |
| 5 | Vacuum cleaner | without tripping | 100% |
| 6 | Air conditioner | without tripping | 100% |
| 7 | Air compressor | without tripping | 100% |
| 8 | Fluorescent lamp and electric stove | without tripping | 100% |
© 2016 by the authors; licensee MDPI, Basel, Switzerland. This article is an open access article distributed under the terms and conditions of the Creative Commons by Attribution (CC-BY) license (http://creativecommons.org/licenses/by/4.0/).
Share and Cite
Yang, K.; Zhang, R.; Yang, J.; Liu, C.; Chen, S.; Zhang, F. A Novel Arc Fault Detector for Early Detection of Electrical Fires. Sensors 2016, 16, 500. https://doi.org/10.3390/s16040500
Yang K, Zhang R, Yang J, Liu C, Chen S, Zhang F. A Novel Arc Fault Detector for Early Detection of Electrical Fires. Sensors. 2016; 16(4):500. https://doi.org/10.3390/s16040500
Chicago/Turabian StyleYang, Kai, Rencheng Zhang, Jianhong Yang, Canhua Liu, Shouhong Chen, and Fujiang Zhang. 2016. "A Novel Arc Fault Detector for Early Detection of Electrical Fires" Sensors 16, no. 4: 500. https://doi.org/10.3390/s16040500
APA StyleYang, K., Zhang, R., Yang, J., Liu, C., Chen, S., & Zhang, F. (2016). A Novel Arc Fault Detector for Early Detection of Electrical Fires. Sensors, 16(4), 500. https://doi.org/10.3390/s16040500