Article

An Electrochemiluminescence Immunosensor Based on Gold-Magnetic Nanoparticles and Phage Displayed Antibodies

State Key Laboratory of NBC Protection for Civilian, Beijing 102205, China
*
Author to whom correspondence should be addressed.
Sensors 2016, 16(3), 308; https://doi.org/10.3390/s16030308
Submission received: 30 November 2015 / Revised: 28 January 2016 / Accepted: 28 January 2016 / Published: 27 February 2016
(This article belongs to the Section Biosensors)

Abstract

:
Using the multiple advantages of the ultra-highly sensitive electrochemiluminescence (ECL) technique, Staphylococcus protein A (SPA) functionalized gold-magnetic nanoparticles and phage displayed antibodies, and using gold-magnetic nanoparticles coated with SPA and coupled with a polyclonal antibody (pcAb) as magnetic capturing probes, and Ru(bpy)32+-labeled phage displayed antibody as a specific luminescence probe, this study reports a new way to detect ricin with a highly sensitive and specific ECL immunosensor and amplify specific detection signals. The linear detection range of the sensor was 0.0001~200 µg/L, and the limit of detection (LOD) was 0.0001 µg/L, which is 2500-fold lower than that of the conventional ELISA technique. The gold-magnetic nanoparticles, SPA and Ru(bpy)32+-labeled phage displayed antibody displayed different amplifying effects in the ECL immunosensor and can decrease LOD 3-fold, 3-fold and 20-fold, respectively, compared with the ECL immunosensors without one of the three effects. The integrated amplifying effect can decrease the LOD 180-fold. The immunosensor integrates the unique advantages of SPA-coated gold-magnetic nanoparticles that improve the activity of the functionalized capturing probe, and the amplifying effect of the Ru(bpy)32+-labeled phage displayed antibodies, so it increases specificity, interference-resistance and decreases LOD. It is proven to be well suited for the analysis of trace amounts of ricin in various environmental samples with high recovery ratios and reproducibility.

1. Introduction

Electrochemiluminescence (ECL) immunosensors are used widely in biological detection due to their excellent sensitivity, specificity, stability, low background signals and easy manipulation [1,2]. Conventional ECL immunosensors usually employ a polyclonal antibody (pcAb) or monoclonal antibody (mcAb) labeled by a luminescent molecule to act as a luminescence probe. Because the range of groups which can be labeled on the surface of a polyclonal or monoclonal antibody molecule is limited, and multiple site labeling would lower the binding activity of the antibody and antigen, the sensitivity of conventional ECL immunosensors couldn’t be further improved, so much effort has been made to identify new antibody molecules which have more binding sites for labels. When the amount of labels increases, the antibody molecule maintains the binding activity to the target molecule, and the detection signal can be specifically amplified. As a kind of promising recognition molecule for immunodetection, phage displayed antibodies show broad application prospects. Compared with polyclonal antibodies or monoclonal antibodies, phage displayed antibodies offer high yields, small molecular weight, good stability, high affinity and sharp specificity [3,4,5,6,7]. Phage displayed antibodies show both antigen-binding properties and phage-like structures. A phage displayed antibody contains multiple capsid protein copies (about 2700 copies of pVIII). When a signal probe is constructed with this structural advantage and used in immunoassay, an amplifying effect for the specific signal of a target molecule will result. In [8], Kim and others used a phage displayed antibody labeled by horseradish peroxidase as a specific signal detection probe and achieved the quantitative detection of 3-phenoxybenzoic acid by magnetic immunoassay. Our research group has developed magnetic affinity immunoassays based on phage displayed antibodies labeled by enzymes, and achieved the detection of many kinds of toxin (β-bungarotoxin, Staphylococcus aureus enterotoxin B and abrin) [9,10,11]. However, because of its high molecular weight (40 kDa), when horseradish peroxidase was labelled, greater spatial hindrance occurs and this reduces the binding activity. Moreover, the enzyme is unstable and easy inactivated, so applications of phage antibodies labeled by enzymes are limited in detection capability. The use of a small molecule label instead of an enzyme to label phage displayed antibodies as reporter molecules, has been the focus of several studies. Ru(bpy)32+ is stable and has a small molecular weight. When it is used to label a phage displayed antibody, the spatial hindrance produced is small, and the capsid protein of the phage displayed antibody can carry more such labels. Meanwhile the binding activity of the phage displayed antibody and target molecule are maintained.
ECL immunosensors with magnetic particles as solid carrier are characterized by rapid separation, easy manipulation and strong anti-interference capability. In recent years, they have been widely applied in the detection of protein molecules such as AFP, anti-P53 antibody, CRP, CEA, etc. [12,13,14,15,16,17,18]. As a new functionalized magnetic material, gold-magnetic nanoparticles are inorganic magnetic nanocompounds formed from gold nanoparticle-coated super-paramagnetic Fe3O4 nanoparticles, which have the double advantages of gold nanoparticles and magnetic nanoparticles. Beyond enrichment and separation, they have characteristic good biocompatibility [19,20,21,22,23,24,25]. Staphylococcus protein A (SPA) can be linked with the Fc fragment of IgG molecules, whose Fab fragment are exposed outside, by hydrophobic interactions. This oriented fixation is better organized than direct physical adsorption or covalent binding, and it has less impact on the activity of antibodies [11,26,27,28].
In this study, the authors chose ricin as the target molecule, SPA-coated gold-magnetic nanoparticles coupled with anti-ricin pcAb as the magnetic capturing probe, and a Ru(bpy)32+-labeled phage displayed antibody as the specific luminescence probe, thus combining the various advantages of gold-magnetic nanoparticles and Ru(bpy)32+-labeled phage displayed antibodies, and established a new ECL immunosensor design with high sensitivity and specificity for ricin detection. Through comparison with other types of ECL immunosensor, we focused on the amplifying effects of gold-magnetic nanoparticles, SPA and the Ru(bpy)32+-labeled phage displayed antibodies. In the absence of bioterrorism or food poisoning incidents, it is difficult to obtain the actual material or real samples polluted by ricin. We therefore focused on the detection of simulated samples, using river water, fertilized soil (organic matter content >5%), butter biscuit (fat content >30%) and whole rabbit blood as a matrix that was then spiked with ricin in our lab. This study should provide technical support and a reference for clinical diagnosis, environmental monitoring, food hygiene inspection and anti-bioterrorism applications.

2. Materials and Methods

2.1. Reagents and Instruments

Ricin standard substance [29], anti-ricin polyclonal antibody [30,31], anti-ricin phage displayed antibody, abrin [9,32], super-paramagnetic Fe3O4 nanoparticles (magnetic nanoparticles, 15 nm) [11] and gold-magnetic nanoparticles (150 nm) were prepared in our lab. Staphylococcus aureus enterotoxin B (SEB), HAuCl4·H2O, hydroxylamine hydrochloride, FeCl3·6H2O, FeCl2·4H2O, polyethylene glycol 6000 (PEG6000), Staphylococcus protein A (SPA), bovine serum albumin (BSA), bis (2,2’-bipyridine)-4,4’-dicarboxybipyridine-ruthenium di(N-succinimidyl ester) (Ru(bpy)32+-NHS ester), N,N’-dimethylformamide (DMF) and tripropylamine (TPA) were purchased from Sigma (St. Louis, MO, USA). Mouse ScFv Module/Recombinant Phage Antibody System and E. coli TG1 were purchased from Amersham Biosciences (Uppsala, Sweden). Horseradish peroxidase conjugated goat anti-mouse IgG (HRP-goat anti-mouse IgG) was purchased from Beijing Biosynthesis Biotechnology Co., Ltd. (Beijing, China). Horseradish peroxidase conjugated anti-M13 monoclonal antibody (HRP-anti-M13 mcAb) was purchased from GE Healthcare Europe GmbH (Freiburg, Germany). The ECL substrate (ProCell) and the cleaning solution (CleanCell) were purchased from Biolot Diagnostics Co., Ltd. (Beijing, China). Filtrate tube of 50,000 molecular weight cut-off (MWCO) (Vivalpin 500 μL) was purchased from Sartorius Stedim Biotech GmbH (Goettingen, Germany). River water was obtained from the Kunyu River (Beijing, China). Fertilized soil (organic matter content >5%) was from the Fenghuang Ridge (Beijing, China), Butter biscuit (fat content >30%) was obtained from Master Kong, Ltd. (Beijing, China). Whole rabbit blood was from venous blood extracted from rabbit. The above four samples were all randomly collected from the environment.
A280nm and A450nm values were respectively determined on a BioMATE 3S UV-Vis spectrophotometer (Thermo Fisher Scientific Inc., Waltham, MA, USA) and a Type 680 microplate reader (Bio-Rad, Hercules, CA, USA). Affinity was determined on ProteOn XPR Protein Interaction Array System (Bio-Rad). Magnetic separation operation was carried out on magnetic separation rack (Dynal Biotech GmbH, Hamburg, Germany). ECL reactions were performed on the immuno-magnetic electrochemiluminescence instrument developed by our laboratory and Xianruimai Analytical Instruments Co., Ltd. (Xi’an, China).

2.2. Preparation of Gold-Magnetic Nanoparticles

Gold-magnetic nanoparticles were synthesized according to a literature method [33] with slight modifications. Super-paramagnetic Fe3O4 nanoparticles (0.2 g) obtained using the microwave co-precipitation method were dissolved in ultrapure water (100 mL), then ultrasonicated for 15 min. Then 1% HAuCl4·4H2O (10 mL) was added the solution and allowed to react at room temperature for 1 h with a stirring speed of 1500 rpm. Next 50 mM hydroxylamine hydrochloride (40 mL) was added the solution and allowed to react at room temperature for 1 h with a stirring speed of 2000 rpm. Magnetic separation was performed and the supernatant was discarded. 1 M HCl (100 mL) was added and stirred for 4 h to remove the uncoated Fe3O4 nanoparticles. The gold nanoparticles produced in the preparation were removed by magnetic separation at the same time. The final product was then washed with ultrapure water to neutrality and diluted to 50 mL for later use. The yield of solid product was calculated.

2.3. Preparation and Characterization of Anti-Ricin Phage Displayed Antibody

2.3.1. Preparation of a Large Phage Displayed Single-Chain Fragment Variable (scFv) Antibody Library

The phage displayed single-chain fragment variable (ScFv) antibody library was prepared according to standard protocols [4]. The variable heavy chain gene region (VH) and variable light chain gene (VL) region of the antibody were amplified using a Mouse ScFv Module/Recombinant Phage Antibody System and assembled into the ScFv gene segment, which was combined with vector PHB-1HSCFV, and the vector pHB-mScFv was constructed and transformed into TG1 cells. Transformed bacteria were plated onto a LB plate (containing 170 μg/mL chloramphenicol), and cultivated at 37 °C overnight. The next day, cultured bacteria were suspended in 2×YT medium (containing 50 μg/mL chloramphenicol and 20% glucose), and shake-cultured at 37 °C and 250 rpm until the OD600 reached 0.5. M13KO7 helper phage was added to the cultivated bacteria with a ratio of 1:10, and shake-cultured at 37 °C and 150 rpm for 1 h, centrifuged and resuspended in 200 mL 2×YT medium (containing 170 μg/mL chloramphenicol and 50 μg/mL kanamycin), and shake-cultured at 37 °C and 250 rpm overnight. The next day, the cultured bacteria were centrifuged and the supernatant collected. Phage was purified by polyethylene glycol/NaCl precipitation and resuspended in a total volume of 2 mL PBS. Thus the phage displayed antibody library was obtained and the titer was determined.

2.3.2. Screening of Anti-Ricin Phage Displayed Antibody

Anti-ricin phage displayed antibody was synthesized according to the literature method with slight modifications [34,35]. The ricin was diluted to 50 μg/mL with 0.05 M Na2CO3-NaHCO3 buffer (pH 9.6), then was incubated in 96-well microplates at 4 °C overnight for immobilization. Each well was washed three times with PBST (0.01 M PBS buffer, containing 0.05% Tween-20, pH 7.4). Blocking buffer (0.01 M PBS buffer, containing 1% BSA, pH 7.4) was added (150 μL/well) and incubated at 37 °C for 1 h, and the wells were then washed with PBST three times. Phage displayed antibody ScFv library (300 μL) was reacted with 100 μL of blocking buffer at room temperature for 15 min, then added to each well, and incubated at 37 °C for 2 h. The phage displayed antibody ScFv library was extracted, and washed 10 times with PBST and PBS, respectively, 0.1 M glycine-HCl buffer (pH 2.2, 100 μL) was added to each well, reacted at 37 °C for 15 min, then neutralized with 6 μL of 2 M Tris and collected. Eluted phages (10 μL) were added to 5 mL E. coli TG1 mid-log cells. The mixture was incubated at 37 °C for 20 min, and then plated onto a LB plate (containing 50 μg/mL chloramphenicol). The amount of phages eluted was calculated. The rest of the eluted phages was added to 5 mL E. coli TG1 mid-log cells. The mixture was incubated at 37 °C for 20 min, centrifuged and resuspended in a total volume of 1 mL 2×YT medium, then plated onto a LB plate (containing 170 μg/mL chloramphenicol), at 37 °C overnight. The next day, bacterial colonies on the plate were suspended, rescued with M13KO7 helper phage and extracted, the phage antibody titer was determined, and then the recovery ratio can be calculated. For subsequent phage selections, the steps were same as in the first round, however the concentration of ricin for immobilization was gradually decreased, to 25 μg/mL in the second round and 15 μg/mL in the third round.

2.3.3. Characterization of Anti-Ricin Phage Displayed Antibody Positive Clones by ELISA

From the plate which was used to determine the titer of phage antibody after three rounds, 20 bacterial colonies were selected to add to 5 mL 2×YT medium (containing 170 μg/mL chloramphenicol), grown until the OD600 reached to 0.5. M13KO7 helper phage was added, incubated at 37 °C and 150 rpm for 1 h, centrifuged and resuspended in 5 mL 2×YT medium (containing 170 μg/mL chloramphenicol and 50 μg/mL kanamycin), incubated at 30 °C and 250 rpm overnight. The next day, bacterial solution was centrifuged and the supernatant obtained. Selected phage displayed antibody-positive clones by indirect ELISA.

2.3.4. DNA Sequencing and Binding Affinity of Anti-Ricin Phage Displayed Antibody

DNA sequencing was conducted with selected phage displayed antibody positive clones. The binding affinity of anti-ricin phage displayed antibody and ricin was determined by a PlexArrayTM Kx5 System.

2.4. Preparation of the SPA-Coated Gold-Magnetic Nanoparticles Functionalized Capturing Probes

Gold-magnetic nanoparticles (1 mg) were washed with 0.01 M PBS buffer (pH 7.4) and magnetic separation was used to discard the supernatant. Then a certain amount of 1 mg/mL SPA was added. By physical adsorption, SPA was immobilized on the surface of the gold-magnetic nanoparticles, and reacted at room temperature for 2 h with stirring, followed by washing with 0.01 M PBS buffer (pH 7.4) and magnetic separation to remove the supernatant. A certain amount of 1 mg/mL ricin polyclonal antibody was added to allow to react at room temperature for 1 h with stirring, the gold-magnetic nanoparticles were then washed with 0.01 M PBS buffer (pH 7.4), diluted to 1 mL and stored at 4 °C until use. The final concentration was 1 mg/mL.

2.5. Preparation of ECL Probes

The authors adopted the method of [9] to prepare ECL probes. Anti-ricin phage displayed antibody (100 μL) with a titer of 1 × 10¹⁴ PFU/mL (1.6 × 10⁻⁷ M) and 500 μL of 0.05 M carbonate buffer (pH 9.6) were mixed. Then 300 μL of Ru(bpy)32+-NHS ester with concentration of 1 mg/mL (8.76 × 10⁻⁴ M) and DMF were added and allowed to react at room temperature and away from light for 12 h with stirring. Unbound Ru(bpy)32+-NHS ester was removed by filtrate tube, and the ECL probes were resuspended in 0.01 M PBS buffer (pH 7.4) to 1 mL and stored at 4 °C and away from light until use. The final concentration was 1.6 × 10⁸ M.

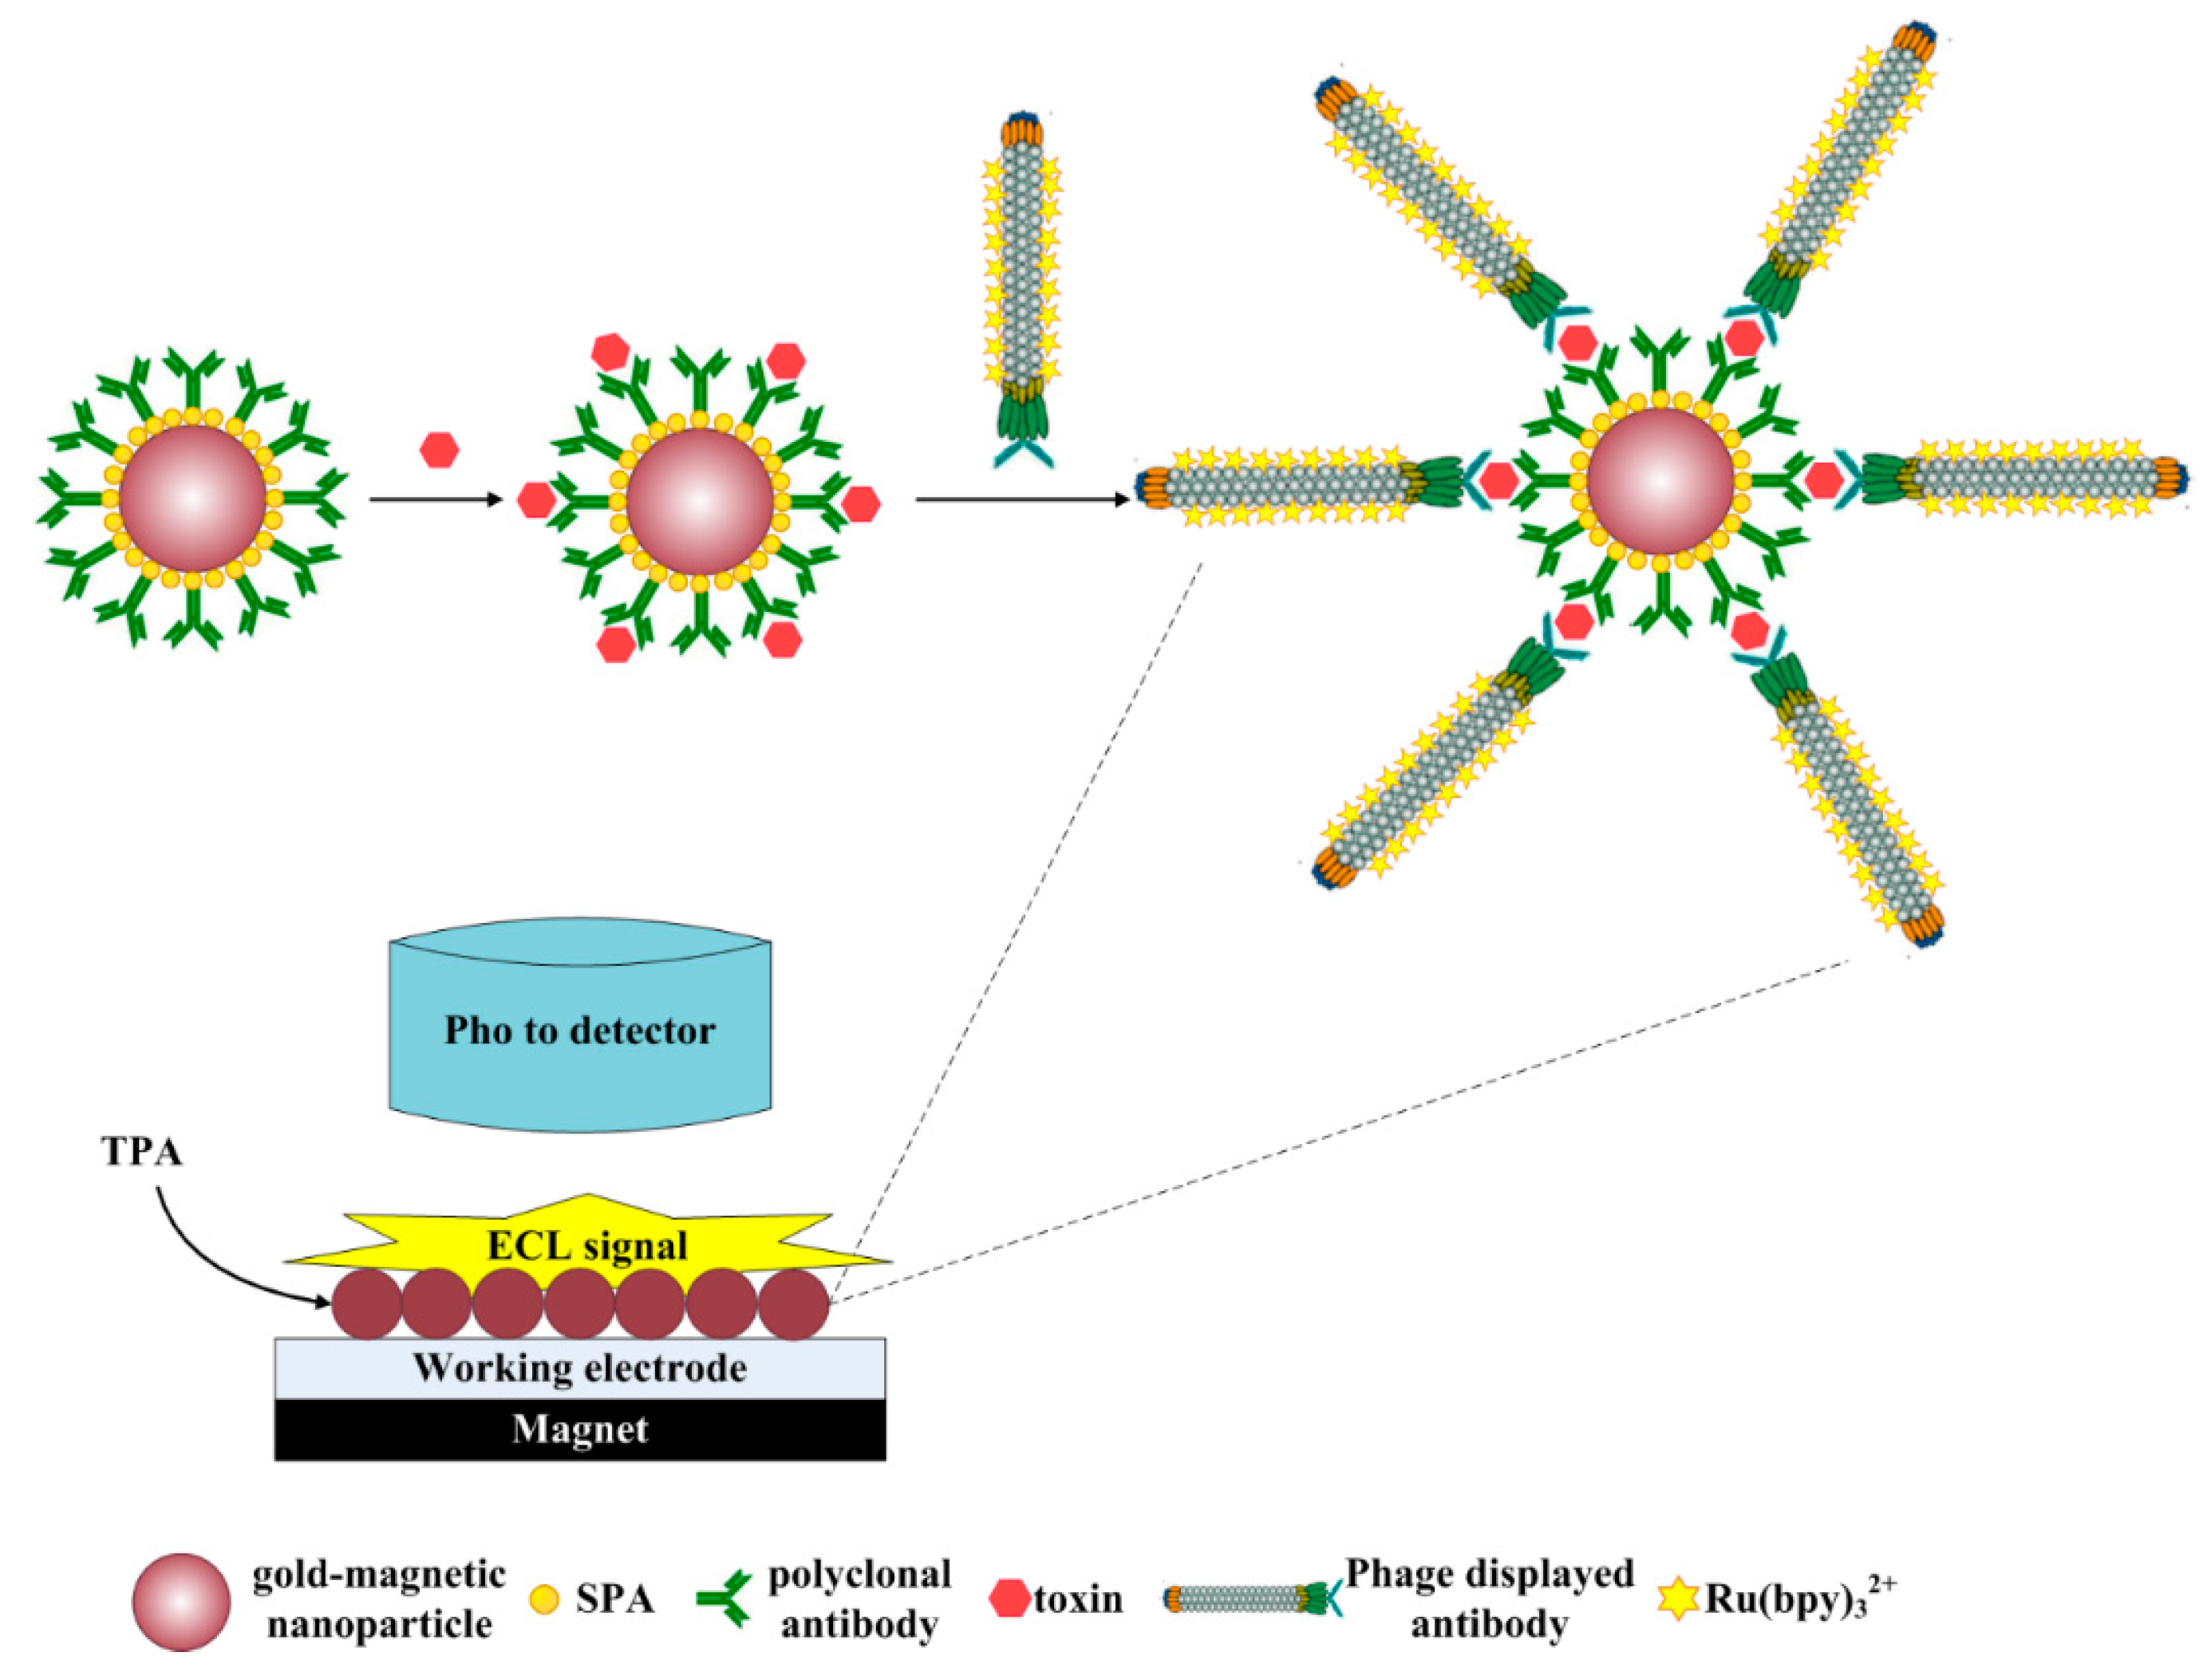
2.6. Establishment of the ECL Immunosensor Based on Gold-Magnetic Nanoparticles and Phage Displayed Antibody

The 1 mg/mL SPA-coated gold-magnetic nanoparticles coupled with polyclonal antibody capturing probe (100 μL) and simulated samples or ricin standard substances of different concentrations (100 μL), which were diluted with dilution buffer (0.01 M PBS buffer, pH 7.4), were mixed at room temperature for 15 min with stirring, then washed two times with 0.01 M PBS buffer (pH 7.4) and diluted to 200 μL. Then 100 μL of 1.6 × 10⁸ M ECL probe was added and mixed at room temperature for 1 h with stirring, washed two times with 0.01 M PBS buffer (pH 7.4) and diluted to 200 μL to obtained the gold-magnetic nanoparticles complex. The gold-magnetic nanoparticles complex (20 μL) was injected into the detector cell of the ECL immunosensor, and deposited on the surface of the working electrode by the action of a magnet. Then, by setting the voltage between the working electrode and the reference electrode at 1.25 V, the ECL reaction between Ru(bpy)32+-labeled phage displayed antibody and tripropylamine (TPA) in the solution was triggered, generating photons. The optical signal was detected by a photomultiplier tube (PMT) detector [36]. The strategy is shown in Figure 1.

2.7. Regeneration of the Electrodes Surface of ECL Immunosensor

After the tests, the magnet on the electrode was removed. The detector cell of the ECL immunosensor was repeatedly washed with ultrapure water and cleaning solution (CleanCell) was injected. On the electrodes surface a step pulse reaction occurred, then the electrodes were washed with ultrapure water and ECL substrate (ProCell) until the ECL intensity value recovered its baseline level and can be used again.

2.8. Limit of Detection, Linear Range and Specificity

Based on the calibration curve of the ECL immunosensor (method 1), limit of detection, linear range and other parameters of this method were determined, and 1 μg/L abrin, SEB, BSA and other non-target proteins were also analyzed using this method. In order to examine the specificity of this method, the results were compared with those of ricin. Under the same conditions, five ECL immunosensors were compared, namely SPA-coated gold-magnetic nanoparticles coupled with polyclonal antibody capturing probe-toxins-Ru(bpy)32+-labeled phage displayed antibody luminescence probe detection scheme (Method 1), SPA-coated magnetic nanoparticles coupled with polyclonal antibody capturing probe-toxins-Ru(bpy)32+-labeled phage displayed antibody luminescence probe detection scheme (Method 2), gold-magnetic nanoparticles coupled with polyclonal antibody capturing probe-toxins-Ru(bpy)32+-labeled phage displayed antibody luminescence probe detection scheme (Method 3), SPA-coated gold-magnetic nanoparticles coupled with polyclonal antibody capturing probe-toxins-Ru(bpy)32+-labeled monoclonal antibody luminescence probe detection scheme (Method 4) and magnetic nanoparticles coupled with polyclonal antibody capturing probe-toxins-Ru(bpy)32+-labeled mcAb luminescence probe detection scheme (Method 5). Through comparison of the five ECL immunosensors, the signal amplifying effects of gold-magnetic nanoparticles, SPA-oriented antibody and Ru(bpy)32+-labeled phage displayed antibody were investigated. In addition, through comparison with conventional double-antibody sandwich ELISA (Method 6), the low LOD performance of the ECL immunosensor based on gold-magnetic nanoparticles and Ru(bpy)32+-labeled phage displayed antibody was investigated.

2.9. Measurement of Simulated Ricin Samples

Fertilized soils (1 g, organic matter >5%), butter biscuit (1 g, fat content >30%), whole rabbit blood (10 μL) and river water (1 mL) were added into 4 μL of 10 mg/L ricin standard. Then the mixture was diluted to 8 mL with dilution buffer (0.01 M PBS buffer, pH 7.4) to get a final ricin concentration of 5 μg/L. The river water samples were directly measured, and the fertilized soils samples were centrifuged at 5000 g for 20 min, while butter biscuit and whole rabbit blood samples were centrifuged at 10,000 g for 15 min and 10 min, respectively. The supernatants were then collected and the recovery rate, relative standard deviation and other indexes of the detection were analyzed and calculated.

3. Results

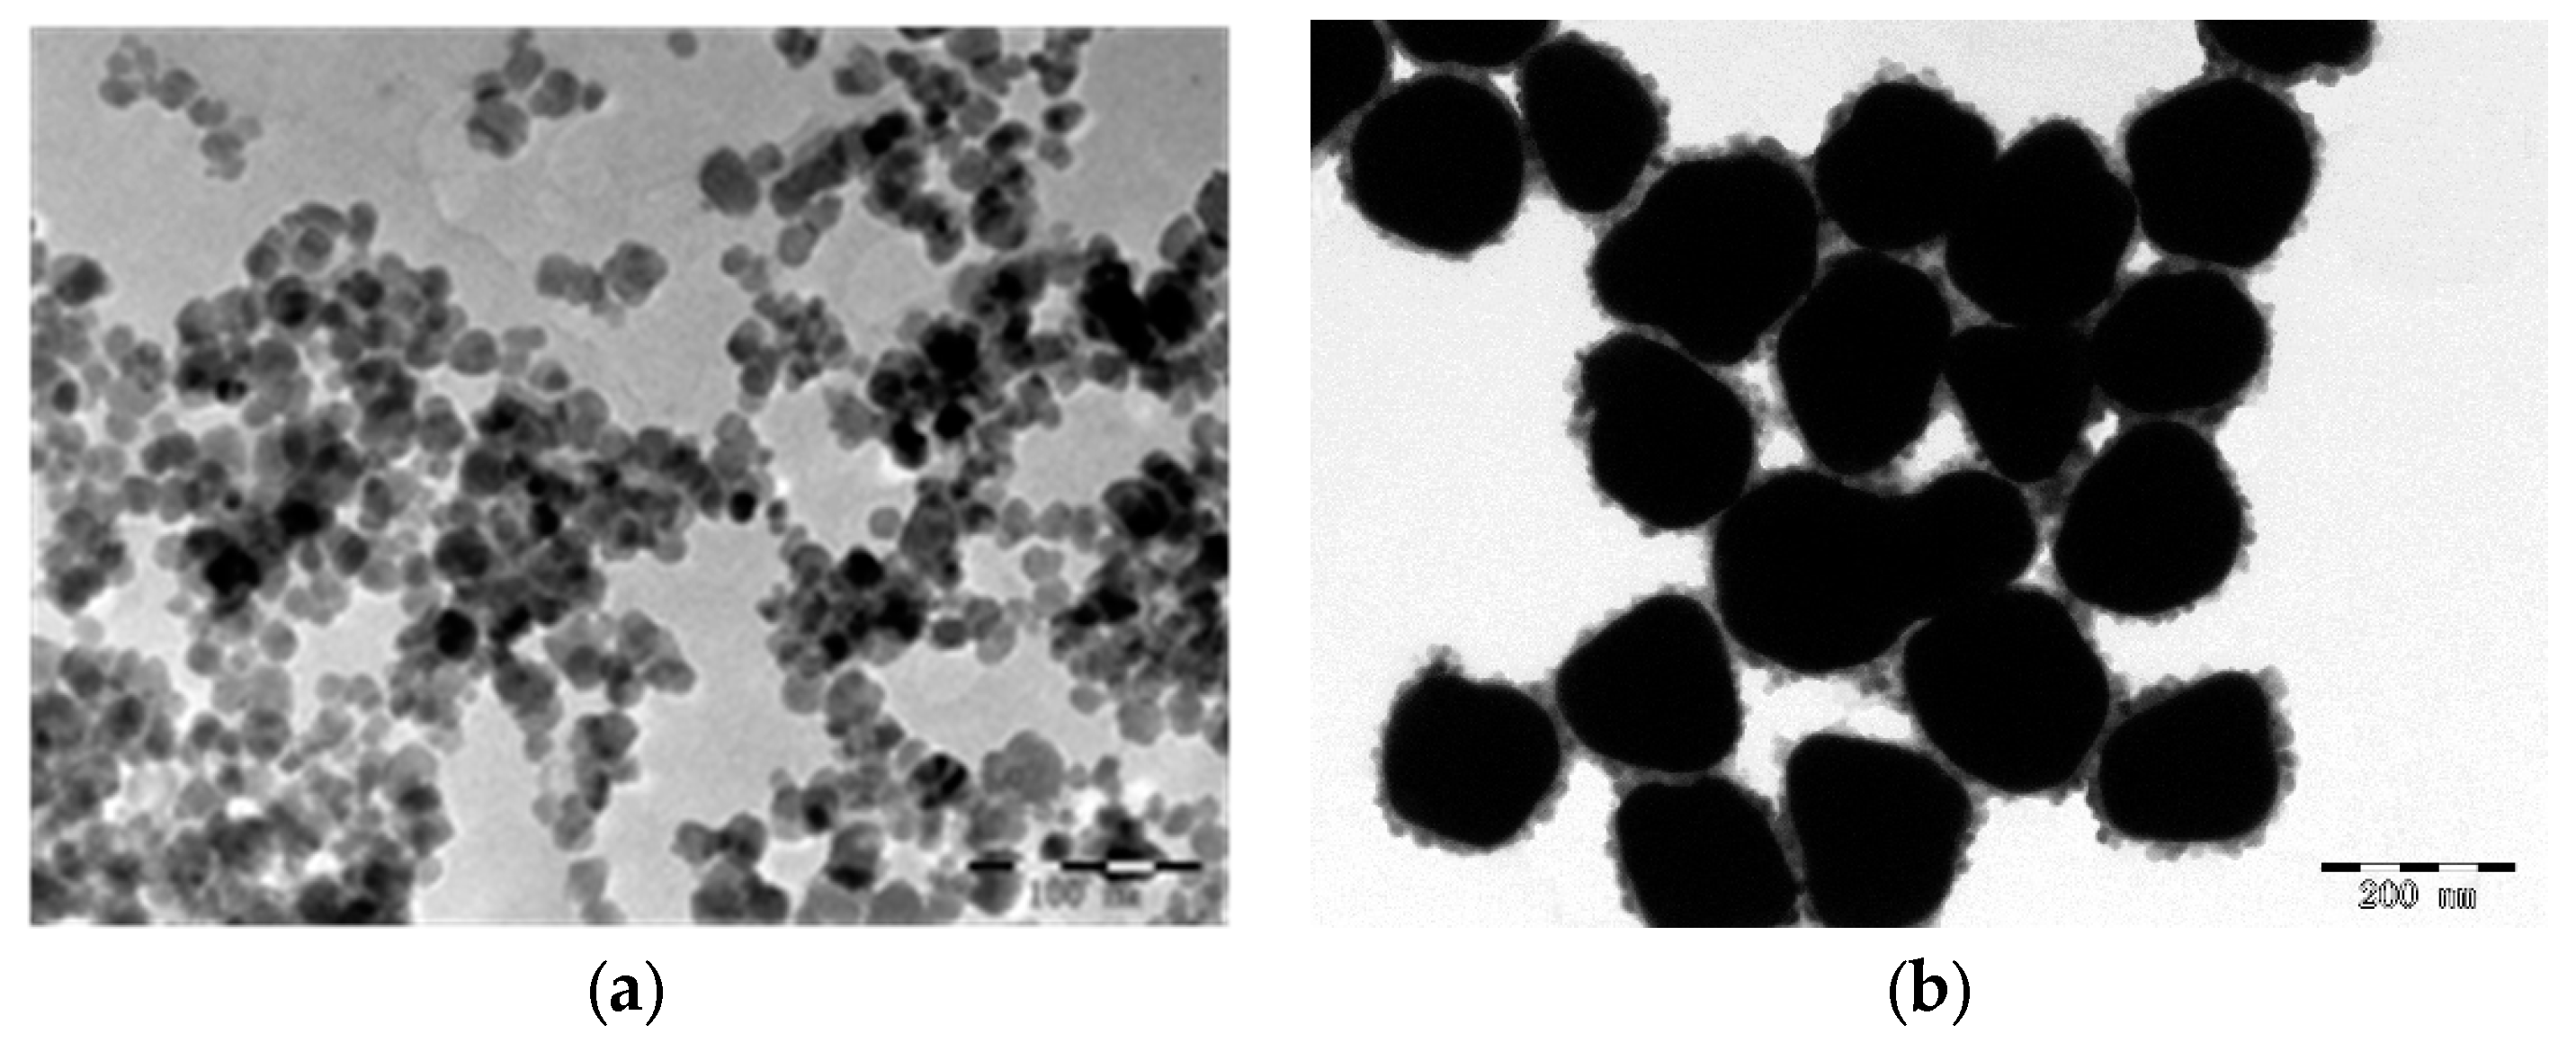
3.1. Preparation of Gold-Magnetic Nanoparticles

By combining microwave treatment with conventional chemical co-precipitation procedures, our research group obtained super-paramagnetic Fe3O4 nanoparticles with excellent dispersion, spherical morphology, a particle size of 15 nm, and a saturation magnetization of 78.875 emu/g. Compared with conventional co-precipitation methods, this method simplifies the preparation of Fe3O4 magnetic nanoparticles and shortens the reaction time. Based on this our research group obtained gold-magnetic nanoparticles with excellent dispersion, spherical morphology, particle size of 150 nm, saturation magnetization of 63.151 emu/g and a solid yield of 2 mg/mL using the hydroxylamine hydrochloride reduction method. Figure 2 shows a TEM image of the magnetic nanoparticles and gold-magnetic nanoparticles. The yields of solid magnetic nanoparticle and gold-magnetic nanoparticle products were 6 mg/mL and 2 mg/mL, respectively.

3.2. Preparation of Magnetic Ricin-Capturing Probe

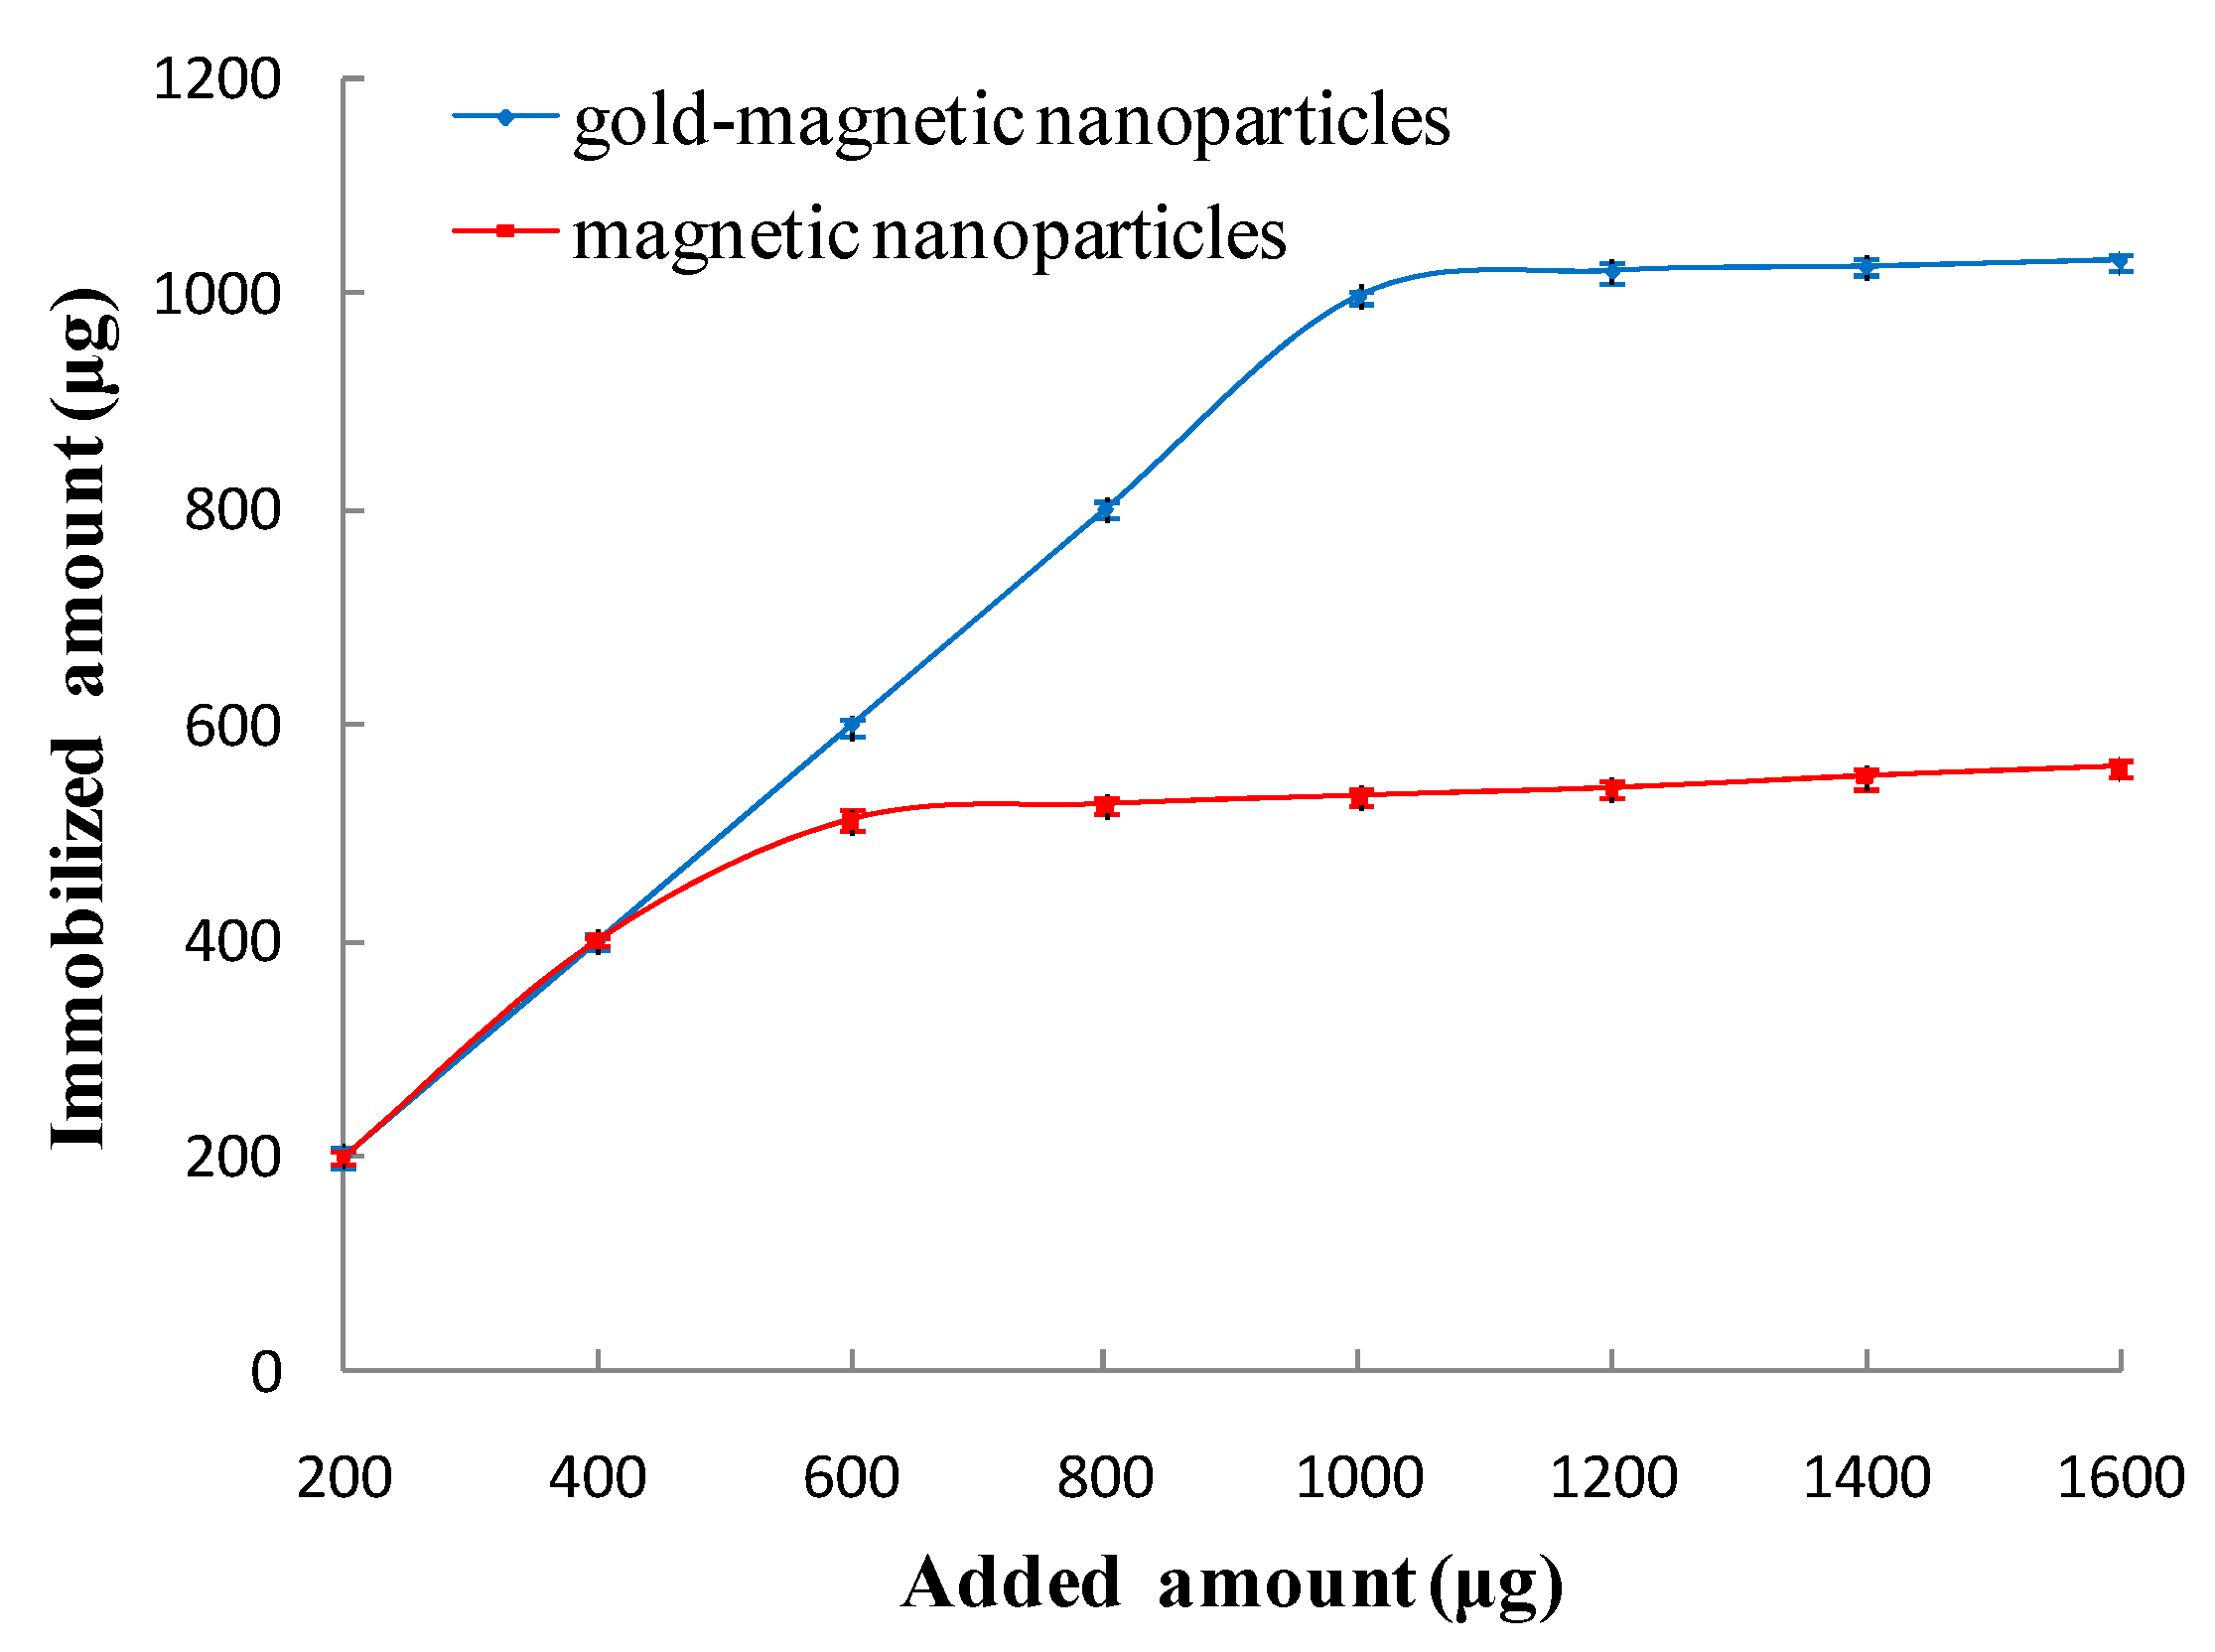
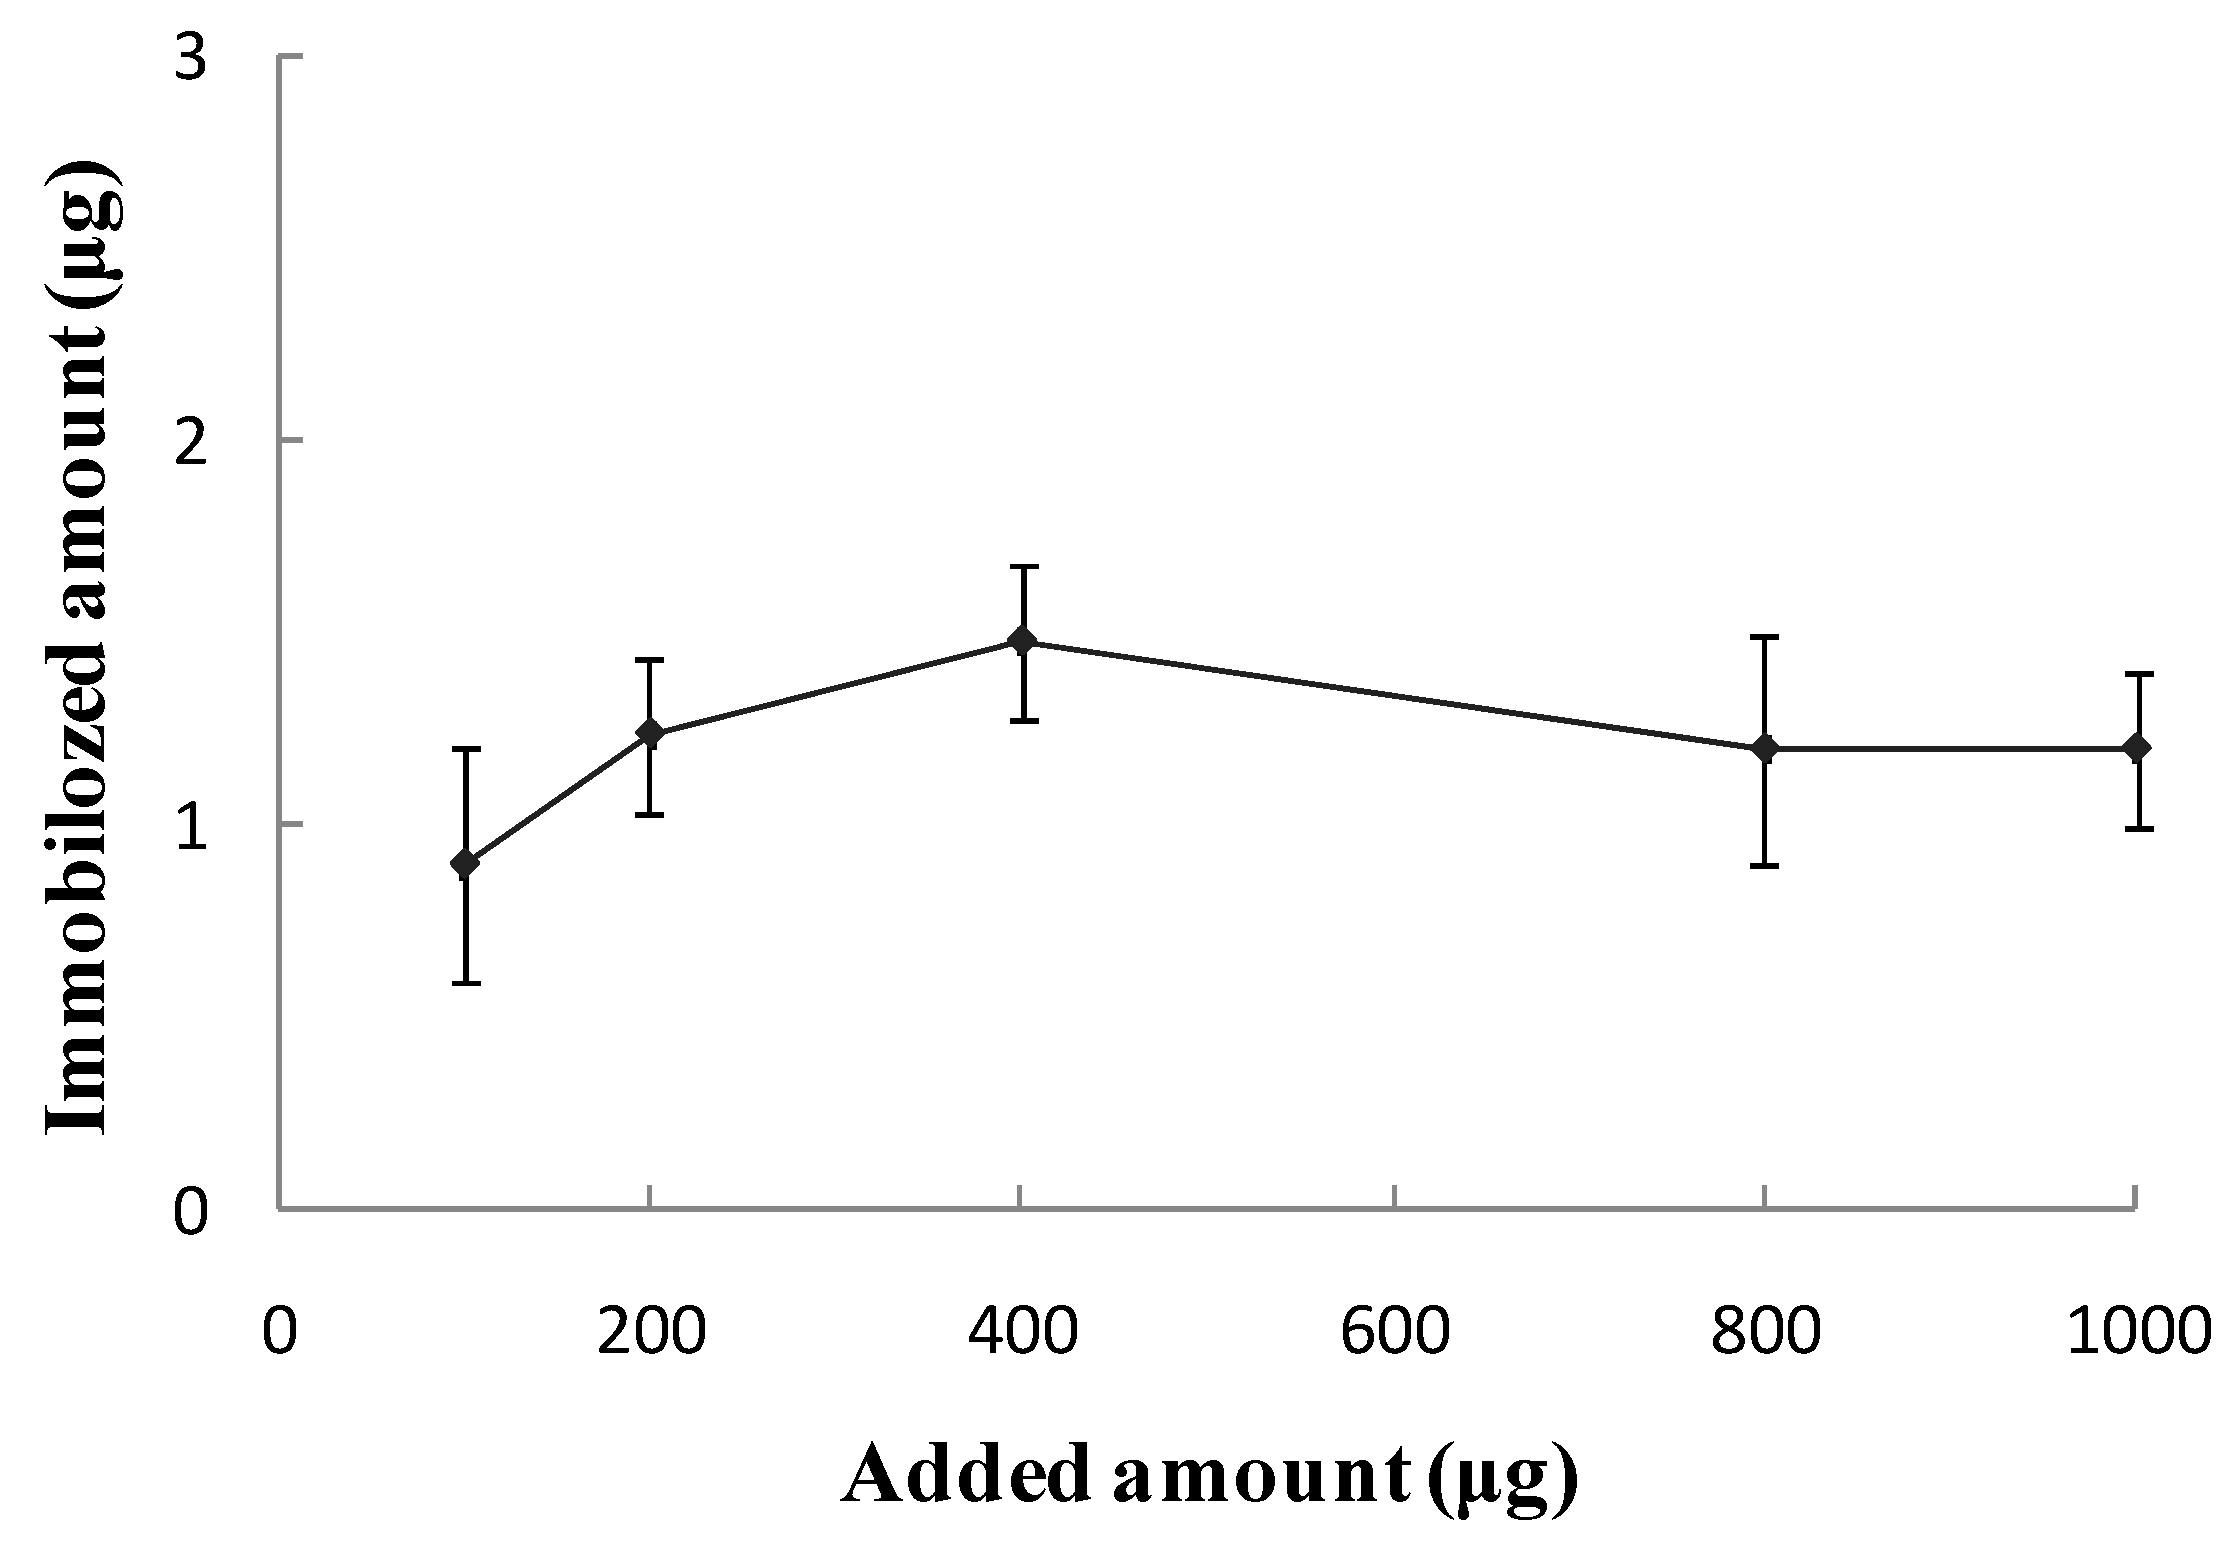
3.2.1. Optimal Amount of Immobilized Anti-Ricin Polyclonal Antibody

First, by physical adsorption of magnetic nanoparticles or gold-magnetic nanoparticles and protein, a certain amount of SPA was immobilized on the surface of the magnetic nanoparticles and gold-magnetic nanoparticles. A280nm of the SPA solution was determined before and after immobilization, and the amount of immobilized SPA per mg of magnetic nanoparticles and gold-magnetic nanoparticles was calculated. As shown in Table 1 and Table 2, as the amount of added SPA was increased, the amount of immobilized SPA binding to the magnetic nanoparticles and gold-magnetic nanoparticles gradually increased and tended to reach saturation. It was confirmed that the optimal amount of immobilized SPA on 1 mg of magnetic nanoparticles and gold-magnetic nanoparticles was 240 µg and 320 µg, respectively, and the amount of immobilized SPA on 1 mg of magnetic nanoparticles and gold-magnetic nanoparticles was 111 µg and 168 µg, respectively. Figure 3 shows the UV-Vis spectrum of 240 μg SPA solution before and after binding to magnetic nanoparticles. Figure 4 shows the UV-Vis spectrum of 320 μg SPA solution before and after binding to gold-magnetic nanoparticles.
Since SPA was specifically bound to the Fc fragment of IgG molecules, a certain amount of anti- ricin polyclonal antibody (pcAb) was added to get the SPA-coated magnetic nanoparticle functionalized capturing probe and SPA-coated gold-magnetic nanoparticle functionalized capturing probe. A280nm of the anti-ricin pcAb solution was determined before and after immobilization, and according to the results, the actual amount of immobilized anti-ricin pcAb on 1 mg of magnetic nanoparticles and gold-magnetic nanoparticles was calculated to be 512 µg and 998 µg, respectively (Figure 5). Theoretically, the amount of immobilized anti-ricin pcAb to 1 mg of magnetic nanoparticles and gold-magnetic nanoparticles respectively was 845 µg and 1280 µg as calculated according to the amount of immobilized SPA. The actual amount was 60.6% and 77.9% of the theoretical maximum. SPA is bivalent, which means that each SPA molecule can theoretically bind 2 IgG molecules. However, due to the steric hindrance effect, each SPA molecule bond only 1.2 molecules and 1.6 molecules of anti-ricin pcAb molecules in practice.
Compared with the SPA-coated magnetic nanoparticles functionalized capturing probe, the SPA-coated gold-magnetic nanoparticles functionalized capturing probe has more amount of immobilized SPA and anti-ricin pcAb, indicating that the gold-magnetic nanoparticles can provide more active surface and more biomolecule probe immobilization. In addition SPA can accomplish orientation immobilization and provide an ordered arrangement of antibody on surface of gold-magnetic nanoparticles, the steric hindrance effect of the molecules is reduced, thus the activity of the functionalized capturing probe was improved and and detection limit was decreased.
To verify that the oriented immobilization of antibody occurred via the use of Staphylococcus protein A rather than of physical adsorption, a control experiment was performed. First, a certain amount of BSA was immobilized on the surface of the gold-magnetic nanoparticles by physical adsorption. A280nm of the BSA solution was determined before and after immobilization, and the amount of immobilized BSA per mg of gold-magnetic nanoparticles was calculated. As shown in Table 3, as the amount of added BSA was increased, the amount of immobilized BSA binding to gold-magnetic nanoparticles gradually increased and tended to reach saturation. It was confirmed that the optimal amount of added BSA for 1 mg of gold-magnetic nanoparticles was 400 µg, and the amount of immobilized BSA on 1 mg of gold-magnetic nanoparticles was 265 µg.
Then a certain amount of anti- ricin pcAb was added. A280nm of the anti-ricin pcAb solution was determined before and after immobilization, and the actual amount of immobilized the anti-ricin pcAb was calculated. As shown in Figure 6, as the amount of added anti-ricin pcAb was increased, the amount of immobilized anti-ricin pcAb remained at 0.9 μg~1.48 μg and no longer increased. It was shown that the sites on the surface of the gold-magnetic nanoparticles were occupied by BSA, and the anti-ricin pcAb couldn’t be immobilized on the surface of the gold-magnetic nanoparticles any more by physical adsorption, so the oriented immobilization of anti-ricin pcAb occurred via the use not of physical adsorption but of Staphylococcus protein A.

3.2.2. Qualification of the SPA-Coated Gold-Magnetic Nanoparticles Functionalized Capturing Probe

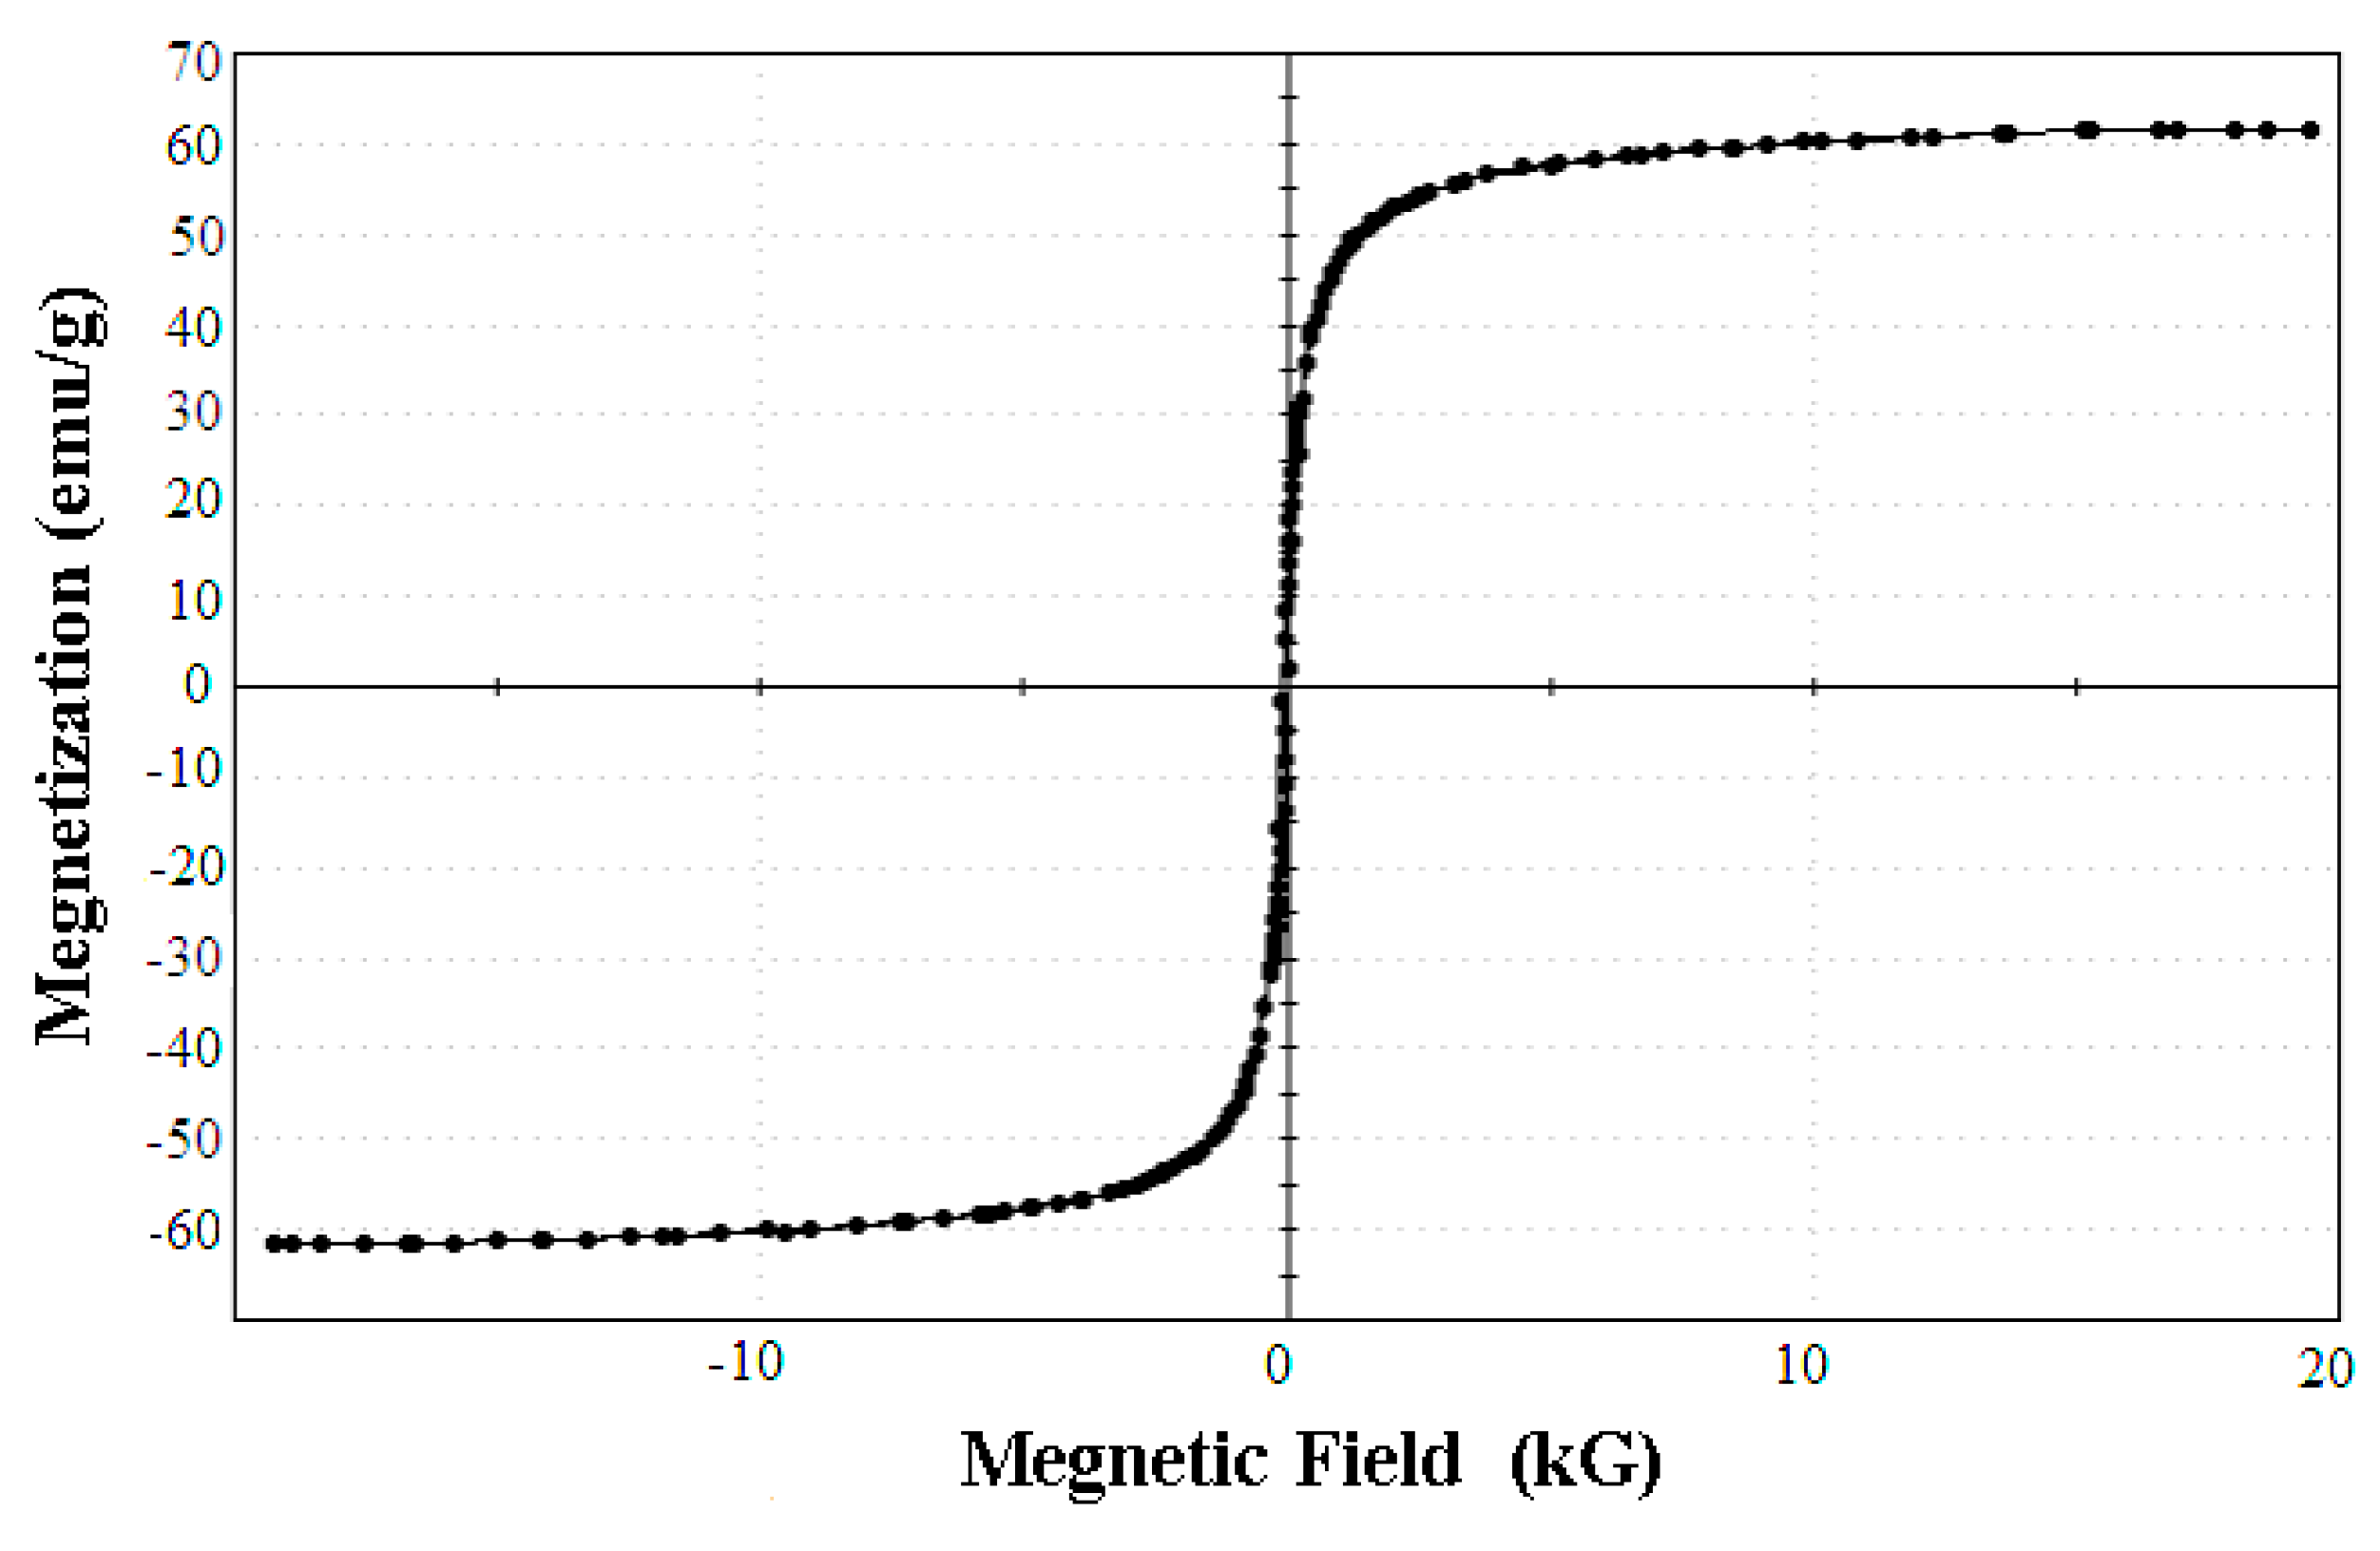
The Magnetic Features of the SPA-Coated Gold-Magnetic Nanoparticles Functionalized Capturing Probe

The magnetic features of the SPA-coated gold-magnetic nanoparticles functionalized capturing probe was checked by VSM (see Figure 7), and the saturation magnetization of the magnetic ricin-capturing probe was 61.357 emu/g. Compared with gold-magnetic nanoparticles, their saturation magnetization could be considered the same. The result showed that prepared the SPA-coated gold-magnetic nanoparticles functionalized capturing probe had good magnetic features.

Biological Activity of the SPA-Coated Gold-Magnetic Nanoparticles Functionalized Capturing Probe

Biological activity of the SPA-coated gold-magnetic nanoparticles functionalized capturing probe was validated. The SPA-coated gold-magnetic nanoparticles functionalized capturing probe (100 μL) was mixed with 100 μL of ricin (0.032~500 μg/L) to react. Then anti-ricin mcAb (100 μL, 1 mg/mL) and HRP-goat anti-mouse IgG (100 μL) were added. Under the same conditions, double-antibody magnetic affinity immunoassay (MAIA) was used to determine the A450nm. According to the change of the A450nm, the biological activity of the gold-magnetic nanoparticles functionalized capturing probe was checked. As shown in Figure 8, as the concentration of ricin increased, A450nm gradually increased as well, indicating that the probe can combine with the target toxin with a good dose-effect relationship. The logarithm of ricin concentration and A450nm showed a significant rectilinear correlation, and the regression equation was Y = 0.4902X + 1.0414 (R = 0.9934, P < 0.0001, N = 15). The results showed that prepared the SPA-coated gold-magnetic nanoparticles functionalized capturing probe with good activity can be used in the test.

3.3. The Preparation and Characterization of Anti-Ricin Phage Displayed Antibody

3.3.1. Screening of Anti-Ricin Phage Displayed Antibody

After amplification of the phage displayed ScFv antibody library (titer of 1.1 × 10¹³ PFU/mL), affinity panning was processed by “adsorption-elution-amplification” for three rounds, with ricin as target molecule. In the process, the amount of ricin was reduced step by step to improve the panning effects. In the first round, the amount of coated ricin on a 96-well microplate was 5 μg per well. The amount was 2.5 μg per well in the second round and 1.5 μg per well in the third round, respectively. In each round, the titer of eluted phage was determined to calculate the recovery ratio. As shown in Table 4, the titer of eluted phage and recovery ratio both increased in the process, the phage which carried anti-ricin antibody enriched. After third round, the recovery ratio was not significantly increased any more, and the screening ended.

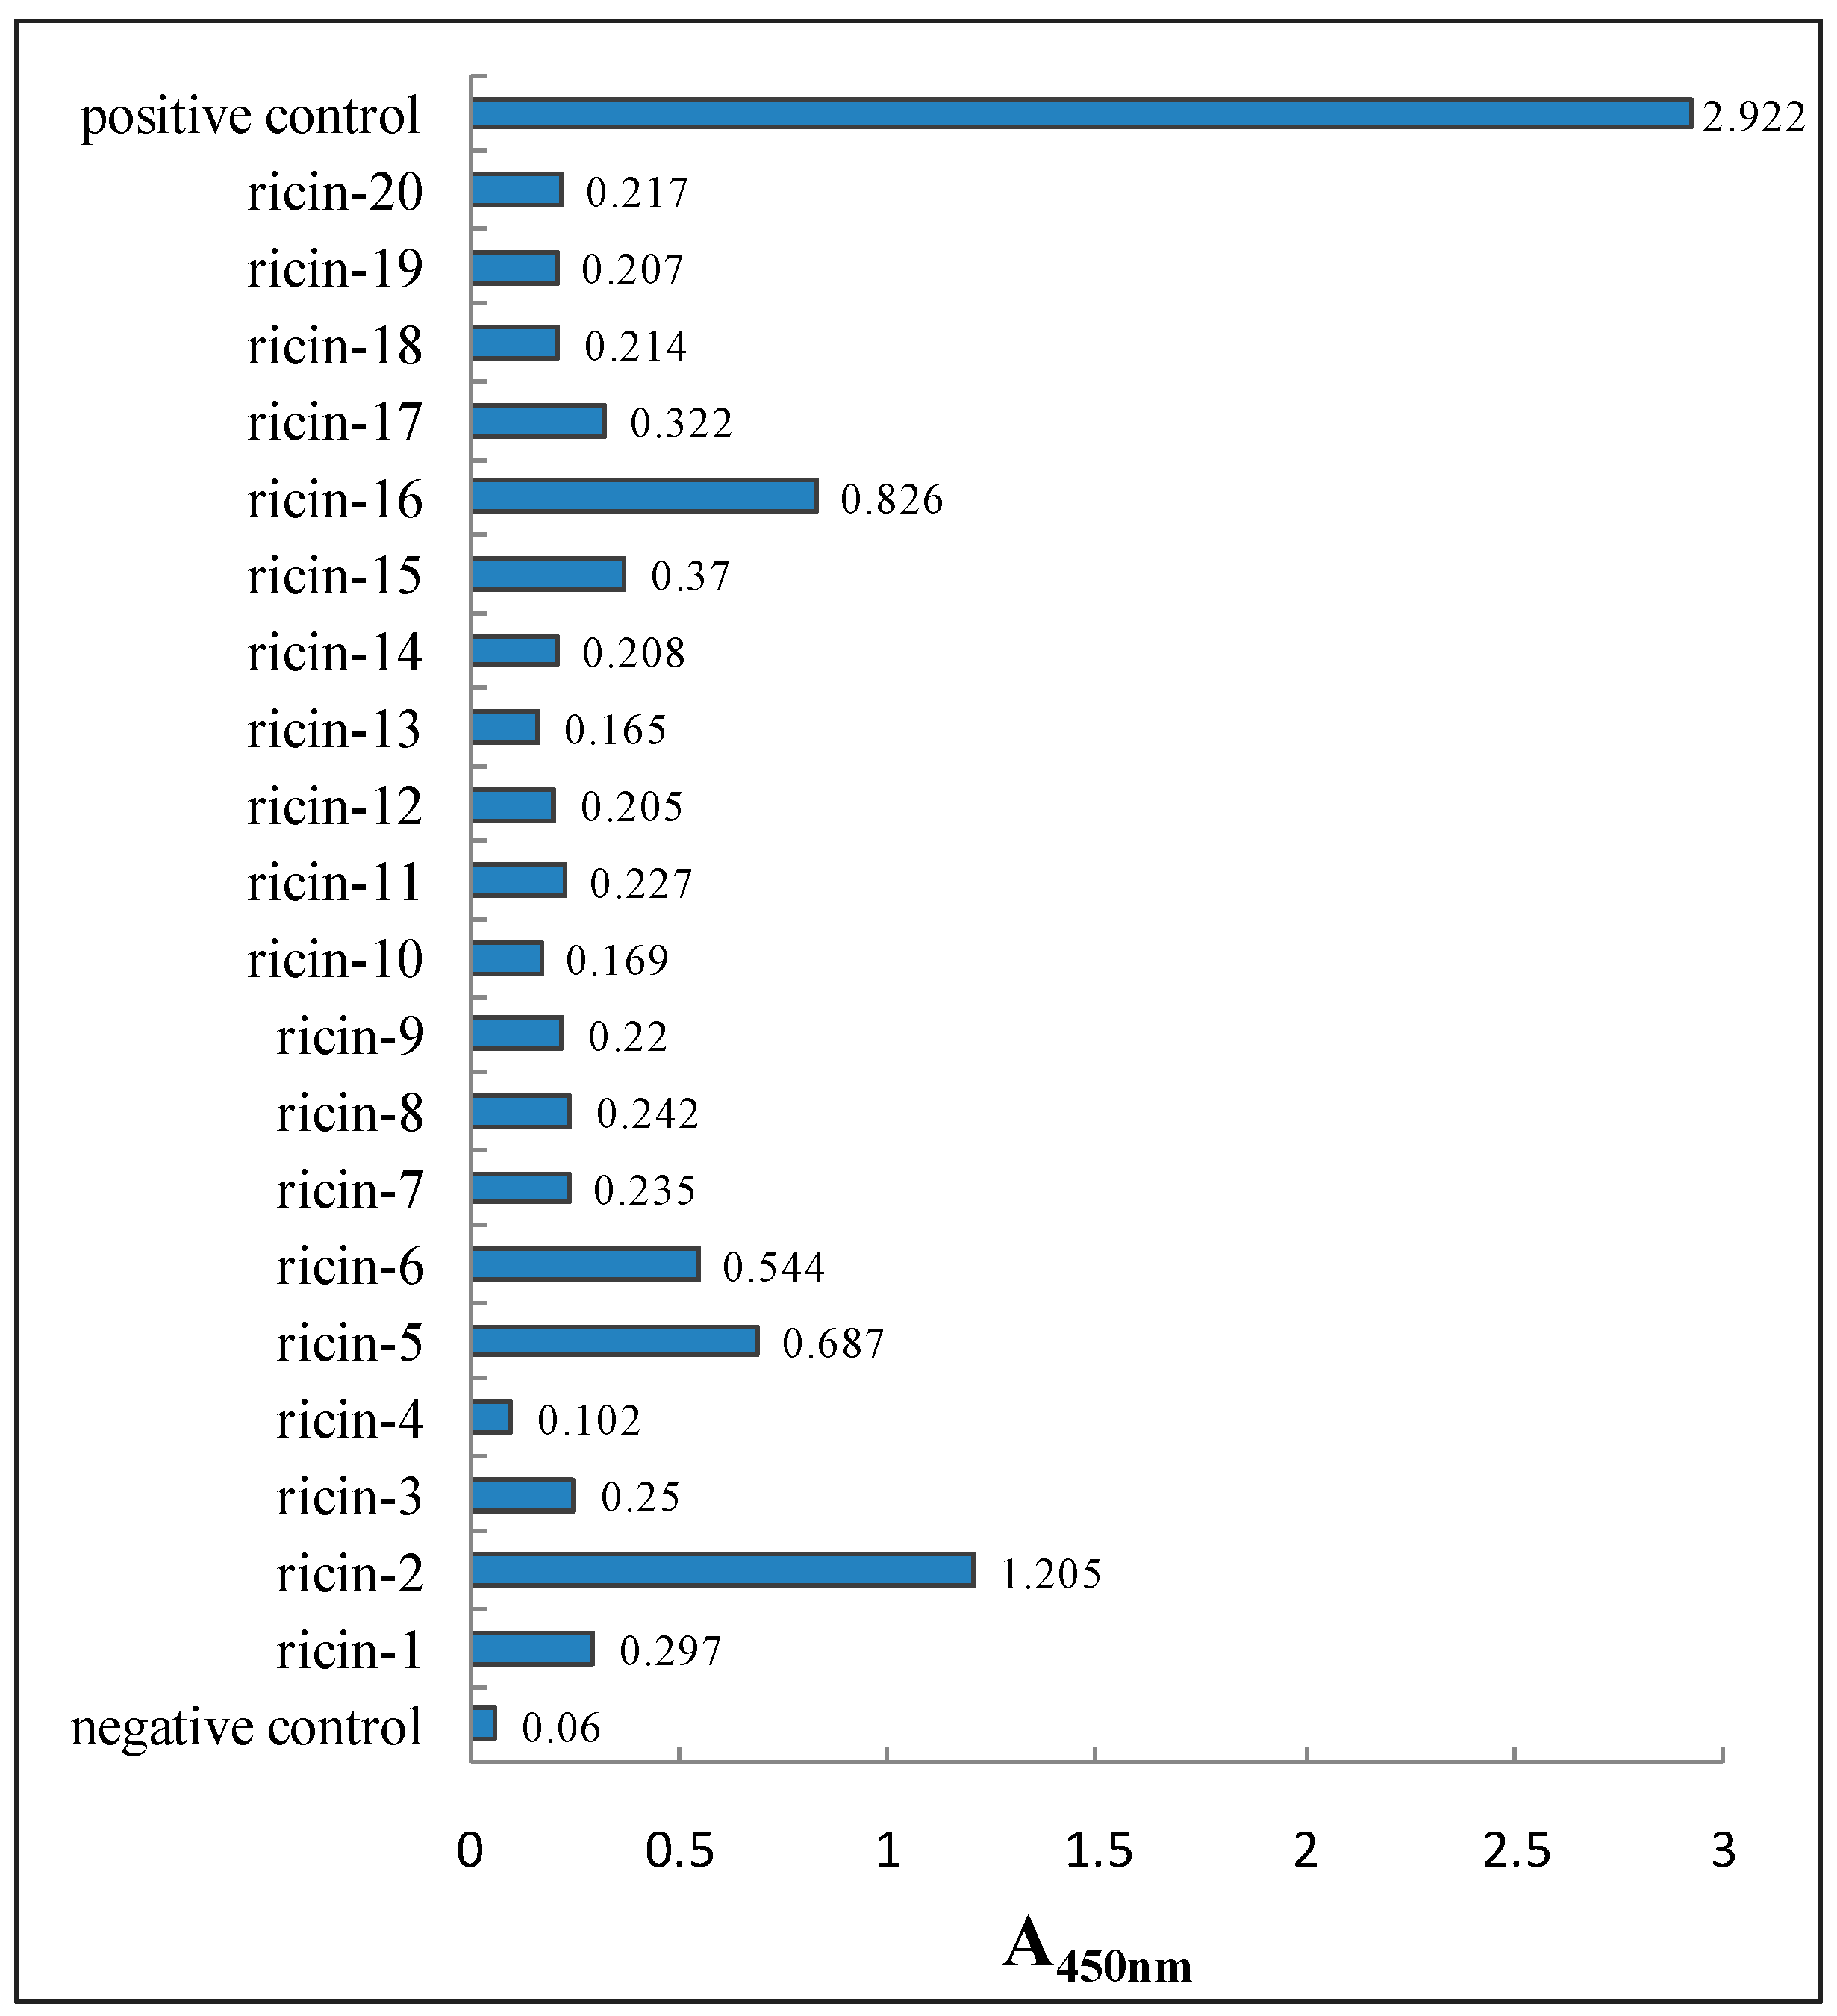
3.3.2. Characterization of Anti-Ricin Phage Displayed Antibody Positive Clones by ELISA

After affinity panning for three rounds, 20 anti-ricin phage displayed antibody clones were chosen randomly to be detected by indirect ELISA. At the same time, BSA and M13KO7 helper phage were detected as a negative control and positive control, respectively. P/N > 2.1 was deemed positive. The results were shown in Figure 9. No. 2, No. 5 and No. 15 clone showed higher A450nm. With the highest A450nm, No. 2 clone was chosen to perform DNA sequencing and affinity determination.

3.3.3. DNA Sequencing and Binding Affinity of Anti-Ricin Phage Displayed Antibody

Plasmid was extracted from No. 2 clone positive clone and DNA sequencing was conducted; the sequence of the complete assembled ScFv antibody was as follows:
5’-GGCCCAGCCGGCC ATG = GCACAAGTTCAGCTGGTTGAATCTGGTGCAGAAGTTGTTAAACCGGGTGCTTCCGTTAAAATGTCTTGCAAAGCATCCGGTTACACTTTCACCTCCTACCCGATCGAATGGATGAAACAGGCTCCGGGTAAATCCCTGGAGTGGATCGGTAACTTTCACCCGTACAACGACGACACTAAGTACAACGAGAAGTTCAAAGGTCGTGCTACTCTGACTGTTGACACTTCTACCTCTACTGTTTACCTGGAACTGTCCTCTCTGCGTTCTGAAGATACTGCTGTTTACTACTGCGCTATCTACTTCGGTAAGCCGTGGTTCACTTACTGGGGTCAGGGTACTCTGGTTACTGTTTCTTCCGGTGGAGGCGGTTCAGGCGGAGGTGGCTCTGGCGGTGGCGGATCGGAAATCGAACTGACCCAGTCTCCGGGTACCATGTCTGCTTCTCCGGGTGAACGTGTTACTATGACTTGCCGTGCTTCTTCCTCTGTTTCTTCCAACTACCTGCACTGGTATCAGCAAAAACCGGGTCAGTCTCCGAAGCCGTGGATCTACGGTACTTCTAACCTGGCTTCTGGTGTTCCGGACCGTTTCTCTGGTAGCGGTTCTGGTACTTCCTACTCTCTGACTATCACTTCTATGGAACCGGAAGACGCTGCTACTTACTACTGCCAGCTGTGGAACTACCCGCTGTACACTTTCGGTGGTGGTACCAAACTGGAGATCAAACGCGCGGCCGC-3’.
In this DNA sequencing, the single underlined part “GGCCCAGCCGGCC” and “GCGGCCGC” respectively represents the restriction enzyme site of Sfi I(5’) and Not I(3’), and the double underlined part “ATG” represents the initiation codon. The ORF contained 732 bases, from which 244 amino acids were encoded. Binding affinity of anti-ricin phage displayed antibody to ricin was determined using a PlexArray™ Kx5 System. The determined Ka of anti-ricin phage displayed antibody was 1.48 × 10⁹ M−1, and the determined Kd of anti-ricin phage displayed antibody was 6.75 × 10⁻¹⁰ M. The binding affinity between anti-ricin phage displayed antibody and ricin was shown to be strong.

3.4. The Qualification Feature of ECL Probe

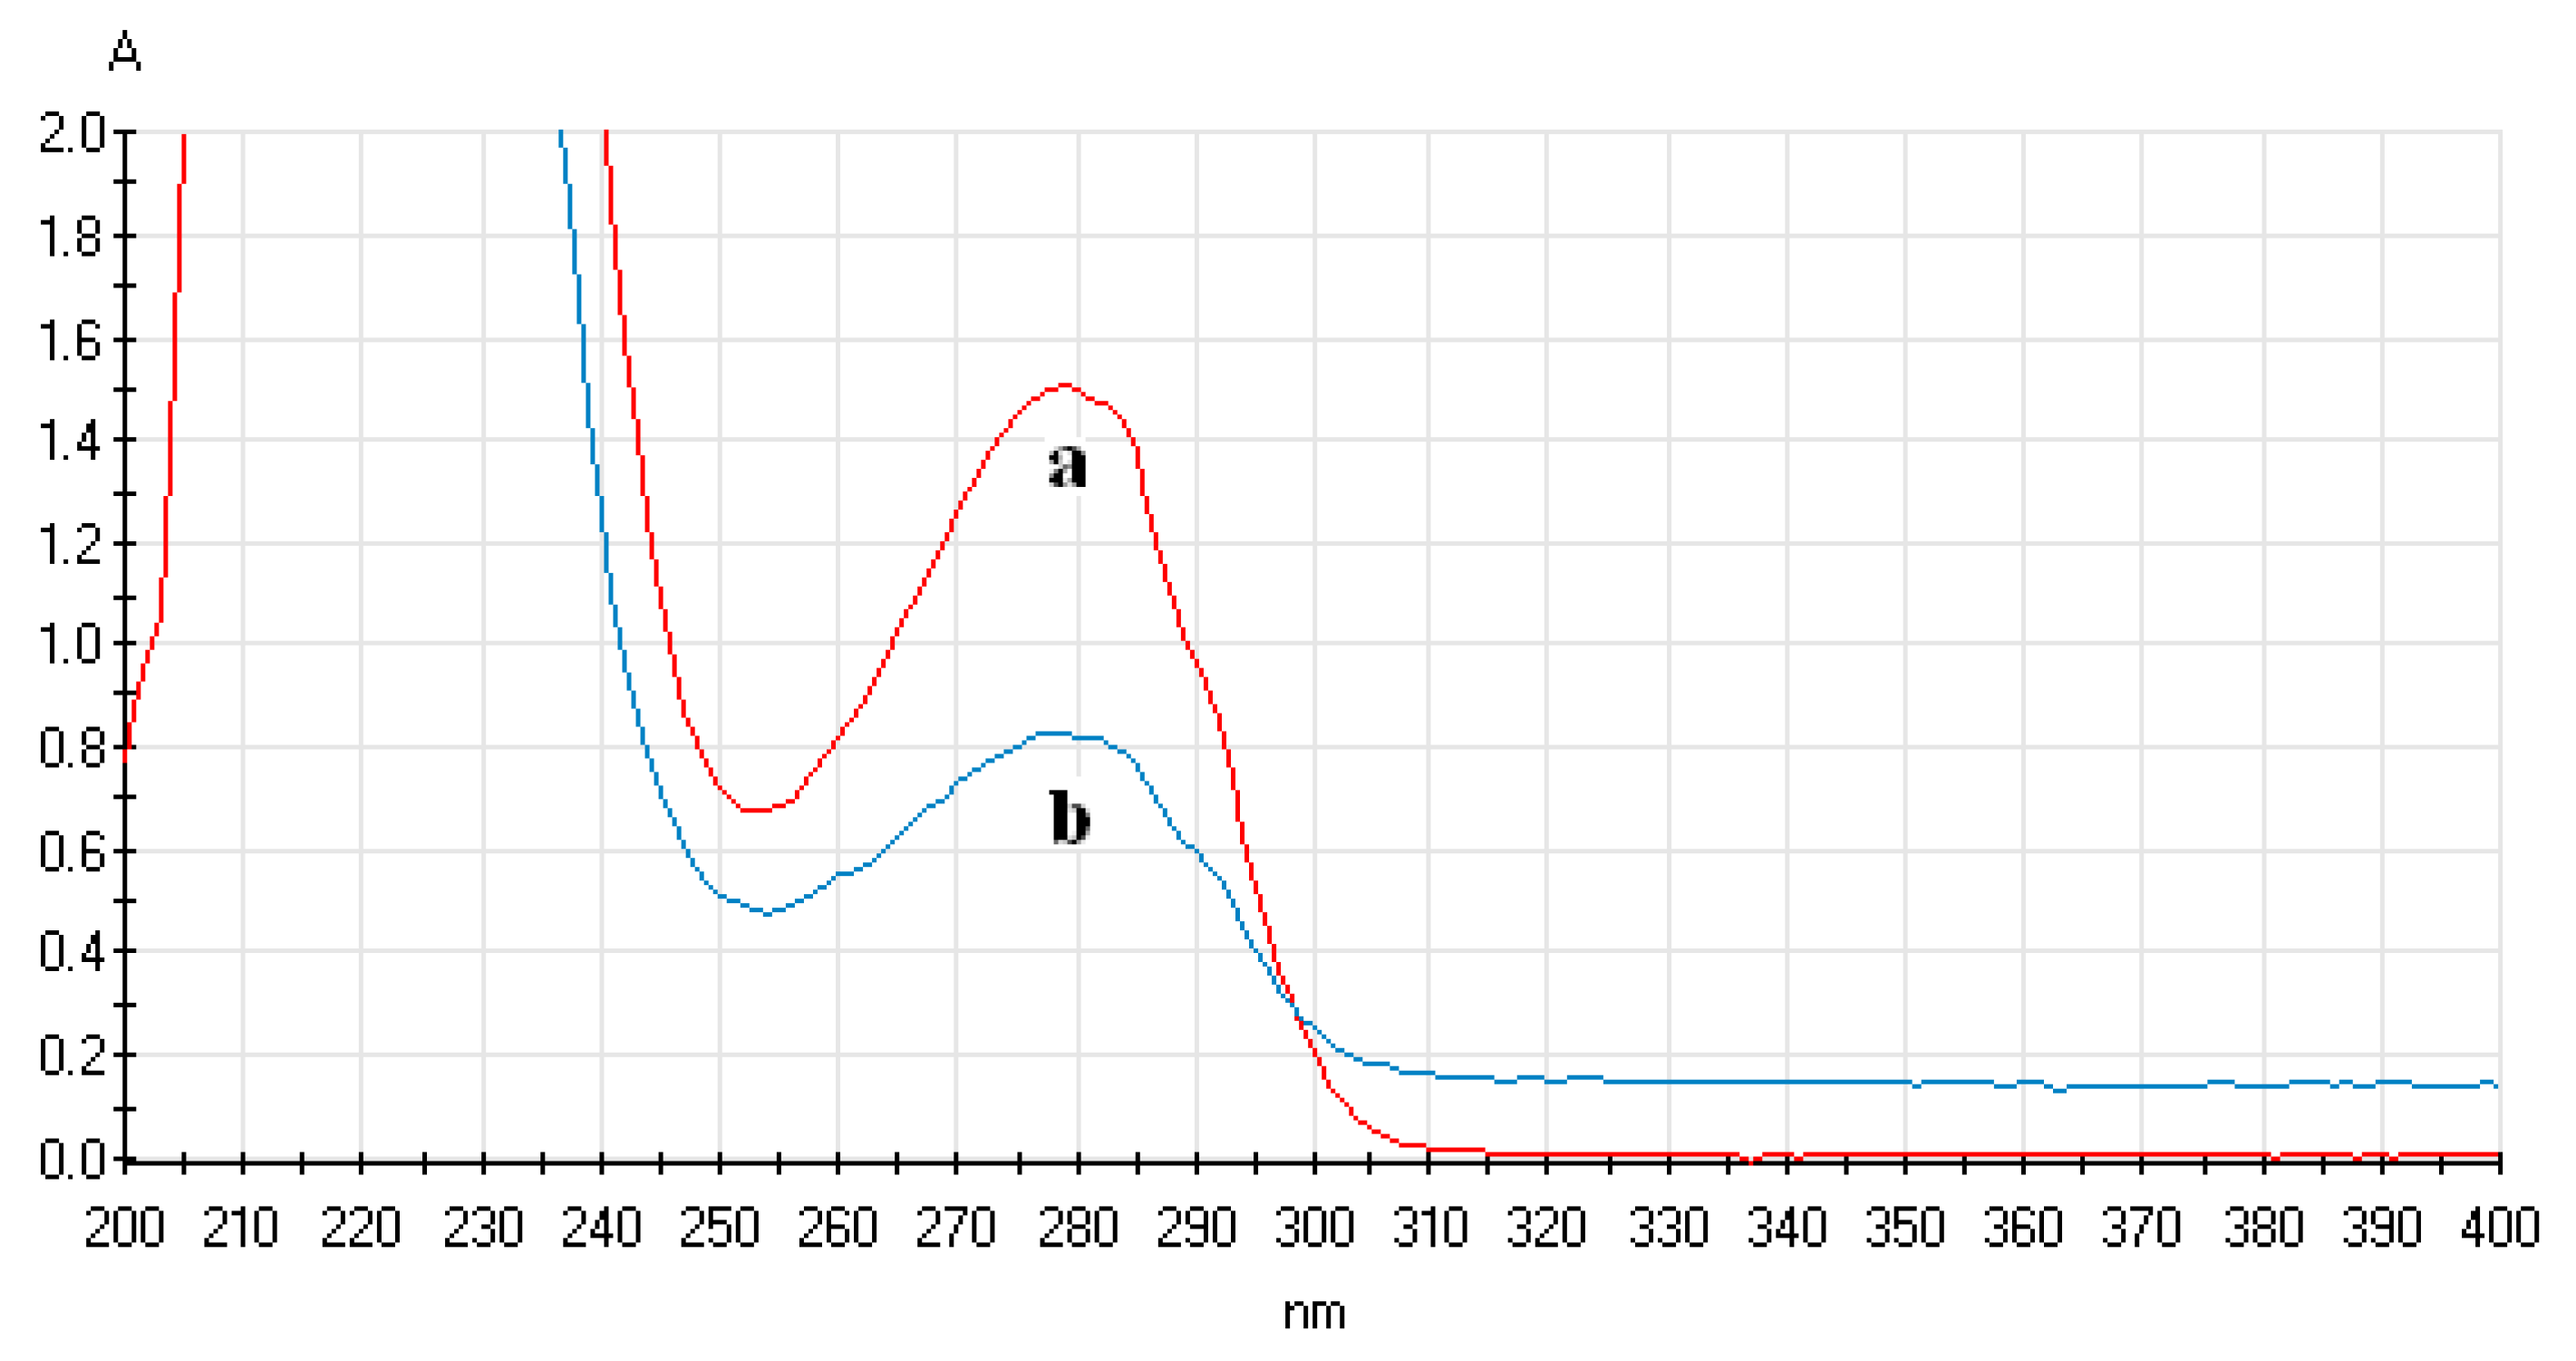
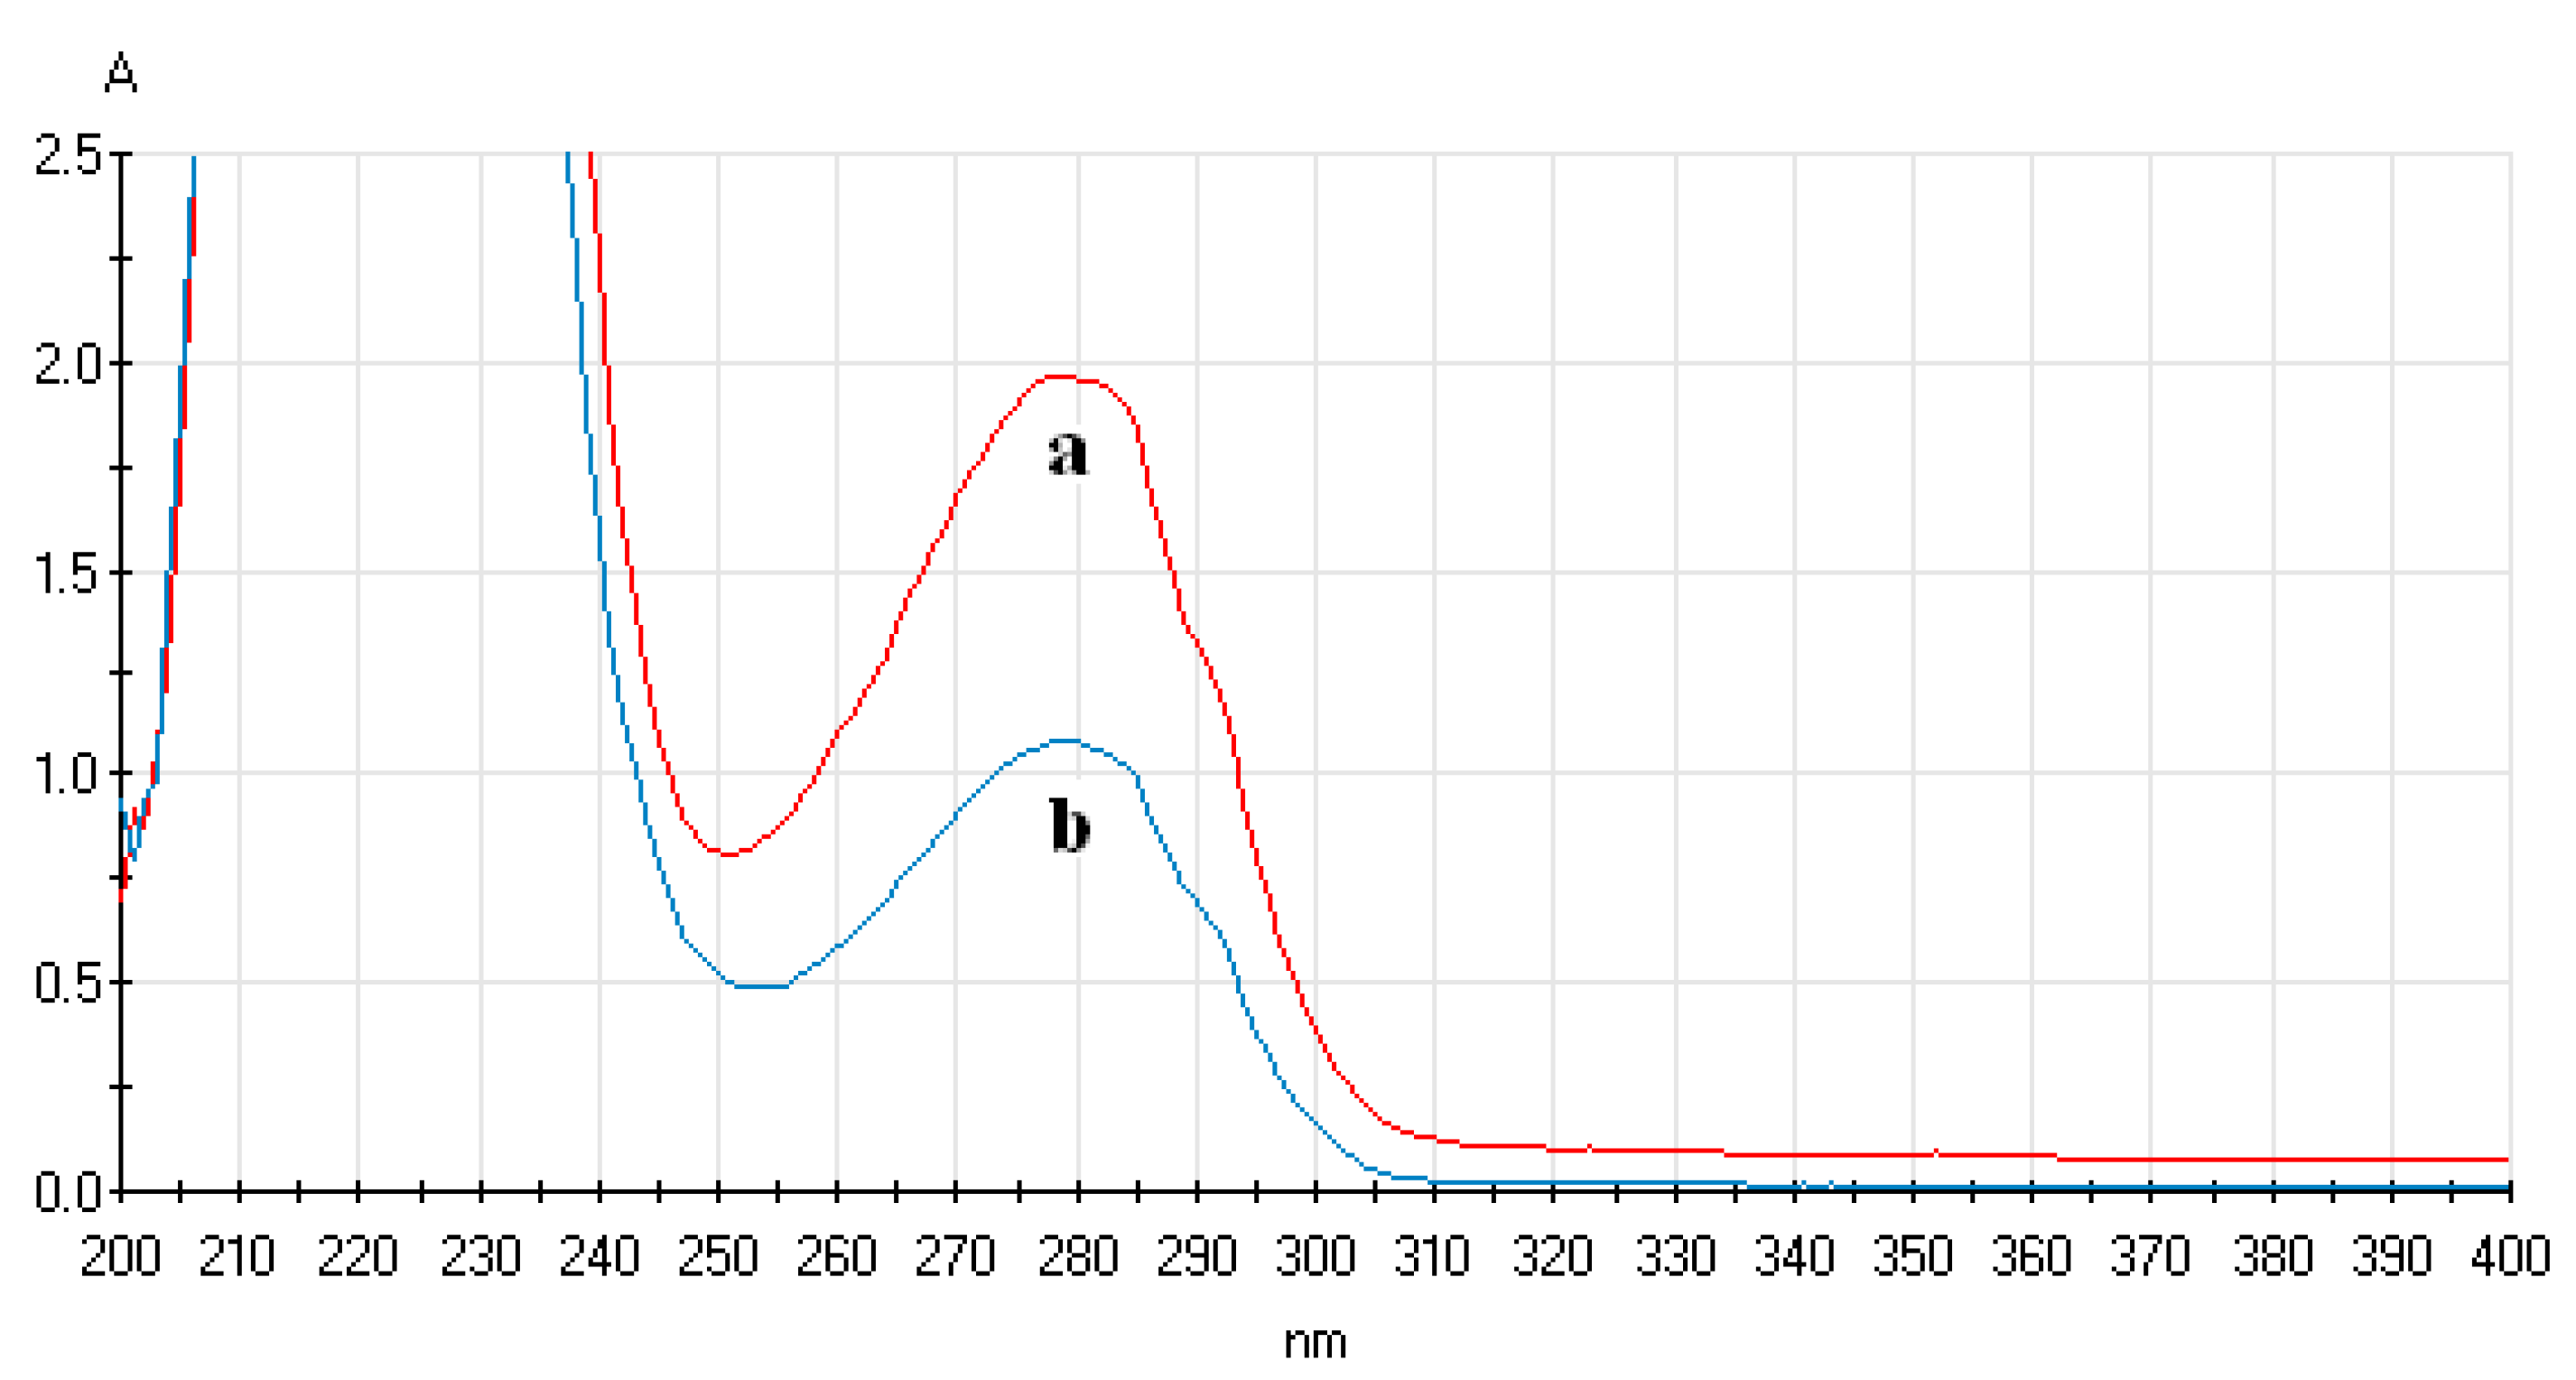
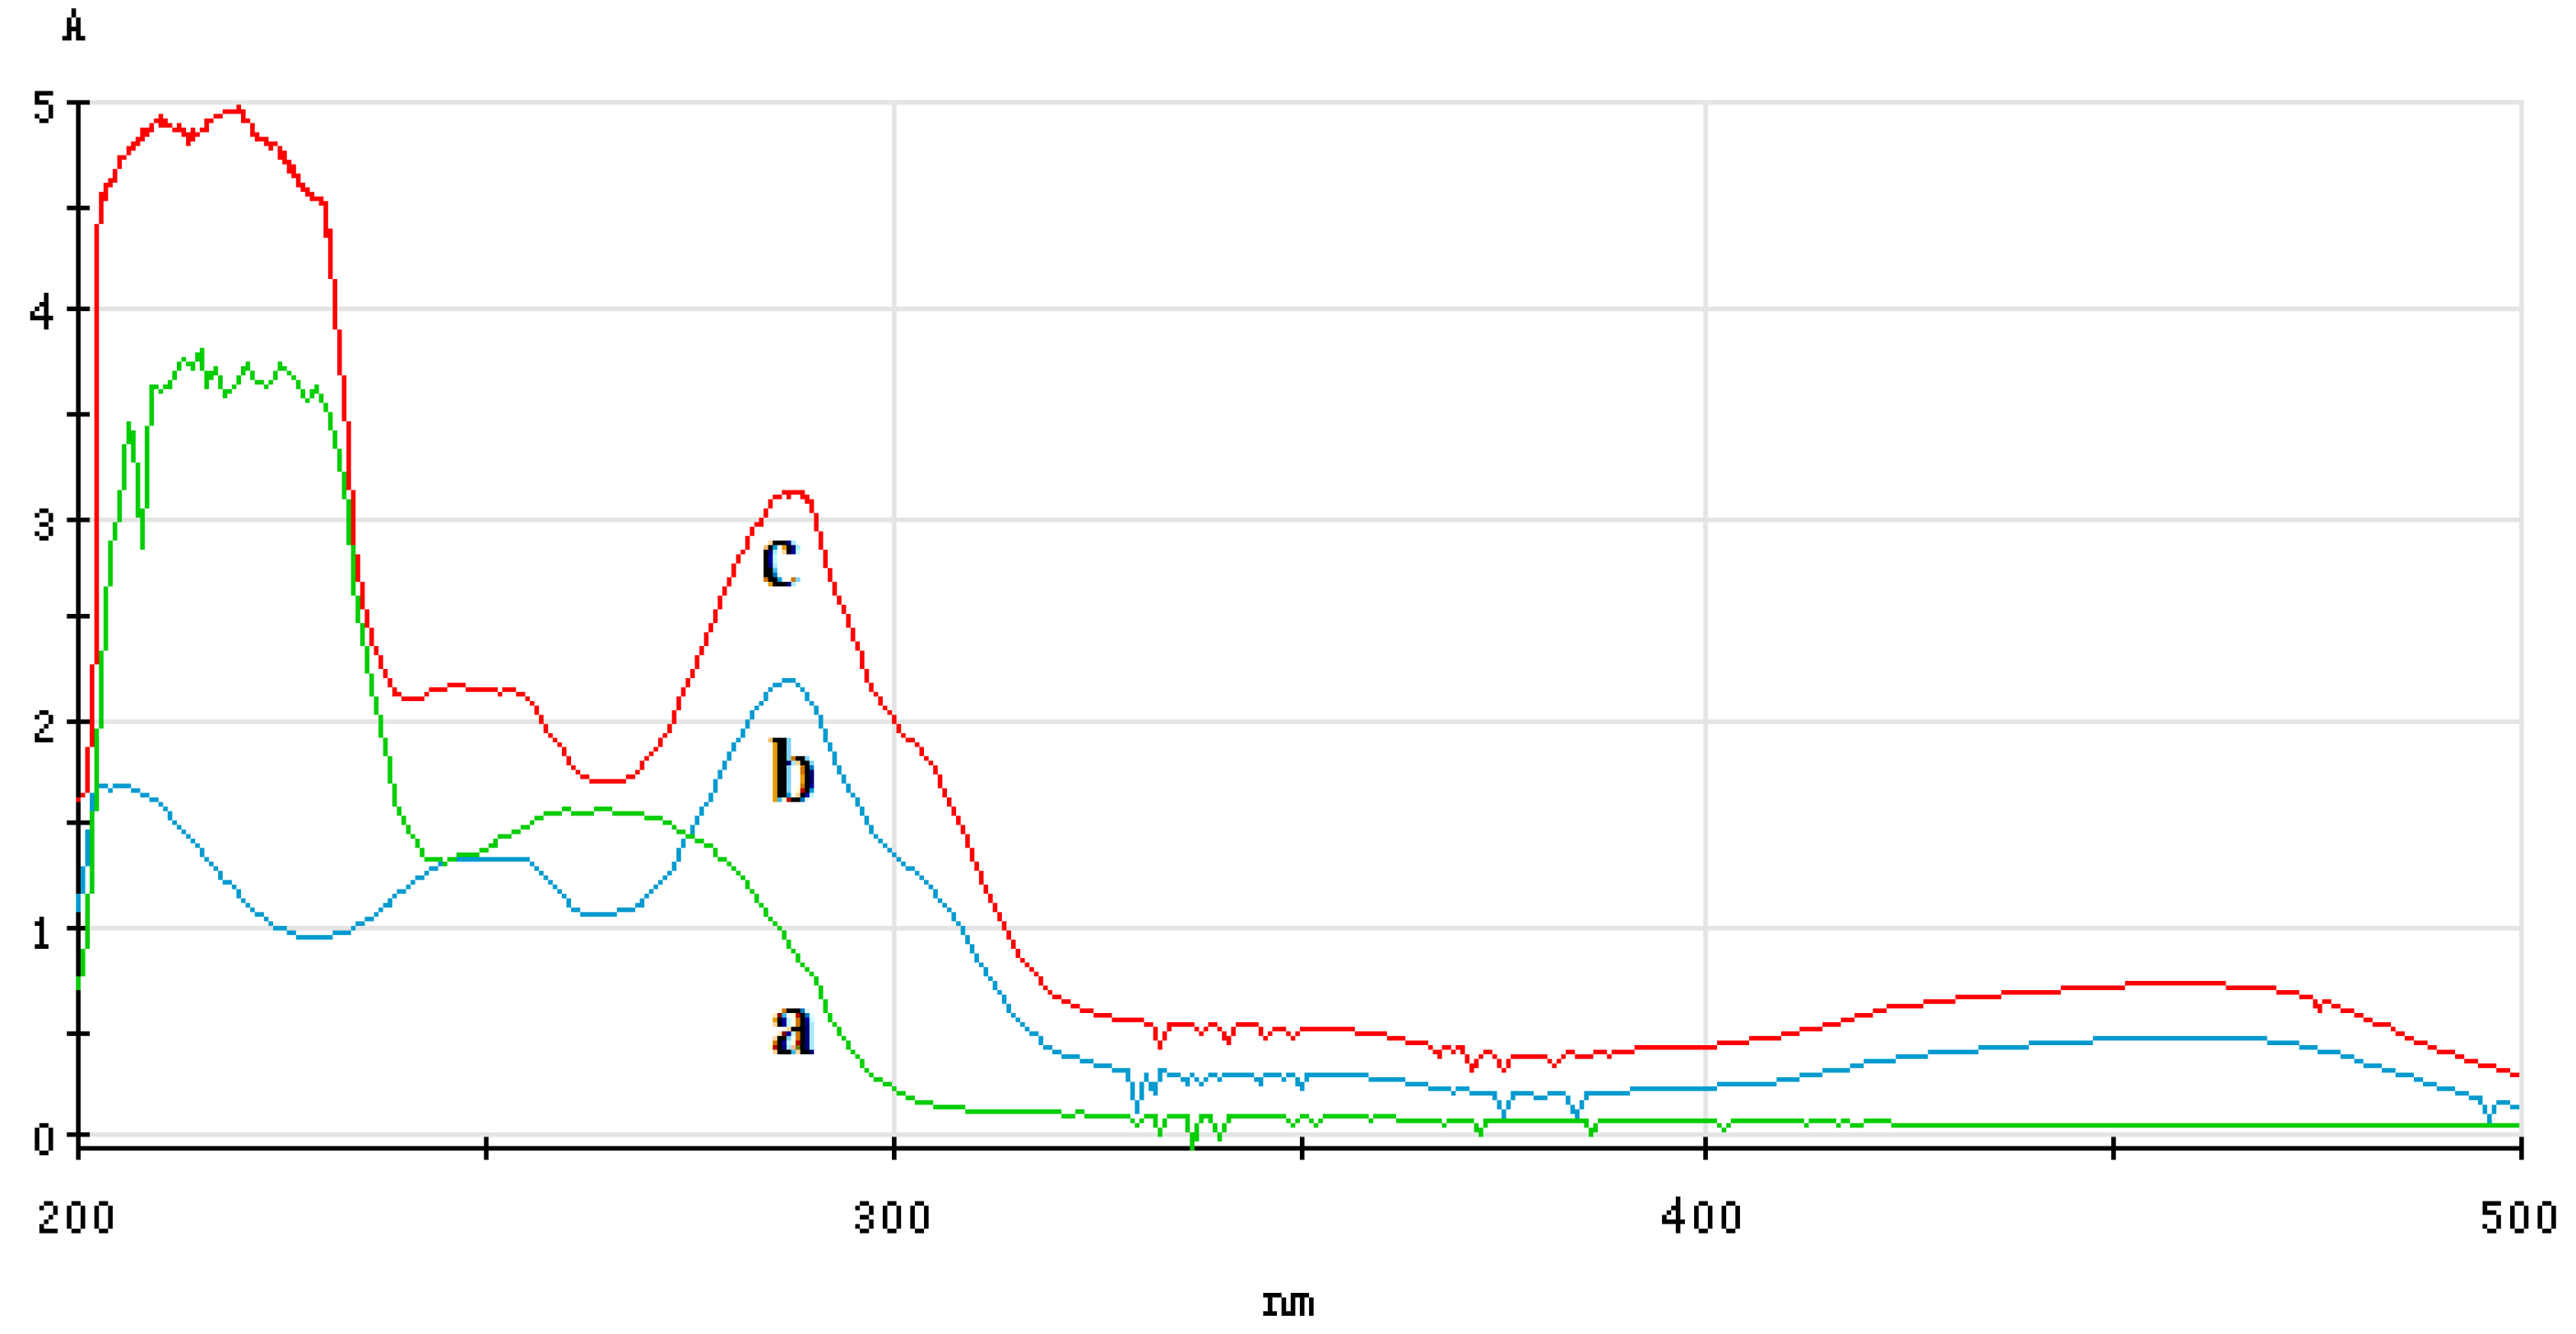
3.4.1. Analysis of UV-Vis Spectrum of ECL Probe

Figure 10 shows the UV-Vis spectrum of phage displayed antibody solution before and after addition of the Ru(bpy)32+ labeled phage displayed antibody ECL probe. In this figure, curve a is the UV-Vis spectrum of phage displayed antibody and the corresponding wavelength of its characteristic absorption peak was 260 nm. Curve b is the UV-Vis spectrum of Ru(bpy)32+-NHS ester and the corresponding wavelength of its three characteristic absorption peaks were 247 nm, 287 nm and 458 nm, respectively . Curve c is the UV-Vis spectrum of Ru(bpy)32+-labeled phage displayed antibody and the corresponding wavelength of its three characteristic absorption peaks were 247 nm, 288 nm and 458 nm, respectively. The result shows that Ru(bpy)32+ has good binding to the anti-ricin phage displayed antibody.

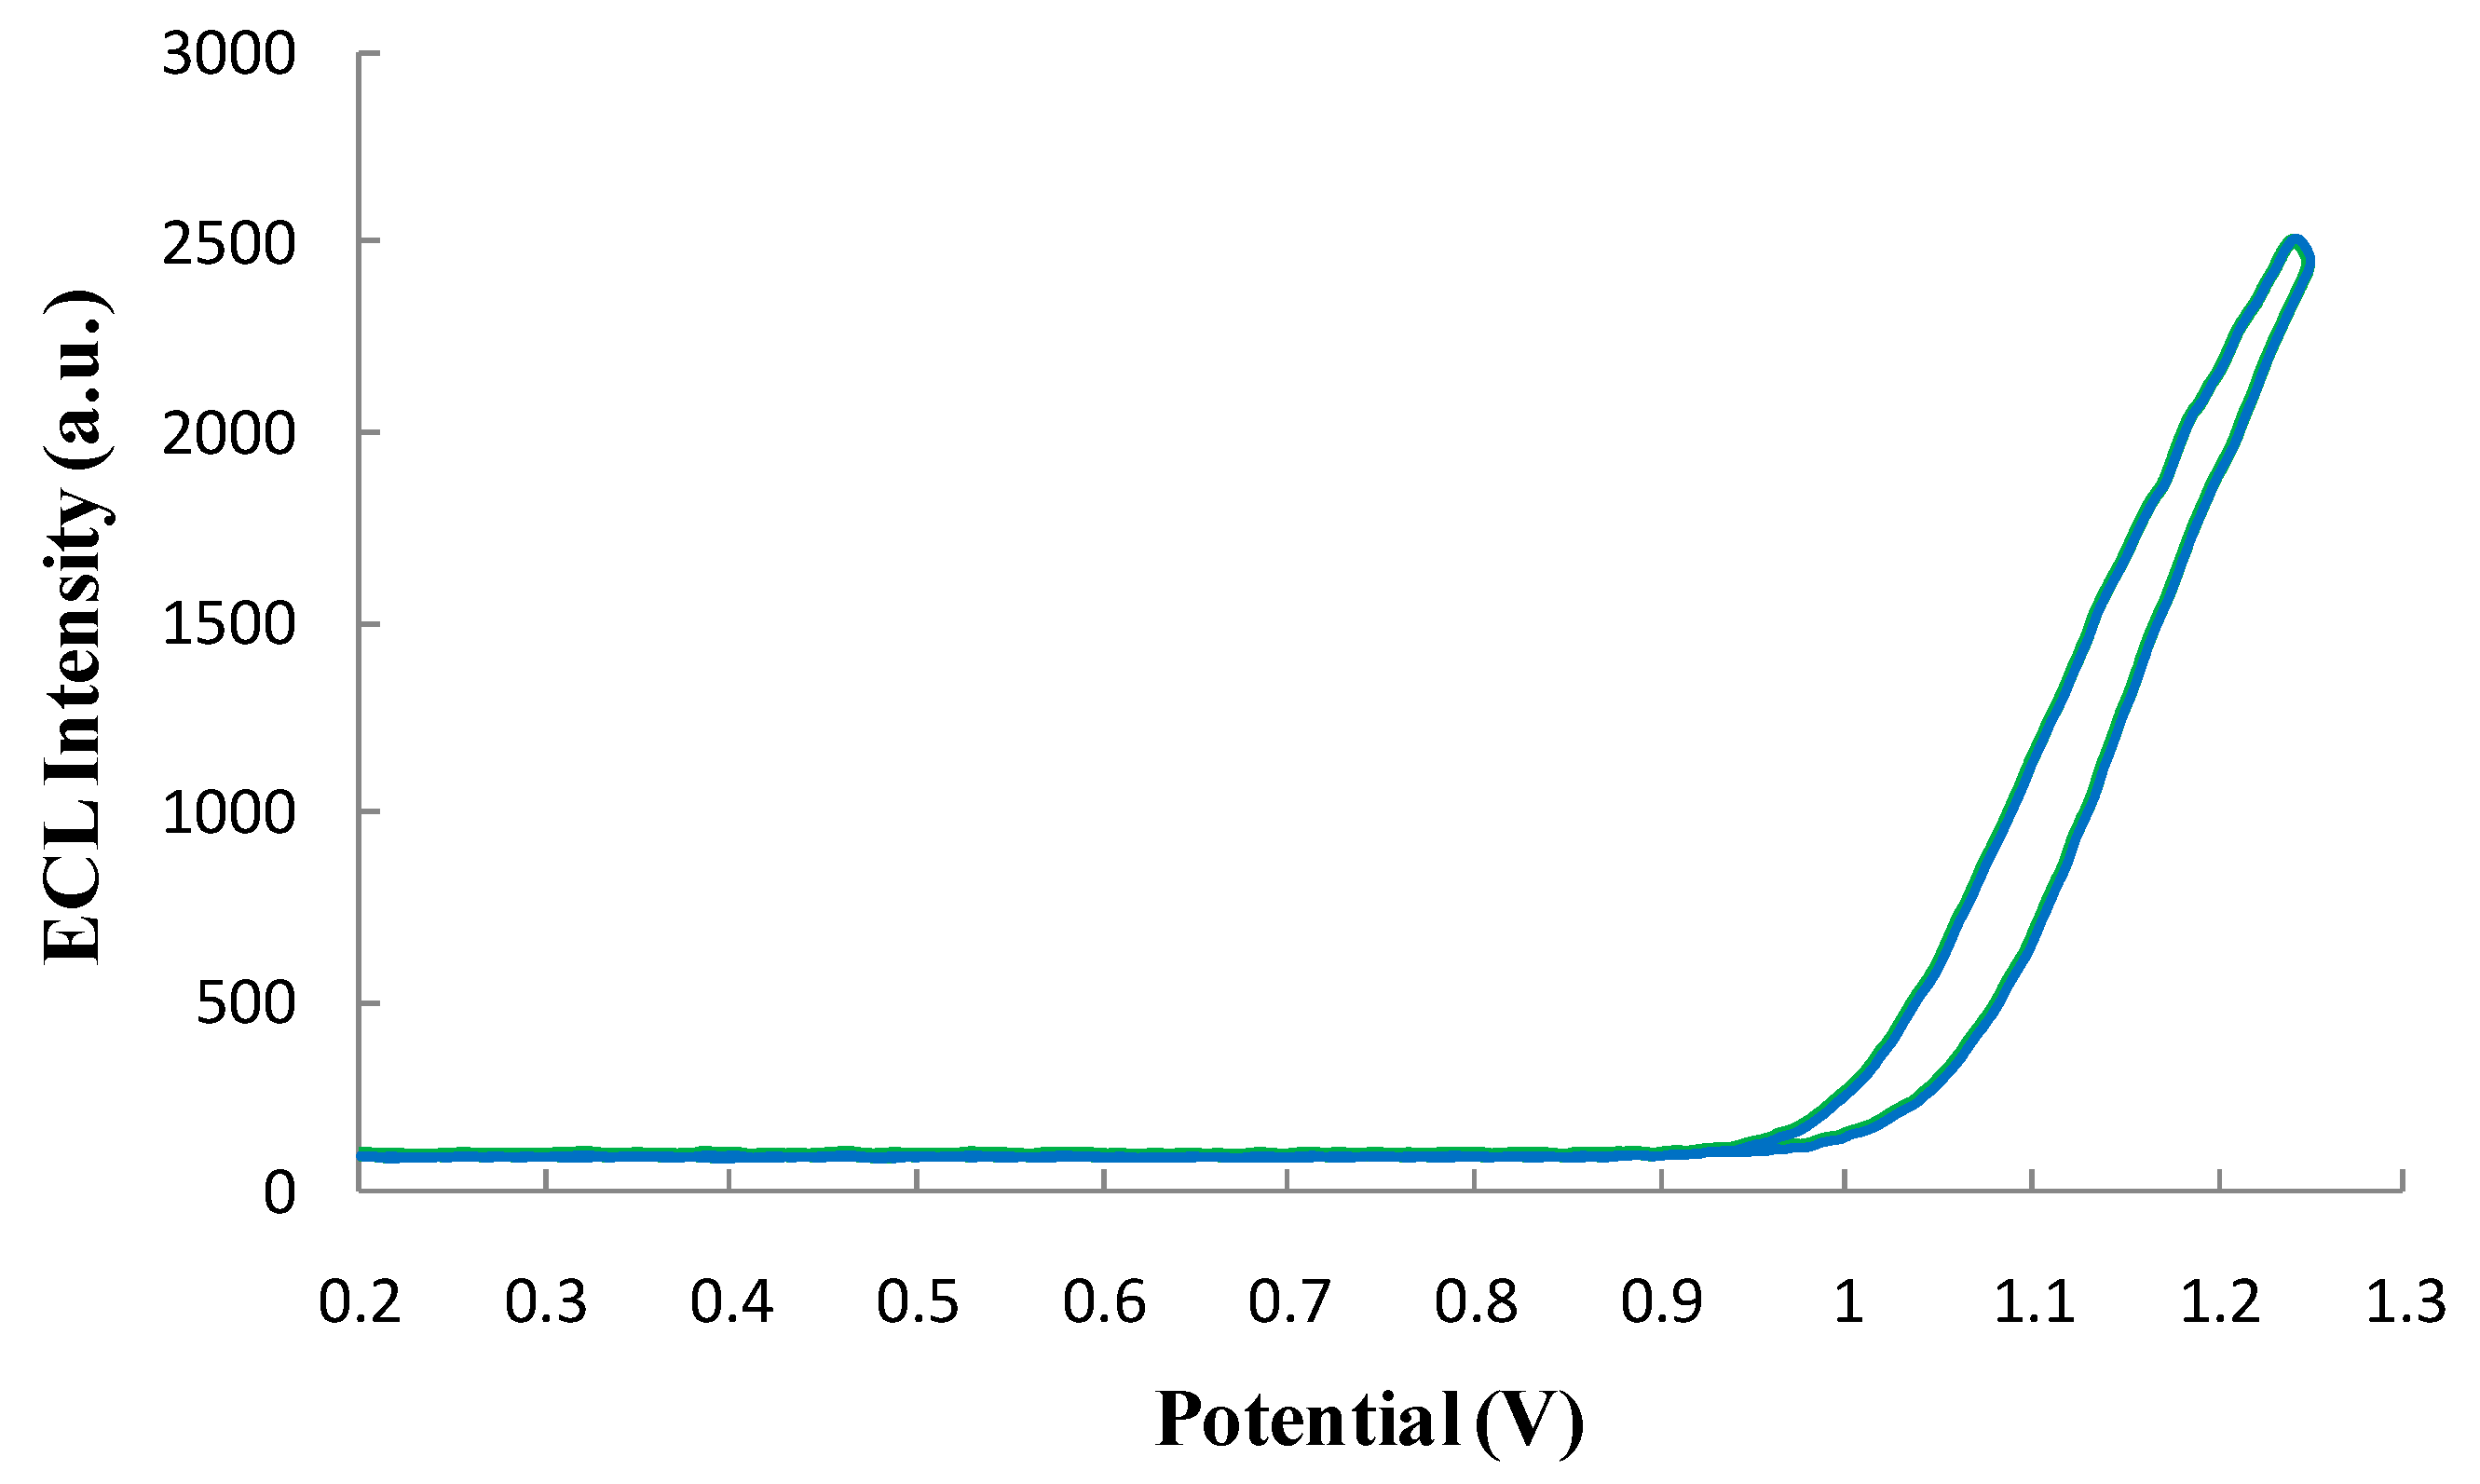
3.4.2. Qualification of the ECL Profile of the ECL Probe

The ECL reaction luminescence probe was scanned(cyclic voltammetry method). As shown in Figure 11, the Ru(bpy)32+-labeled phage displayed antibody exhibited a strong ECL signal. The maximum ECL intensity (peak potential) was still at 1.25 V, indicating that the luminescence probe maintained the ECL profile of connatural Ru(bpy)32+ with a good ECL profile that can meet the demands of ECL reactions.

3.5. The Performance of ECL Immunosensor

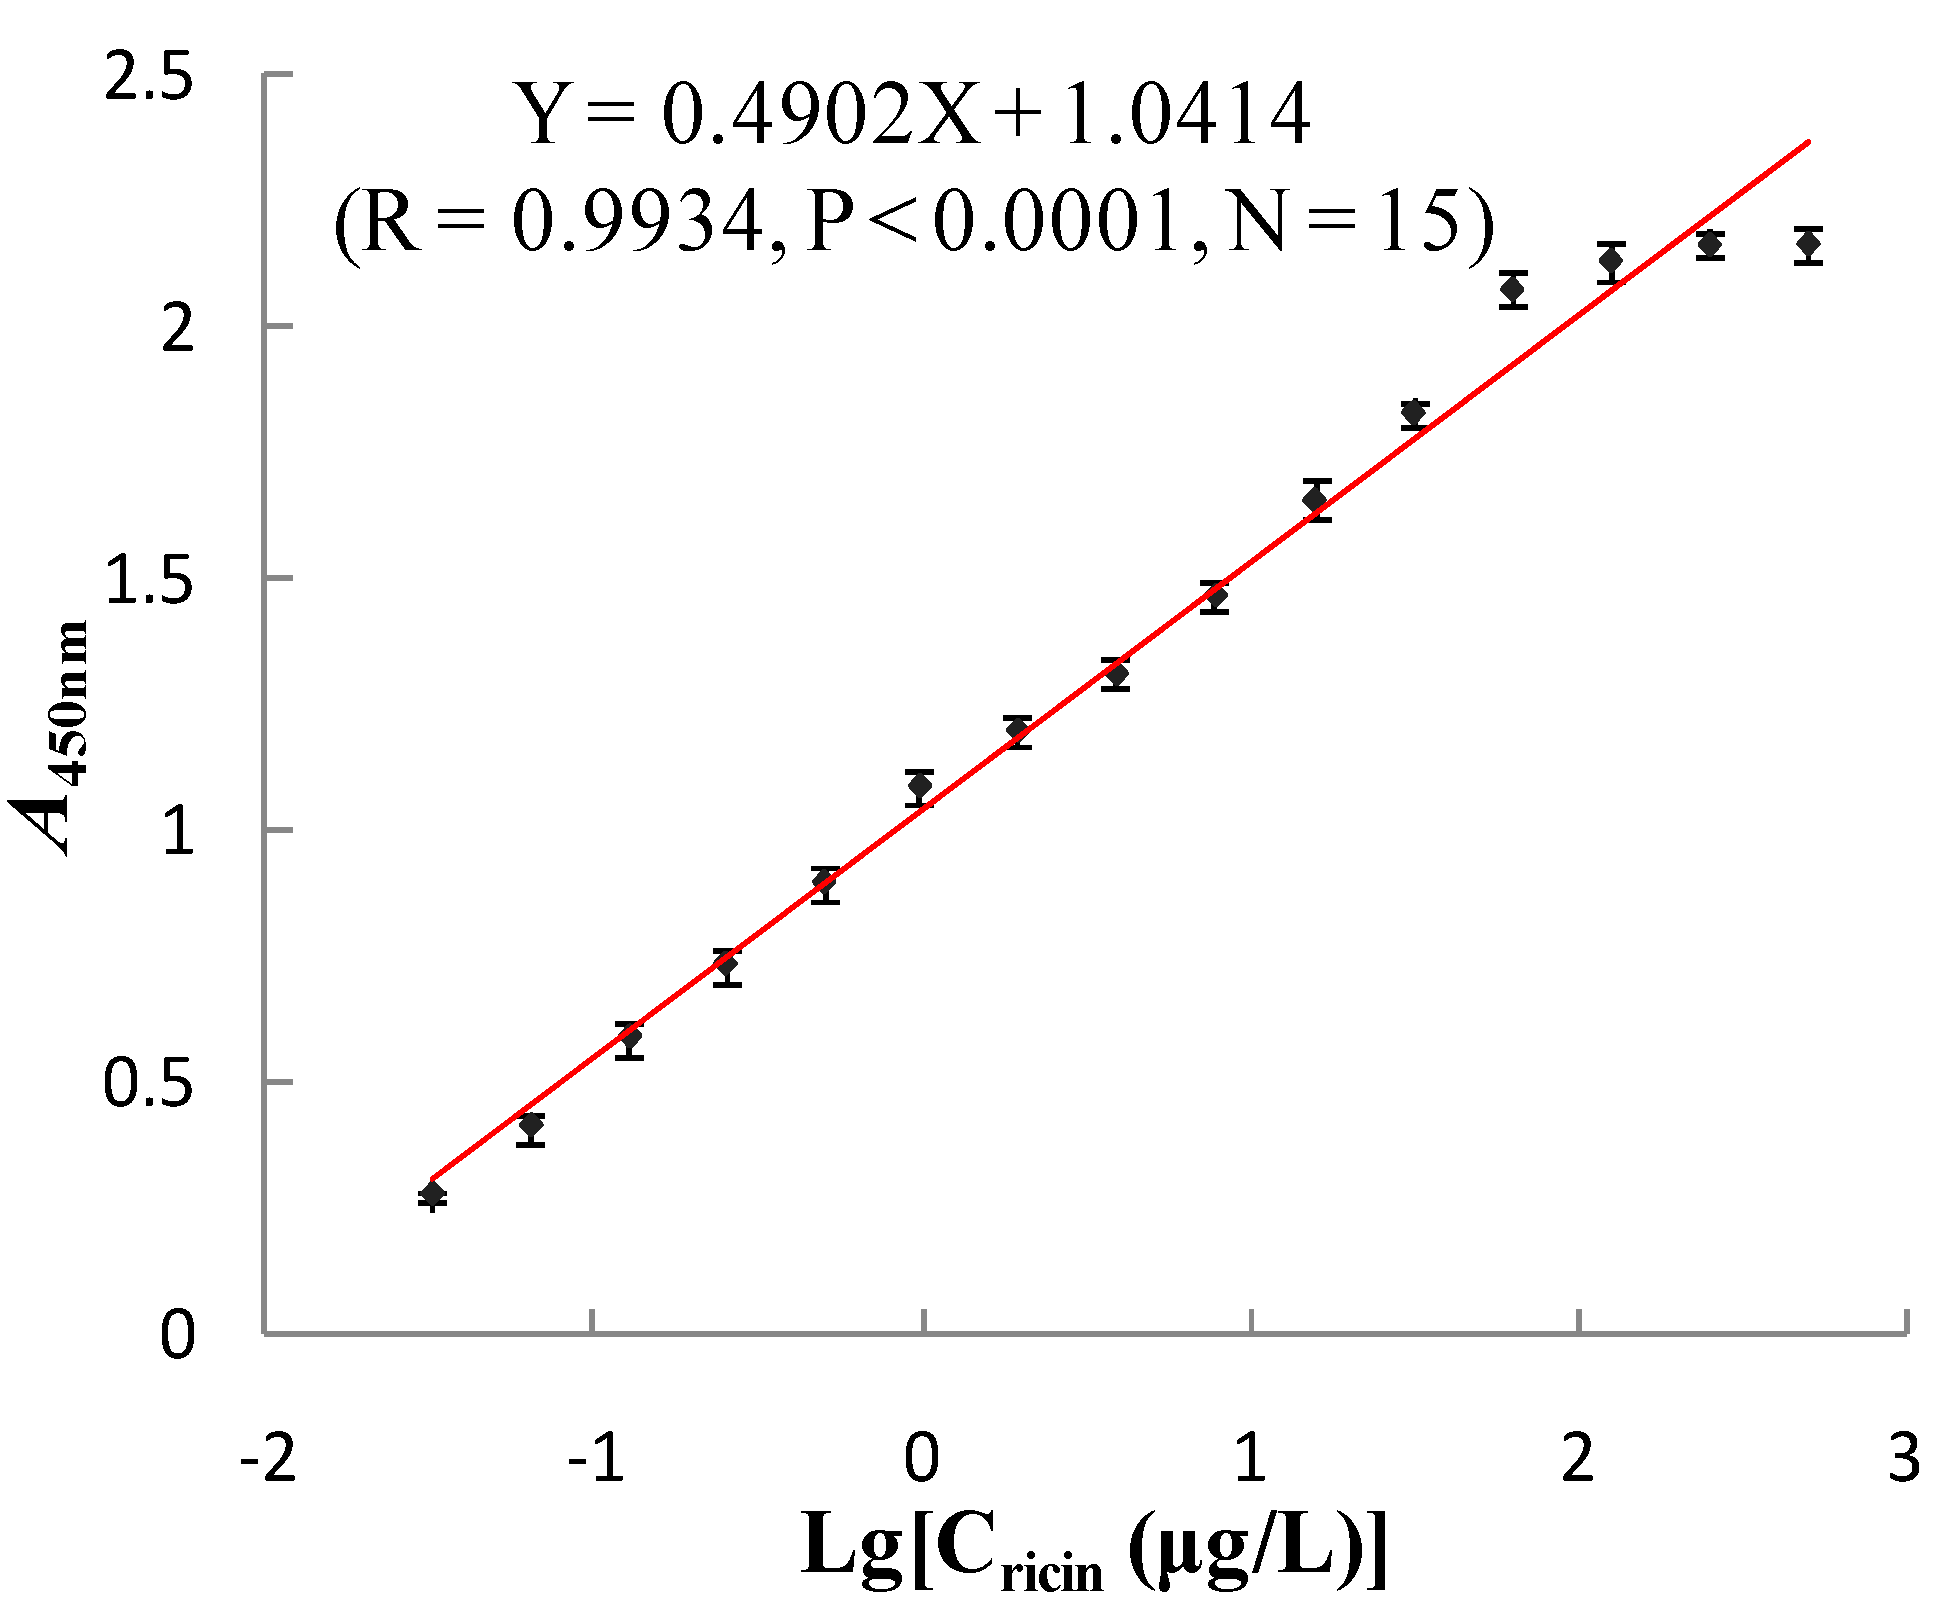
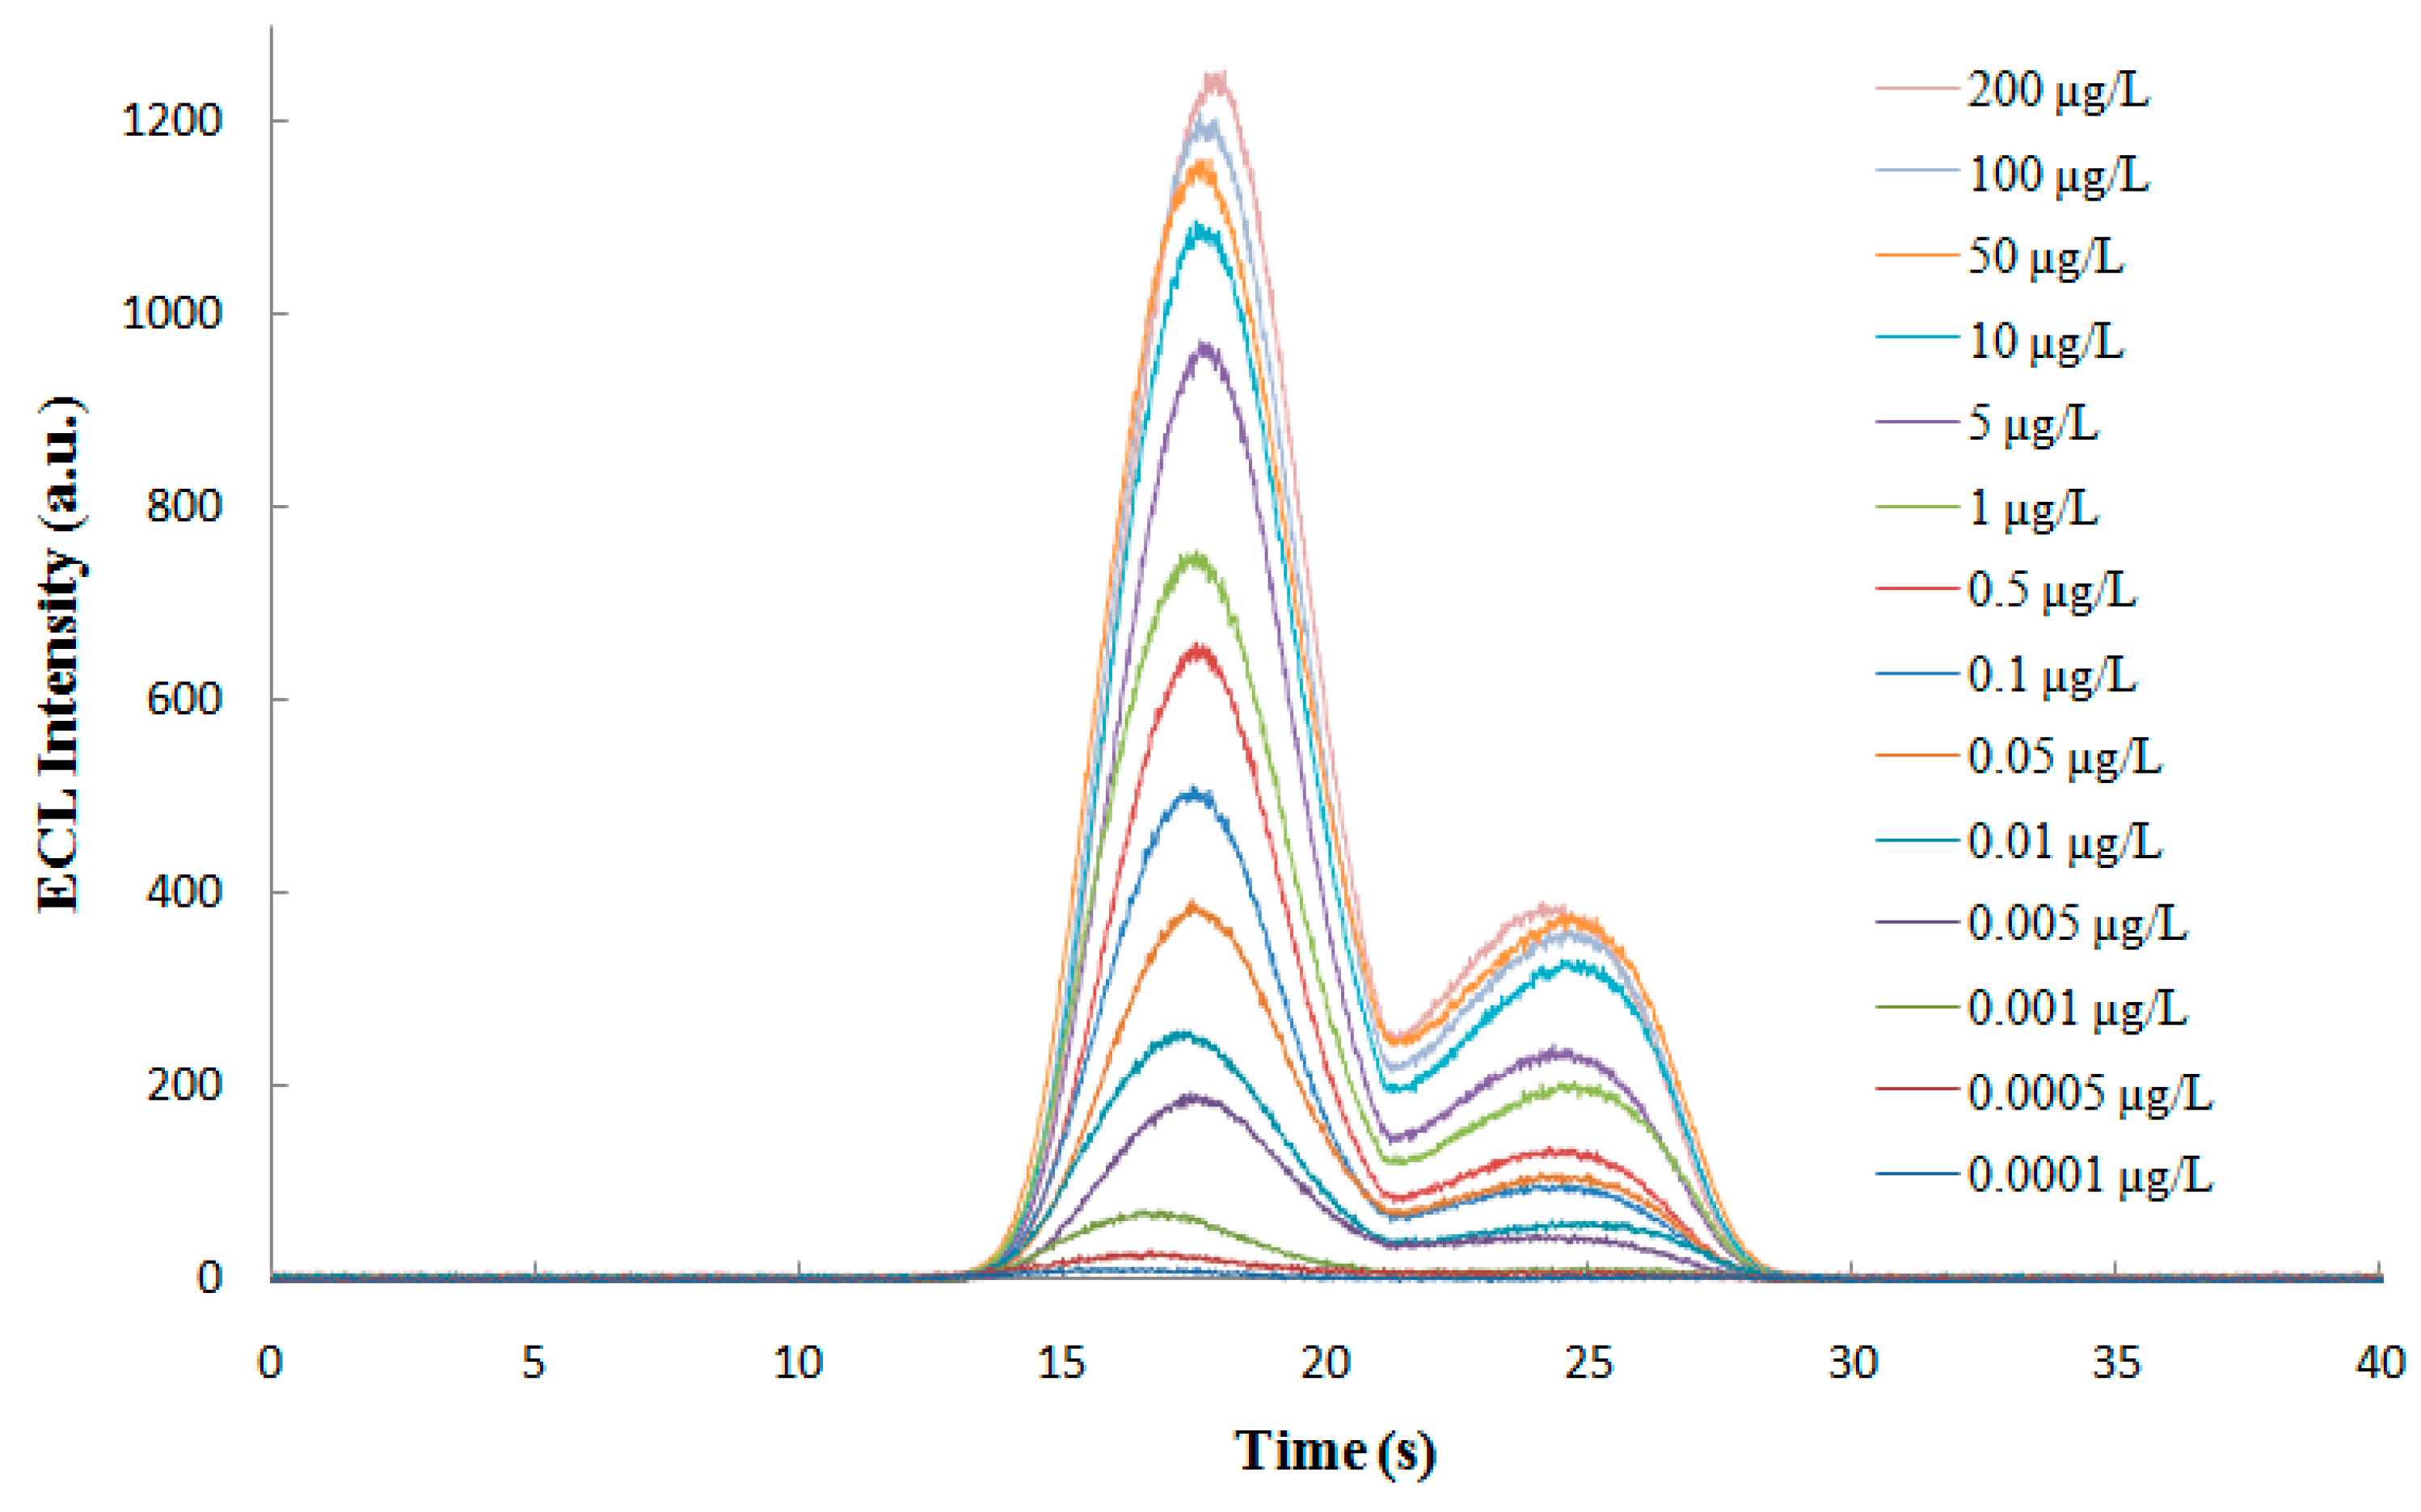
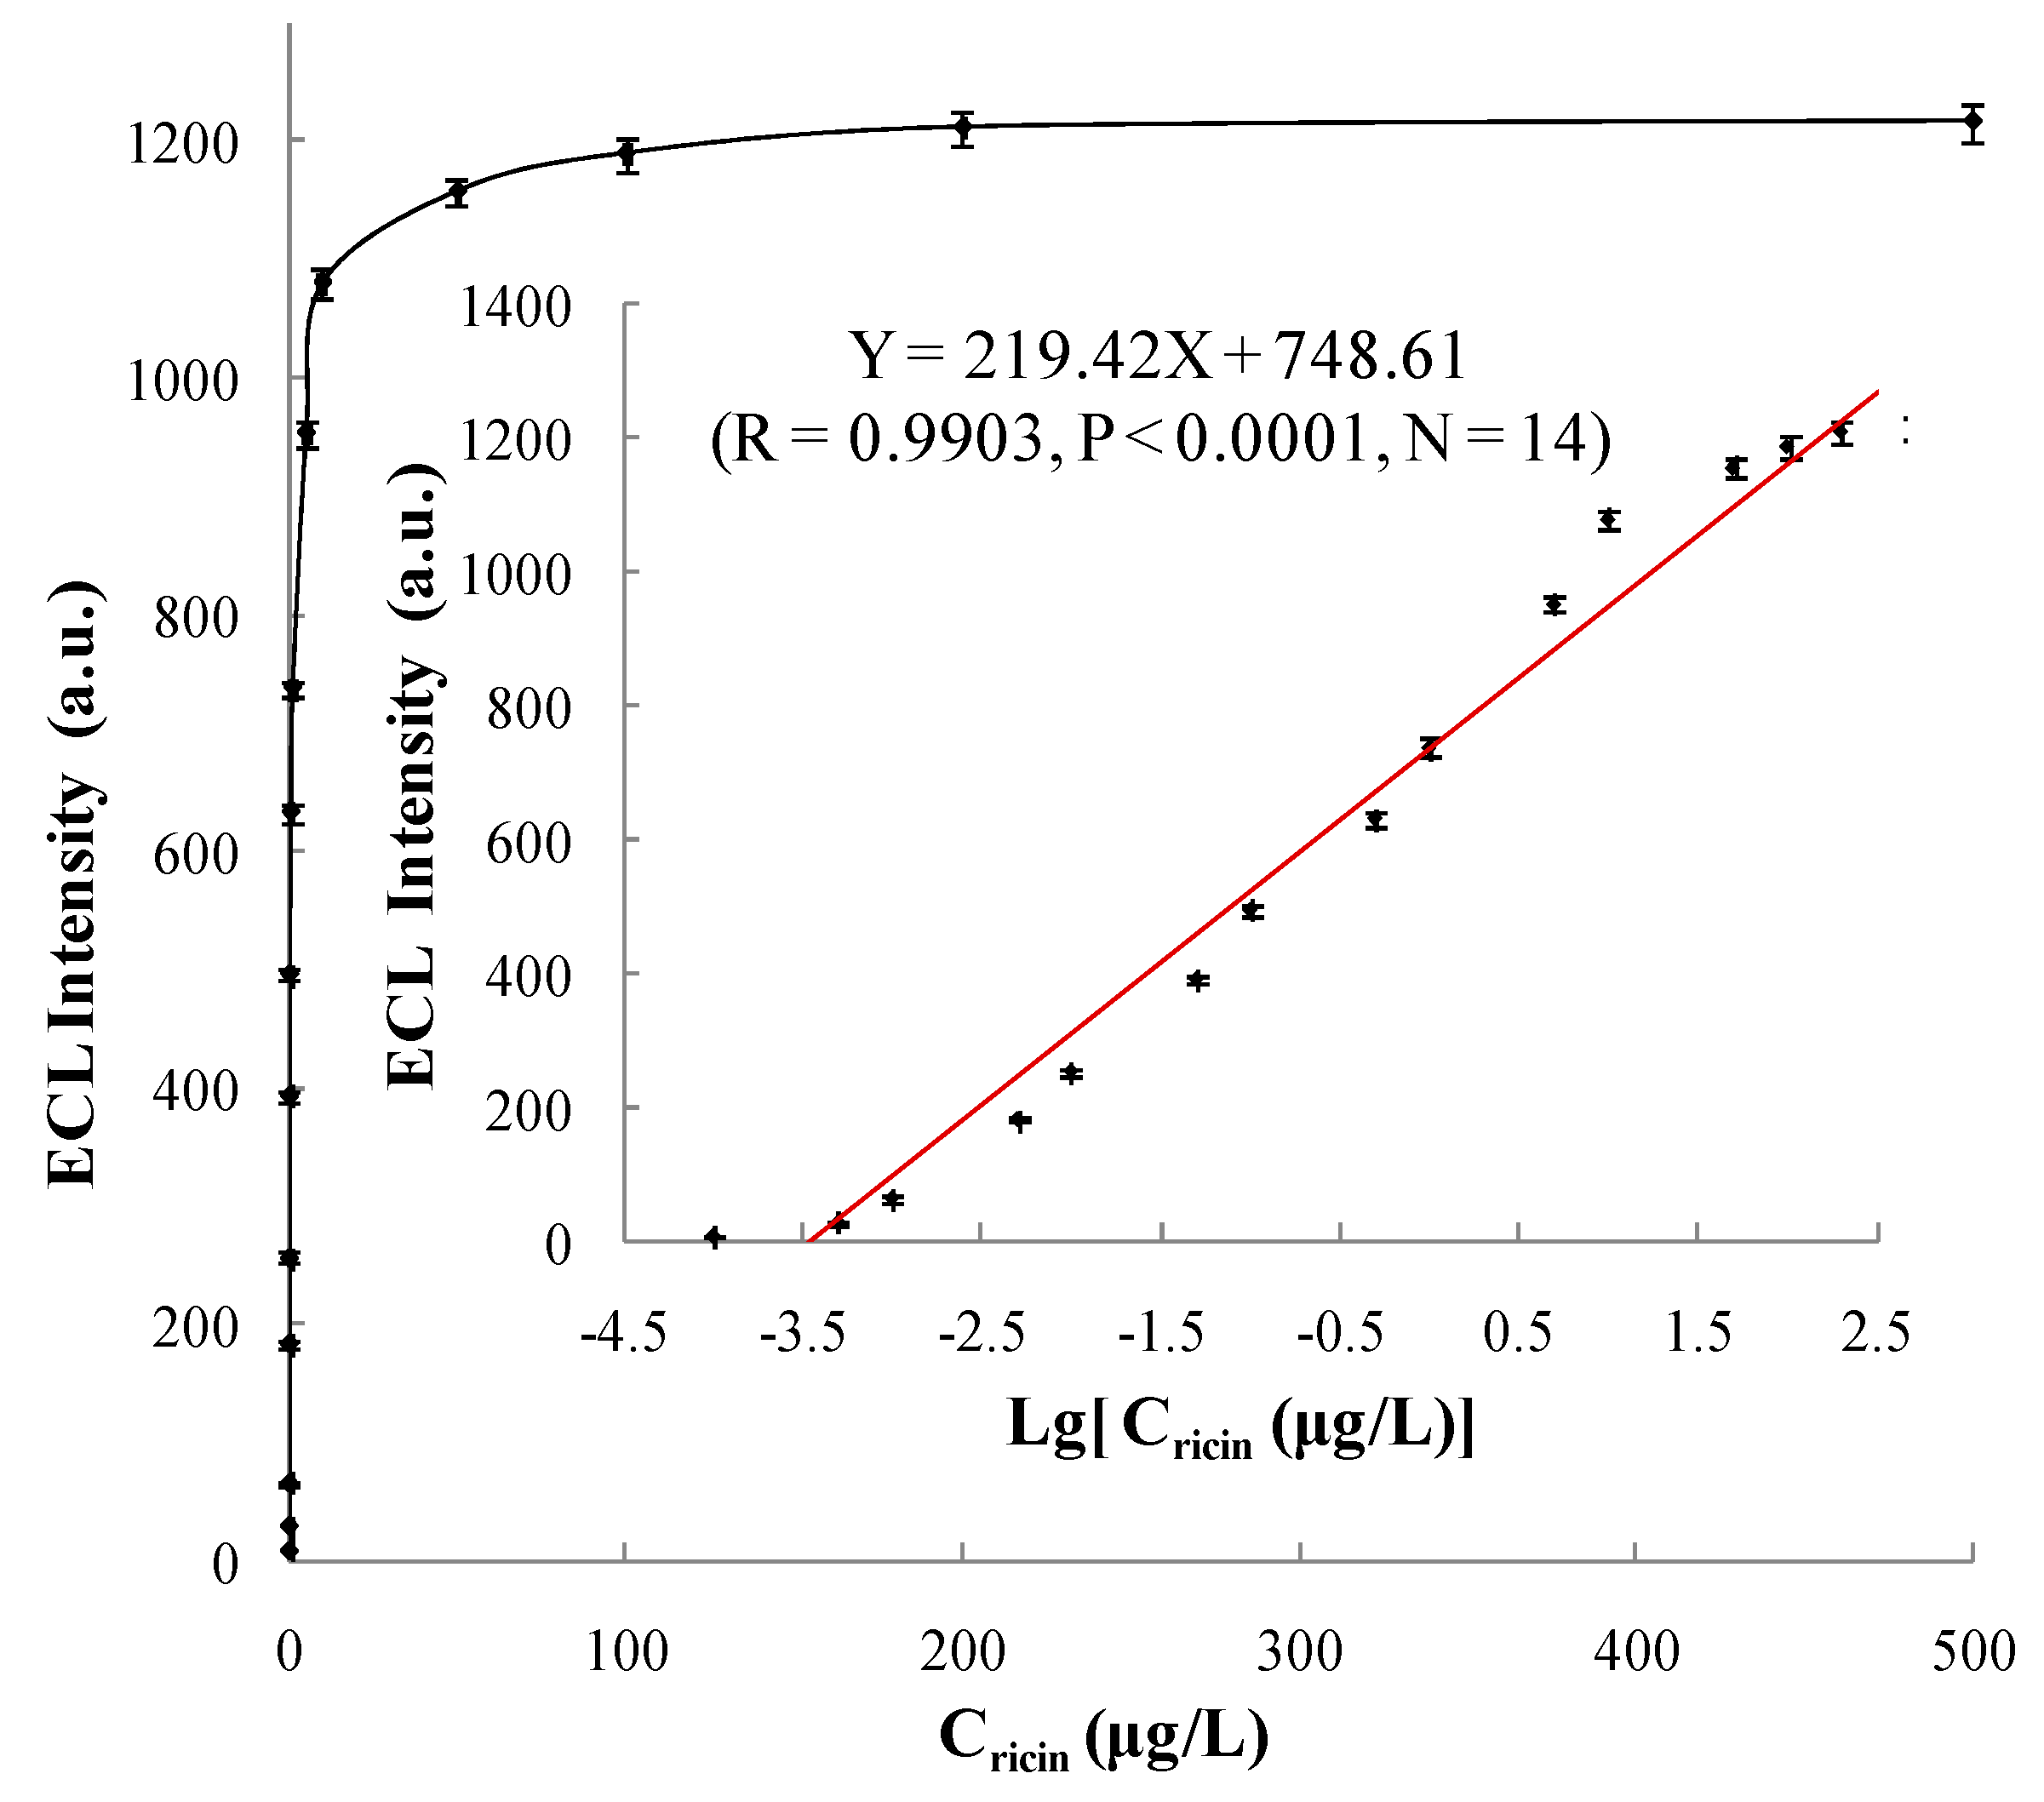
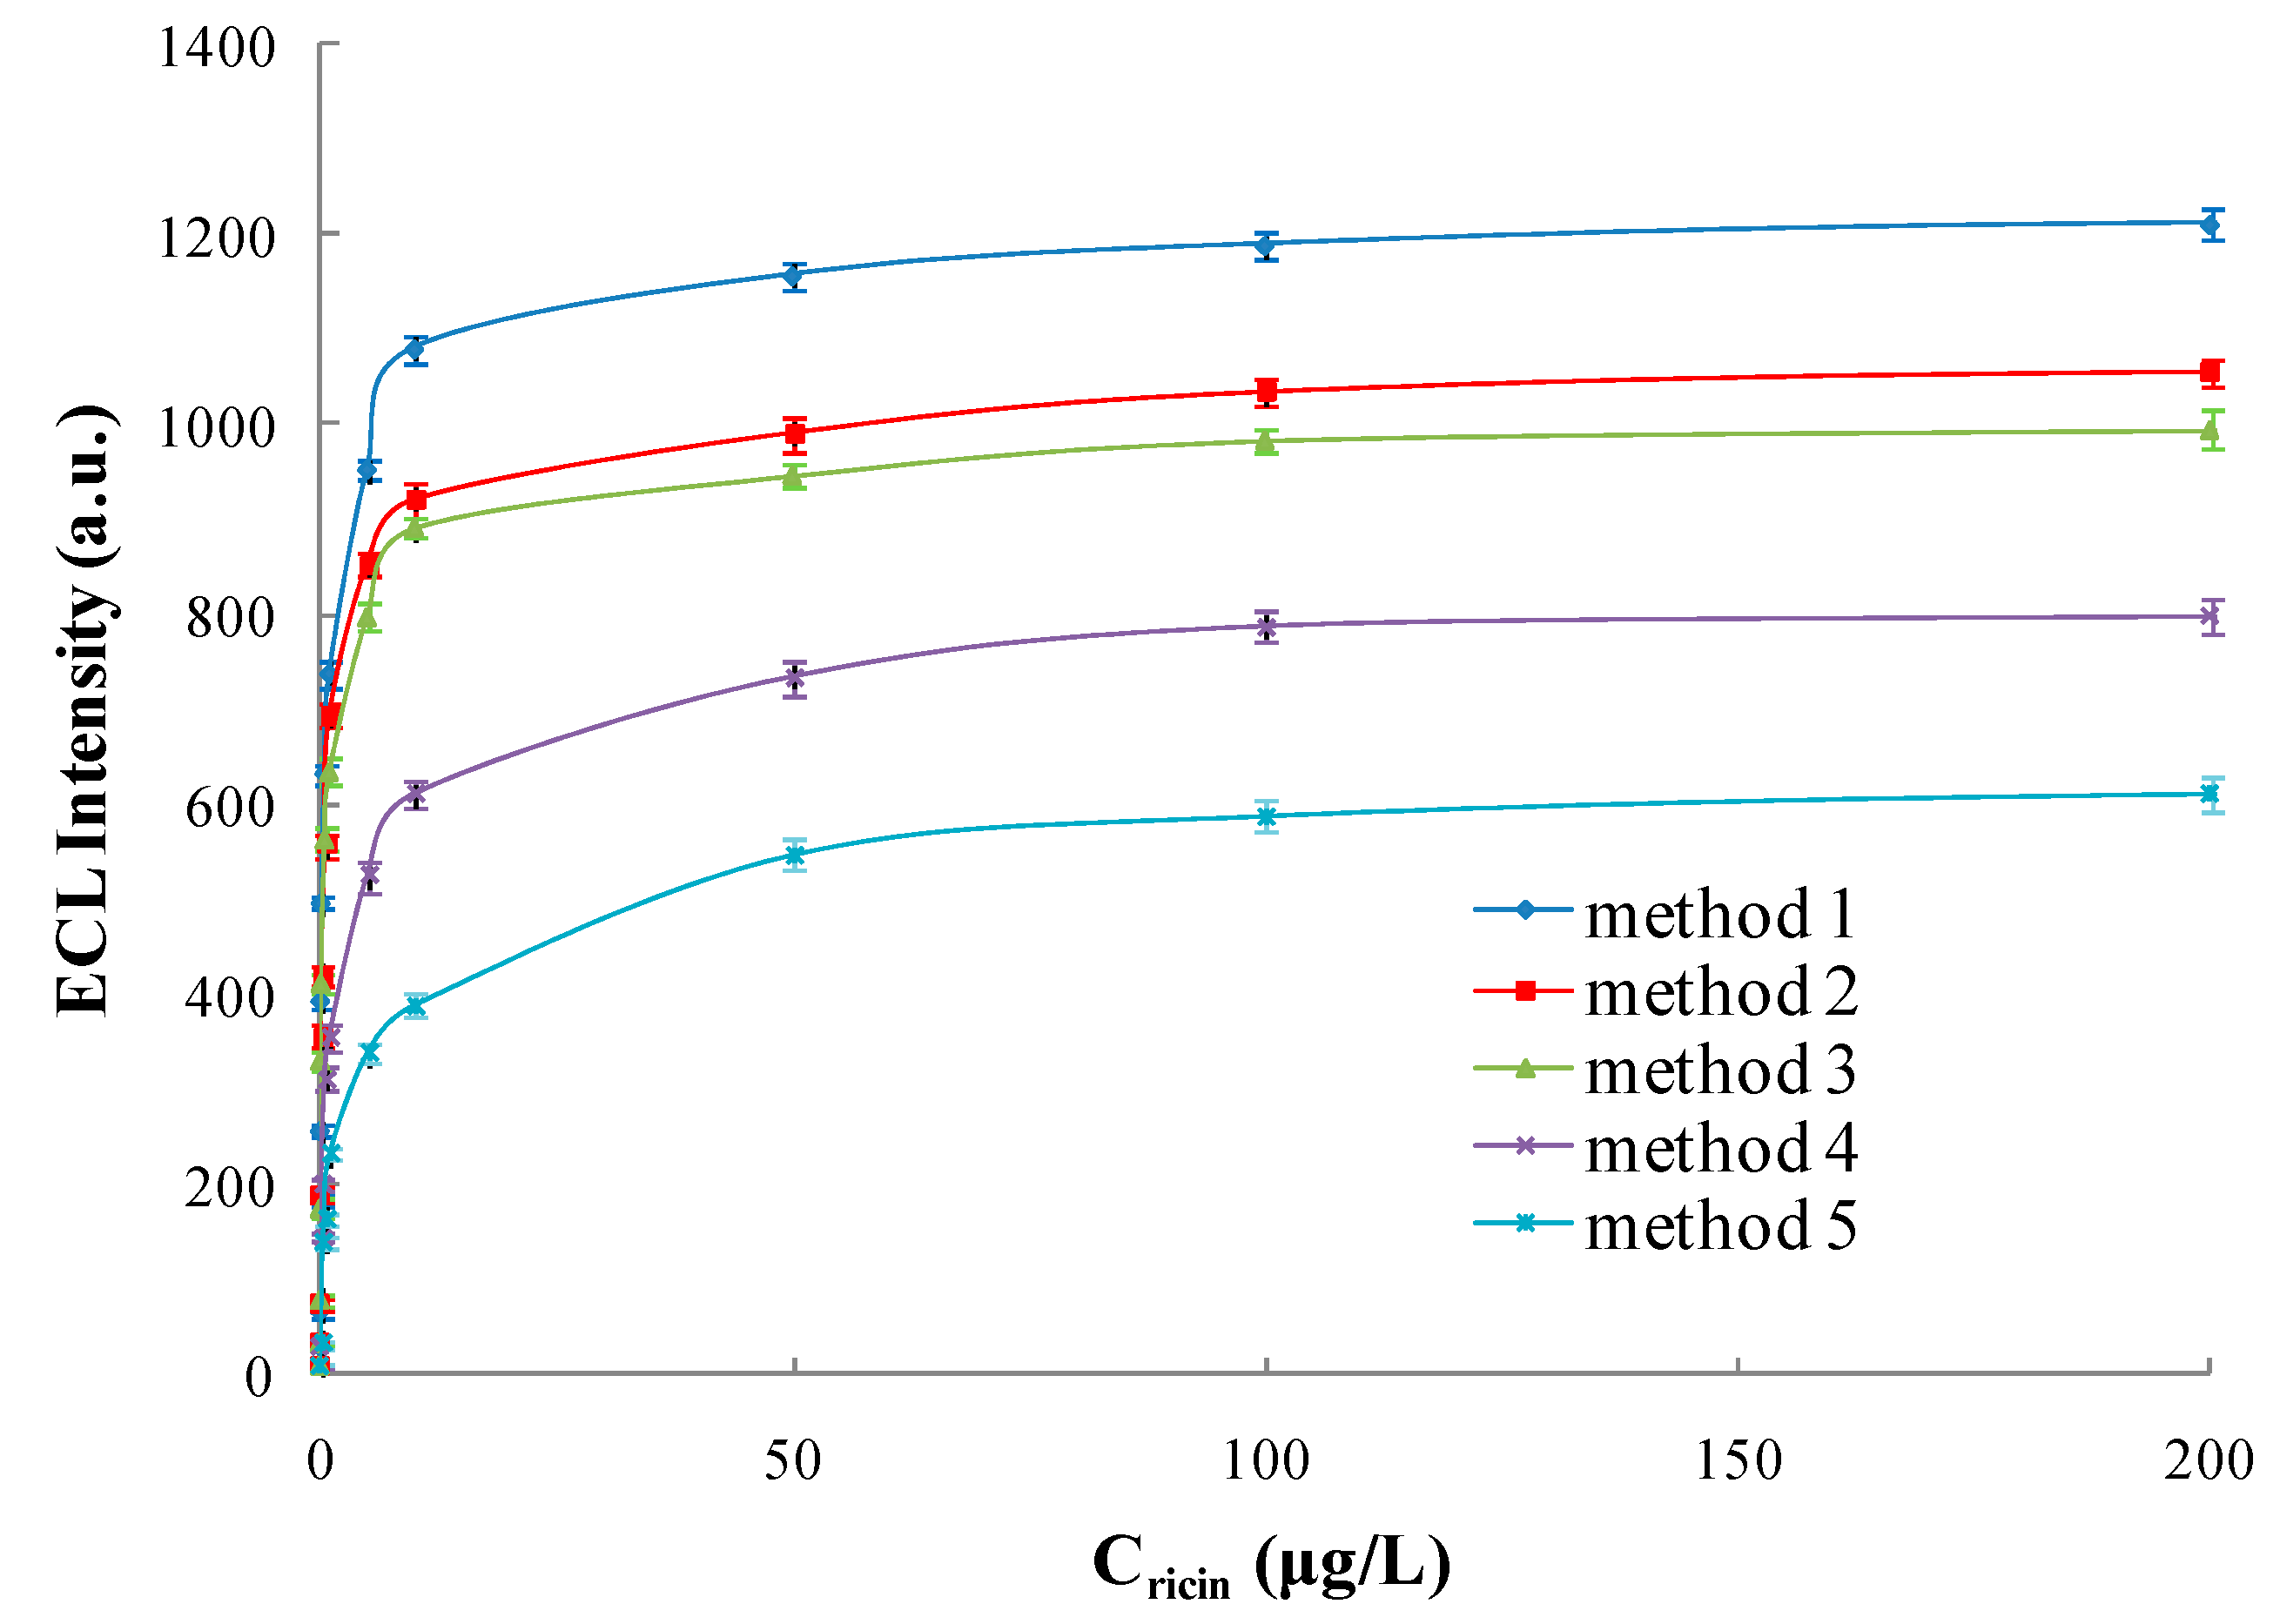
3.5.1. Linear Range and Limit of Detection

The established ECL immunosensor was used to test gold-magnetic nanoparticles complex binding of different concentrations of ricin standard substance and obtain the corresponding ECL intensity values. Figure 12 shows the ECL spectra for the ricin detection at different concentrations. Each concentration was tested five times to obtain as average ECL intensity value and deduct the baseline value. As shown in Figure 13, as the concentration of ricin increased, the ECL intensity values increased gradually and tended to reach saturation. When the concentration of ricin was between 0.0001 and 200 µg/L, the logarithm of the ricin concentration and ECL intensity values showed a significant rectilinear correlation, and the regression equation was Y = 219.42X + 748.61 (R = 0.9903, P < 0.0001, N = 14). When the concentration of ricin was 0.0001 μg/L, the “signal-to-noise ratio (S/N)” of the ECL immunosensor was 3 and we took this concentration as the limit of detection (LOD).
Five ECL immunosensors and ELISA were compared, namely SPA-coated gold-magnetic nanoparticles coupled with pcAb capturing probe-toxins-Ru(bpy)32+-labeled phage displayed antibody luminescence probe detection scheme (Method 1), SPA-coated magnetic nanoparticles coupled with pcAb capturing probe-toxins-Ru(bpy)32+-labeled phage displayed antibody luminescence probe detection scheme (Method 2), gold-magnetic nanoparticles coupled with pcAb capturing probe-toxins-Ru(bpy)32+-labeled phage displayed antibody luminescence probe detection scheme (Method 3), SPA-coated gold-magnetic nanoparticles coupled with pcAb capturing probe-toxins-Ru(bpy)32+-labeled mcAb luminescence probe detection scheme (Method 4), magnetic nanoparticles coupled with pcAb capturing probe-toxins-Ru(bpy)32+-labeled mcAb luminescence probe detection scheme (Method 5) and conventional double-antibody sandwich ELISA (Method 6). As shown in Figure 14 and Table 5, gold-magnetic nanoparticles can decrease LOD 3-fold by comparison between Method 1 and Method 2, SPA can decrease LOD 3-fold according to the comparison between Method 1 and Method 3, Ru(bpy)32+-labeled phage displayed antibody can decrease LOD 20-fold from the comparison between Method 1 and Method 4. The ECL immunosensor based on gold-magnetic nanoparticles and phage displayed antibody integrated the three amplifying effects above, and can decrease LOD 180-fold from the comparison between Method 1 and Method 5. Compared with a conventional double-antibody sandwich ELISA assay (Method 6), the detection limit of the ECL immunosensor based on gold-magnetic nanoparticles and phage displayed antibody was decreased 2500-fold.
From the comparison between Method 1 and Method 2, it was proved that the SPA-coated gold-magnetic nanoparticles functionalized capturing probe has a better binding activity than the SPA-coated magnetic nanoparticles functionalized capturing probe. From a comparison between Method 4 and Method 5, it was proved that gold-magnetic nanoparticles have better biocompatibility and can provide more active surface area and more immobilized biomolecule probe, and that SPA can orient and orderly arrange antibodies on gold-magnetic nanoparticles, improving the activity of the gold-magnetic nanoparticles functionalized capturing probe. The amplifying effects of Ru(bpy)32+-labeled phage displayed antibody and gold-magnetic nanoparticles functionalized capturing probe in the ECL immunosensor amplified the target signal and decreased the limit of detection greatly.
So far various technologies have been developed for ricin detection (see Table 6). Some of them, including enzyme-linked immunosorbent assay (ELISA) [37,38], lateral flow devices with electroluminescence detection [39], immunochromatography assay [40], electrochemiluminescence assay [41], magnetoelastic biosensors [42], microring resonator arrays [43], surface plasmon resonance biosensors [44,45], liquid-crystal based sensor [46], electrochemical biosensors [47], microelectrode array biosensors [48], Raman scattering technique [49], immuno-polymerase chain reaction assay [50,51], mass spectrometry [52], etc., are sensitive and rapid. In most of the above technologies, conventional antibodies were used as recognition molecules. The detection of ricin with phage displayed single domain antibodies (sdAb) as the recognition molecule was seldom reported. Using multiple copies of capsid proteins of phage displayed antibody, Goldman [38] established ELISA and Luminex fluid array assays based on phage displayed sdAb, which realized an amplification effect of the specific signal of target molecules with a LOD of 1 ng/mL and 64 pg/mL. In this study, we set up an ECL immunosensor integrating the multiple advantages of an ultra-highly sensitive ECL technique, SPA-coated gold-magnetic nanoparticles which improved the activity of the capturing probe, and the amplifying effect of Ru(bpy)32+-labeled phage displayed antibodies. This method decreased the LOD 10,000 times and 640 times, respectively, compared with Goldman’s reported work.

3.5.2. Accuracy and Specificity

Within the linear concentration range, 0.0005, 0.001, 0.01, 0.1, 1, 10 and 100 μg/L of ricin standard substance was tested using our ECL immunosensor. Each concentration was tested five times to obtain the ECL intensity values, which were 30 ± 2, 66 ± 5, 256 ± 5, 496 ± 6, 738 ± 14, 1080 ± 15 and 1189 ± 16 with RSDs of 8.0%, 7.3%, 2.1%, 1.3%, 1.8%, 1.4% and 1.4%, respectively, showing good accuracy.
This ECL immunosensor was also tested with 1 µg/L ricin, abrin, SEB and BSA (Table 7) whose matrix was dilution buffer (0.01 M PBS buffer, pH 7.4), and the negative control was the simulated sample without ricin, for example, dilution buffer, river water, fertilized soil (organic matter content >5%), butter biscuit (fat content >30%) and whole rabbit blood, which separately acted as matrix. The ECL intensity values of the non-target proteins, abrin, SEB, and BSA were close to negative results, indicating the high specificity of this method for the detection of ricin.

3.5.3. Detection of Ricin in Simulated Samples

As shown in Table 8, all simulated samples which contained ricin in river water, fertilized soil (organic matter content >5%), butter biscuit (fat content >30%) and whole rabbit blood were examined using the ECL immunosensor, showing recovery ratios of 90.8%~94.2%.
With the conventional double-antibody sandwich ELISA, experiments were repeated, and the concentration of simulated samples was 5 μg/L. As shown in Table 9, the recovery ratio of ricin in river water and butter biscuit was 92.2% and 91.0%, respectively, and it was above 110% both in fertilized soil and whole rabbit blood. It was absorbance value that was determined using ELISA, and the color of solutions will affect the result of the determination. Because of the colors of fertilized soil and whole rabbit blood solution, the absorbance value of simulated samples was above the actual value, and the recovery ratio increased. However, with the enrichment and separation properties, the ECL immunosensor can overcome the interference of complex backgrounds and separate the samples selectively. This method met the requirements for analysis of the simulated samples above, showing high recovery ratios and reproducibility.

4. Discussion

As a new functionalized magnetic material, gold-magnetic nanoparticles have the double advantages of gold nanoparticles and magnetic nanoparticles. Due to their excellent dispersion, stability, biocompatibility, sensitivity, specificity, interference-resistance, and easy manipulation, gold-magnetic nanoparticles have shown good prospects in biomedicine, molecular biology, immunology, cell biology and environmental engineering. In this study, gold-magnetic nanoparticles were used as a magnetic capturing probe carrier, SPA was used to orient and orderly arrange antibodies, and SPA functionalized gold-magnetic nanoparticles were obtained, which have the multiple advantages of gold and magnetic nanoparticles and oriented immobilization of antibodies.
The gold-magnetic nanoparticles were coated with SPA and coupled with pcAb to construct the SPA-coated gold-magnetic nanoparticles functionalized capturing probe. This kind of probe has a better the binding activity, and decreased LOD 3-fold and 9-fold compared with the SPA-coated magnetic nanoparticles functionalized capturing probe and the conventional magnetic nanoparticles functionalized capturing probe. The advantages of SPA-coated gold-magnetic nanoparticles functionalized capturing probe can be summarized as follows: on the one hand, compared with magnetic nanoparticles, the gold-magnetic nanoparticles show significantly more surface area and volume effects, better stability and biocompatibility, and can provide more active surface area and more immobilized biomolecule probe. On the other hand, the SPA can be linked with the Fc fragment of IgG molecules by hydrophobic interactions, so antibody molecule probes were oriented and orderly arranged on the gold-magnetic nanoparticles’ surfaces. This oriented fixation is better organized than either direct physical adsorption or covalent binding, and it has less impact on the activity of antibodies, so the activity of the functionalized capturing probe was improved. In addition, the phage displayed antibody contains multiple capsid protein copies. When the Ru(bpy)32+-labeled phage displayed antibody was taken as the luminescence probe, it can be bound with more Ru(bpy)32+, compared with conventional Ru(bpy)32+-labeled mcAb, so the signal of target molecules can be amplified greatly. In a previous study, our research group has established a magnetic immunoassay and an ECL immunosensor based on phage displayed antibodies [9,10,11]. In this study, we set up an ECL immunosensor integrating the multiple advantages of the ultra-highly sensitive ECL technique, SPA-coated gold-magnetic nanoparticles improving the activity of the capturing probe, and the amplifying effect of Ru(bpy)32+-labeled phage displayed antibodies. As the carrier of the magnetic capturing probe, the gold-magnetic nanoparticles were coated with SPA and coupled with pcAb to construct magnetic capturing probes, then Ru(bpy)32+-labeled phage displayed antibody was used as a specific luminescence probe, and the ECL immunosensor based on gold-magnetic nanoparticles and phage displayed antibodies was obtained. A new method for trace toxin detection was set up, and it realized detection of trace ricin levels. The LOD was 0.0001 µg/L, which was 2500-fold lower than that of conventional ELISA. The gold-magnetic nanoparticles, SPA and Ru(bpy)32+-labeled phage displayed antibody displayed different amplifying effects in the ECL immunosensor and can decrease LOD 3-fold, 3-fold and 20-fold, respectively. The detection limit of the sensor was decreased 180 times as a result of the integrated amplifying effect of the above three components.

5. Conclusions

This paper proposed a new ECL immunosensor for biological trace sample detection. The immunosensor integrates the unique advantages of an ultra-highly sensitive ECL technique, a SPA-coated gold-magnetic nanoparticle-functionalized probe as magnetic capturing probe, and Ru(bpy)32+-labeled phage displayed antibodies as luminescence probe. Such an integration idea shows good application prospects for the detection of complex biological samples that require high sensitivity, specificity and interference-resistance. The ECL immunosensor is proven well suitable for the analysis of trace levels of ricin in various environmental samples with high recovery ratio and reproducibility. The linear range of the sensor was 0.0001~200 µg/L, and the LOD was 0.0001 µg/L, which represented a 2500-fold lower one than that of conventional ELISA. The gold-magnetic nanoparticles, SPA and Ru(bpy)32+-labeled phage displayed antibodies displayed different amplifying effects in the ECL immunosensor and can decrease LOD 3-fold, 3-fold and 20-fold compared with the ECL immunosensor without one of the three effects, respectively. The integrated amplifying effect can decrease the LOD 180 times.

Acknowledgments

This paper was founded by the State Key Laboratory of NBC Protection for Civilian (SKLNBC2014-03).

Author Contributions

Xihui Mu performed the construction of the Electrochemiluminescence immunosensor and optimization of the experiments, and wrote the paper; Zhaoyang Tong designed the experiments and coordinated the project, interpreted the signal amplifying effects and analyzed the results, and corrected the paper; Qibin Huang, Bing Liu, Zhiwei Liu, Lanqun Hao, Hua Dong, Jinping Zhang and Chuan Gao analyzed the data of the experiments. All authors approved the final version of the manuscript.

Conflicts of Interest

The authors declare no conflict of interest.

References

  1. Muzyka, K. Current trends in the development of the electrochemiluminescent mmunosensors. Biosens. Bioelectron. 2014, 54, 393–407. [Google Scholar] [CrossRef] [PubMed]
  2. Bertoncello, P.; Forster, R.J. Nanostructured materials for electrochemiluminescence (ECL)-based detection methods: Recent advances and future perspectives. Biosens. Bioelectron. 2009, 24, 3191–3200. [Google Scholar] [CrossRef] [PubMed]
  3. Smith, G.P. Filamentous fusion phage: Novel expression vectors that display cloned antigens on the virion surface. Science 1985, 228, 1315–1317. [Google Scholar] [CrossRef] [PubMed]
  4. McCafferty, J.; Griffiths, A.D.; Winter, G.; Chisweu, D.J. Phage antibodies: Filamentous phage displaying antibody variable domains. Nature 1990, 348, 552–554. [Google Scholar] [CrossRef] [PubMed]
  5. Boel, E.; Verlaan, S.; Poppelier, M.J.J.G.; Westerdaal, N.A.C.; van Strijp, J.A.G.; Logtenberg, T. Functional human monoclonal antibodies of all isotypes constructed from phage display library-derived single-chain Fv antibody fragments. J. Immunol. Methods 2000, 239, 153–166. [Google Scholar] [CrossRef]
  6. Pini, A.; Ricci, C.; Bracci, L. Phage display and colony filter screening for high-throughput selection of antibody libraries. Comb. Chem. High Throughput Screen. 2002, 5, 503–510. [Google Scholar] [CrossRef] [PubMed]
  7. Harmsen, M.; De Haard, H. Properties, production, and applications of camelid single-domain antibody fragments. Appl. Microbiol. Biotechnol. 2007, 77, 13–22. [Google Scholar] [CrossRef] [PubMed]
  8. Kim, H.J.; Ahn, K.C.; González-Techera, A.; González-Sapienza, G.G.; Gee, S.J.; Hammock, B.D. Magnetic bead-based phage anti-immunocomplex assay (PHAIA) for the detection of the urinary biomarker 3-phenoxybenzoic acid to assess human exposure to pyrethroid insecticides. Anal. Biochem. 2009, 386, 45–52. [Google Scholar] [CrossRef] [PubMed]
  9. Liu, B.; Tong, Z.Y.; Liu, W.; Hao, L.Q.; Mu, X.H.; Huang, Q.B. Determination of Abrin by Electrochemiluminescence Immunosensor Based on Phage-displayed Antibody. Chin. J. Anal. Chem. 2013, 41, 1449–1453. [Google Scholar] [CrossRef]
  10. Mu, X.H.; Tong, Z.Y.; Huang, Q.B.; Liu, B.; Liu, Z.W.; Hao, L.Q.; Zhang, J.P. Magnetic Affinity Immunoassay Based Enzyme-labeled Phage Displayed Antibody. Chin. J. Anal. Chem. 2014, 42, 785–790. [Google Scholar] [CrossRef]
  11. Mu, X.H.; Tong, Z.Y.; Huang, Q.B.; Liu, B.; Liu, Z.W.; Hao, L.Q.; Zhang, J.P.; Gao, C.; Wang, F.W. Nano-magnetic Immunosensor Based on Staphylococcus Protein A and the Amplification Effect of HRP-conjugated Phage Antibody. Sensors 2015, 15, 3896–3910. [Google Scholar] [CrossRef] [PubMed]
  12. Namba, Y.; Usami, M.; Suzuki, O. Highly Sensitive Electrochemiluminescence Immunoassay Using the Ruthenium Chelate Labeled Antibody Bound on the Magnetic Micro Beads. Anal. Sci. 1999, 15, 1087–1093. [Google Scholar] [CrossRef]
  13. Miao, W.; Bard, A.J. Electrogenerated chemiluminescence. 80. C-reactive protein determination at high amplification with [Ru(bpy)3]2+-containing microspheres. Anal. Chem. 2004, 76, 7109–7113. [Google Scholar] [CrossRef] [PubMed]
  14. Li, M.Y.; Sun, Y.M.; Chen, L.; Li, L.; Zou, G.Z.; Zhang, X.L. Ultrasensitive eletrogenerated chemiluminescence immunoassay by magnetic nanobead amplification. Electroanalysis 2010, 22, 333–337. [Google Scholar] [CrossRef]
  15. Yan, G.H.; Xing, D. Rapid and sensitive immunomagnetic-electrochemiluminescent detection of p53 antibodies in human serum. J. Immunol. Methods 2004, 288, 47–54. [Google Scholar] [CrossRef] [PubMed]
  16. Pereira, S.V.; Messina, G.A.; Raba, J. Integrated microfluidic magnetic immunosensor for quantification of human serum IgG antibodies to Helicobacter pylori. J. Chromatogr. B 2010, 878, 253–257. [Google Scholar] [CrossRef] [PubMed]
  17. Yu, H.; Raymonda, J.W.; McMahon, T.M. Detection of biological threat agents by immunomagnetic microsphere-based solid phase fluorogenic and electro-chemiluminescence. Biosens. Bioelectron. 2000, 14, 829–840. [Google Scholar] [CrossRef]
  18. Li, F.; Zhou, R.; Zhao, K.H.; Chen, H.C.; Hu, Y.G. Magnetic beads-based electrochemical immunosensor for detection of pseudorabies virus antibody in swine serum. Talanta 2011, 87, 302–306. [Google Scholar] [CrossRef] [PubMed]
  19. Liu, B.; Tong, Z.Y.; Liu, W.; Hao, L.Q.; Mu, X.H.; Huang, Q.B. An Electrochemiluminescence Immunoassay Based on GoldMag Particles. Chin. J. Instrum. Anal. 2013, 32, 998–1002. [Google Scholar]
  20. Zhou, H.J.; Lee, J.W.; Park, T.J.; Lee, S.J.; Parkd, J.Y.; Lee, J.B. Ultrasensitive DNA monitoring by Au-Fe3O4 nanocomplex. Sens. Actuators B Chem. 2012, 163, 224–232. [Google Scholar] [CrossRef]
  21. Masoomi, L.L.; Sadeghi, O.; Banitaba, M.H.; Shahrjerdi, A.; Davarani, S.S.H. A non-enzymatic nanomagnetic electro-immunosensor for determination of Aflatoxin B1 as a model antigen. Sens. Actuators B Chem. 2013, 177, 1122–1127. [Google Scholar] [CrossRef]
  22. Peng, H.P.; Liang, R.P.; Zhang, L.; Qiu, J.D. Facile preparation of novel core-shell enzyme-Au-polydopamine-Fe3O4 magnetic bionanoparticles for glucose sensor. Biosens. Bioelectron. 2013, 42, 293–299. [Google Scholar] [CrossRef] [PubMed]
  23. Parshetti, G.K.; Lin, F.H.; Doong, R.A. Sensitive amperometric immunosensor for α-fetoprotein detection based on multifunctional dumbbell-like Au-Fe3O4 heterostructures. Sens. Actuators B Chem. 2013, 186, 34–43. [Google Scholar] [CrossRef]
  24. Chen, M.; Bi, S.; Jia, X.Q.; He, P. Aptamer-conjugated bio-bar-code Au-Fe3O4 nanoparticles as amplification station for electrochemiluminescence detection of tumor cells. Anal. Chim. Acta 2014, 837, 44–51. [Google Scholar] [CrossRef] [PubMed]
  25. Jayanthi, S.A.; David, T.M.; Jayashainy, J.; Nathan, D.M.; Sagayaraj, P. A convenient two-step bottom-up approach for developing Au/Fe3O4 nanocomposites with useful optical and magnetic properties. J. Alloys Compd. 2014, 606, 254–261. [Google Scholar] [CrossRef]
  26. Feng, B.; Huang, S.R.; Ge, F. 3D antibody immobilization on a planar matrix surface. Biosens. Bioelectron. 2011, 28, 91–96. [Google Scholar] [CrossRef] [PubMed]
  27. Ikeda, T.; Hata, Y.; Ninomiya, K.I. Oriented immobilization of antibodies on a silicon wafer using Si-tagged protein A. Anal. Biochem. 2009, 385, 132–137. [Google Scholar] [CrossRef] [PubMed]
  28. Shen, G.Y.; Cai, C.B.; Wang, K.; Lu, J.L. Improvement of antibody immobilization using hyperbranched polymer and protein A. Anal. Biochem. 2011, 409, 22–27. [Google Scholar] [CrossRef] [PubMed]
  29. Yu, T.; Tang, J.J.; Hao, L.Q.; Mu, X.H.; Tong, Z.Y.; Yan, Y.; Dong, Z.H. A new purification method for ricin toxin. Chin. J. Biotechnology. 2005, 15, 53–55. [Google Scholar]
  30. Yang, Y.Y.; Mu, D.H.; Tong, Z.Y.; Mu, X.H.; Hao, L.Q. Determination of Ricin by double antibody sandwich enzyme-linked immunosorbent assay. Chin. J. Anal. Chem. 2007, 35, 439–442. [Google Scholar]
  31. Yang, Y.Y.; Mu, D.H.; Tong, Z.Y.; Mu, X.H.; Hao, L.Q. Rapid determination of ricin by indirect enzyme-linked immunosorbent assay. Chin.J. Instrum. Anal. 2007, 26, 533–536. [Google Scholar]
  32. Mu, X.H.; Zhou, Z.Q.; Tong, Z.Y.; Liu, B.; Hao, L.Q. Detection of abrin by piezoelectric immunosensor based on biotin-avidin system. Chin. J. Anal. Chem. 2009, 37, 1499–1502. [Google Scholar]
  33. Chui, Y.L.; Hui, W.L.; Wang, H.R.; Wang, L.J.; Chen, C. The preparation conditions and properties research of Fe3O4/Au composite particles. Sci. China Ser. B 2003, 33, 482–488. [Google Scholar]
  34. Molek, P.; Vodnik, M.; Štrukelj, B.; Bratkovic, T. Screening of synthetic phage display scFv libraries yields competitive ligands of human leptin receptor. Biochem. Bioph. Res. Co. 2014, 452, 479–483. [Google Scholar] [CrossRef] [PubMed]
  35. Cao, Y.; Yang, H.; Zhou, X.L.; Mao, H.W.; Gao, T.T.; Hu, Z.G.; He, L.F.; Pan, F.Y.; Guo, Z.G. Selection and characterization of human PCSK9 antibody from phage displayed antibody library. Biochem. Bioph. Res. Co. 2015, 463, 712–718. [Google Scholar] [CrossRef] [PubMed]
  36. Miao, W.J.; Choi, J.P.; Bard, A.J. Electrogenerated chemiluminescence 69: The Tris(2,2′-bipy-ridine) ruthenium(II), (Ru(bpy)32+)/Tri-n-pro-pylamine (TPrA) system revisited-a new route involving TPrA·+ cation radicals. J. Am. Chem. Soc. 2002, 124, 14478–14485. [Google Scholar] [CrossRef] [PubMed]
  37. Garber, E.A.; Thole, J. Application of microwave irradiation and heat to improve gliadin detection and ricin ELISA throughput with food samples. Toxins 2015, 7, 2135–2144. [Google Scholar] [CrossRef] [PubMed]
  38. Goldman, E.R.; Liu, J.L.; Bernstein, R.D.; Swain, M.D.; Mitchell, S.Q.; Anderson, G.P. Ricin detection using phage displayed single domain antibodies. Sensors 2009, 9, 542–555. [Google Scholar] [CrossRef] [PubMed]
  39. Kenigsberg, J.D.; Bertocchi, A.; Garber, E.A.E. Rapid detection of ricin in cosmetics and elimination of artifacts associated with wheat lectin. J. Immunol. Methods 2008, 336, 251–254. [Google Scholar] [CrossRef] [PubMed]
  40. Shyu, R.H.; Shyu, H.F.; Liu, H.W.; Tang, S.S. Colloidal gold-based immunochromatographic assay for detection of ricin. Toxicon 2002, 40, 255–258. [Google Scholar] [CrossRef]
  41. Guglielmo-Viret, V.; Thullier, P. Comparison of an electrochemiluminescence assay in plate format over a colorimetric ELISA, for the detection of ricin B chain (RCA-B). J. Immunol. Methods 2007, 328, 70–78. [Google Scholar] [CrossRef] [PubMed]
  42. Shankar, K.; Zeng, K.; Ruan, C.; Grimes, C.A. Quantification of ricin concentrations in aqueous media. Sens. Actuators B Chem. 2005, 107, 640–648. [Google Scholar] [CrossRef]
  43. Shia, W.W.; Bailey, R.C. Single domain antibodies for the detection of ricin using silicon photonic microring resonator arrays. Anal. Chem. 2013, 85, 805–810. [Google Scholar] [CrossRef] [PubMed]
  44. Anderson, G.P.; Glaven, R.H.; Algar, W.R.; Susumu, K.; Stewart, M.H.; Medintz, I.L.; Goldman, E.R. Single domain antibody–quantum dot conjugates for ricin detection by both fluoroimmunoassay and surface plasmon resonance. Anal. Chim. Acta 2013, 786, 132–138. [Google Scholar] [CrossRef] [PubMed]
  45. Stern, D.; Pauly, D.; Zydek, M.; Müller, C.; Avondet, M.A.; Worbs, S.; Lisdat, F.; Dorner, M.B.; Dorner, B.G. Simultaneous differentiation and quantification of ricin and agglutinin by an antibody-sandwich surface plasmon resonance sensor. Biosens. Bioelectron. 2016, 78, 111–117. [Google Scholar] [CrossRef] [PubMed]
  46. Zhao, Y.B.; Yu, J.H.; Zhao, H.F.; Tong, C.Y.; Wang, P.H. A novel method for label-free detection of ricin using liquid crystals supported on chemically functionalized surfaces. Sens. Actuators B Chem. 2011, 155, 351–356. [Google Scholar] [CrossRef]
  47. Fetter, L.; Richards, J.; Daniel, J.; Roon, L.; Rowland, T.J.; Bonham, A.J. Electrochemical aptamer scaffold biosensors for detection of botulism and ricin toxins. Chem. Commun. 2015, 51, 15137–15140. [Google Scholar] [CrossRef] [PubMed]
  48. Periyakaruppan, A.; Arumugam, P.U.; Meyyappan, M.; Koehne, J.E. Detection of ricin using a carbon nanofiber based biosensor. Biosens. Bioelectron. 2011, 28, 428–433. [Google Scholar] [CrossRef] [PubMed]
  49. Lamont, E.A.; He, L.L.; Warriner, K.; Labuza, T.P.; Sreevatsan, S. A single DNA aptamer functions as a biosensor for ricin. Analyst 2011, 136, 3884–3895. [Google Scholar] [CrossRef] [PubMed]
  50. He, X.; McMahon, S.; McKeon, T.A.; Brandon, D.L. Development of a novel immuno-PCR assay for detection of ricin in ground beef, liquid chicken egg, and milk. J. Food Prot. 2010, 73, 695–700. [Google Scholar] [PubMed]
  51. Yin, H.Q.; Jia, M.X.; Yang, S.; Wang, S.Q.; Zhang, J.G. A nanoparticle-based bio-barcode assay for ultrasensitive detection of ricin toxin. Toxicon 2012, 59, 12–16. [Google Scholar] [CrossRef] [PubMed]
  52. Kanamori-Kataoka, M.; Kato, H.; Uzawa, H.; Ohta, S.; Takei, Y.; Furuno, M.; Seto, Y. Determination of ricin by nano liquid chromatography/mass spectrometry after extraction using lactose-immobilized monolithic silica spin column. J. Mass Spectrom. 2011, 46, 821–829. [Google Scholar] [CrossRef] [PubMed]
Figure 1. Model of detection toxin by ECL immunosensor based on gold-magnetic nanoparticles and phage displayed antibody.
Sensors 16 00308 g001
Figure 2. TEM images of magnetic nanoparticles (a) and gold-magnetic nanoparticles (b).
Sensors 16 00308 g002
Figure 3. UV-Vis spectrum of SPA solution before and after binding to magnetic nanoparticles ((a) UV-Vis spectrum of 240 μg of SPA solution before binding to magnetic nanoparticles; (b) UV-Vis spectrum of 240 μg of SPA solution after binding to magnetic nanoparticles).
Sensors 16 00308 g003
Figure 4. UV-Vis spectrum of SPA solution before and after binding to gold-magnetic nanoparticles. (a) UV-Vis spectrum of 320 μg of SPA solution before binding to gold-magnetic nanoparticles; (b) UV-Vis spectrum of 320 μg of SPA solution after binding to gold-magnetic nanoparticles).
Sensors 16 00308 g004
Figure 5. Immobilization ability of polyclonal antibody on 1 mg of gold-magnetic nanoparticles and magnetic nanoparticles.
Sensors 16 00308 g005
Figure 6. Immobilization ability of polyclonal antibody on 1 mg of gold-magnetic nanoparticles.
Sensors 16 00308 g006
Figure 7. Magnetic hysteresis loops curve of the SPA-coated gold-magnetic nanoparticles functionalized capturing probe.
Sensors 16 00308 g007
Figure 8. Determination activity of the SPA-coated gold-magnetic nanoparticles functionalized capturing probe.
Sensors 16 00308 g008
Figure 9. Determination of absorbance values of the 20 anti-ricin phage displayed antibody clones by ELISA.
Sensors 16 00308 g009
Figure 10. UV-Vis spectrum of ECL probe ((a) UV-Vis spectrum of phage displayed antibody; (b) UV-Vis spectrum of Ru(bpy)32+-NHS ester; (c) UV-Vis spectrum of Ru(bpy)32+-labeled phage displayed antibody).
Sensors 16 00308 g010
Figure 11. ECL profile of luminescence probe.
Sensors 16 00308 g011
Figure 12. ECL spectra for the ricin detection at different concentrations.
Sensors 16 00308 g012
Figure 13. Standard curve of ricin determined by ECL immunosensor.
Sensors 16 00308 g013
Figure 14. Comparison of five ECL immunosensors (Method 1: SPA-coated gold-magnetic nanoparticles coupled with pcAb capturing probe–toxins–Ru(bpy)32+-labeled phage displayed antibody luminescence probe detection scheme; Method 2: SPA-coated magnetic nanoparticles coupled with pcAb capturing probe–toxins–Ru(bpy)32+-labeled phage displayed antibody luminescence probe detection scheme; Method 3: gold-magnetic nanoparticles coupled with pcAb capturing probe–toxins–Ru(bpy)32+-labeled phage displayed antibody luminescence probe detection scheme; Method 4: SPA-coated gold-magnetic nanoparticles coupled with pcAb capturing probe–toxins–Ru(bpy)32+-labeled mcAb luminescence probe detection scheme; Method 5: magnetic nanoparticles coupled with pcAb capturing probe–toxins–Ru(bpy)32+-labeled mcAb luminescence probe detection scheme).
Sensors 16 00308 g014
Table 1. Absorbance value of SPA solution before and after binding to magnetic nanoparticles (n = 5).
Added Amount (µg)A280nm beforeA280nm afterBinding Ratio (%)Immobilized Amount (µg)
400.428 ± 0.0050.043 ± 0.00375.030
800.773 ± 0.0070.106 ± 0.00672.558
1601.077 ± 0.0080.249 ± 0.00563.8102
2401.498 ± 0.0070.530 ± 0.00846.3111
3201.959 ± 0.0090.931 ± 0.00835.3113
4002.443 ± 0.0081.404 ± 0.00929.3117
5003.037 ± 0.0091.998 ± 0.00824.0120
Table 2. Absorbance value of SPA solution before and after binding to gold-magnetic nanoparticles.
Added Amount (µg)A280nm beforeA280nm afterBinding Ratio (%)Immobilized Amount (µg)
400.428 ± 0.0060.107 ± 0.00490.036
800.773 ± 0.0080.213 ± 0.00686.369
1601.077 ± 0.0070.390 ± 0.00676.9123
2401.498 ± 0.0080.800 ± 0.00764.6155
3201.959 ± 0.0091.267 ± 0.00852.5168
4002.443 ± 0.0081.720 ± 0.00742.3169
5003.037 ± 0.0092.308 ± 0.00934.2171
Table 3. Absorbance value of BSA solution before and after binding to gold-magnetic nanoparticles.
Added Amount (µg)A280nm beforeA280nm afterBinding Ratio (%)Immobilized Amount (µg)
400.434 ± 0.0080.043 ± 0.00690.036
800.795 ± 0.0090.099 ± 0.00787.570
1601.094 ± 0.0080.219 ± 0.00880.0128
2401.518 ± 0.0090.411 ± 0.00672.9175
3201.923 ± 0.0070.600 ± 0.00968.8220
4002.446 ± 0.0090.824 ± 0.00866.3265
4802.956 ± 0.0101.318 ± 0.00955.4266
5603.550 ± 0.0101.864 ± 0.01047.5266
Table 4. Selective enrichment of anti-ricin phage displayed antibodies from the libraries during panning.
RoundPhage Input (PFU)Phage Output (PFU)Recovery Ratio (%)
13.3 × 10126.2 × 1051.9 × 10−7
29.6 × 10119.7 × 1051.0 × 10−6
31.4 ×10122.2 × 1061.6 × 10−6
Recovery ratio (%) = (No. of phage output)/(No. of phage input) × 100%.
Table 5. Comparison of five ECL immunosensor and ELISA (Method 1~5 see Figure 9; Method 6: conventional double-antibody sandwich ELISA.)
Detecting SchemeLinear Range (μg/L)Regression EquationCorrelation Coefficient (R)Limit of Detection (μg/L)
Method 10.0001~200Y = 219.42X + 748.610.99030.0001
Method 20.0003~200Y = 204.83X + 643.880.99180.0003
Method 30.0003~200Y = 194.17X + 613.610.99190.0003
Method 40.002~500Y = 171.42X + 398.510.99050.002
Method 50.018~500Y = 158.86X + 236.210.99130.018
Method 60.25~250Y = 0.5415X + 0.61960.99450.25
Table 6. Summary of ricin detection methods.
Detection MethodRicin Enrichment MethodSample MatrixLODTimeReference
Sandwich-type ELISA based on microwave irradiation and heatAntibody conjugated to 96-well plateFood Samples10 ppb2 h[37]
ELISA and Luminex fluid array assayssdAb conjugated to 96-well plateBuffer1 ng/mL and 64 pg/mLNot reported[38]
Lateral flow devicesAntibody conjugated nitrocellulose membraneCosmetics0.01 μg/mLNot reported[39]
Colloidal immunochromatographic assayAntibody conjugated nitrocellulose membraneBuffer0.1~50 ng/mL10 min[40]
Electrochemiluminescence assayAntibody conjugated to 96-well plateBuffer50 pg/mL2.5 h[41]
Magnetoelastic sensorAntibody conjugated to sensor surfaceWater, blood and serum5 ng/mL3.5 h[42]
Microring resonator arraysdAb conjugated to microring resonator arrayBuffer300 pM15 min[43]
Surface plasmon resonance based on sdAb-QDsdAb conjugated to SPR chipBuffer1 ng/mL and 0.7 ng/mL2~6 min[44]
Antibody-sandwich surface plasmon resonance sensorAntibody conjugated to SPR chipBuffer3 ng/mL<30 min[45]
Liquid-crystal based sensorAntibody conjugated to liquid crystals supported surfacesBuffer10 μg/mL1–2 h[46]
Electrochemical aptamer scaffold biosensorsAptamer conjugated to gold electrode surfaceBuffer0.3~0.1 nMNot reported[47]
Nanoelectrode array biosensor based on carbon nanofiberAntibody or aptamer conjugated to the carbon nanofibers chipsBuffer<1 pM4 h[48]
DNA aptamer and Raman scattering techniqueAptamer conjugated to magnetic particlesBuffer and beverages25 ng/mLNot reported[49]
Immuno-PCRAntibody conjugated to microtitration plateGround beef, milk, and egg0.01~0.1 ng/mLNot reported[50]
Real-time fluorescence PCR of nanoparticle-based bio-barcodeAntibody conjugated to magnetic nanoparticleBuffer1 fg/mLNot reported[51]
Nano LC–MSLactose-immobilized monolithic spin columnHigh protein solution8 ng/mL5 h[52]
Table 7. Detection specificity of ECL immunosensor (n = 5).
ObjectECL Intensity (a.u.)Relative Standard Deviation (%)
Ricin737.8 ± 13.51.8
Abrin5.2 ± 0.58.6
SEB5.6 ± 0.59.8
BSA5.6 ± 0.59.8
River water4.8 ± 0.49.3
Fertilized soil5.2 ± 0.48.6
Butter biscuit5.2 ± 0.48.6
Whole rabbit blood5.6± 0.59.8
PBS buffer5.2 ± 0.48.6
Table 8. Determination of the simulated ricin specimens by ECL immunosensor (n = 4).
SampleAdded (μg/L)Found (μg/L)Recovery Ratio (%)Relative Standard Deviation (%)
River water54.71 ± 0.1594.23.08
Fertilized soil54.58 ± 0.0791.61.46
Butter biscuit54.55 ± 0.1491.12.97
Whole rabbit blood54.54 ± 0.1190.82.38
Table 9. Determination of the simulated ricin specimens by conventional double-antibody sandwich ELISA (n = 4).
SampleAdded (μg/L)Found (μg/L)Recovery Ratio (%)Relative Standard Deviation (%)
River water54.61 ± 0.1292.22.60
Fertilized soil55.77 ± 0.11115.41.91
Butter biscuit54.55 ± 0.0991.01.98
Whole rabbit blood55.96 ± 0.14119.22.35

