Article

A Quantum Cascade Laser-Based Optical Sensor for Continuous Monitoring of Environmental Methane in Dunkirk (France)

1
Laboratoire de Physicochimie de l’Atmosphère, Université du Littoral Côte d’Opale, Dunkerque 59140, France
2
Anhui Institute of Optics and Fine Mechanics, Chinese Academy of Sciences, Hefei 230031, China
3
Centre Commun de Mesures, Université du Littoral Côte d’Opale, Dunkerque 59140, France
4
ONERA, DOTA, BP 80100, Palaiseau cedex 91123, France
*
Author to whom correspondence should be addressed.
Current address: now with Groupe de Spectrom
Sensors 2016, 16(2), 224; https://doi.org/10.3390/s16020224
Submission received: 25 December 2015 / Revised: 31 January 2016 / Accepted: 4 February 2016 / Published: 8 February 2016
(This article belongs to the Special Issue Infrared and THz Sensing and Imaging)

Abstract

:
A room-temperature continuous-wave (CW) quantum cascade laser (QCL)-based methane (CH4) sensor operating in the mid-infrared near 8 μm was developed for continuous measurement of CH4 concentrations in ambient air. The well-isolated absorption line (7F2,4 ← 8F1,2) of the ν4 fundamental band of CH4 located at 1255.0004 cm−1 was used for optical measurement of CH4 concentration by direct absorption in a White-type multipass cell with an effective path-length of 175 m. A 1σ (SNR = 1) detection limit of 33.3 ppb in 218 s was achieved with a measurement precision of 1.13%. The developed sensor was deployed in a campaign of measurements of time series CH4 concentration on a site near a suburban traffic road in Dunkirk (France) from 9 to 22 January 2013. An episode of high CH4 concentration of up to ~3 ppm has been observed and analyzed with the help of meteorological parameters combined with back trajectory calculation using the Hybrid Single Particle Lagrangian Integrated Trajectory (HYSPLIT) model of NOAA.

Graphical Abstract

1. Introduction

Methane (CH4), as the second most important greenhouse gas after carbon dioxide (CO2), contributes to the increase in global warming with a lifetime of about 12 years [1,2]. Its concentration in the atmosphere has increased since the pre-industrial time from 700 ppb (parts per billion) to 1810 ppb [3]. Methane is produced naturally by anaerobic decomposition of organic materials as well as emissions from anthropogenic sources like ruminants, rice agriculture, biomass burning, fossil fuels and landfills [4,5]. CH4 is also the main constituent of natural (82%) and liquefied natural gas (95%) used nowadays in thermoelectric plants all over the world. Methane oxidation in the tropospheric and stratospheric layers is a key-reaction that affects the atmospheric concentration of the hydroxyl (OH) radicals and hence the oxidative capacity of the atmosphere. At the regional level, a liquefied natural gas (LNG) terminal located in Dunkirk (France) will be in operation in 2016. Risks of methane leakage from the storage tanks, from the pipelines during the transportation, and from burning methane in excess in flares when performing new filling cycles in the reservoirs are not negligible. Reliable, fast and high-precision continuous monitoring of CH4 concentration is therefore highly required for local industrial security management in this LNG installation context, but also for monitoring of surrounding environmental changes to well understand the environmental impact of additional CH4 emissions from natural gas production, from distribution and end use. Moreover, continuous measurements may give useful new insights into the global CH4 budget on a regional scale.
Recommended by World Meteorological Organization [6], atmospheric methane concentration is typically measured by gas chromatography-flame ionization detection (GC/FID). CH4 in ambient air is separated using chromatographic scheme prior to flame ionization detection. The measurement is quasi-continuous (~15 min per datum) due to the sample preparation by the chromatographic separation processes.
Compared to the conventional GC/FID method, optical methods based on spectroscopic techniques [7,8] offer the capability of fast and continuous monitoring of environmental gaseous mixture without sample preparation, which makes the optical sensing immune to chemical interference/contamination due to sample preparation and conversion (hence high specificity). Nowadays, optical gas sensors based on newly emerging infrared lasers allows one to probe strong fundamental rotational-vibrational transitions of the target molecules and thus to achieve very high measurement sensitivity (detection limit down to ppb and parts per trillion (ppt) levels). These field deployable optical gas sensors with a reduction in size and cost have become ease-to-use and can be operated by non-technical personnel [9]. Various spectroscopic techniques have been developed in order to achieve high detection sensitivity for CH4 detection, such as photoacoustic spectroscopy (PAS) or quartz-enhanced photoacoustic spectroscopy (QEPAS) [10,11,12], open-path differential optical path absorption spectroscopy (DOAS) [13] and long-path absorption spectroscopy using a multipass cell [14,15,16] or a high-finesse optical cavity as in cavity ring-down spectroscopy (CRDS) [17] and off-axis integrated cavity output spectroscopy (OA-ICOS) [18].
In this paper, we report on the development and deployment of a continuous-wave (CW) quantum cascade laser (QCL)-based CH4 sensor operating near 8 µm. The objective of the present work is to develop an optical sensor based on direct multipass absorption spectroscopy capable of performing in situ continuous measurement of CH4 absolute concentration in the environment, which could provide a local background reference of CH4 emission level prior to the installation of a new LNG terminal in Dunkirk in 2016. The choice of direct absorption spectroscopic scheme makes the sensor platform self-calibrated (unlike PAS or QEPAS requiring additional calibration). The use of a multipass-based long-path absorption approach operating at optimal gas pressure (to enhance measurement selectivity) permits highly sensitive absolute concentration measurement (unlike DOAS that measures integrated concentration over an open path) while keeping the sensor system simple and attractive for applications in harsh environment (advantageous over cavity enhanced setups where protecting the high-reflectivity cavity mirrors against contamination by dust is always a serious issue to be addressed).

2. Experimental Details

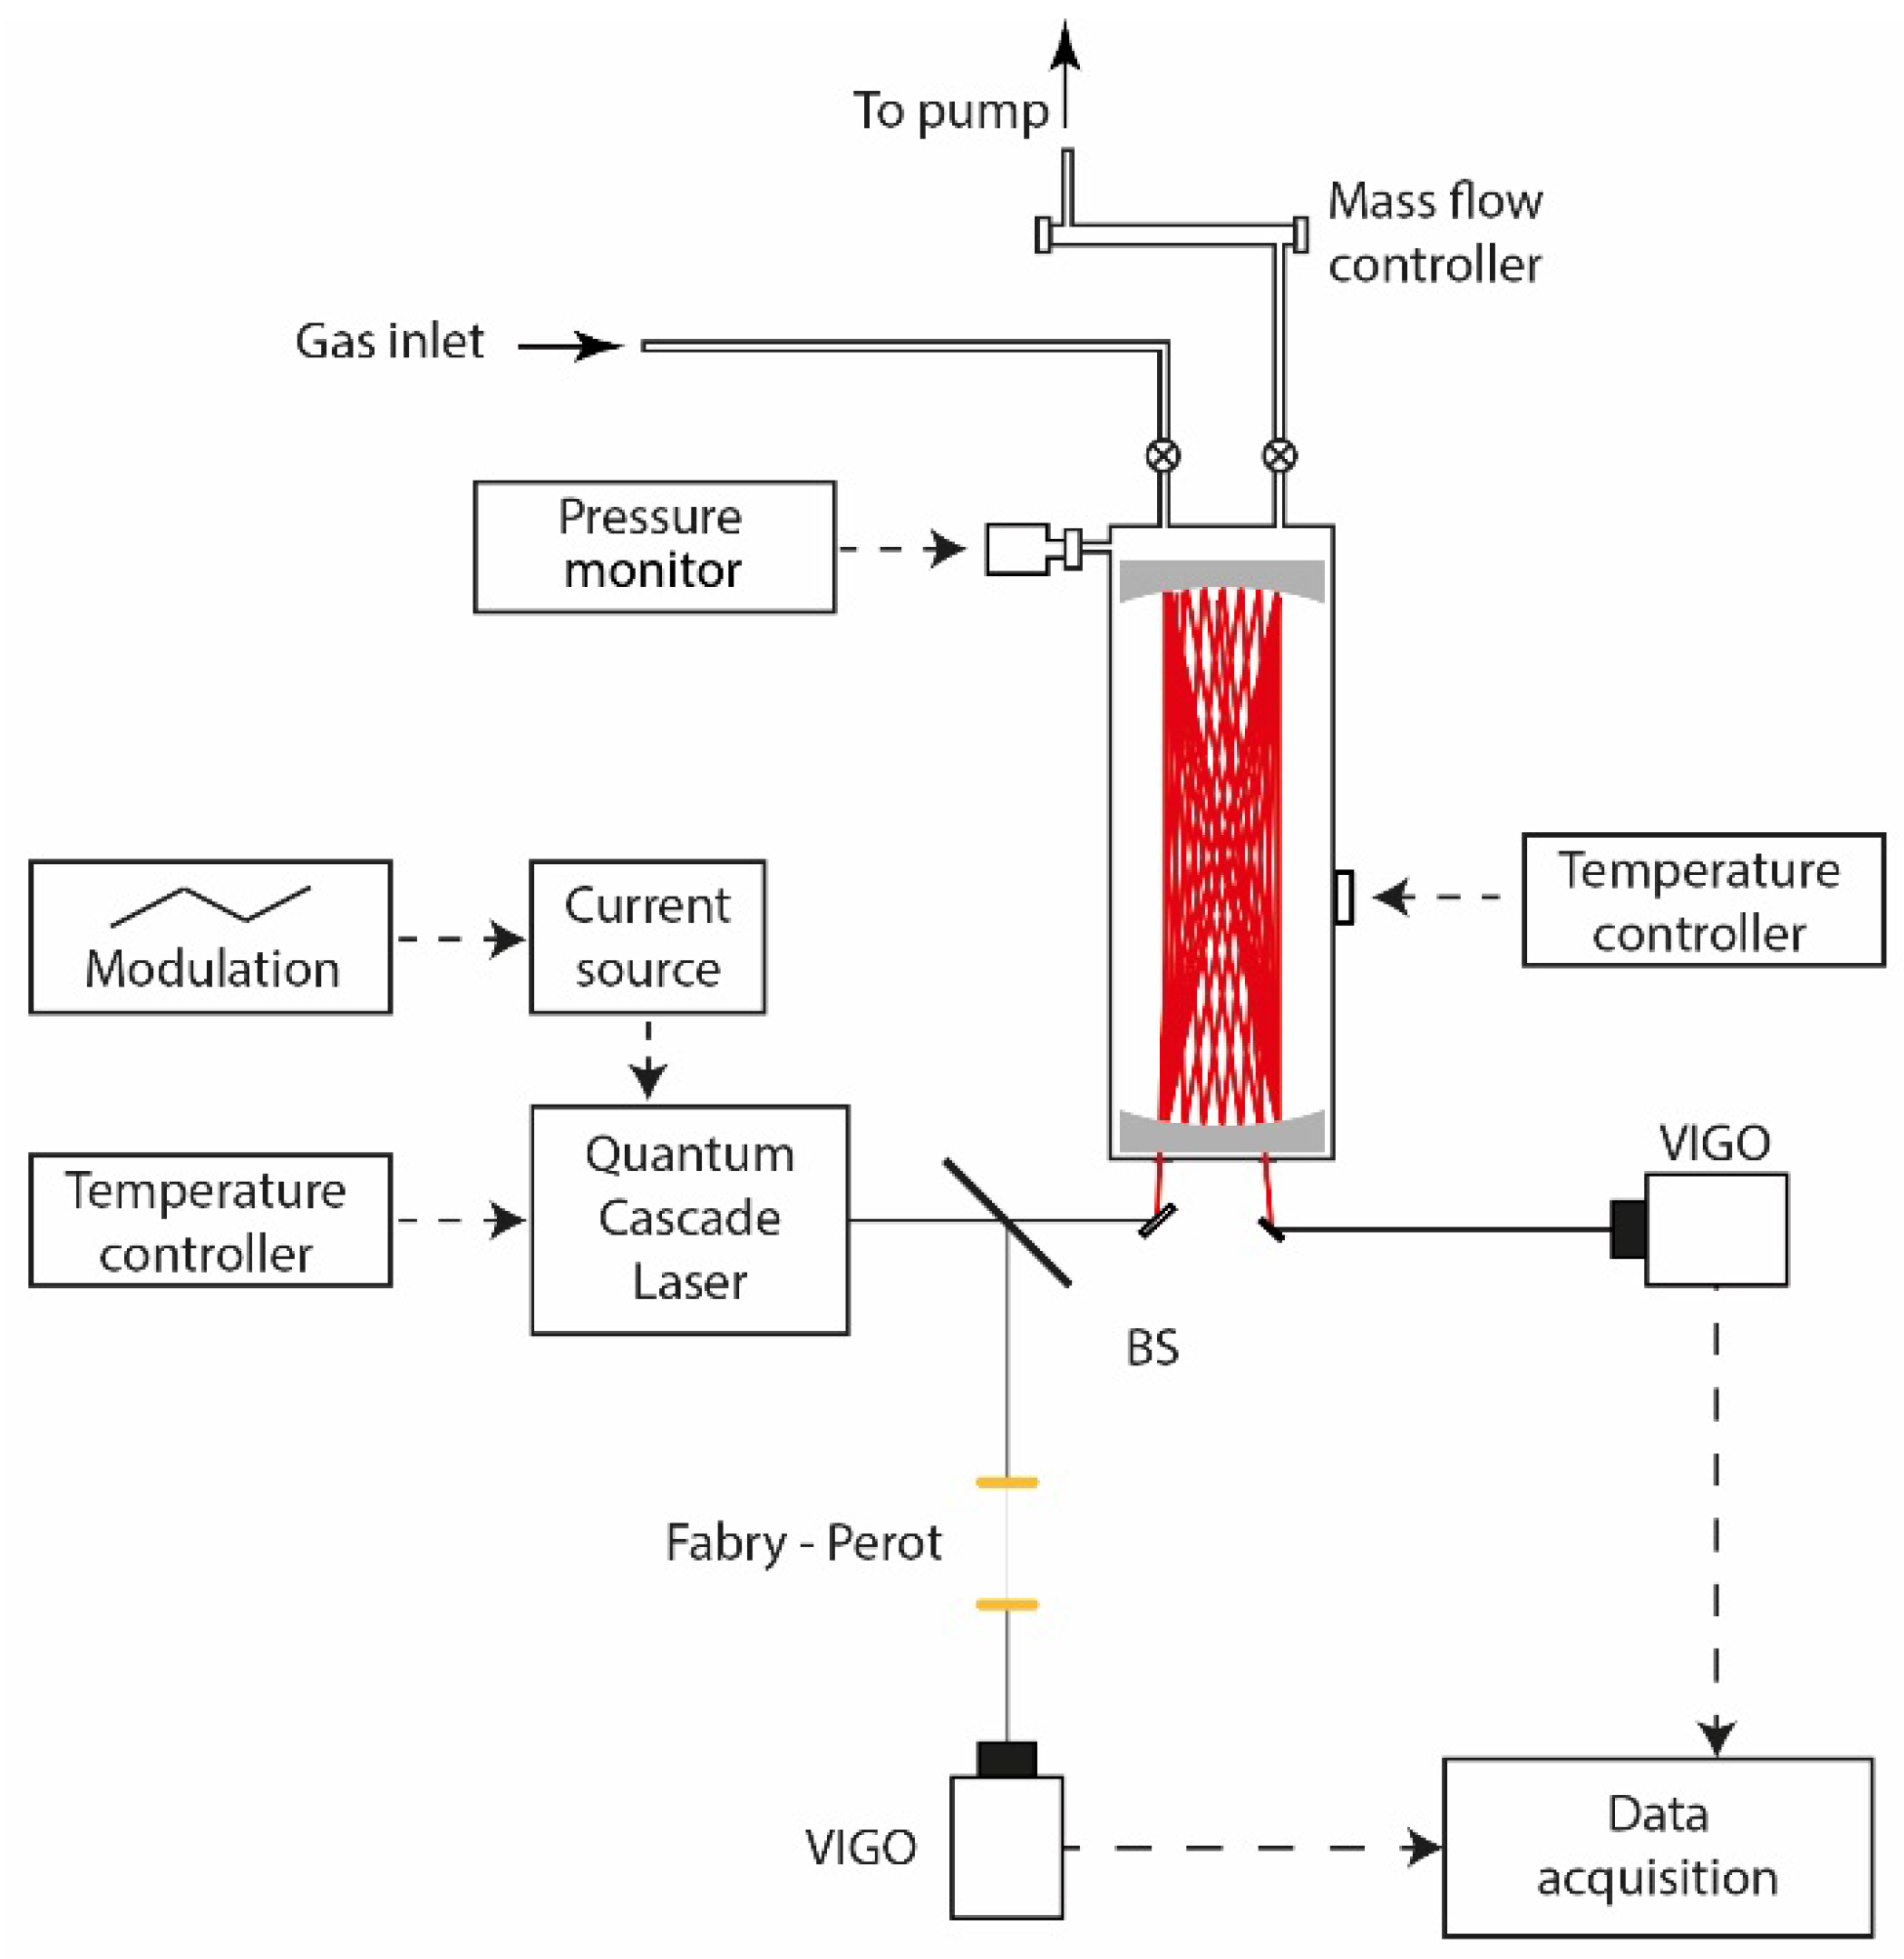
2.1. Experimental Setup

The experimental setup developed in the present work is depicted in Figure 1. The used distributed feedback quantum cascade laser (DFB-QCL, DQ7- M776H, Maxion Technologies, Inc., Jessup, MD, USA) is tunable from 1252.1 to 1257.1 cm−1 (at ~8 µm) by adjustment of the laser temperature and current. The laser operates at room temperature in continuous mode with an output power of 35 mW when powered at 8.895 V and 333 mA. Its spectral coverage allows for optical sensing of multi-species: water vapor (H2O), methane (CH4), nitrous acid (HONO) and nitrous oxide (N2O). Fast laser frequency tuning at the kHz-scan-rate per spectrum can be achieved using a triangular current modulation, which is favorable for applications where high temporal resolution is required, as in flux measurements.
As shown in Figure 1, a beam splitter (10/90) was used to divide the incident QCL beam into two parts. The 10% was sent to a Fabry-Perot etalon for frequency metrology of the DFB-QCL. The main part (90%) was directed into a White-type multipass cell to enhance the measurement sensitivity by long optical path-length absorption spectroscopy.
Figure 1. Experimental setup used for ambient CH4 monitoring (BS: beam splitter).
Sensors 16 00224 g001
The multipass cell (107-V Infrared Analysis, Inc., Anaheim, CA, USA) is made of borosilicate glass with a volume of about 25 L. The effective optical path-length Leff can be adjusted from 1.6 to 175 m by changing the orientation of the multipass cell mirrors. The emerging laser beam was focused onto a thermoelectrically cooled infrared photovoltaic detector (VIGO PVI 4-TE-10.6) with a detectivity of 2 × 109 cm·Hz1/2/W and a responsivity of 0.7 A/W. A high-speed digital oscilloscope (LeCroy WaveSurfer 104 MXs 1 GHz Oscilloscope 5 GS/s, Teledyne Technologies Inc., Thousand Oaks, CA, USA), controlled with a LabVIEW program, was used for spectral data acquisition. Post processing of the recorded data was carried out to retrieve CH4 concentration based on the Beer-Lambert law.
The line width of the QCL emission, playing an important role in spectral profile fit for gas concentration retrieval, was experimentally investigated. Methane samples (3000 ± 60 ppm) were injected into the multipass absorption cell at different pressures, and the corresponding absorption spectra were recorded. The spectra were fitted to a Voigt line profile in order to determine the Lorentzian line width wL (Full Width at Half Maximum-FWHM). The plot of the Lorentzian line width as a function of the pressure, as shown in Figure 2a, allows us to deduce the laser emission line width of ~10 MHz (at the pressure equal to zero) [19].
Outdoor environmental air was sampled from the campaign site and drawn to the inlet of the multipass cell via a Teflon tube. The outlet of the cell was connected to a primary pumping system to maintain a regular sampling gas flow at a constant rate of 41.6 L/min, resulting in a gas residence time of about 36 s. Temperature and pressure of the gas sample inside the multipass cell were typically set at 30 °C and 42 mbar (optimized as a comprise between spectral selectivity and detection sensitivity), respectively. The temperature was controlled by using a heating jacket with a silicone-based heating blanket which is controlled by thermocouple to heat the cell chamber uniformly. A digital temperature control unit (Infrared Analysis, Inc.) maintains temperature with a precision of ±0.01 °C.

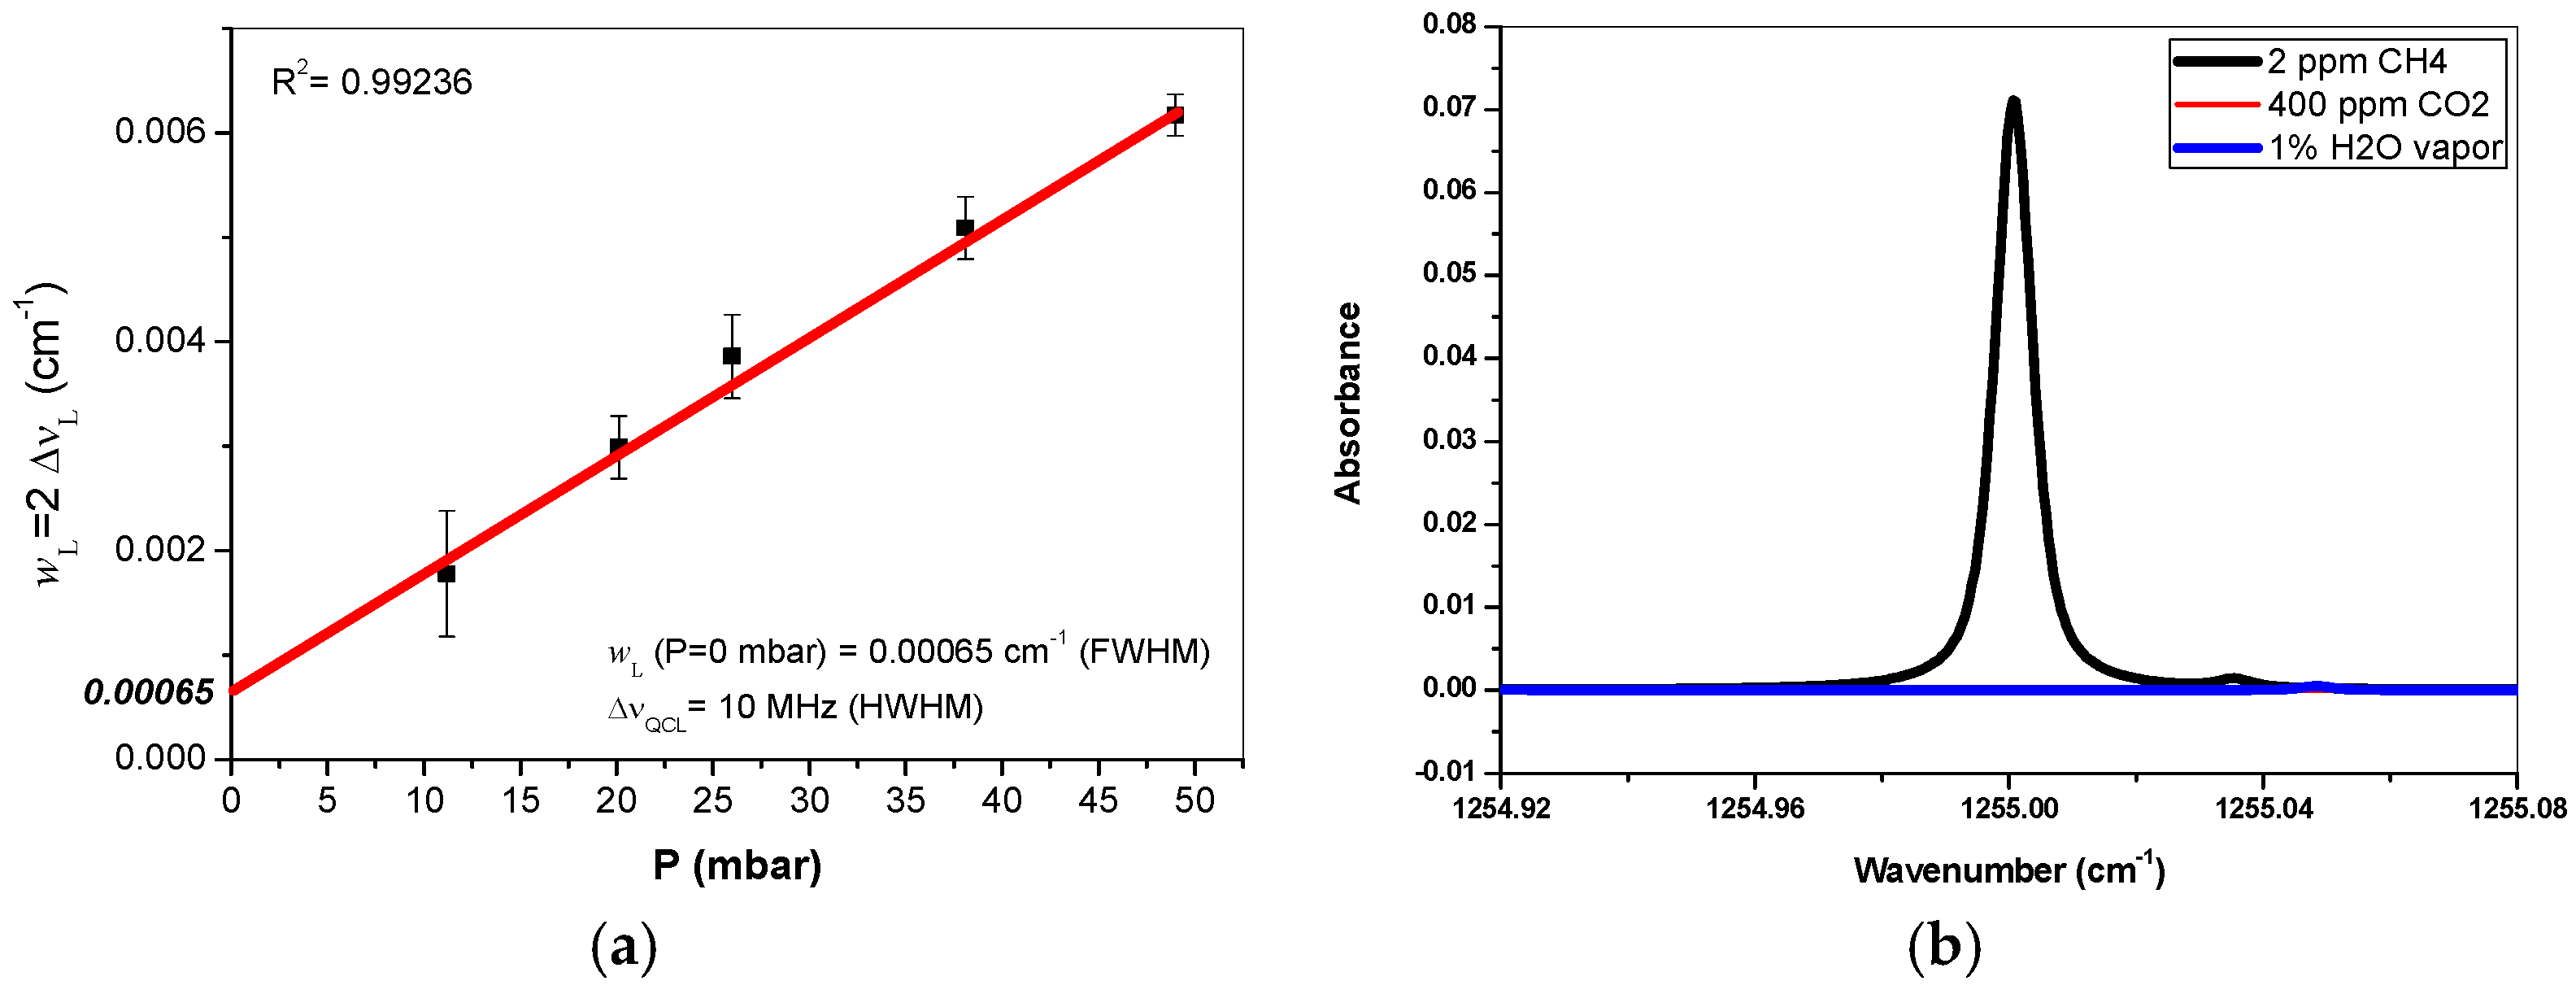
2.2. Selection of Methane Absorption Line for Sensitive and Selective Monitoring

Selection of suitable absorption lines is crucial for spectroscopic monitoring of trace gas. The absorption line(s) should be as strong as possible and well isolated as well in order to avoid any spectral interference from itself or from other abundant atmospheric species (for instance CO2, H2O vapor) present in the atmosphere. Figure 2b shows a simulated spectrum of the selected CH4 absorption line (the transition 7F2,4 ← 8F1,2 of the ν4 fundamental band, centered at 1255.0004 cm−1 with a line intensity of 2.07 × 10⁻²⁰ cm·molecule−1) [20]. The simulation was made with 2 ppm CH4 in an absorption cell with an effective optical path-length of Leff = 175 m at 40 mbar. Potential interferences from ambient CO2 (at 400 ppm) and 1% H2O vapor are taken into account in the simulation. Though the absorption intensity of the selected CH4 line is not the strongest, it is strong enough for detection of atmospheric CH4 at its natural concentration level (~1.7 ppm). As can be seen, this line is free of interference from the absorptions of CO2 and H2O. It is a good tradeoff between the required sensitivity and specificity. In the present work, this methane absorption line located at 1255.0004 cm−1 was used to monitor environmental CH4 by direct absorption spectroscopy in a Leff = 175 m long multipass cell.
Figure 2. (a) Plot of CH4 absorption line width vs. pressure for determination of the DFB-QCL emission line width; (b) Simulation of 2 ppm CH4 absorption spectrum around 1225 cm−1 at 40 mbar in a multipass cell with 175 m effective optical path-length.
Sensors 16 00224 g002

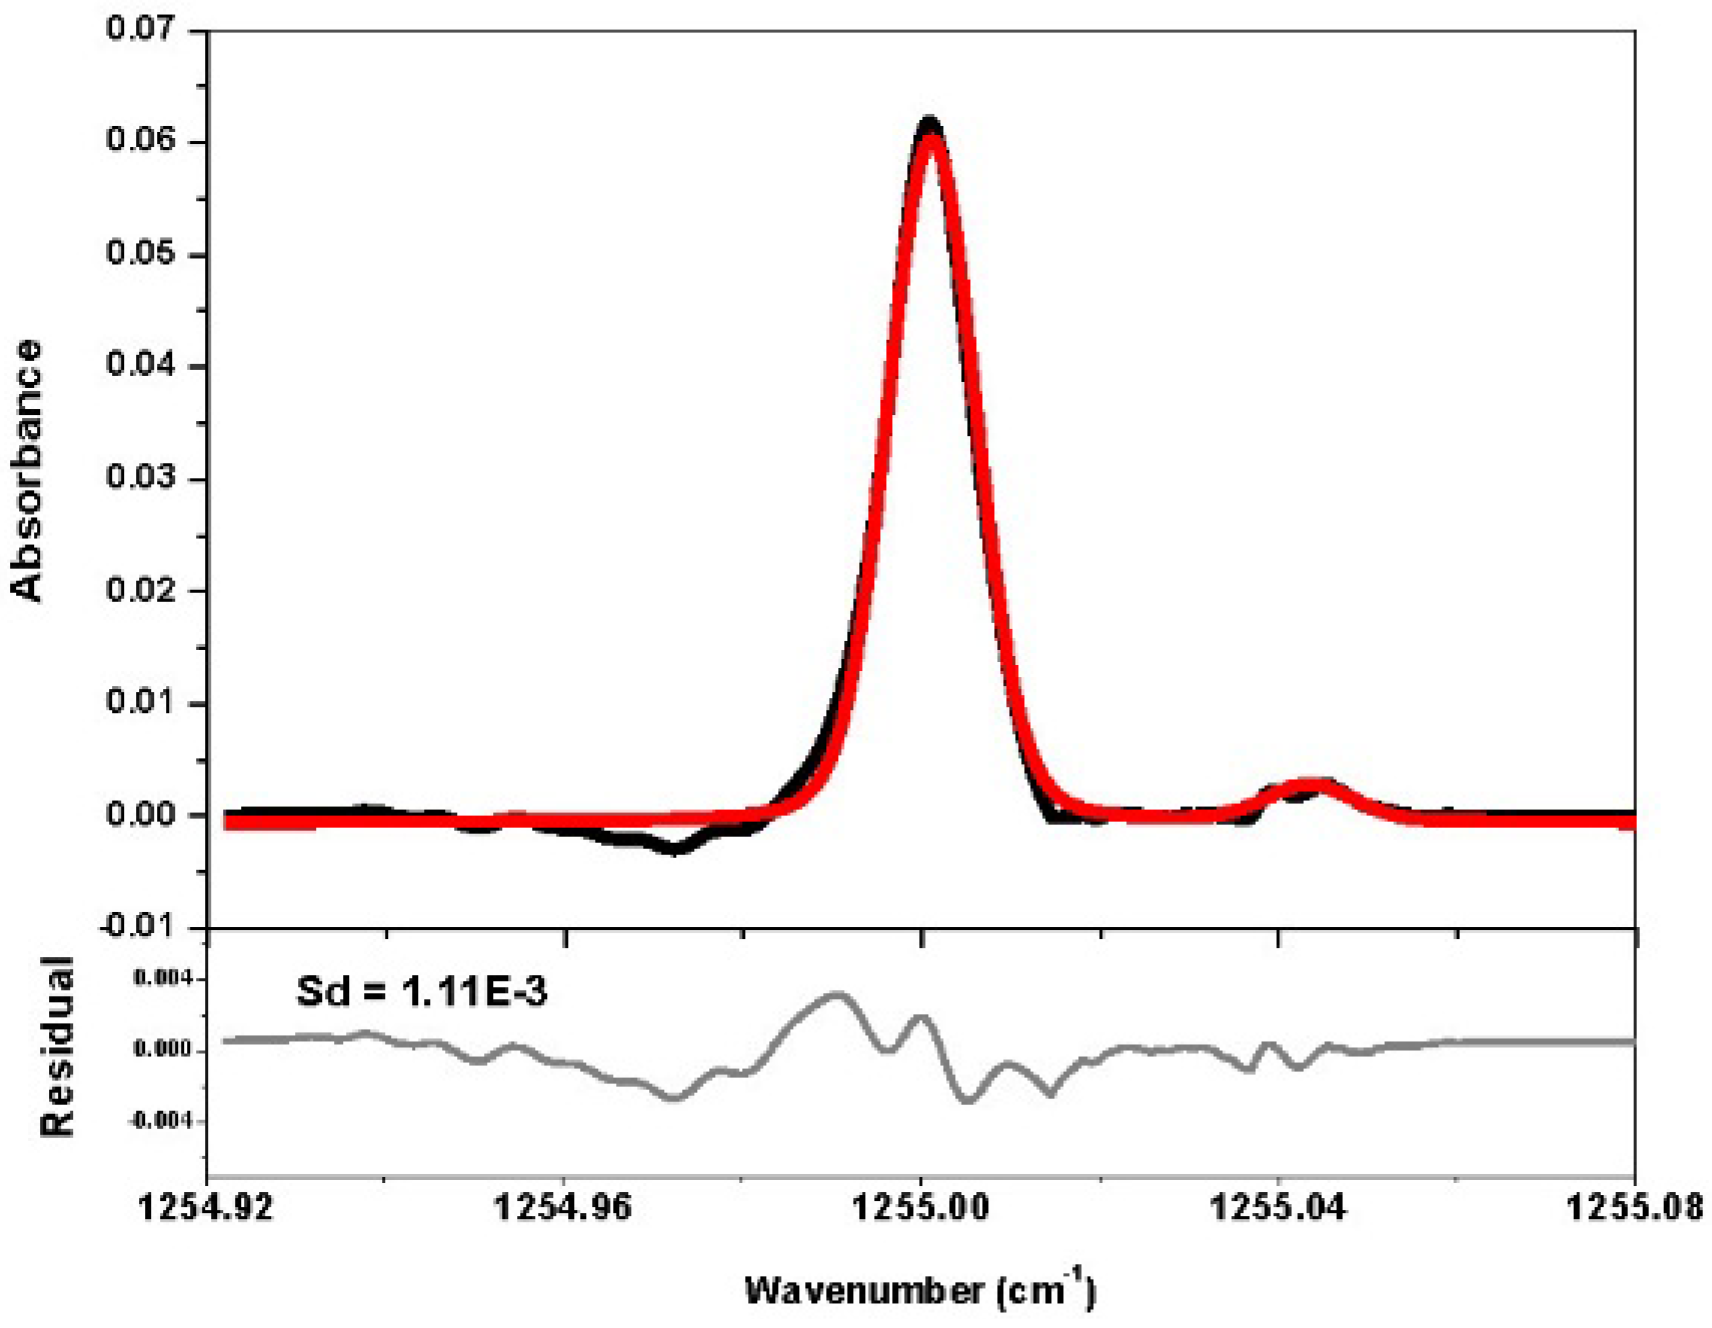
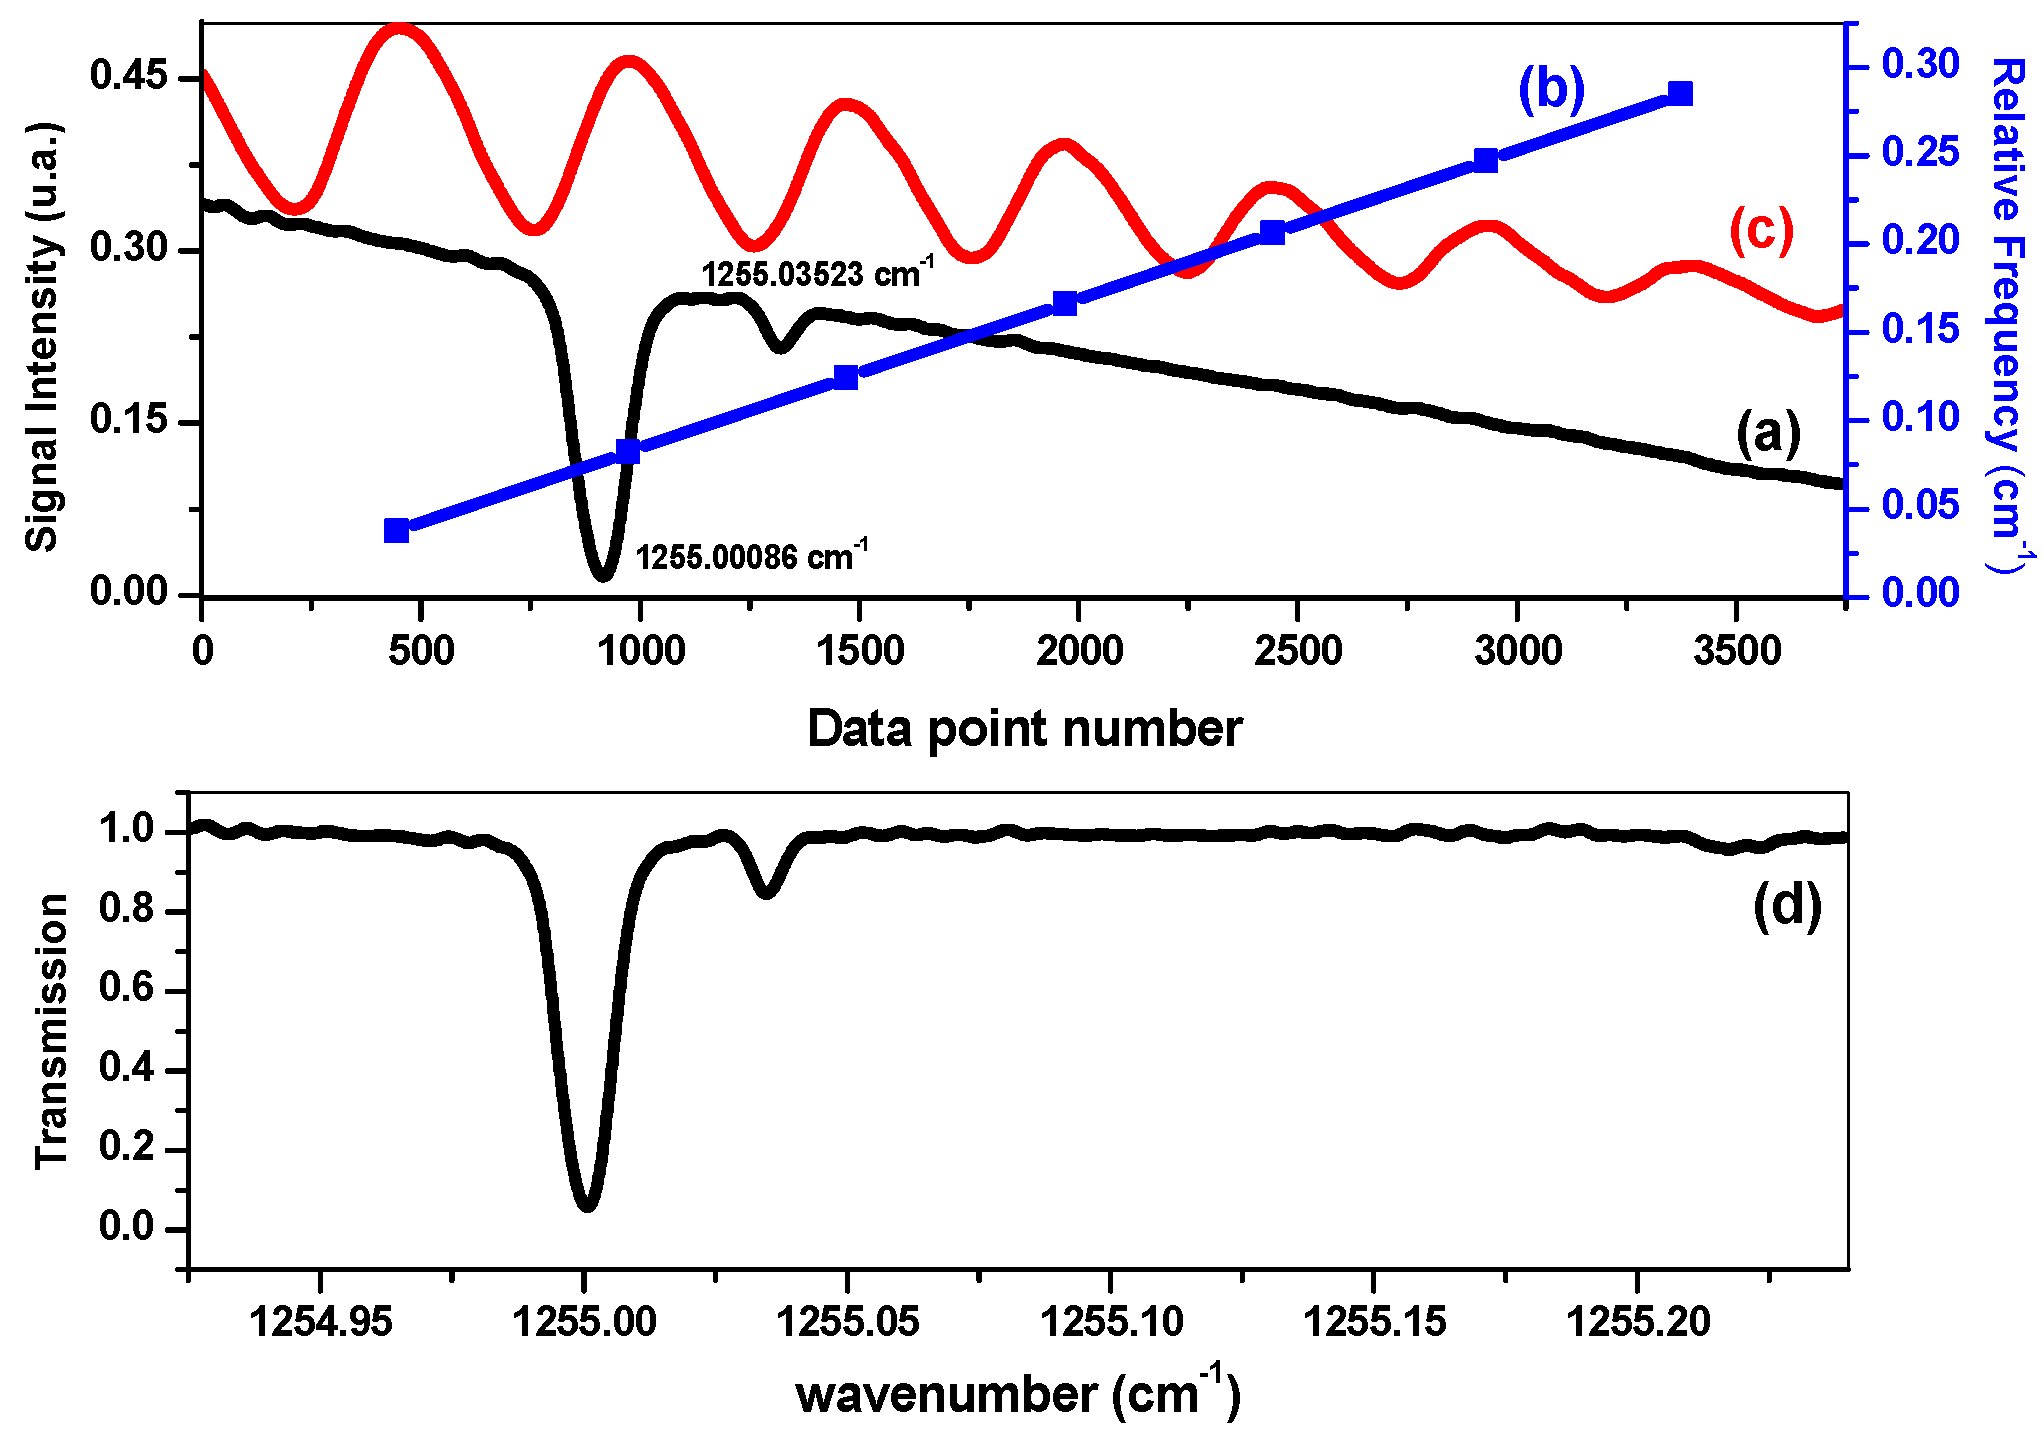
2.3. Frequency Metrology and Absorption Spectrum Retrieval

The CH4 absorption signal was recorded as a function of the acquisition data number ((a) in Figure 3) during the scan of the QCL frequency by laser current tuning.
Figure 3. Absorption signal of 3000 ppm CH4 at 4.62 mbar (a); converted into an absorption spectrum (d) using the relative frequency calibration curve (b) which allows one to convert “data point number” into “wavenumber” by means of the interference fringes resulting from a Fabry-Perot interferometer with a FSR of ~0.033 cm−1 (c).
Sensors 16 00224 g003
In order to convert this signal into an absorption spectrum ((d) in Figure 3), interference fringes from a Fabry-Perot interferometer were recorded ((c) in Figure 3) and used to determine the relationship between the data number and the related frequency ((b) in Figure 3). The absolute frequency was determined using the CH4 absorption positions given in the HITRAN database [20]. The interferometer is built with two high transmission ZnSe plates (~10% reflectivity at 8 µm) separated by 15 cm, resulting in a free spectral range (FSR) of ~0.033 cm−1.

2.4. Concentration Retrieval

Retrieval of trace gas concentration from the measured absorption spectra is based on the Beer-Lambert law [21]:
I ( ν ) = I 0 exp ( C L σ ( ν ) ) = I 0 exp ( A ( ν ) )
and:
A ( ν ) = l n ( I 0 I ( ν ) ) = L C σ ( ν )
where I0(ν) and I(ν) are the transmitted laser intensities without and with target gas molecules in the absorption cell, respectively. L is the effective optical path-length in (cm), C is the gas-molecule concentration in (molecule/cm3), A(ν) is the absorbance, and σ(ν) in (cm2/molecule) is the frequency-dependent absorption cross section of the target gas molecule.
Integral absorbance AI of the absorbance A(ν), in (cm−1), over all the scanned spectral range can be written as:
A I = A ( ν ) d ν = L C σ ( ν ) d ν
where σ ( ν ) d ν = S , in (cm/molecule), is the absorption line intensity. The concentration of the target gas molecule χ[ppm] in [ppm] (parts per million) can be expressed as:
χ [ p p m ] = C N ( T , P ) × 10 6 = Α I S L N ( T , P ) × 10 6
with N the total molecules number per unit volume (molecules/cm3) at pressure P and temperature T:
N ( T , P ) = N L P P 0 T 0 T
where NL is the Loschmidt constant (2.68678 × 10¹⁹ molecules/cm3), P0 and T0 are the pressure and the temperature at standard conditions (1013.25 mbar and 273.15 K) respectively.

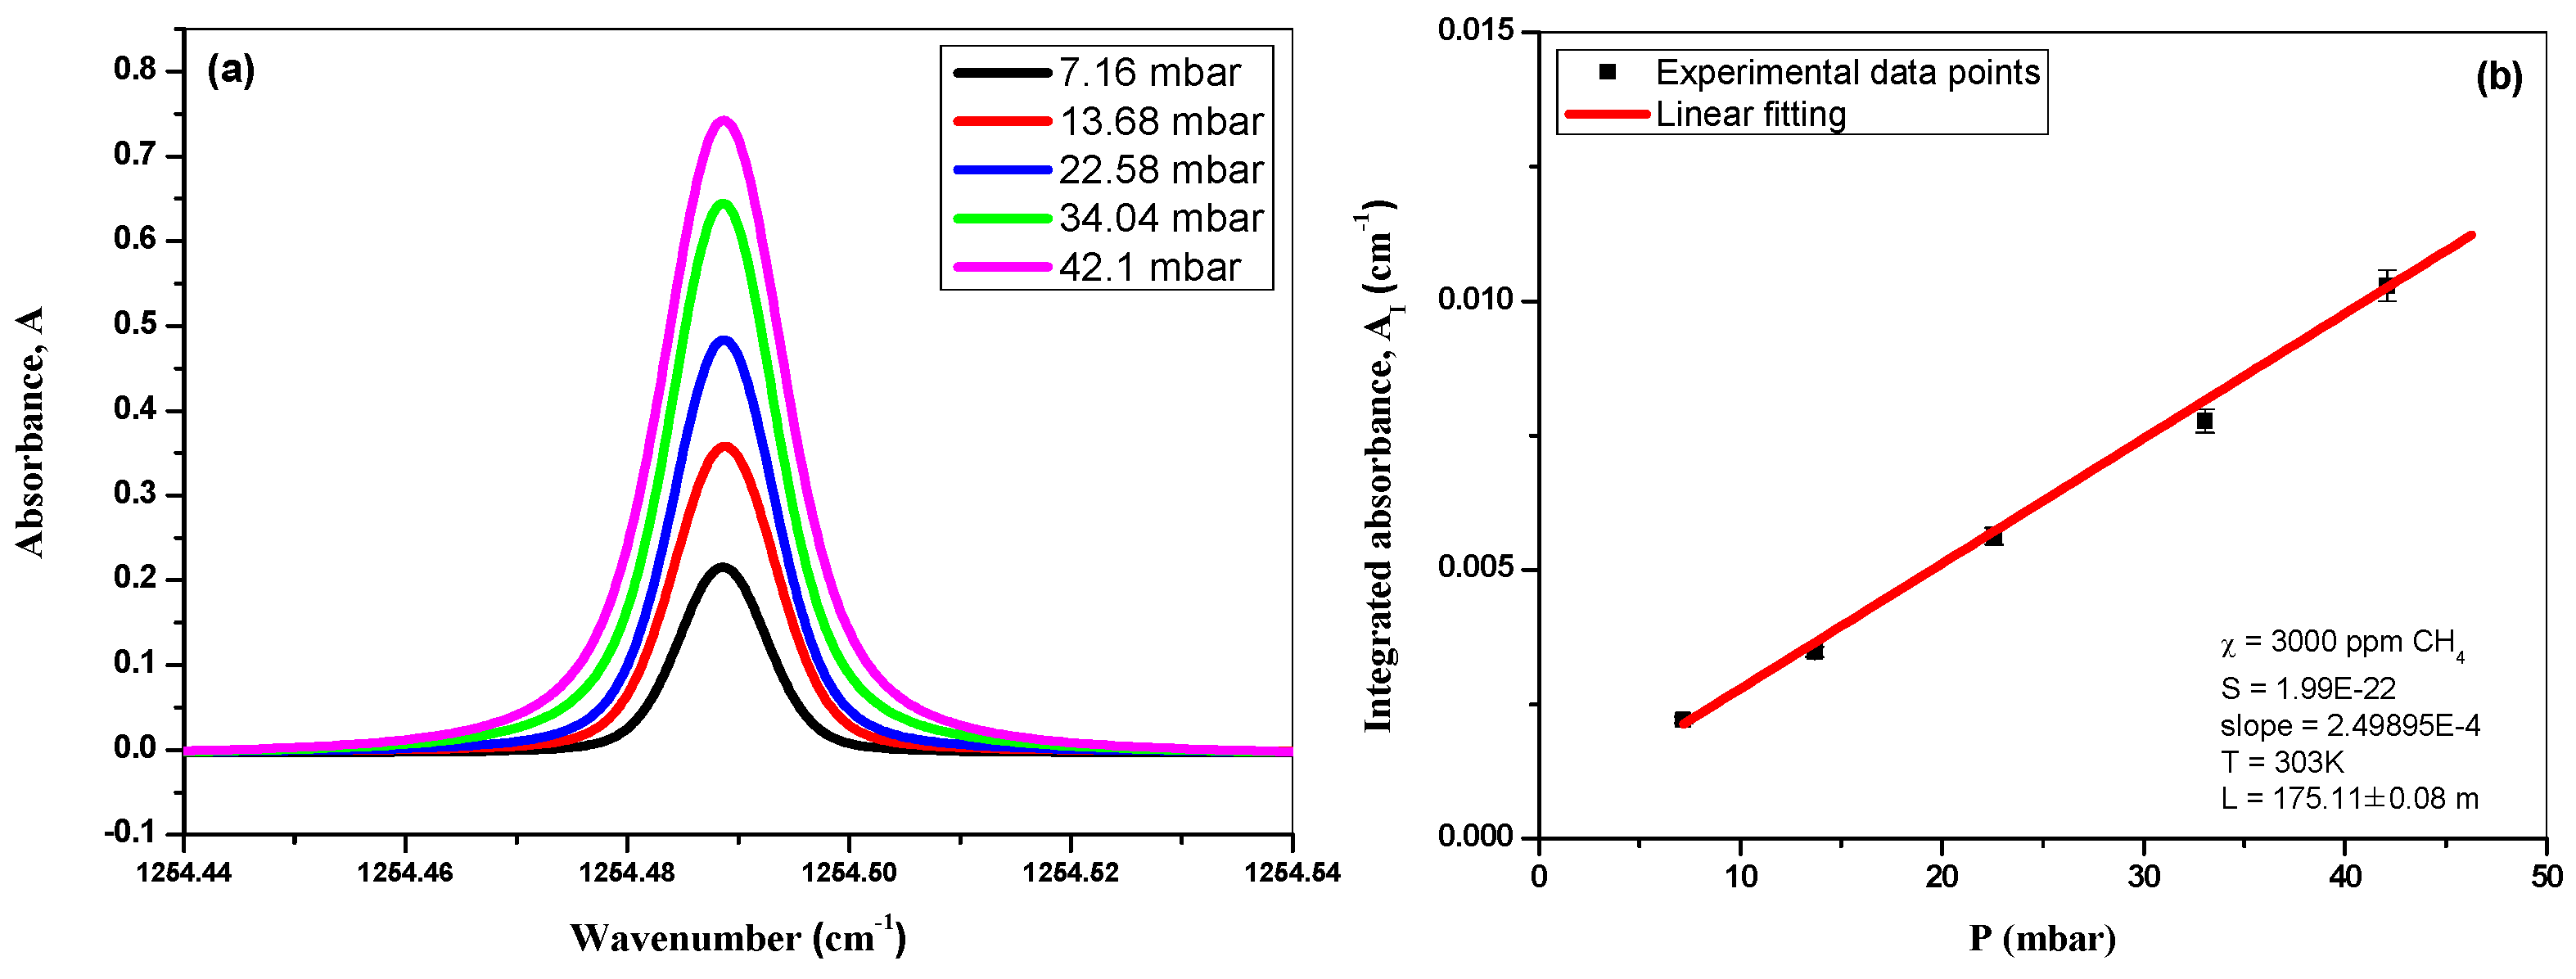
2.5. Measurement Accuracy

As shown in Equation (4), the accuracy of the concentration determination strongly depends on the accuracy of the optical absorption length L, the absorption line intensity S and the quality of the spectra recorded (i.e., signal-to-noise ratio, SNR).
In the present work, absorption spectra of 3000 ppm CH4 located at 1254.4887 cm−1 (6F3 ← 7F1) were recorded at different pressures (Figure 4a) for accurate determination of the effective absorption path-length Leff:
L e f f ( c m ) = A I P × P 0 T χ S N L T 0 × 10 6
Figure 4. (a) 3000 ppm methane absorption spectra recorded at different pressures; (b) Plot of the integrated absorbance vs. pressure P, associated with a linear fit (corresponding to the AI/P ratio).
Sensors 16 00224 g004
Based on the results shown in Figure 4b, an effective path-length of Leff = 175.11 ± 0.08 m was found. The corresponding uncertainty was estimated to be 28 ppb due to the uncertainty in Leff. The total uncertainty on the concentration value deduced from the spectroscopic measurement is about 5.1% which is directly related to the uncertainties in the Voigt profile fitting (ΔAI < 1%) depending on the SNR of the spectra, in the line intensity reported in the HITRAN database (ΔS < 5%), in ΔLeff (= 0.05%), in the values of pressure (ΔP = 0.2%) and temperature (ΔT = 0.03%).

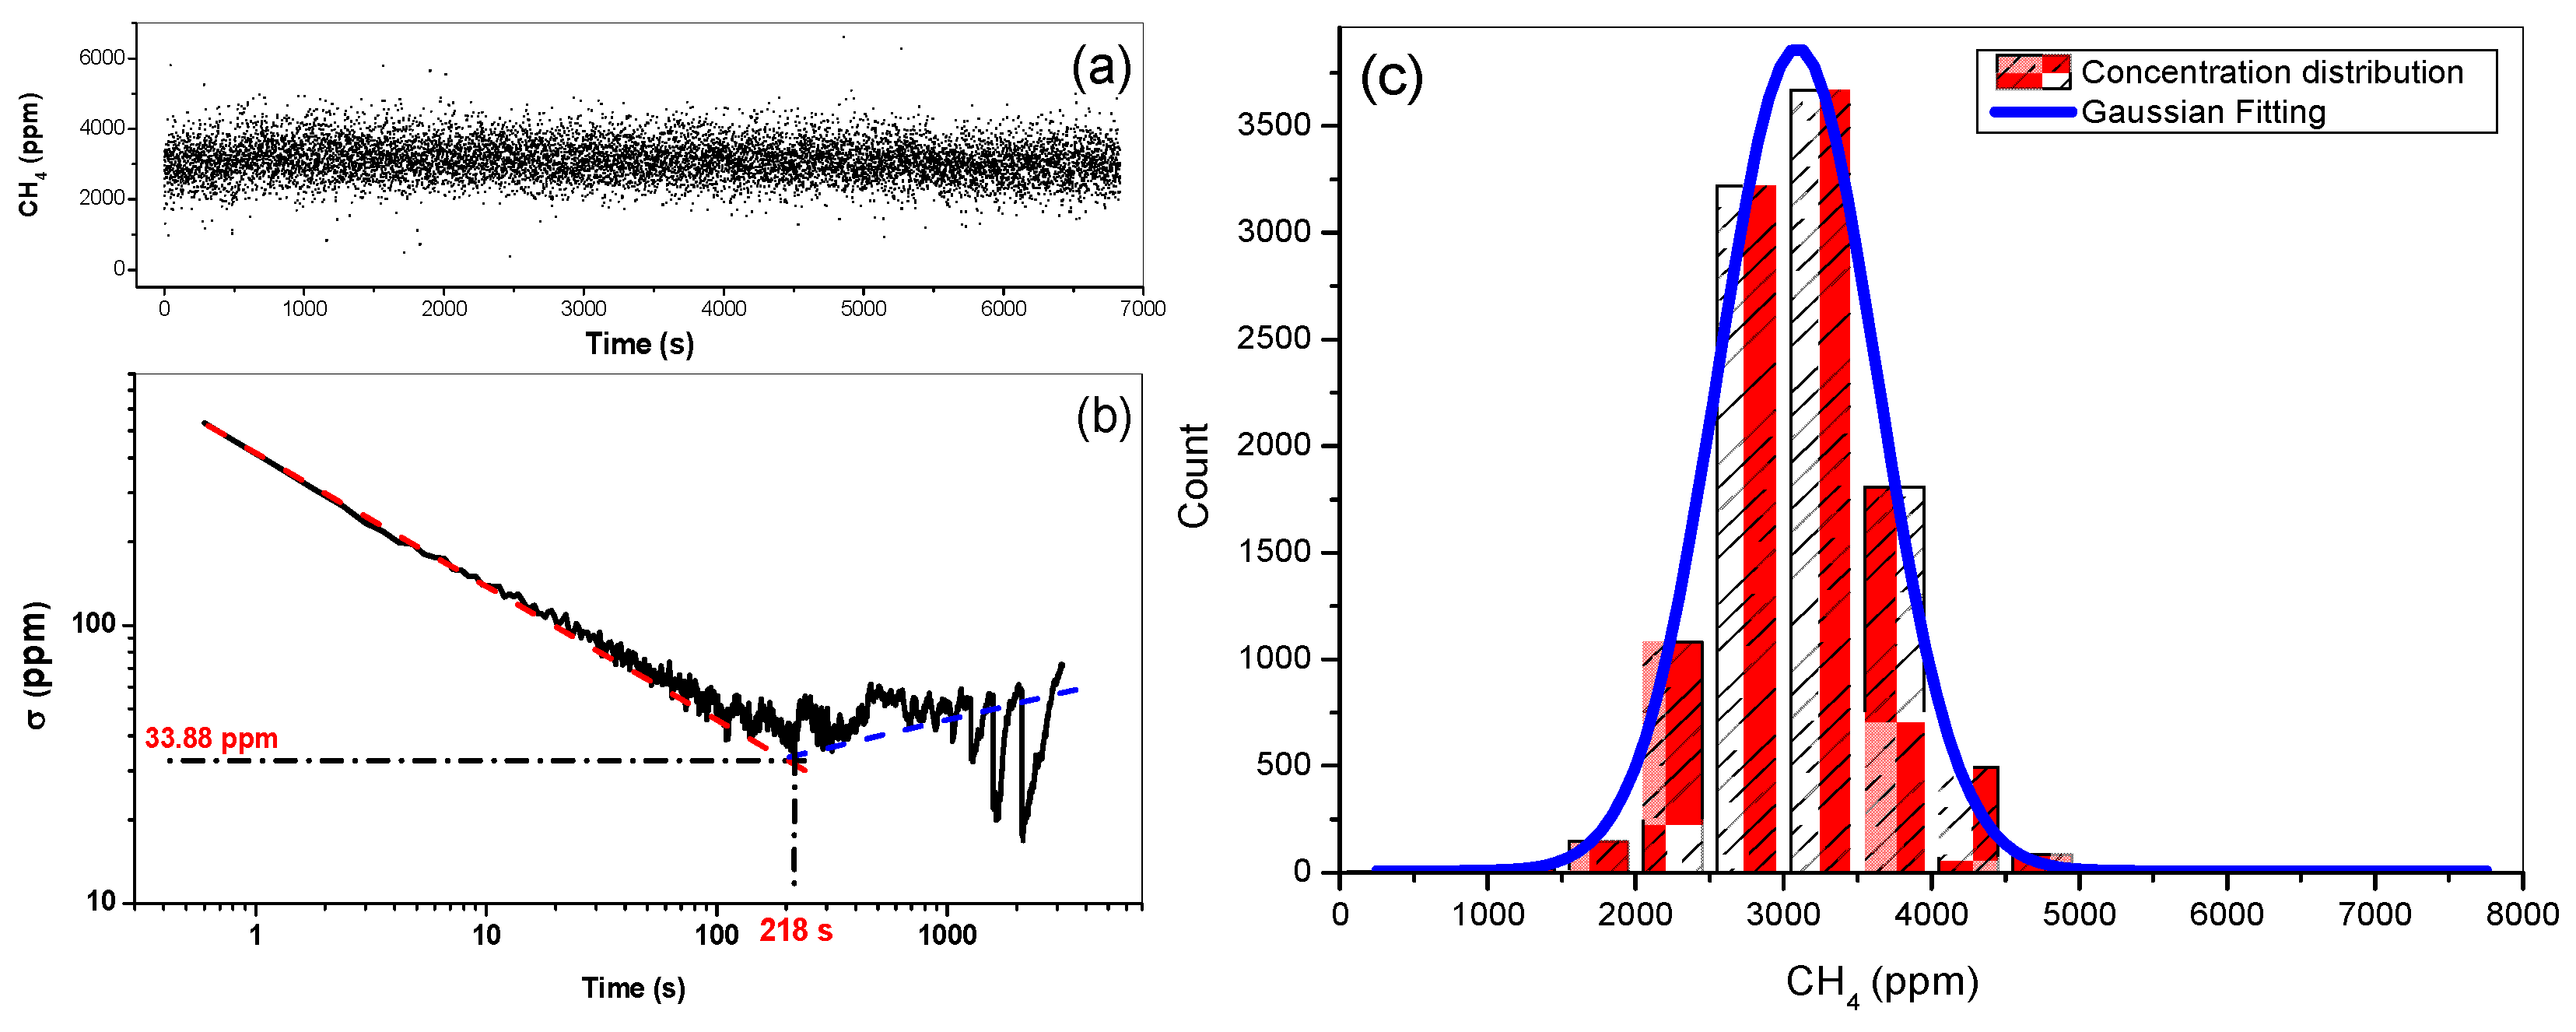
2.6. Measurement Precision

Conventional data averaging techniques were used to reduce white noise in order to enhance the SNR in the recorded spectral data. Laser frequency was scanned over 0.2 cm−1 around 1254.5 cm−1 at a relatively high rate of 2.5 kHz. Allan variance analysis was performed [22,23,24,25,26] to determine the optimal averaging time. Time-series measurements of 3000 ppm CH4 absorption spectra were carried out for the Allan variance study. Based on 10,540 consecutive 0.65-s recorded CH4 spectra (Figure 5a), an Allan variance σ2 was calculated as a function of the averaging time [23] and the Allan deviation σ is plotted in Figure 5b. As can be observed in Figure 5b, the Allan deviation curve (black), represented in logarithmic scale, shows two different behaviors. At first, a linear decay part (red dashed line) indicates linear decrease in deviation with the averaged number of the data, i.e., efficient white noise reduction and hence the improvement in the measurement precision. After that, the instabilities of the instrumental system nevertheless counterbalance the noise reduction given by average and the deviation increases, as shown in blue dashed line.
Figure 5. (a) Time series measurements of CH4 concentration; (b) Allan deviation plot; (c) Histogram showing the distribution of the methane concentration retrieved from 10,540 absorption spectra recorded with 0.65-s integration time at ambient temperature and at a pressure of 42 mbar.
Sensors 16 00224 g005
The optimal data averaging time for the present QCL sensor was found to be about 218 s. Under this optimal averaging condition, the σ value, corresponding to the measurement precision, was about 33.88 ppm, leading to a relative uncertainty in the measurement precision of 1.13%. The distribution histogram of the measured concentrations is plotted in Figure 5c and fitted to a Gaussian distribution function (blue curve), the most frequent concentration of 3092.82 ± 6.31 ppm was deduced from the highest counting rate of 3600 times. Compared to the manufactured concentration of 3000 ± 60 ppm, the discrepancy between our measurement and the supplier’s specific value is about 3.0%, which is within the measurement uncertainty of 5.1% as discussed above in Section 2.5.
Figure 6 shows an experimental absorption spectrum of ambient CH4. With 750 spectra averages over 218 s, the concentration was retrieved to be (1870 ± 16) ppb with a 1σ detection limit of about 33.3 ppb.
Figure 6. Upper panel: Absorption spectrum of CH4 (black curve) in ambient air (750 averaged spectra over 218 s) and Voigt profile fitting (red) to the experimental absorption line. Lower panel: Fit residual.
Sensors 16 00224 g006

3. Continuous Monitoring of CH4 at a Suburban Site in Dunkirk-France

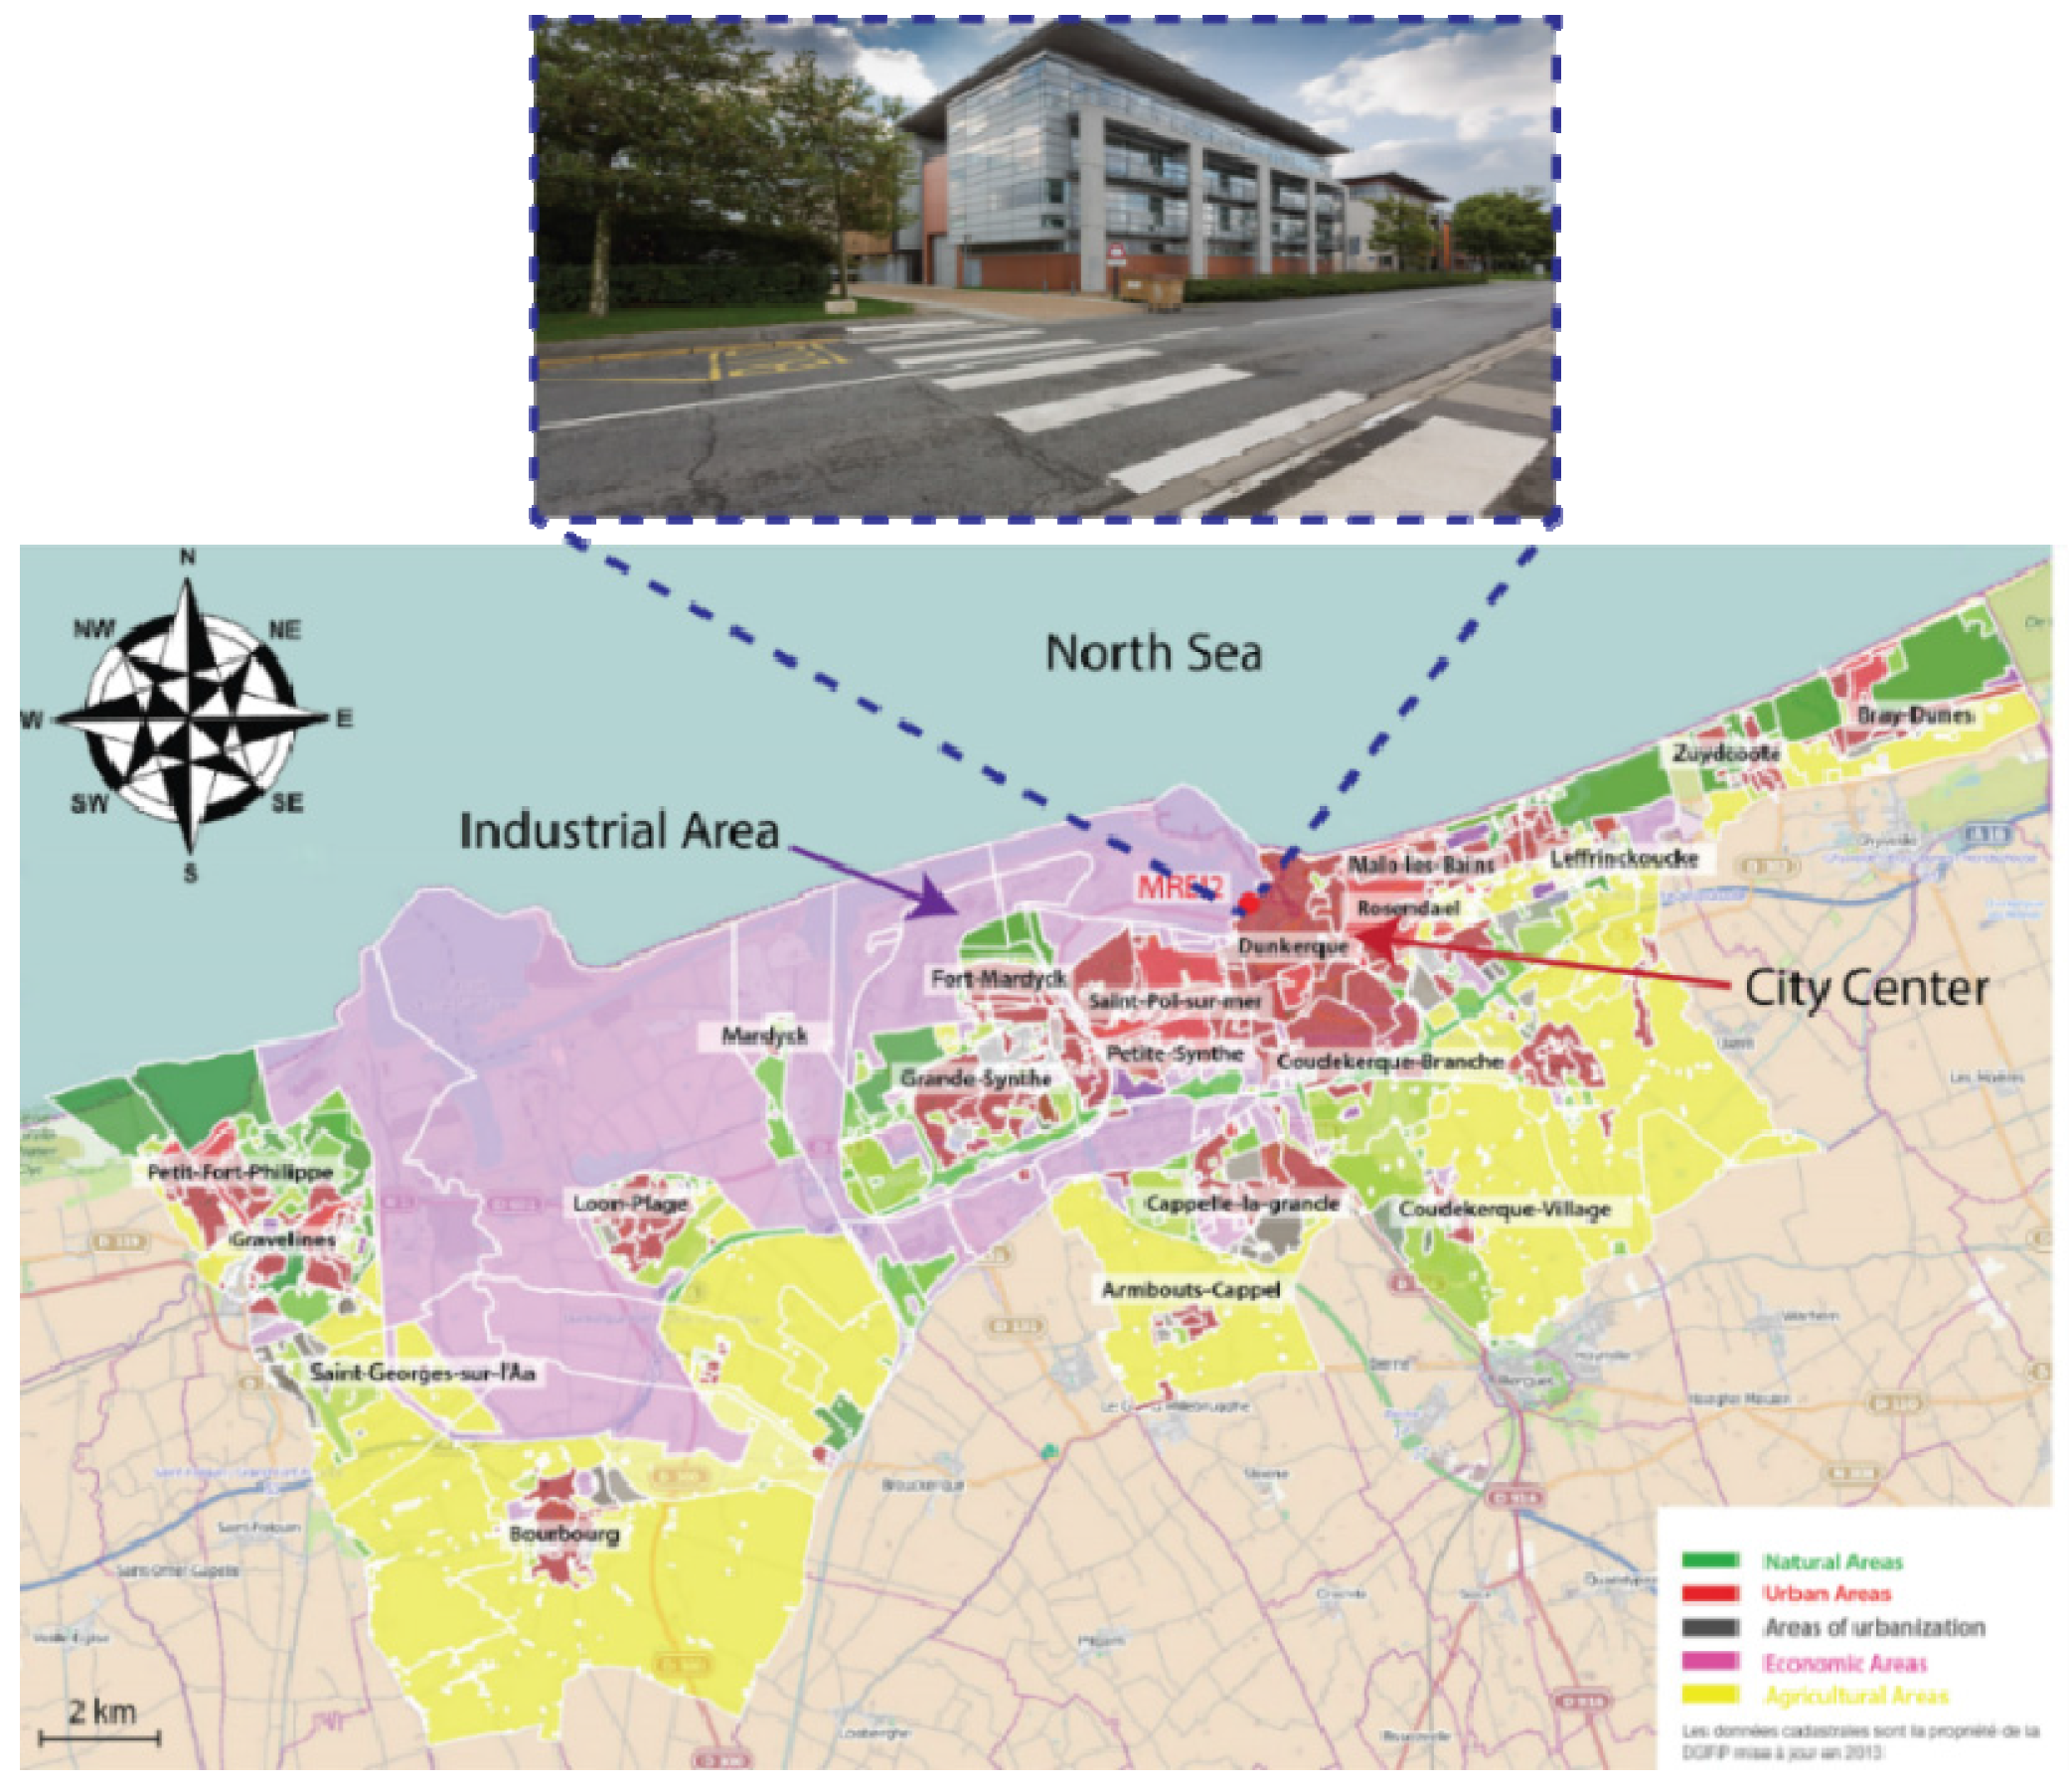
3.1. Campaign Site Description

The developed QCL-CH4 sensor was deployed for continuous monitoring of environmental CH4 during a field campaign of about 2 weeks (from 9 to 22 January 2013) on a suburban site in Dunkirk, France (Figure 7).
Figure 7. Campaign site.
Sensors 16 00224 g007
It is near a moderate-traffic road (latitude/longitude: 51.0358613/2.3654160), 3 km from the well-developed industrial area (situated at the western side of the sampling site), 2 km from the North Sea (at the north of the site) and about 500 m from the city center (south-south-east of the site). Ambient air was sampled using Teflon tubing, fixed at about 180 cm above the ground, connected to the QCL-CH4 sensor. Measurements of the environmental CH4 were performed using the developed QCL-sensor to probe the methane absorption line centered at 1255.0004 cm−1 by direct absorption over an effective optical absorption path-length of Leff = 175 m in a multipass cell with a data acquisition rate of 0.65 s/spectrum.

3.2. Complementary Measurements

Basic meteorological parameters (such as temperature, wind direction, wind speed, water vapor mixing ratio, global solar radiation) were measured with a sampling resolution of 15 min throughout the measurement campaign. The used weather station (Davis Vantage Pro2, Montanay, France) was installed on the top of the laboratory building next to the sampling site at about 20 m above the air sampling tube in order to avoid any wind perturbation because of surrounding buildings. For the wind speeds lower than 4 m/s (the resolution limit of Davis Vantage Pro2), the wind direction and wind speed data measured at a rate of 20 Hz by a METEK ultrasonic anemometer (uSonic-3 Scientific USA-1, Elmshorn, Germany) were used. This ultrasonic anemometer collecting the turbulence parameters in the boundary layer was installed on a 15 m tower, located about 1.5 km north from the campaign site. The effect of the distance (~1.5 km) between two measurement instruments (METEK ultrasonic anemometer and Davis Vantage Pro2) has been investigated. Good correlation between the two instruments’ measurements were observed with R2 = 0.95 and 0.85 for the measurements of wind direction and wind speed, respectively, during the full campaign period.
Carbon monoxide (CO) and nitrogen oxides (NO, NOx) were measured with a CO analyzer (CO 12M-Environnement, SA, Poissy, France) with a 1σ detection limit of 25 ppb and a NOx analyzer (AC 31M—Environnement SA, 1σ detection limit of 0.17 ppb). Sulfur dioxide (SO2) was also measured with a 1 σ detection limit of 0.5 ppb using an AF 22M SO2 Analyzer (Environnement, SA) in order to determine whether the industrial area has an influence on the methane budget, as well as ozone (O3) measured by an O3 analyzer (41 M—Environnement, SA, with a 1σ detection limit of 0.5 ppb). All gas measurements were carried out with a sampling resolution of 15 min.

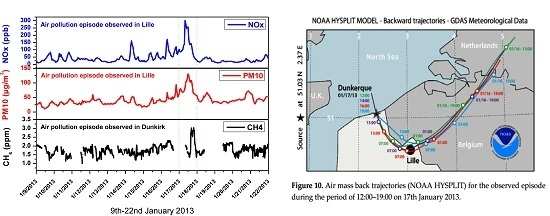
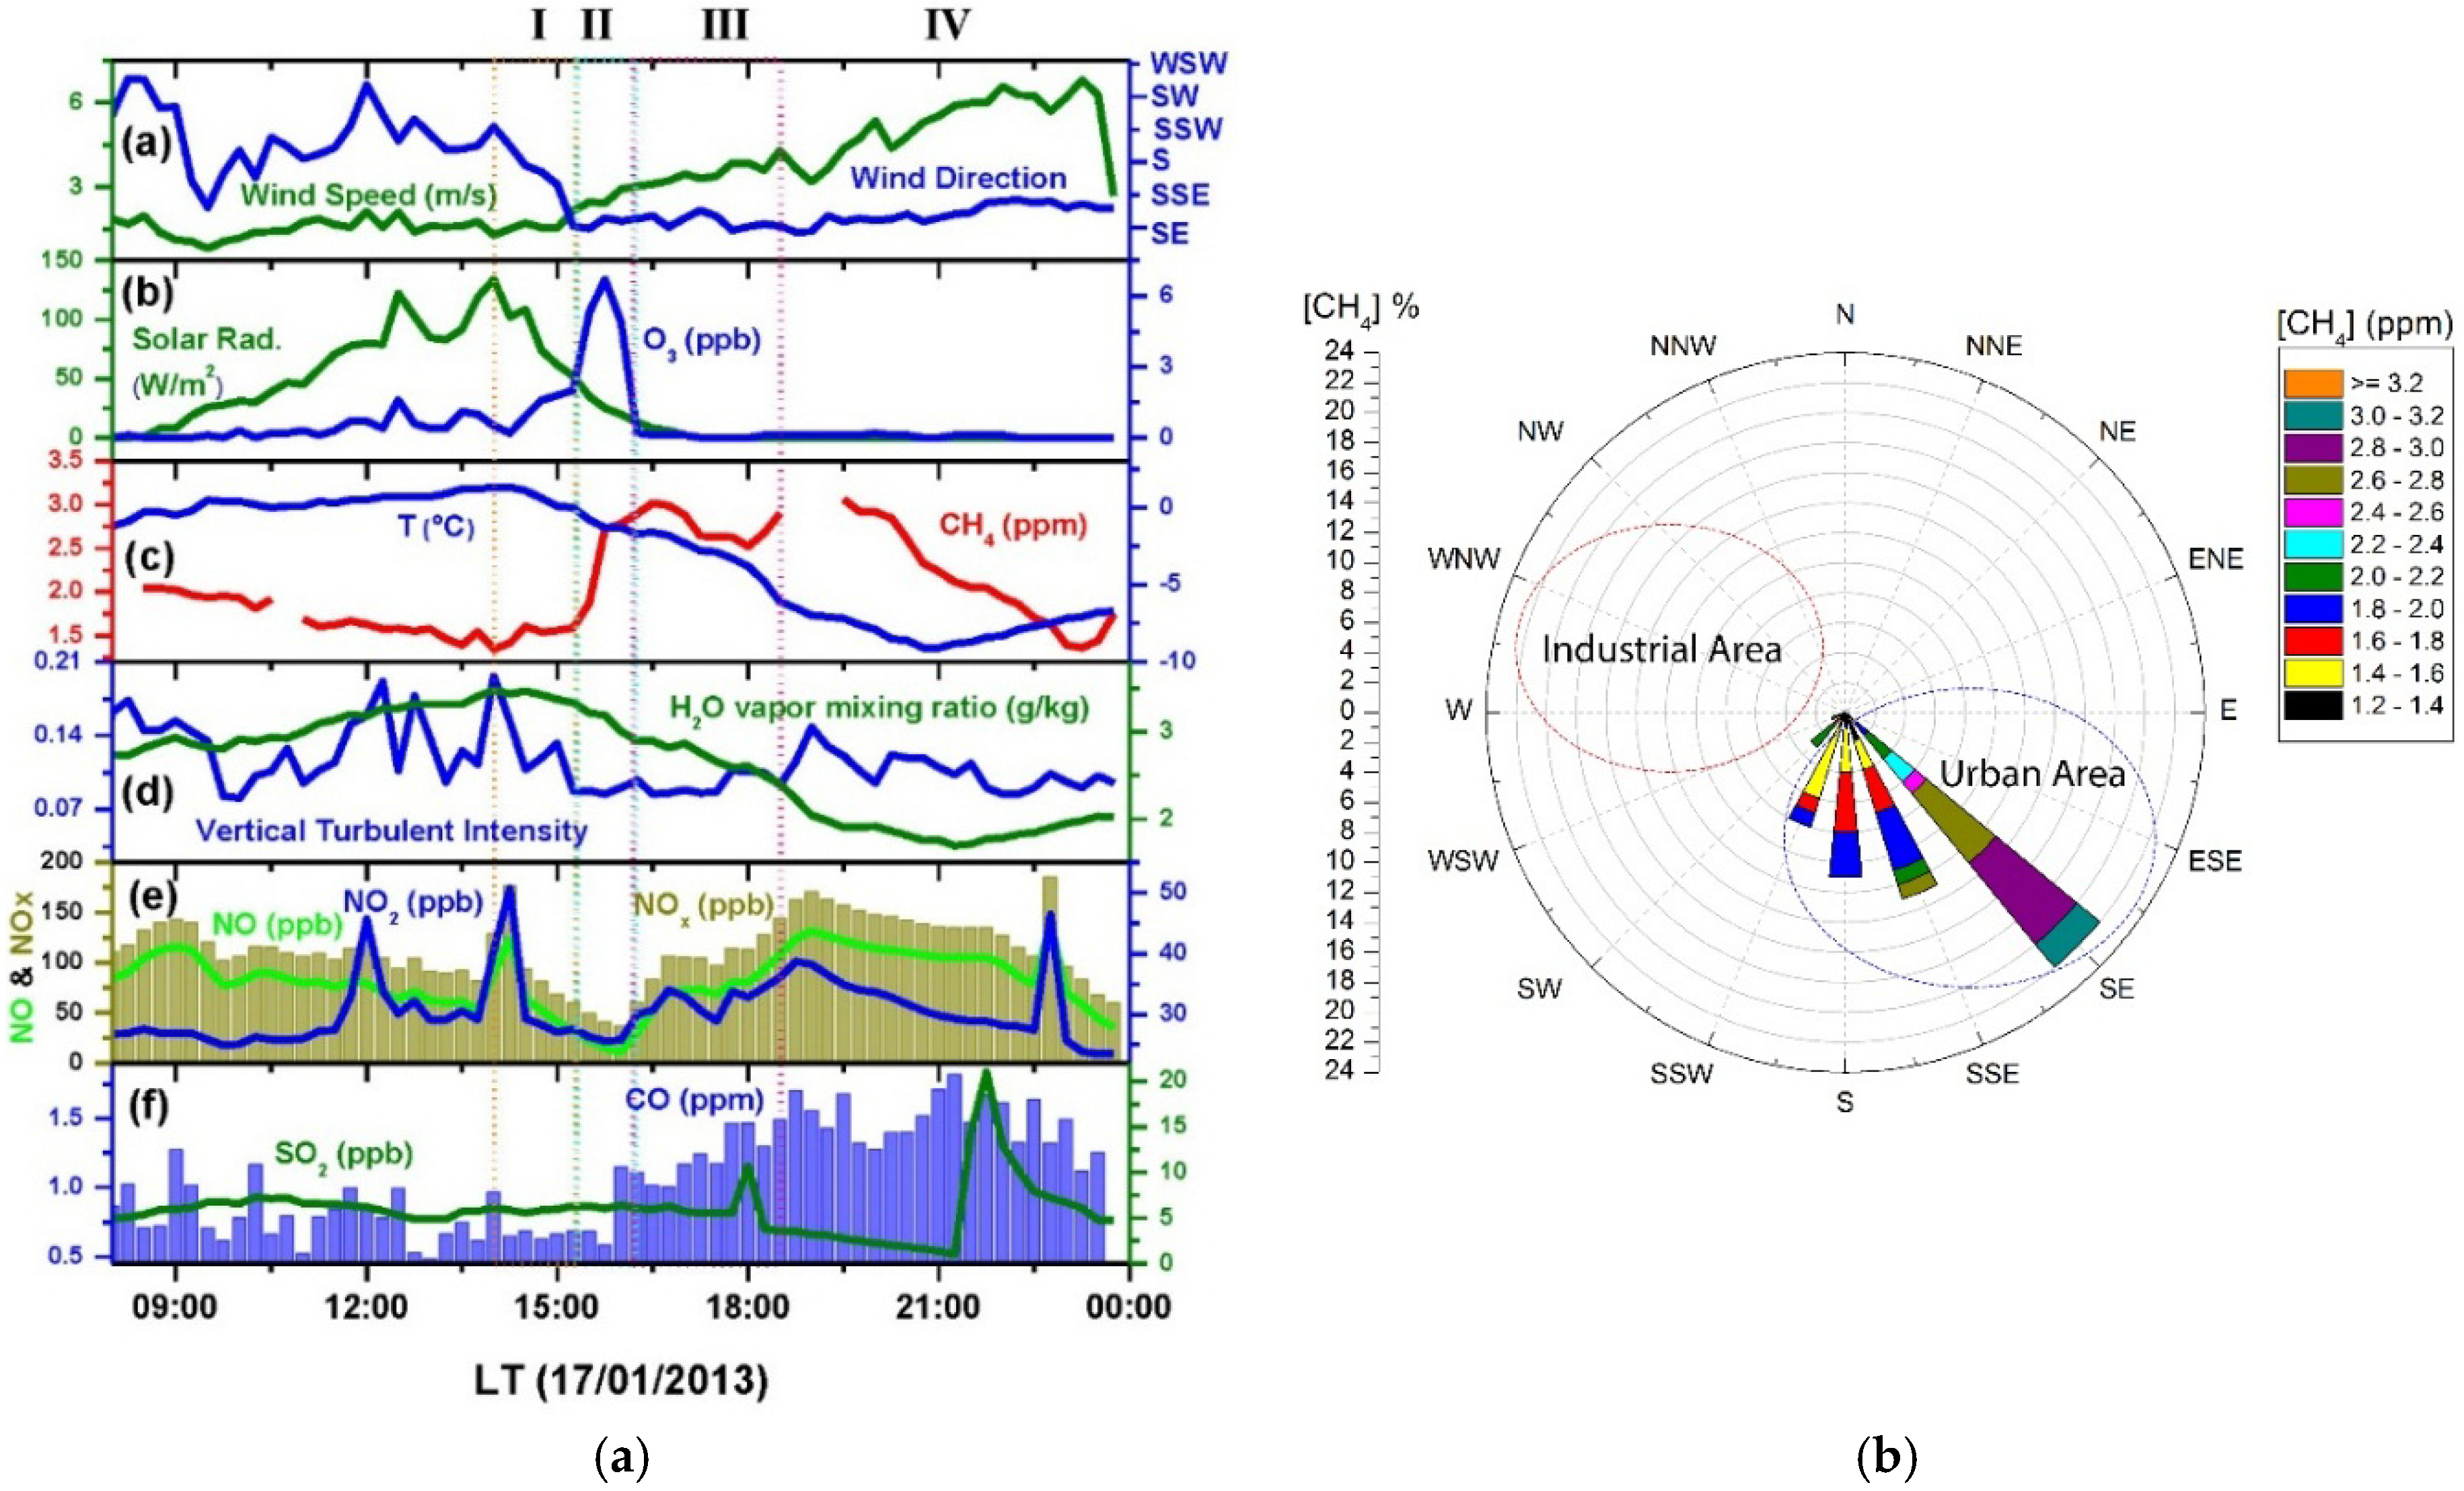
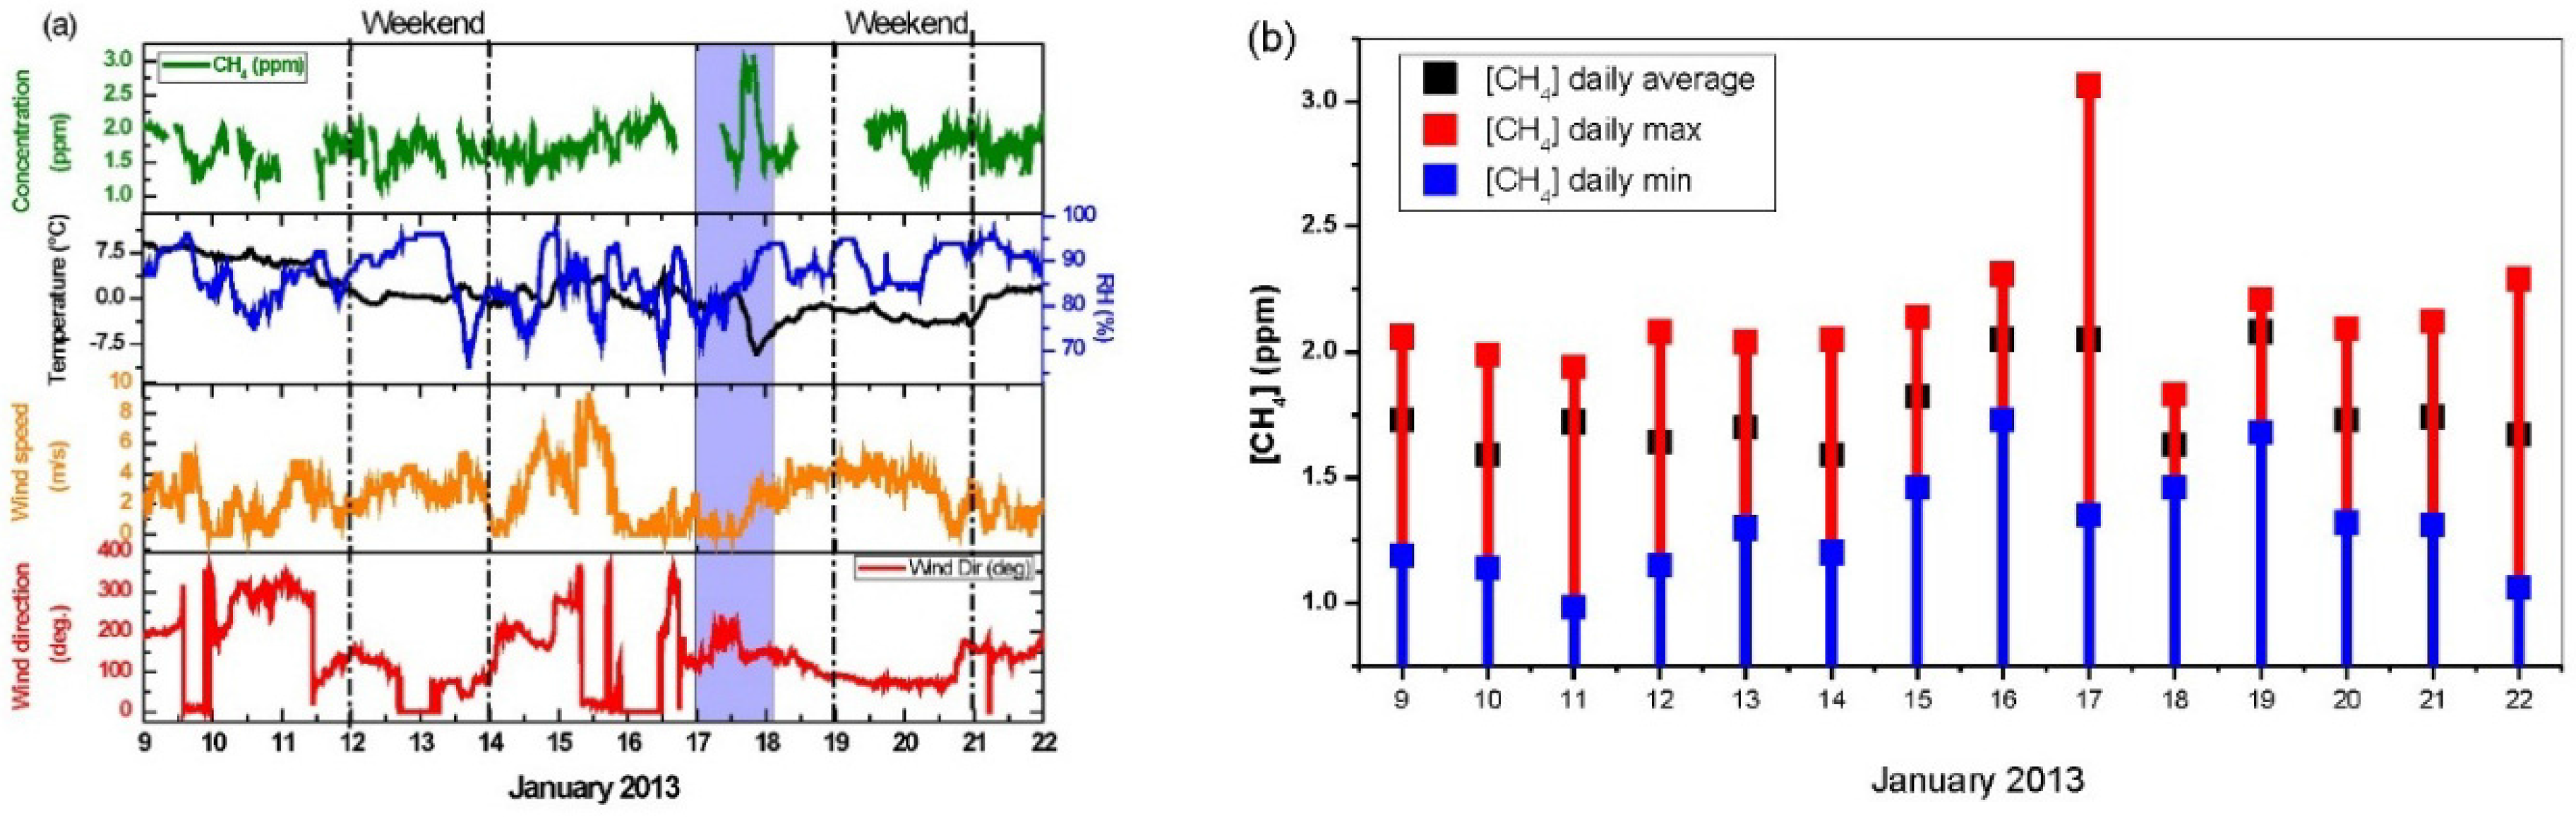
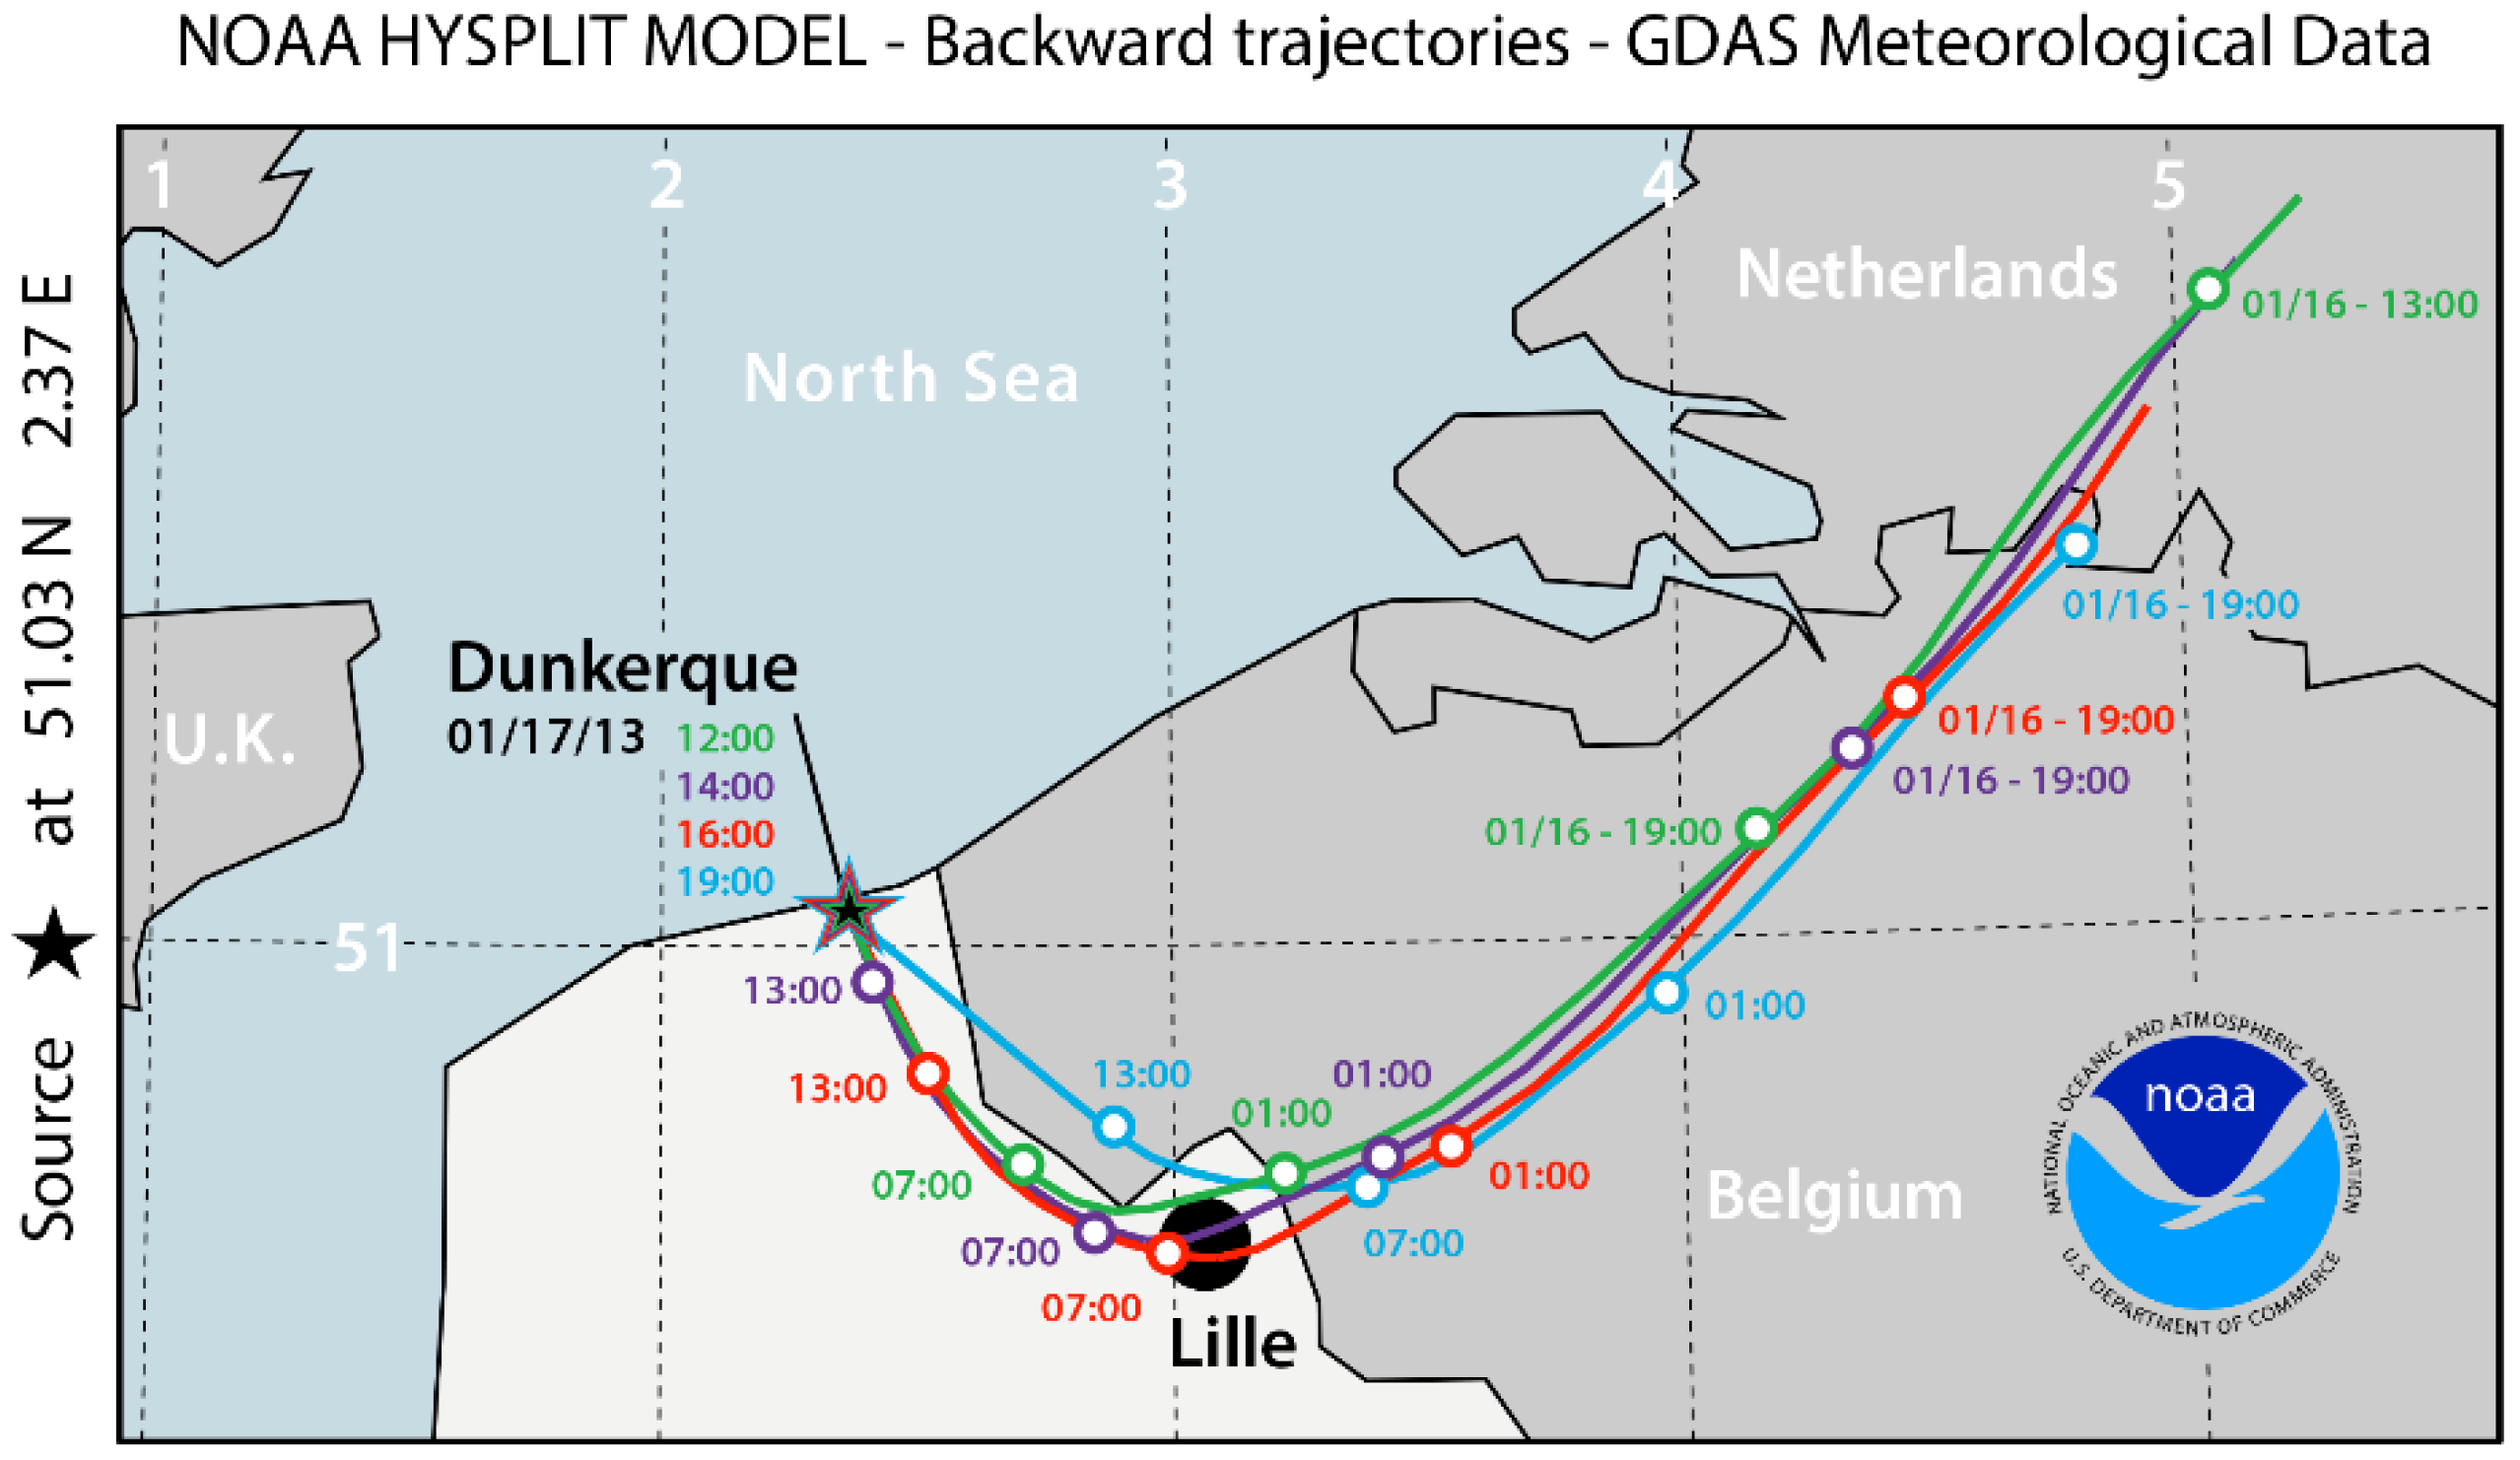
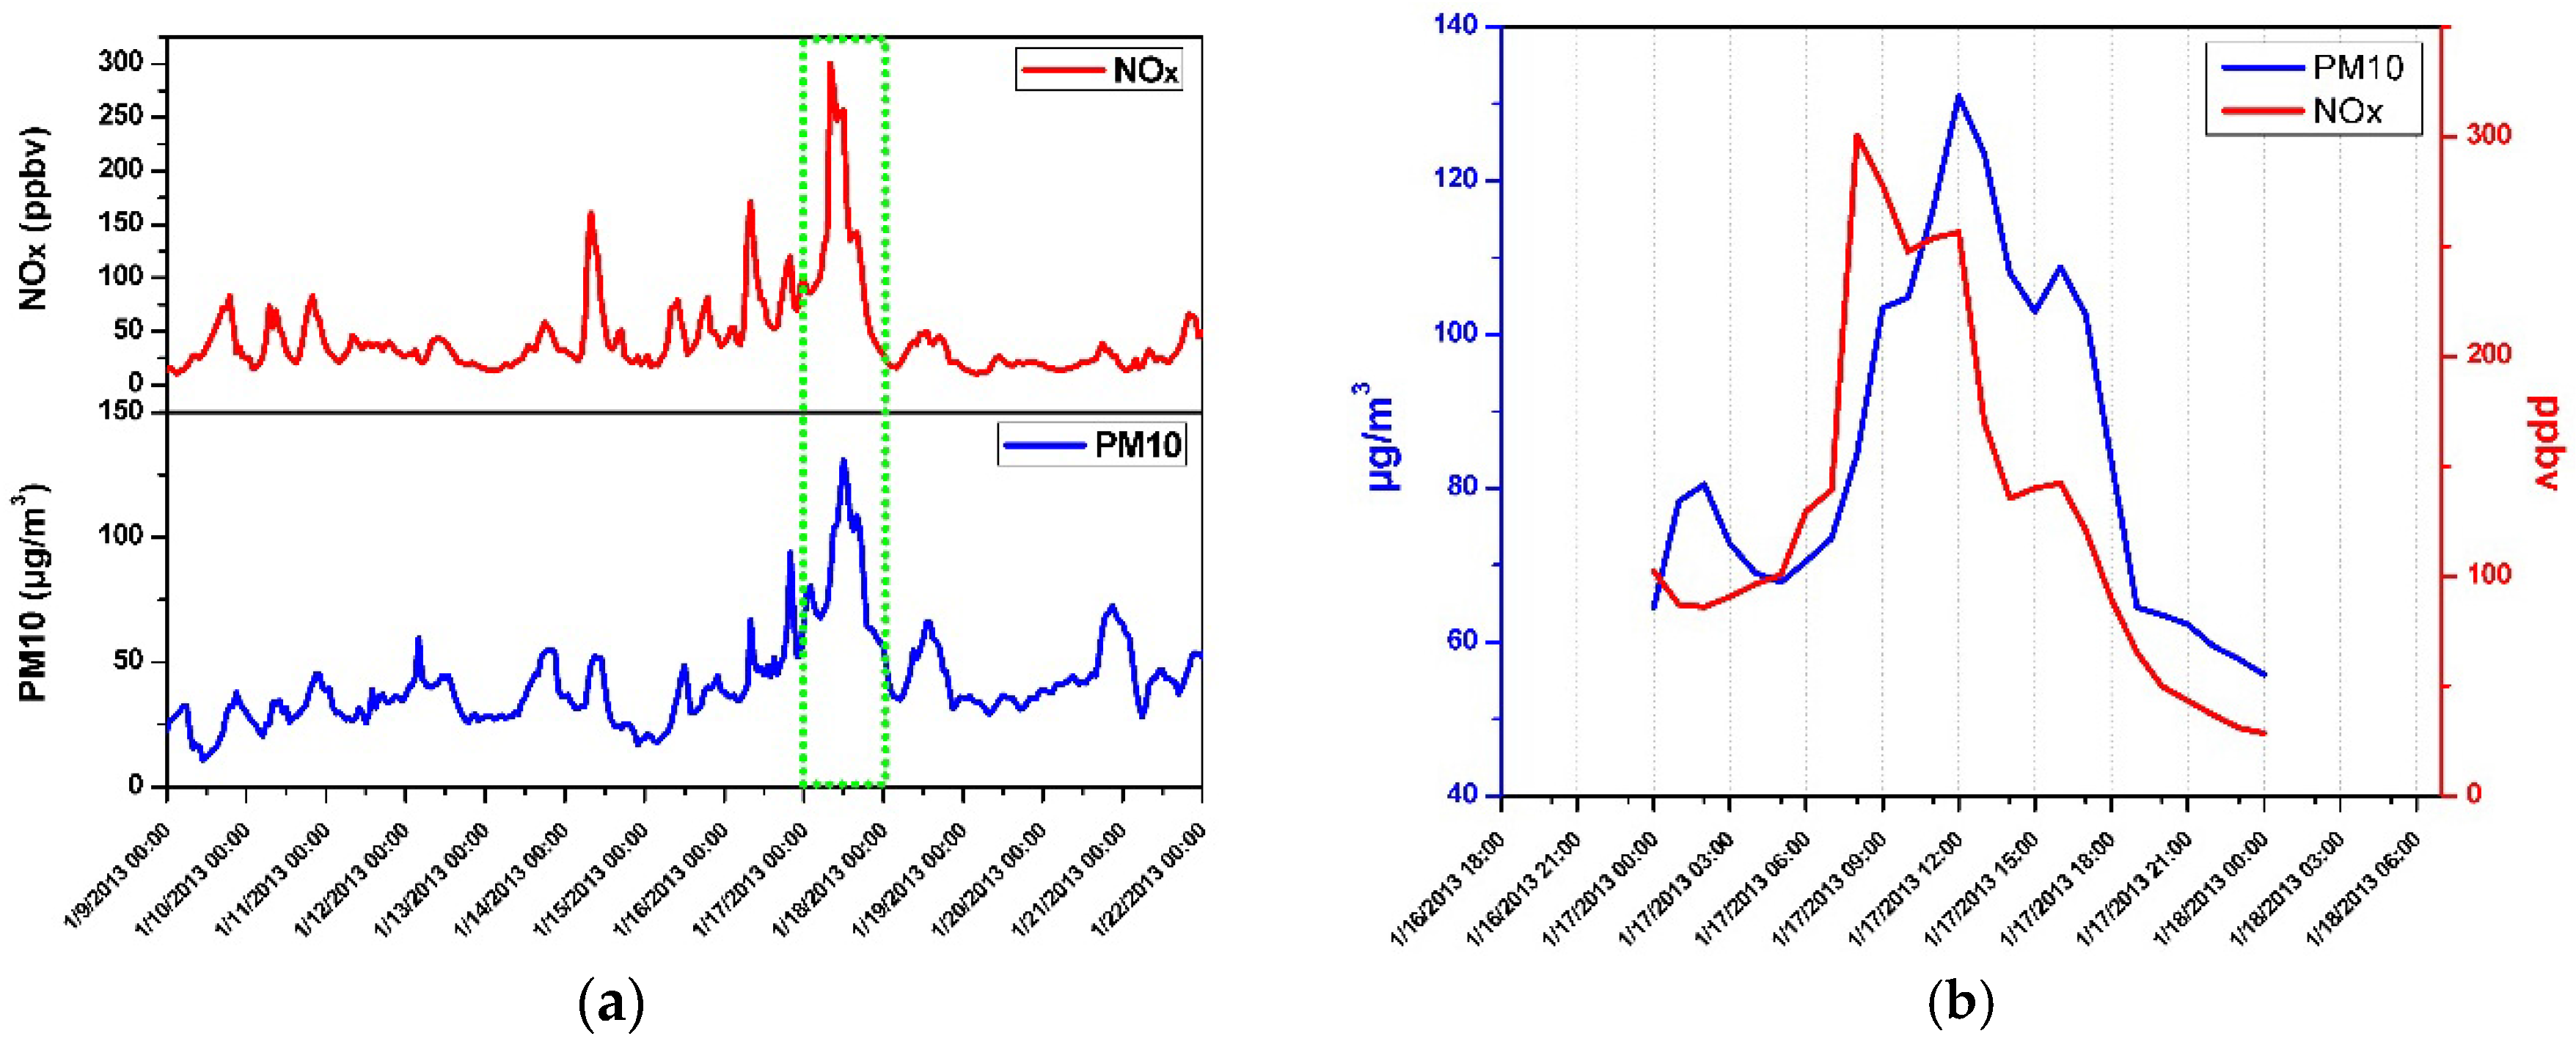
3.3. Results and Discussion

Figure 8a presents time-series measurements of CH4 concentration (green) accompanied with the measured temperature (black), humidity (blue), wind speed (orange) and direction (red). All data are averaged over 15 min. In Figure 8b, we present the daily averaged methane concentration associated with the maximum (red) and minimum (blue) values.
Figure 8. (a) Time-series methane concentrations variation sampled at 15-min intervals; (b) CH4 daily average concentration (black dots), daily observed maximum (red) and minimum (blue) concentrations.
Sensors 16 00224 g008
The averaged CH4 concentration (black) was found to be (1.77 ± 0.20) ppm during the 14 days’ campaign. High daily averaged CH4 concentration bigger than 2.08 ppm was observed on 16, 17, 19 and 22 January. The highest CH4 concentration of up to ~3 ppm was observed starting from ~15:00 (Paris winter local time) on 17 January along with a temperature decreasing down to −9 °C. This episode of high temporal variability of CH4 has been examined with the help of meteorological parameters as well as the time-series concentration variations of NOx, NO2, NO, CO, SO2 and H2O vapor, as plotted in Figure 9a.
Starting from about 14:00 to 15:00 (Figure 9a, Period I), there was a change of wind direction from south-south-west (SSW) to south-east (SE), as shown in Figure 9a blue curve, leading to a change of air mass accompanied by a drop of temperature ((c) blue curve) and water vapor mixing ratio (from 3.5 down to 2 g/kg, Figure 9d green curve), an increase of CO ((f) blue column).
The observed increase in CH4 concentrations may originate from the urban area (SE) brought by this new air mass (see the pollution wind rose in Figure 9b). During period II after the change of air mass in period I, the low wind speed (<3 m/s, (a) green line) and low temperature (<−1 °C, (c) blue line) may promote accumulation of pollutants on the measurement site. This accumulation effect was confirmed by the low vertical turbulent intensity during this period ((d) blue line), deduced from the METEK ultrasonic anemometer; this implies a reduction of turbulent mixing thereby inhibiting dilution, leading to the increase in NOx, NO, CO concentrations and high CH4 concentration during all the period III.
Figure 9. Time series (in local time, LT) measurements (a) and pollution-concentration wind rose plot (b) showing the dependence of CH4 concentration on the wind direction on 17 January 2013.
Sensors 16 00224 g009
From about 19:00, a progressive change of the wind direction from south-east (SE) to south-south-east (SSE), associated with an increase in wind speed and in vertical turbulent intensity, may lead to an increase of pollutants dispersion which contributes to the observed decrease in concentrations of CH4 as well as CO and NOx. Note that there was no significant wind blowing from the industrial areas located at the west side of the sampling site, and hence no industrial contribution to the measurement results was likely during this observation period. This analysis is confirmed by the CH4-concentration wind rose shown in Figure 9b.
In order to better understand the highest methane concentration (of the whole field campaign period) measured during this day, back trajectories of the air mass on 17 January were calculated (Figure 10) using the Hybrid Single-Particle Lagrangian Integrated Trajectory (HYSPLIT) model of National Oceanic and Atmospheric Administration (NOAA) [27].
Figure 10. Air mass back trajectories (NOAA HYSPLIT) for the observed episode during the period of 12:00–19:00 on 17 January 2013.
Sensors 16 00224 g010
These air-mass back trajectories show the contribution of transport paths to the observed high CH4 concentration peak by adding the pollutants imported by the air mass passing through Lille (arriving in Dunkirk during the period of 14:00–18:00), the fourth largest city in France, with a population of more than 1 million inhabitants.
In order to further confirm the arrival of the pollutant from Lille, officially available data of NOx (NO and NO2) and PM10 (CH4 is not monitored for the regional air quality monitoring) measured during our campaign period (9–22 January 2013) by a network monitoring site in Lille Five (Latitude/Longitude: 50°37′41′′/3°5′26′′) have been explored in comparison with our measurement data. As shown in Figure 11a, a highest pollution episode (highest levels of NOx and PM10) has been also observed on 17 January 2013, the same day as the biggest CH4 concentration observed in Dunkirk (Figure 8).
Figure 11. (a) Lille air quality monitoring data of NOx and PM10 (“Source Atmo Nord–Pas de Calais”) during the campaign period of 19–22 January 2013, recorded by the observation station of the ATMO Nord–Pas-de-Calais [28] in Lille Five. A high pollution episode has been also recorded on 17 January 2013, the same day as the biggest CH4 concentration observed in Dunkirk; (b) detailed concentration evolution of NOx and PM10 on this very day.
Sensors 16 00224 g011
It is well known, combustion emission is the primary sources of both CH4 and NOx [4,29,30]. Figure 12a shows such a positive correlation between NOx and CH4, observed during the highest CH4 concentration episode on this very day. It is worth noting that the temperature dropped from ~0 °C to −9 °C within 6 h from 15:00 to 21:00, the period in which the CH4 concentration peak has been observed.
Figure 11b details the concentration evolution of NOx and PM10 in Lille on this very day, which confirms the results of the air mass back trajectories shown in Figure 10: the air mass trajectory (red) passing by Lille near 7:00 (corresponding to a significant increase of NOx level in air) arrive at Dunkirk at about 16:00 where the CH4 concentration getting started raising. Furthermore, good correlation between NOx and CO has been observed (Figure 12b), which can be an indicator of a common source of emission of these pollutants.
Figure 12. Correlation of NOx vs. CH4 (a) and NOx vs. CO (b) during the period of the observed episode on 17 January 2013.
Sensors 16 00224 g012
The CH4 concentrations in relation to wind sector during all the measurement campaign from 9 to 22 of January 2013 is presented in Figure 13. The sampling site is at the center of the pollution-concentration wind rose. The wind direction is toward the center of the rose. The sector length indicates the frequency of wind direction (%) and the colors correspond to different CH4 concentrations (ppm). Decomposition color of each wind sector gives the frequency of each concentration range over all measurements.
Figure 13. Frequency distribution rose of CH4 concentrations depending on the blowing wind sectors from 9 to 22 of January 2013 in Dunkirk.
Sensors 16 00224 g013
For example, we can observe that approximately 20% of the measured CH4 concentration corresponding to an easterly wind (E), in which ~5% and ~6% of CH4 concentrations were between 2.0 to 2.2 ppm and 1.6 to 1.8 ppm, respectively.
This pollution-concentration wind rose indicates that the contribution of local industries from N–WSW sectors to higher CH4 concentration is relatively low (except for the NW sector), the higher CH4 level (>1.8 ppm) are mainly due to urban emissions from the regions of E–SSE urban areas, which was the dominant CH4 source for the Dunkirk area during the present campaign in winter.

4. Conclusions

This work focused on the instrumental development, the performance characterization and the field deployment of an optical sensor based on infrared DFB-QCL operating at a wavelength suitable for sensitive and selective quantitative detection and monitoring of CH4 in atmospheric environment. The developed DFB-QCL CH4 sensor, designed for ease of instrument operation and data acquisition/analysis, is based on a simple multipass direct absorption spectroscopic approach which renders the sensor self-calibrated. It operates at thermoelectrically cooled room-temperature and offers the ability of fast frequency tuning at the kHz scanning rate of spectral data acquisition. In addition, it is mode-hop free frequency tunable over 5 cm−1 around 1254 cm−1 providing multi-species (CH4, HONO, N2O, H2O) sensing ability, combined with “TeamViewer” remote controlling mode for 24/7 service operation, which truly makes the sensor cost-effective.
The developed sensor was deployed in a campaign of measurements of time series CH4 concentration on a site near a suburban traffic road in Dunkirk. An average CH4 concentration of (1.77 ± 0.20) ppm was measured during the 14 days’ campaign. The episode of the highest CH4 concentration of up to ~3 ppm, observed on 17 January, has been analyzed by combining local meteorological data with regional back trajectory calculations. The higher CH4 concentration was mainly attributed to urban pollution transported by air mass through local urban area and the district of Lille, which was confirmed by the pollution wind rose of CH4 concentrations in relation to wind sector and by the analysis of air mass back trajectories using the HYSPLIT trajectory model as well as by the analysis of the air quality monitoring data measured at a regional network site in Lille.
The understanding and inventory of CH4 sources reflects mixed effects of photochemical reactions, transport patterns and processes, atmospheric dispersion, etc. Recent study [31] shows that the CH4 emissions from natural gas are 2–3 times larger than predicted by existing inventory methodologies and industry reports. These findings suggest that natural-gas-consuming regions may be larger sources of CH4 to the atmosphere than is currently estimated and represent areas of significant resource loss. This is a serious issue that should be urgently addressed with the local authorities and energy supply agencies, in particular in the context of the local installation and operation of a LNG terminal.

Acknowledgments

The authors acknowledge financial support from the French Agence Nationale de la Recherche (ANR) under the NexCILAS (ANR-11-NS09-0002) and the CaPPA (ANR-10-LABX-005) contracts. The authors thank the Nord-Pas de Calais Region and the Ministère de l’Enseignement Supérieur et de la Recherche for the support in the framework of the CPER CLIMIBIO program. R. M. thanks the “Syndicat Mixte de la Côte d’Opale” (SMCO) and the “Région Nord Pas de Calais” for the PhD fellowship support.

Author Contributions

Weidong Chen supervised and managed the experimental work and manuscript. Rabih Maamary developed the instrument, managed the measurement campaign, processed the data and prepared the manuscript. Marc Fourmentin and Patrick Augustin realized the meteorological measurements and analyses. Dorothée Dewaele and Fabrice Cazier performed the measurement campaign and analyses of the results. Xiaojuan Cui, Eric Fertein and Laurence Guinet participated in the instrumental development or measurement campaign.

Conflicts of Interest

The authors declare no conflict of interest.

References

  1. Battle, M.; Bender, M.; Sowers, T.; Tans, P.P.; Butler, J.H.; Elkins, J.W.; Ellis, J.T.; Conway, T.; Zhang, N.; Lang, P.; et al. Atmospheric gas concentrations over the past century measured in air from firn at the South Pole. Nature 1996, 383, 231–235. [Google Scholar] [CrossRef]
  2. Lelieveld, J.; Crutzen, P.J.; Dentener, F.J. Changing concentration, lifetime and climate forcing of atmospheric methane. Tellus B 1998, 50, 128–150. [Google Scholar] [CrossRef]
  3. Dlugokencky, E.J.; Masarie, K.A.; Lang, P.M.; Tans, P.P. Continuing decline in the growth rate of the atmospheric methane burden. Nature 1998, 393, 447–450. [Google Scholar] [CrossRef]
  4. Bousquet, P.; Ciais, P.; Miller, J.B.; Dlugokencky, E.J.; Hauglustaine, D.A.; Prigent, C.; Van der Werf, G.R.; Peylin, P.; Brunke, E.-G.; Carouge, C.; et al. Contribution of anthropogenic and natural sources to atmospheric methane variability. Nature 2006, 443, 439–443. [Google Scholar] [CrossRef] [PubMed]
  5. Walter, K.M.; Zimov, S.A.; Chanton, J.P.; Verbyla, D.; Chapin, F.S. Methane bubbling from Siberian thaw lakes as a positive feedback to climate warming. Nature 2006, 443, 71–75. [Google Scholar] [CrossRef] [PubMed]
  6. World Meteorological Organization. Guidelines for the Measurement of Methane and Nitrous Oxide and their Quality Assurance; Global Atmosphere Watch Report No. 185 (WMO/TD-No. 1478); World Meteorological Organization: Geneva, Switzerland, 2009. [Google Scholar]
  7. Svanberg, S. Chemical sensing with laser spectroscopy. Sens. Actuators B Chem. 1996, 33, 1–4. [Google Scholar] [CrossRef]
  8. Curl, R.F.; Capasso, F.; Gmachl, C.; Kosterev, A.A.; McManus, B.; Lewicki, R.; Pusharsky, M.; Wysocki, G.; Tittel, F.K. Quantum cascade lasers in chemical physics. Chem. Phys. Lett. 2010, 487, 1–18. [Google Scholar] [CrossRef]
  9. Tittel, F.K.; Lewicki, R.; Lascola, R.; McWhorter, S. Emerging Infrared Laser Absorption Spectroscopic Techniques for Gas Analysis; John Wiley and Sons Inc.: New York, NY, USA, 2013; pp. 71–109. [Google Scholar]
  10. Grossel, A.; Zéninari, V.; Parvitte, B.; Joly, L. Courtois, D. Optimization of a compact photoacoustic quantum cascade laser spectrometer for atmospheric flux measurements: Application to the detection of methane and nitrous oxide. Appl. Phys. B 2007, 88, 483–492. [Google Scholar] [CrossRef]
  11. Jahjah, M.; Ren, W.; Stefanski, P.; Lewicki, R.; Zhang, J.; Jiang, W.; Tarka, J.; Tittel, F.K. A compact QCL based methane and nitrous oxide sensor for environmental and medical applications. Analyst 2014, 139, 2065–2069. [Google Scholar] [CrossRef] [PubMed]
  12. Yi, H.; Chen, W.; Vicet, A.; Cao, Z.; Gao, X.; Nguyen-ba, T.; Jahjah, M.; Rouillard, Y.; Nahle, L.; Fischer, M. T-shape microresonator-based quartz-enhanced photoacoustic spectroscopy for ambient methane monitoring using 3.38 µm antimonide-distributed feedback laser diode. Appl. Phys. B 2013, 116, 423–428. [Google Scholar] [CrossRef]
  13. Lu, X.; Li, J.; Lu, H. Portable High-Precision System for CH4 Concentration Detection in Mines based on the Laser Mode-Hopping. Spectrosc. Spectr. Anal. 2015, 35, 846–849. [Google Scholar]
  14. Ghysels, M.; Gomez, L.; Cousin, J.; Amarouche, N.; Jost, H.; Durry, G. Spectroscopy of CH4 with a difference-frequency generation laser at 3.3 micron for atmospheric applications. Appl. Phys. B 2011, 104, 989–1000. [Google Scholar] [CrossRef]
  15. Mappé, I.; Joly, L.; Durry, G.; Thomas, X.; Decarpenterie, T.; Cousin, J.; Dumelie, N.; Roth, E.; Chakir, A.; Grillon, P.G. A quantum cascade laser absorption spectrometer devoted to the in situ measurements of atmospheric N2O and CH4 emission fluxes. Rev. Sci. Instrum. 2013, 84. [Google Scholar] [CrossRef] [PubMed]
  16. Liu, K.; Wang, L.; Tan, T.; Wang, G.; Zhang, W.; Chen, W.; Gao, X. Highly sensitive detection of methane by near-infrared laser absorption spectroscopy using a compact dense-pattern multipass cell. Sens. Actuators B Chem. 2015, 220, 1000–1005. [Google Scholar] [CrossRef]
  17. Crosson, E.R. A cavity ring-down analyzer for measuring atmospheric levels of methane, carbon dioxide, and water vapor. Appl. Phys. B 2008, 92, 403–408. [Google Scholar] [CrossRef]
  18. Gonzalez, V.R.; Magana, R.F.; Gerardo, N.O.; Sepulveda, J.A.; Martinez, C.K.; Anthony, K.W.; Baer, D.; Thalasso, F. In situ measurement of dissolved methane and carbon dioxide in freshwater ecosystems by off-axis integrated cavity output spectroscopy. Environ. Sci. Technol. 2014, 19, 11421–11428. [Google Scholar] [CrossRef] [PubMed]
  19. Blanquet, G.; Walrand, J.; Bouanich, J.P. Diode-laser measurements of O2-broadening coefficients in the ν3 band of CH335Cl. J. Mol. Spectrosc. 1993, 159, 137–143. [Google Scholar] [CrossRef]
  20. Rothman, L.S.; Jacquemart, D.; Barbe, A.; Chris Benner, D.; Birk, M.; Brown, L.R.; Carleer, M.R.; Chackerian, C.; Chance, K.; Coudert, L.H.; et al. The HITRAN 2004 molecular spectroscopic database. J. Quant. Spectrosc. Radiat. Transf. 2005, 96, 139–204. [Google Scholar] [CrossRef]
  21. Cui, X.; Lengignon, C.; Wu, T.; Zhao, W.; Wysocki, G.; Fertein, E.; Coeur, C.; Cassez, A.; Croisé, L.; Chen, W.; et al. Photonic Sensing of the Atmosphere by absorption spectroscopy. J. Quant. Spectrosc. Rad. Transfer 2012, 113, 1300–1316. [Google Scholar] [CrossRef]
  22. Werle, P. Tunable diode laser absorption spectroscopy: Recent findings and novel approaches. Infrared Phys. Technol. 1996, 37, 59–66. [Google Scholar] [CrossRef]
  23. Werle, P.; Mücke, R.; Slemr, F. The limits of signal averaging in atmospheric trace-gas monitoring by tunable diode-laser absorption spectroscopy (TDLAS). Appl. Phys. B 1993, 57, 131–139. [Google Scholar] [CrossRef]
  24. Werle, P.W.; Mazzinghi, P.; D’Amato, F.; De Rosa, M.; Maurer, K.; Slemr, F. Signal processing and calibration procedures for in situ diode-laser absorption spectroscopy. Spectrochim. Acta A Mol. Biomol. Spectrosc. 2004, 60, 1685–1705. [Google Scholar] [CrossRef] [PubMed]
  25. Weibring, P.; Richter, D.; Fried, A.; Walega, J.G.; Dyroff, C. Ultra-high-precision mid-IR spectrometer II: System description and spectroscopic performance. Appl. Phys. B 2006, 85, 207–218. [Google Scholar] [CrossRef]
  26. Cousin, J.; Chen, W.; Bigourd, D.; Fourmentin, M.; Kassi, S. Telecom-grade fiber laser-based difference-frequency generation and ppb-level detection of benzene vapor in air around 3 μm. Appl. Phys. B 2009, 97, 919–929. [Google Scholar] [CrossRef]
  27. Draxler, R.R.; Rolph, G.D. HYSPLIT (HYbrid Single-Particle Lagrangian Integrated Trajectory). NOAA Air Resources Laboratory: College Park, MD, USA. Available online: http://www.arl.noaa.gov/HYSPLIT.php (accessed on 11 December 2015).
  28. ATMO Nord–Pas-de-Calais. Available online: http://www.atmo-npdc.fr/ (accessed on 25 January 2016).
  29. AP-42. Compilation of Air Pollutant Emission Factors, 5th ed.Environmental Protection Agency: Washington, DC, USA, 1995.
  30. Nitrogen Oxides (NOx). Why and How They Are Controlled; Technical Report EPA-456/F-99–006R; Environmental Protection Agency: Washington, DC, USA, 1999.
  31. McKain, K.; Down, A.; Raciti, S.M.; Budney, J.; Hutyra, L.R.; Floerchinger, C.; Herndon, S.C.; Nehrkorn, T.; Zahniser, M.S.; Jackson, R.B.; et al. Methane emissions from natural gas infrastructure and use in the urban region of Boston, Massachusetts. PNAS 2015, 112, 1941–1946. [Google Scholar] [CrossRef] [PubMed]

