
Evaluation of the Bitterness of Traditional Chinese Medicines using an E-Tongue Coupled with a Robust Partial Least Squares Regression Method

Abstract
:1. Introduction
2. Materials and Methods
2.1. Apparatus
2.2. Selection of Concentrations

| No. | Description of Intensity of Bitterness | Rank Assigned | Corresponding Scale | Conc. of Corresponding Reference Samples |
|---|---|---|---|---|
| 1 | Imperceptible | I | [0.5–1.5) | 0 mg/mL (0 mM) |
| 2 | Slight | II | [1.5–2.5) | 0.01 mg/mL (0.027 mM) |
| 3 | Moderate | III | [2.5–3.5) | 0.05 mg/mL (0.134 mM) |
| 4 | High (but still acceptable) | IV | [3.5–4.5) | 0.1 mg/mL (0.269 mM) |
| 5 | Extreme (almost unacceptable) | V | [4.5–5.5] | 0.5 mg/mL (1.344 mM) |
2.3. Sample Preparation
| No. | Drug (The Latin Name) | Drug (Chinese Pinyin) | Human Test Data | pH |
|---|---|---|---|---|
| Bitterness Intensity | ||||
| 1 | CLEMATIDIS ARMANDII CAULIS | Chuanmutong | 0.70 ± 0.24 | 6.71 |
| 2 | MORI RAMULUS | Sangzhi | 0.67 ± 0.23 | 6.57 |
| 3 | UNCARIAE RAMULUS CUM UNCIS | Gouteng | 0.70 ± 0.25 | 6.72 |
| 4 | PLANTAGINIS SEMEN | Cheqianzi | 0.71 ± 0.20 | 5.82 |
| 5 | BAMBUSAE CAULIS IN TAENIAS | Zhuru | 1.24 ± 0.38 | 6.80 |
| 6 | CHANGII RADIX | Mingdangshen | 0.73 ± 0.30 | 6.45 |
| 7 | LYCOPI HERBA | Zelan | 1.19 ± 0.62 | 6.20 |
| 8 | PORIA | Fuling | 0.63 ± 0.17 | 6.74 |
| 9 | TETRAPANACIS MEDULLA | Tongcao | 0.64 ± 0.14 | 7.15 |
| 10 | XANTHII FRUCTUS | Cang’erzi | 1.21±0.50 | 6.81 |
| 11 | EUCOMMIAE CORTEX | Duzhong | 1.26 ± 0.57 | 6.15 |
| 12 | ALISMATIS RHIZOMA | Zexie | 0.95 ± 0.50 | 7.14 |
| 13 | PLANTAGINIS HERBA | Cheqiancao | 1.26 ± 0.62 | 5.46 |
| 14 | FRITILLARIAE THUNBERGII BULBUS | Zhebeimu | 1.82 ± 0.39 | 6.10 |
| 15 | TRICHOSANTHIS RADIX | Tianhuafeng | 0.91 ± 0.36 | 6.55 |
| 16 | RUBIAE RADIX ET RHIZOMA | Qiancao | 1.81 ± 0.66 | 5.83 |
| 17 | CYNANCHI ATRATI RADIX ET RHIZOMA | Baiwei | 1.67 ± 0.62 | 5.91 |
| 18 | LEONURI HERBA | Yimucao | 2.54 ± 0.84 | 6.09 |
| 19 | CORYDALIS RHIZOMA | Yanhusuo | 2.8 ± 0.4 | 6.59 |
| 20 | STEPHANIAE TETRANDRAE RADIX | Fangji | 3.01 ± 0.42 | 6.76 |
| 21 | SCUTELLARIAE RADIX | Huangqin | 3.28 ± 0.53 | 5.36 |
| 22 | MENISPERMI RHIZOMA | Beidougen | 2.03 ± 0.89 | 6.33 |
| 23 | BLETILLAE RHIZOMA | Baiji | 1.78 ± 0.92 | 4.57 |
| 24 | SWERTIAE HERBA | Dangyao | 3.92 ± 0.53 | 5.75 |
| 25 | MELIAE CORTEX | Kulianpi | 1.47 ± 0.84 | 6.78 |
| 26 | NELUMBINIS PLUMULA | Lianzixin | 3.47 ± 1.17 | 6.86 |
| 27 | FRAXINI CORTEX | Qinpi | 1.4 ± 0.63 | 6.18 |
| 28 | COPTIDIS RHIZOMA | Huanglian | 4.45 ± 0.77 | 7.70 |
| 29 | SOPHORAE FLAVESCENTIS RADIX | Kushen | 4.78 ± 0.63 | 6.91 |
| 30 | GENTIANAE RADIX ET RHIZOMA | Longdan | 4.55 ± 0.68 | 5.79 |
| 31 | PHELLODENDRI CHINENSIS CORTEX | Huangbo | 4.66 ± 0.69 | 6.56 |
| 32 | BRUCEAE FRUCTUS | Yadanzi | 1.1 ± 0.5 | 8.56 |
| 33 | ANDROGRAPHIS HERBA | Chuanxinlian | 4.04 ± 0.52 | 6.70 |
| 34 | PICRORHIZAE RHIZOMA | Huhuanglian | 4.67 ± 0.54 | 4.65 |
| 35 | PICRASMAE RAMULUS ET FOLIUM | Kumu | 4.08 ± 0.75 | 7.89 |
2.4. Experiments
2.4.1. THTPM and Data Processing
2.4.2. E-Tongue Measurements
2.5. Bitterness Evaluation
2.5.1. RPLS Modeling
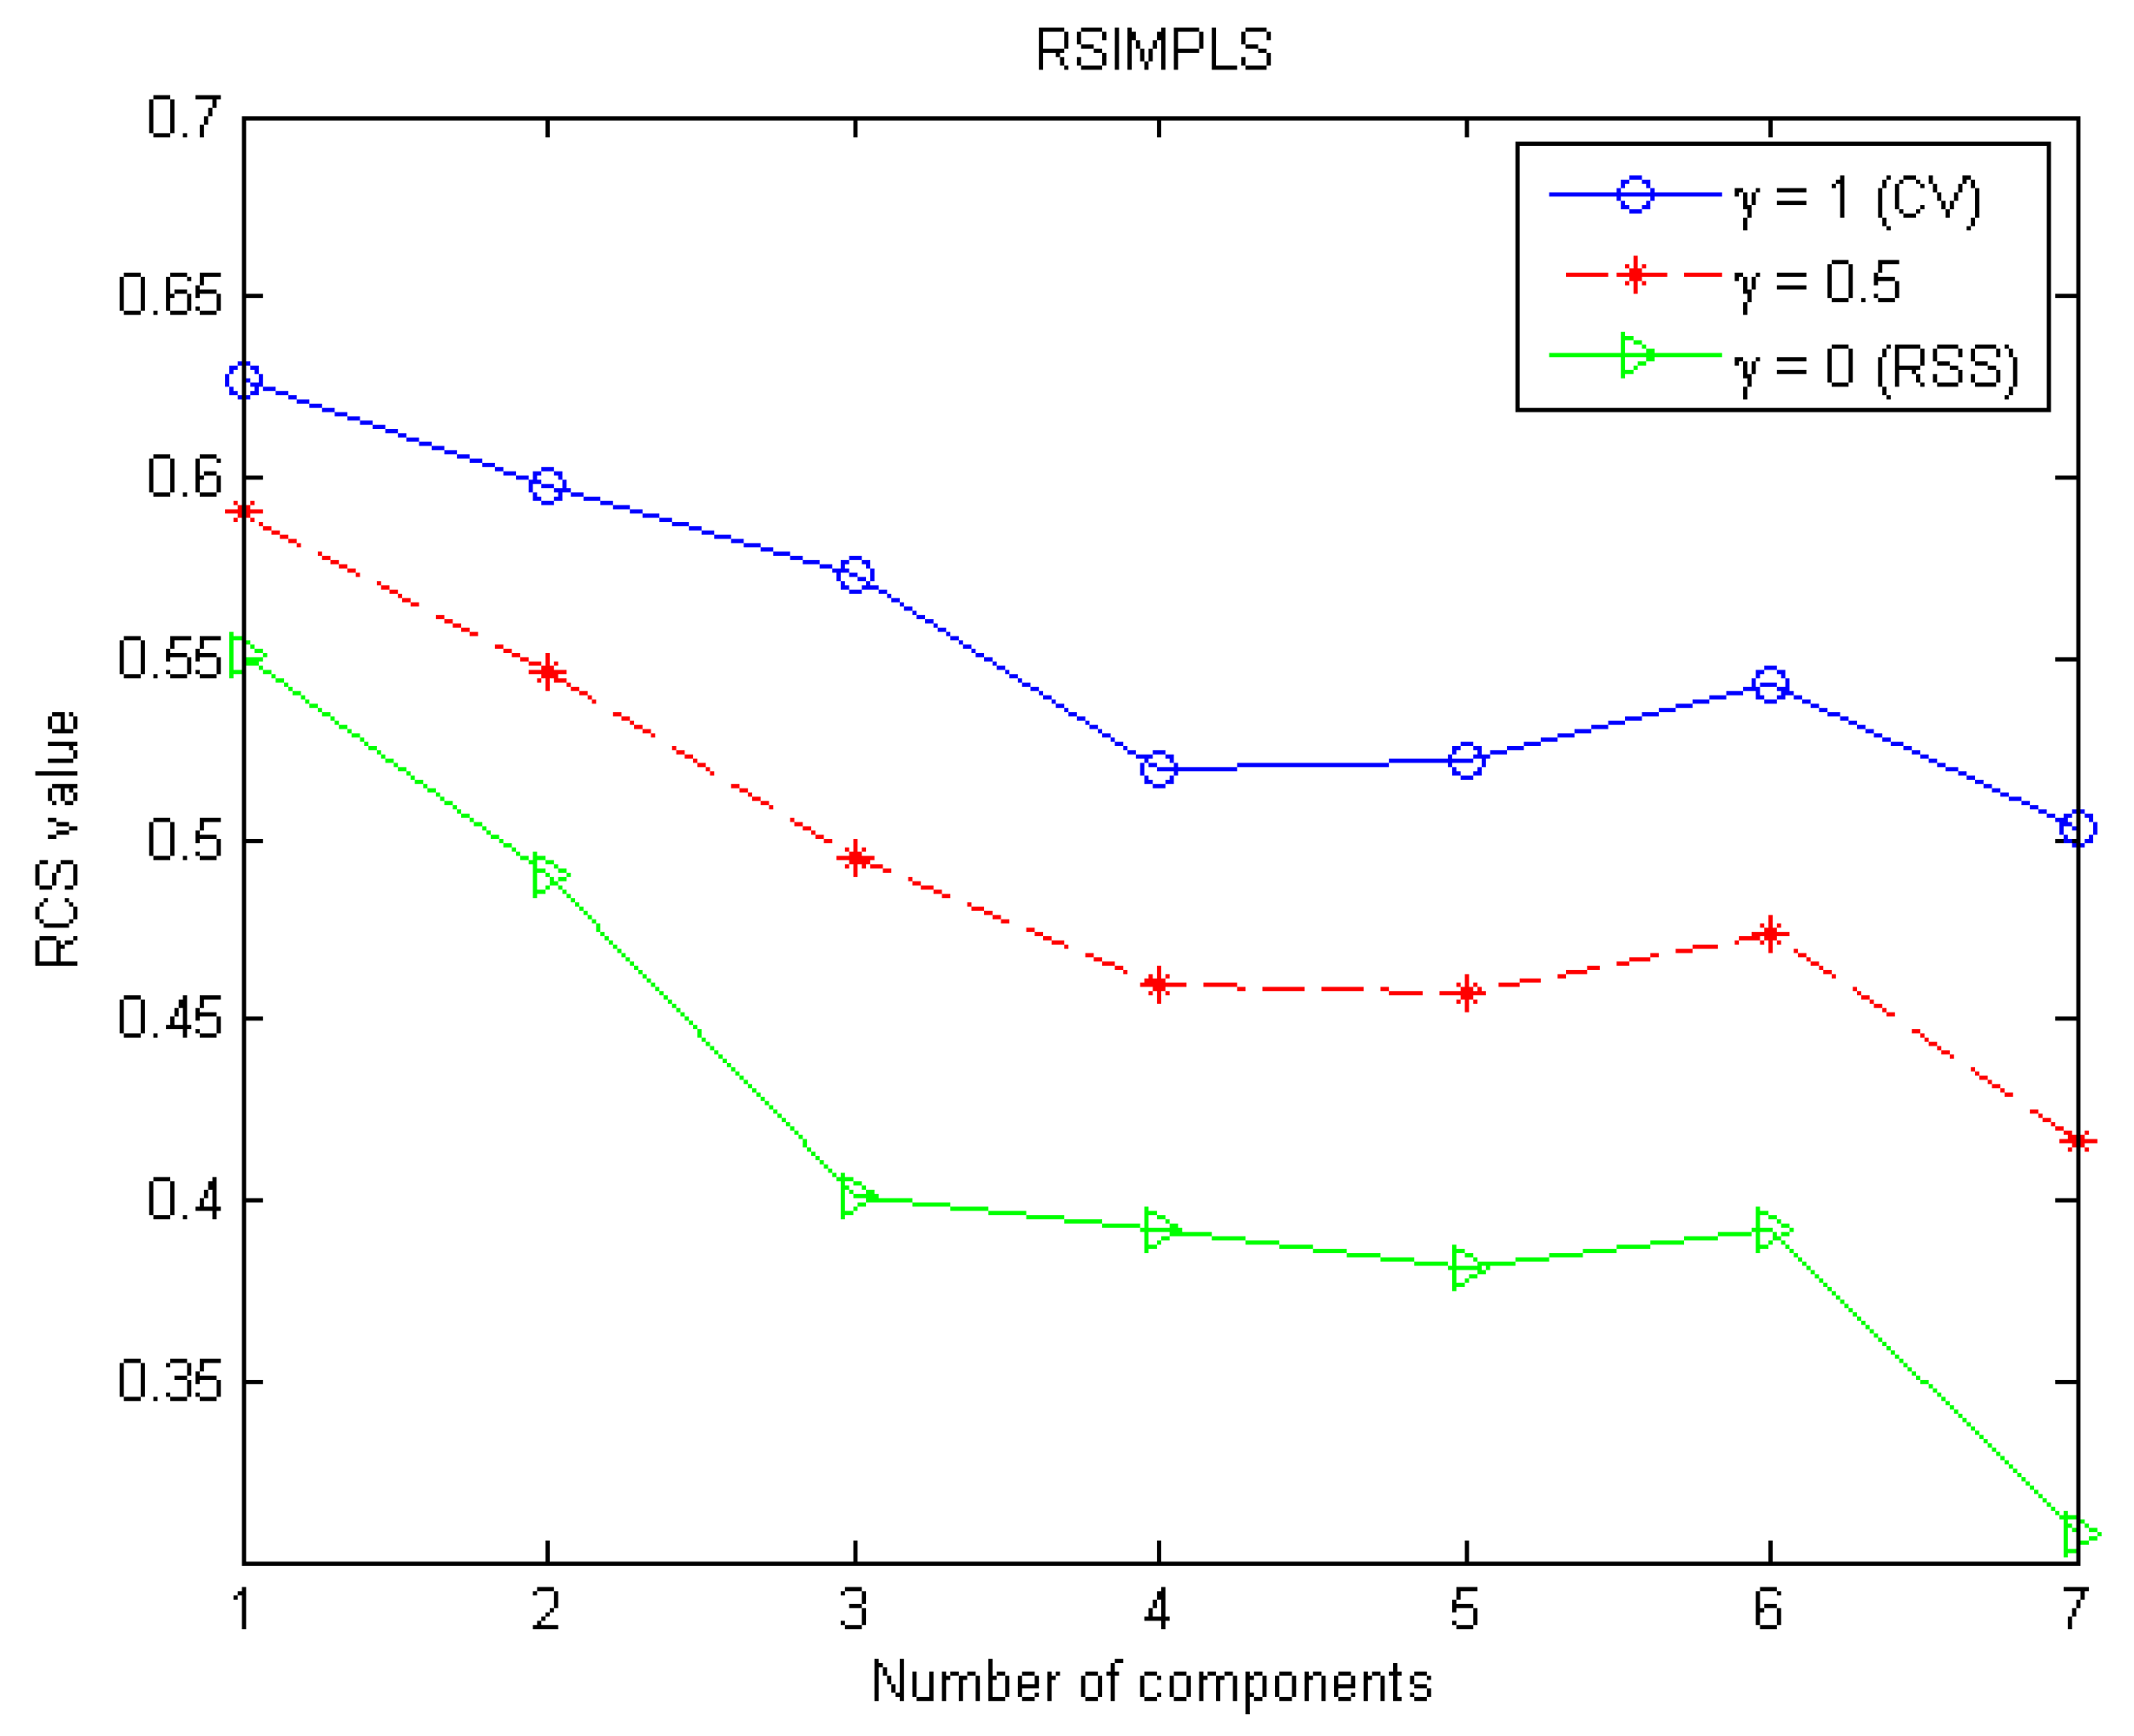
Optimization of Model Parameters
Modeling
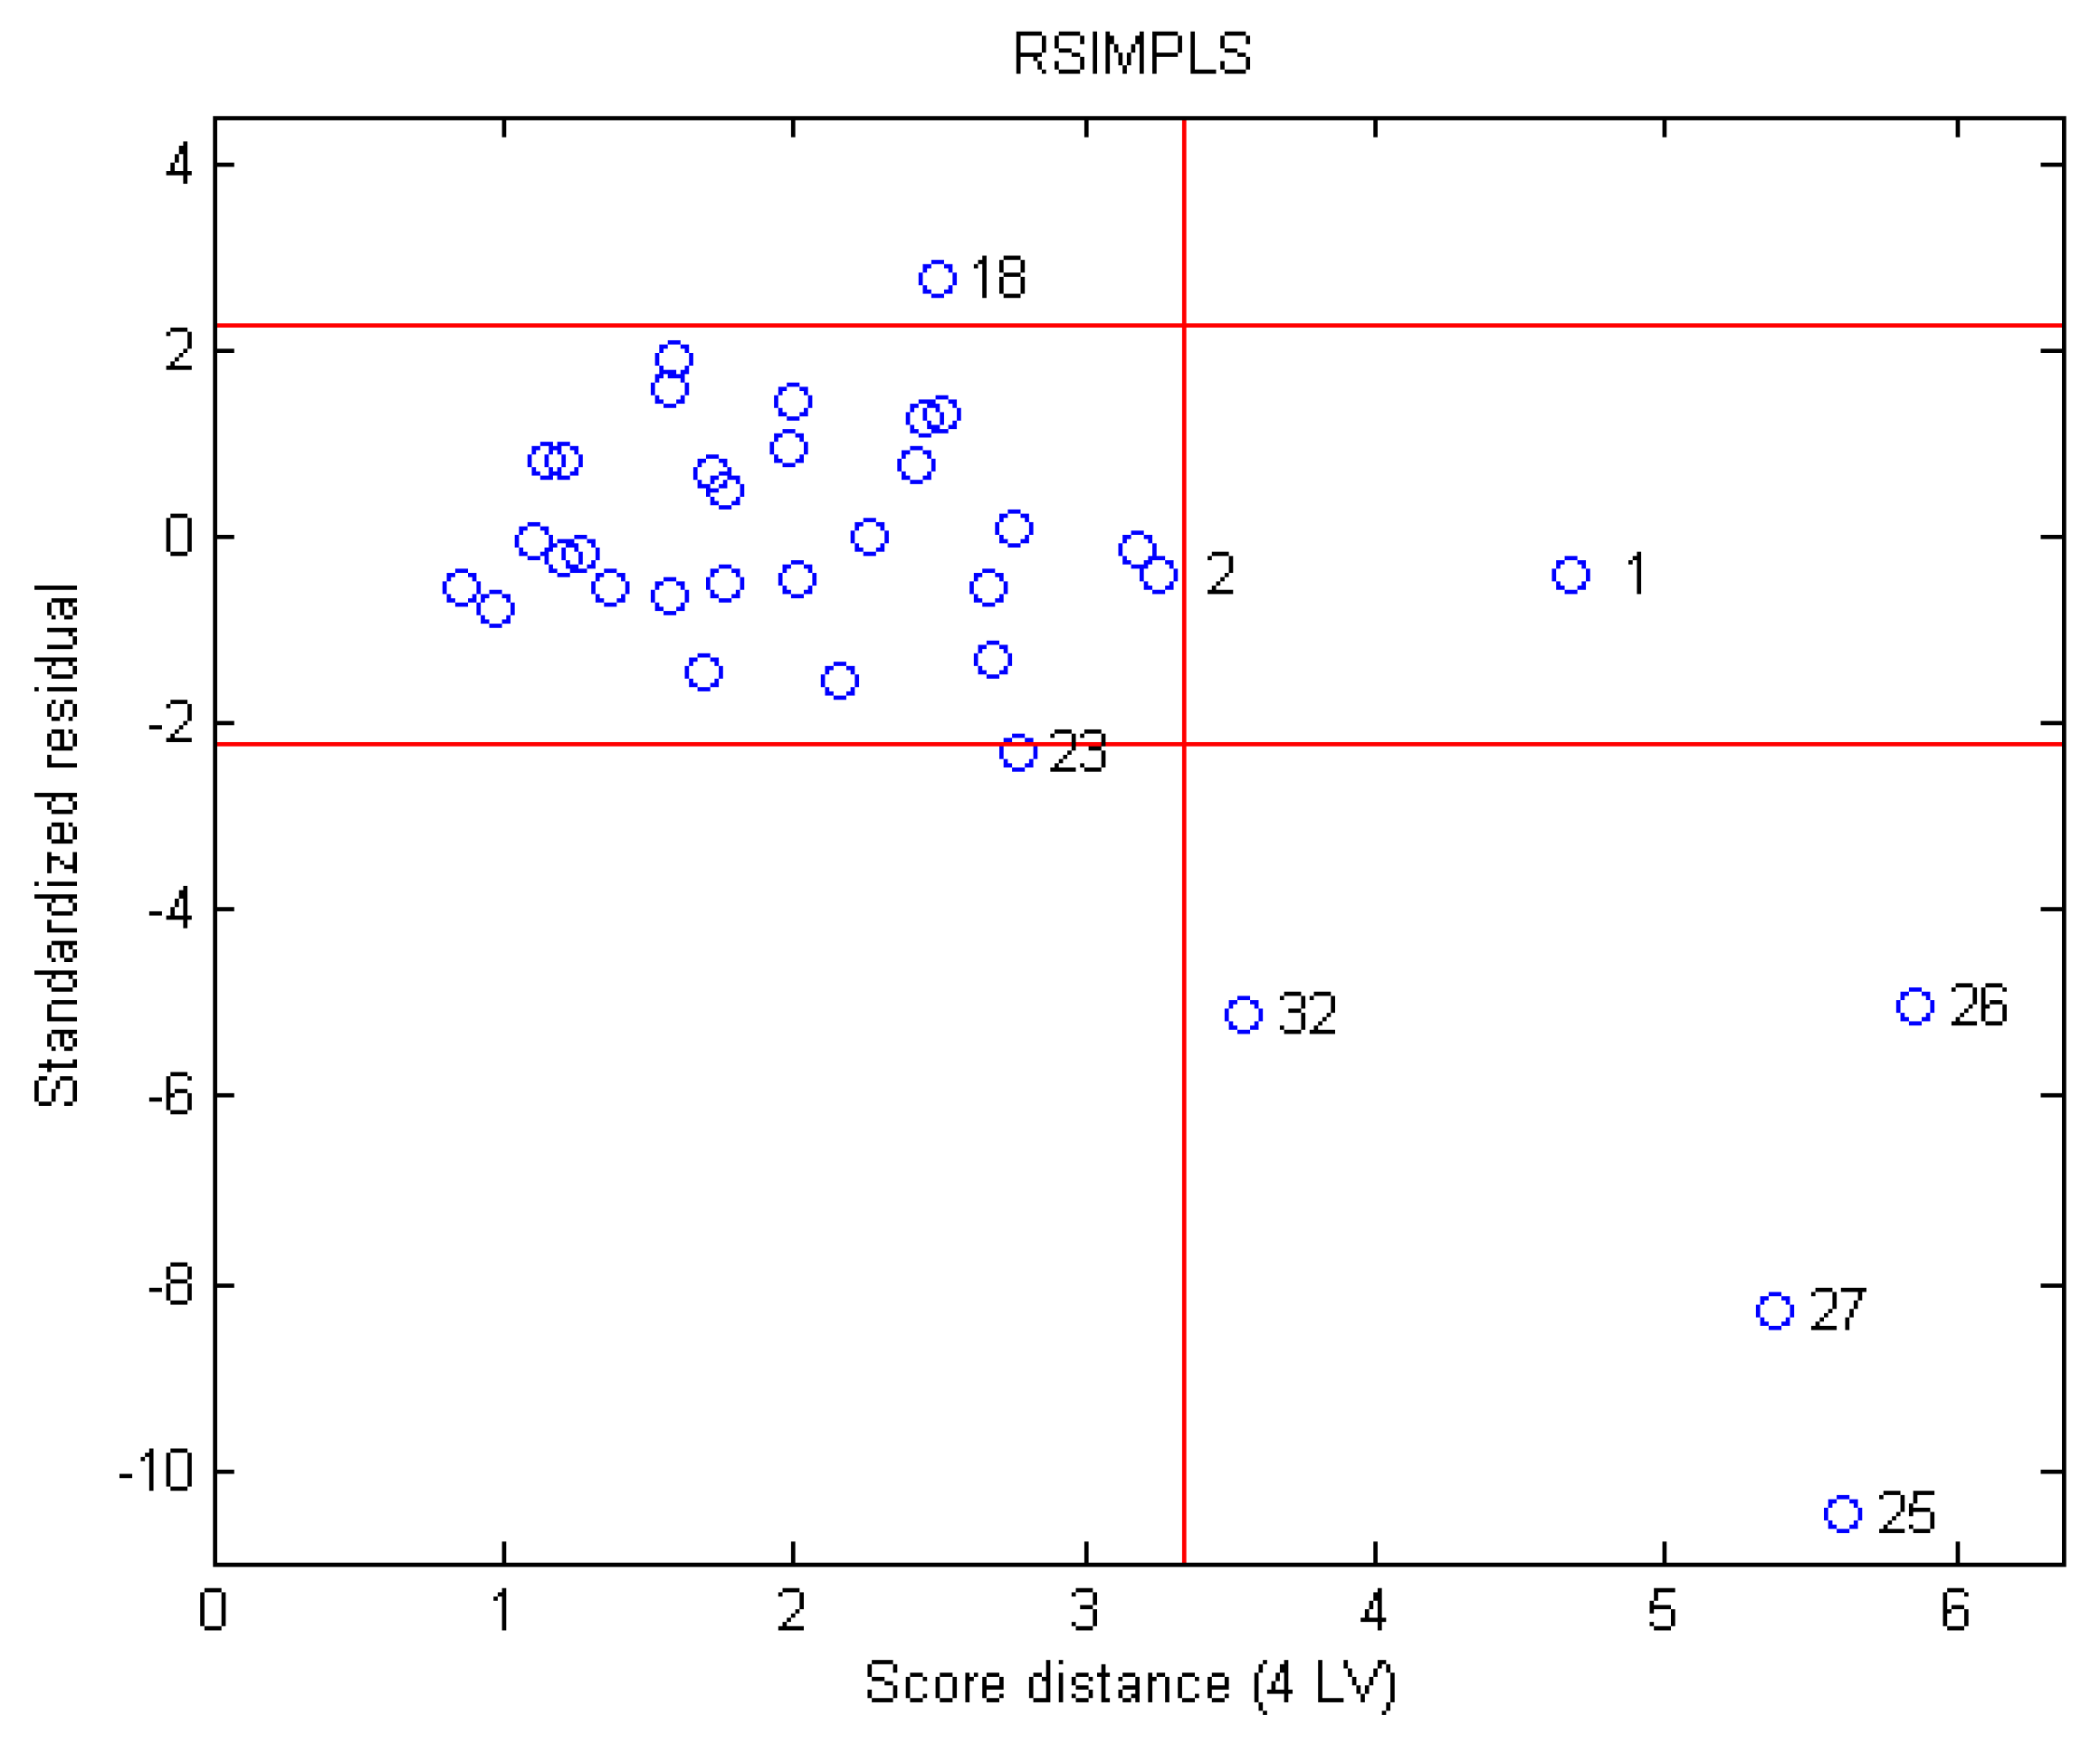
Outlier Detection
2.5.2. Comparison to Other Models
3. Results and Discussion
3.1. Parameter Optimization for RPLS

3.2. Outlier Detection
3.3. Bitterness Predictor Constructed Using RPLS
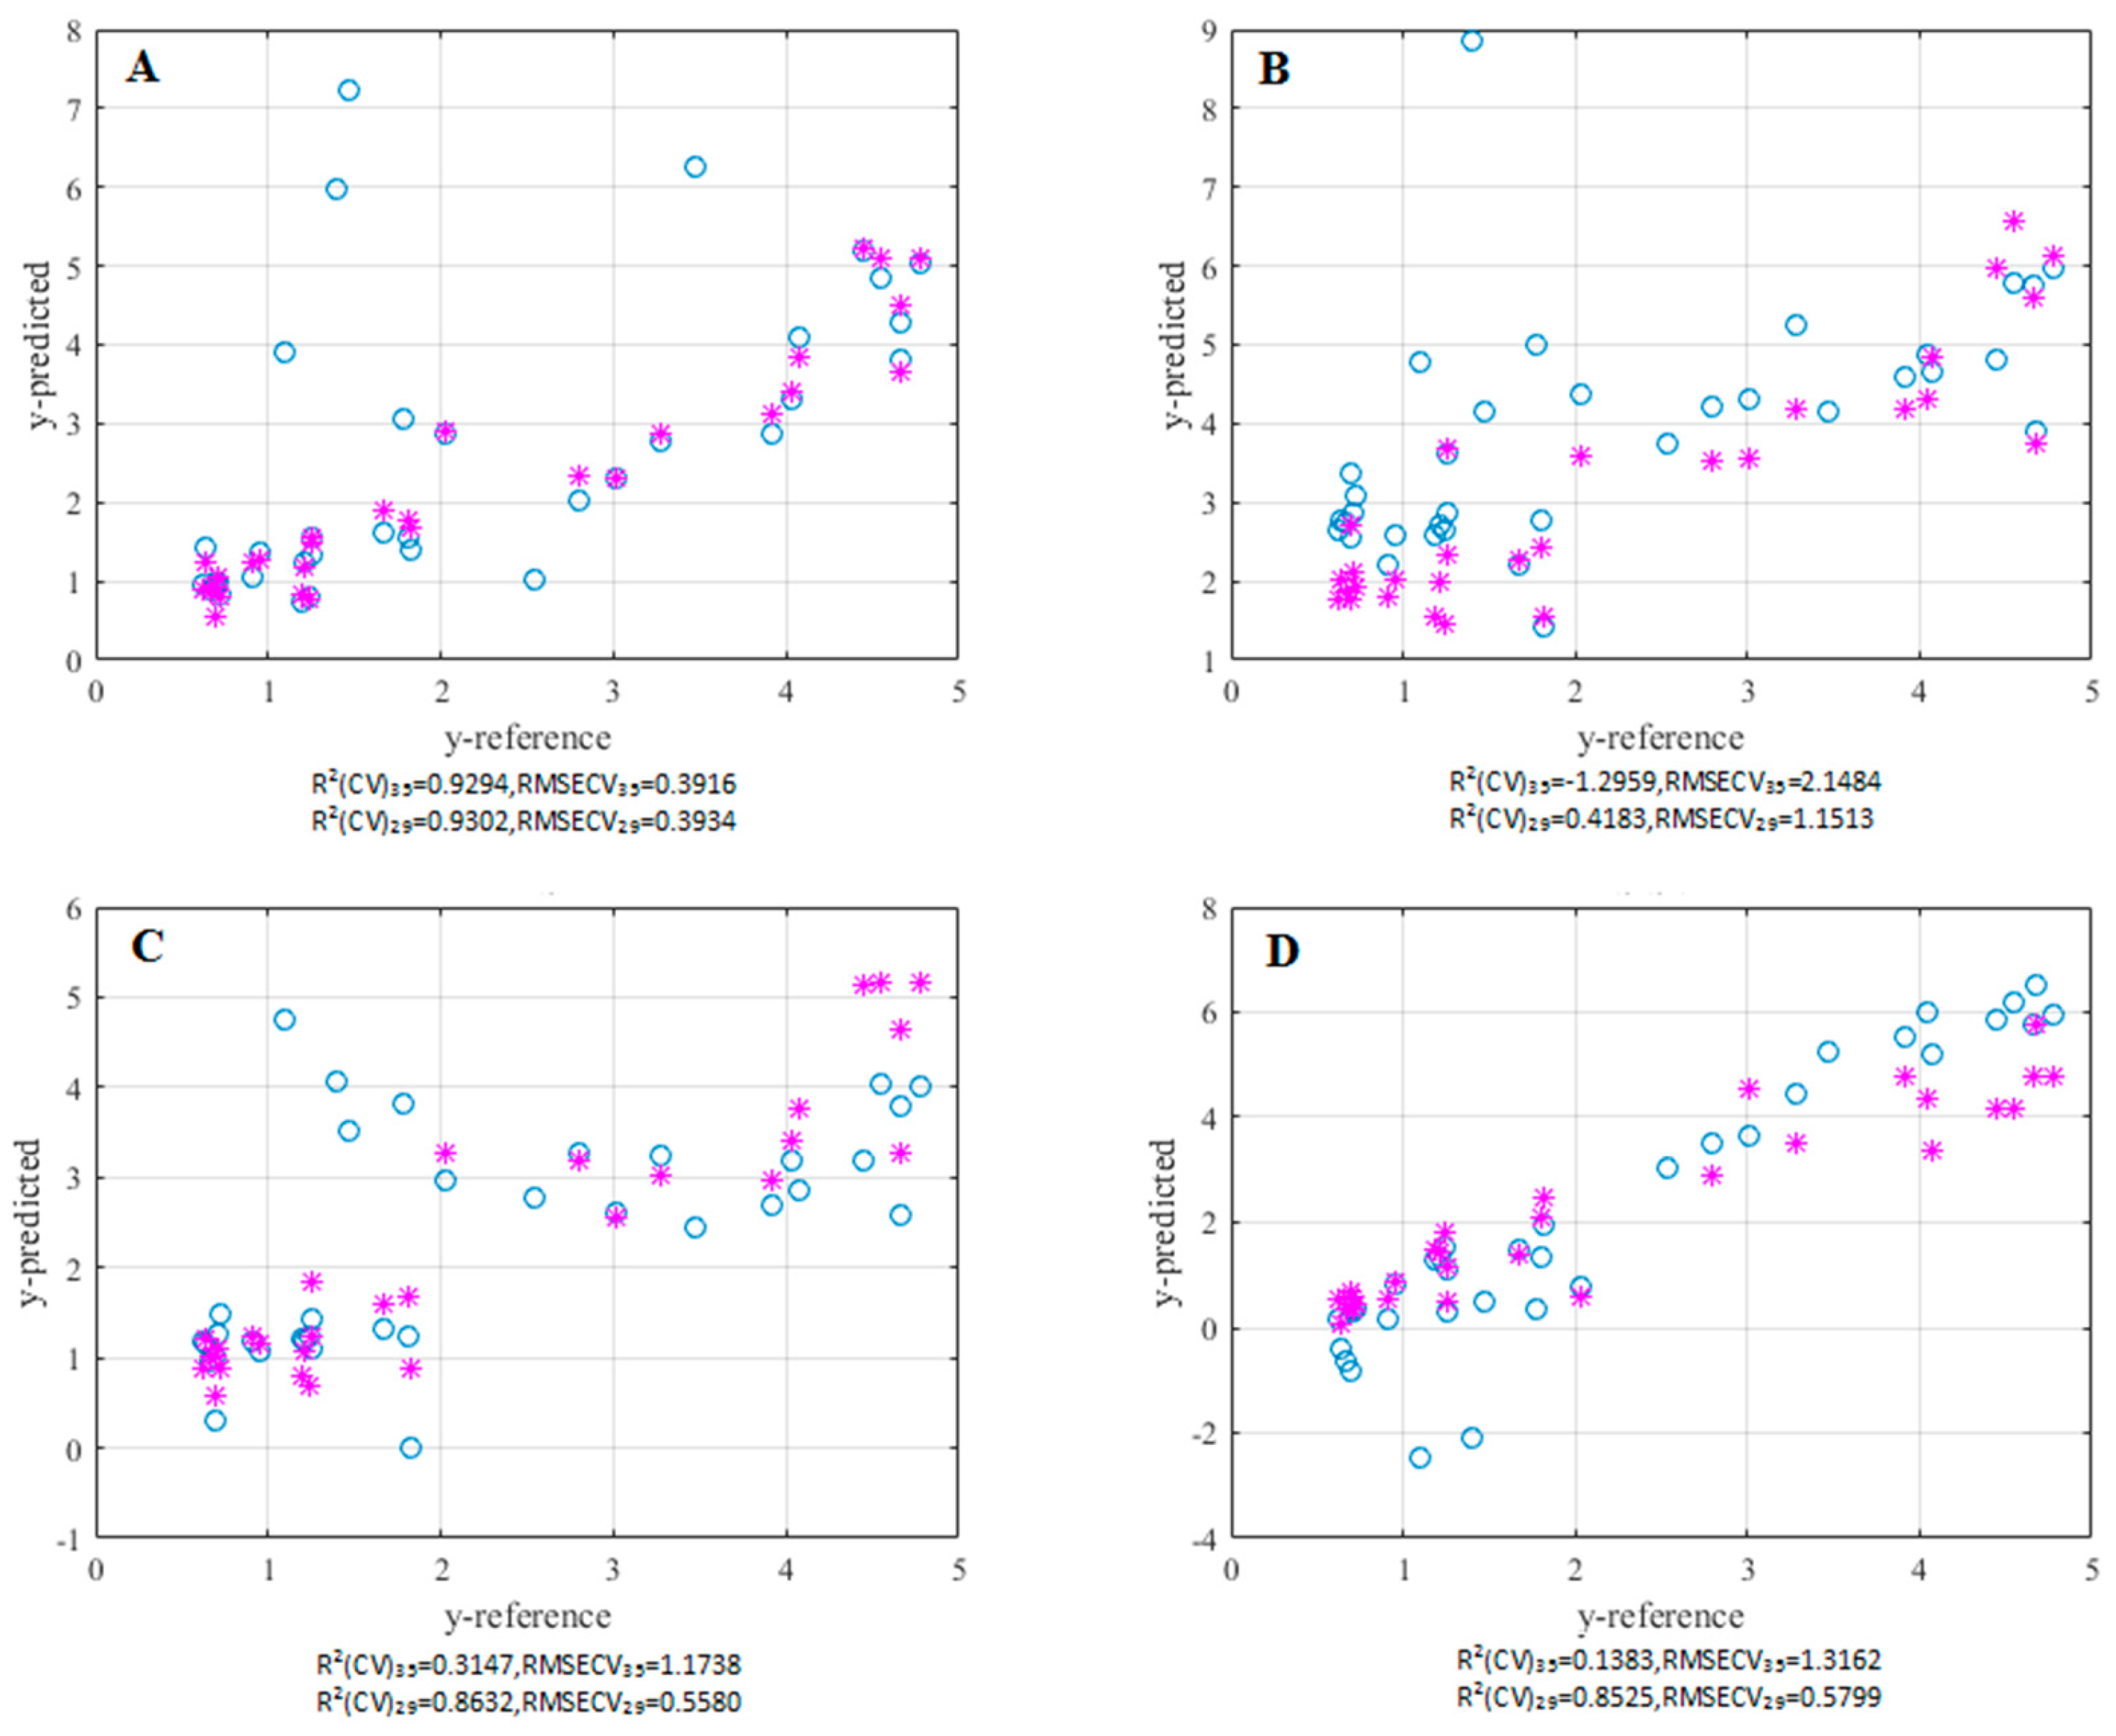
3.4. Comparisons with Other Modeling Methods and Between Pre-Screening and Post-Screening Models
3.4.1. MLR
3.4.2. PLS
3.4.3. LSSVM
4. Conclusions
Acknowledgments
Author Contributions
Conflicts of Interest
References
- Gupta, H.; Sharma, A.; Kumar, S. E-tongue: A tool for taste evaluation. Recent Pat. Drug Deliv. Formul. 2010, 4, 82–89. [Google Scholar] [CrossRef] [PubMed]
- Li, L.; Naini, V.; Ahmed, S.U. Utilization of a modified special-cubic design and an electronic tongue for bitterness masking formulation optimization. J. Pharm. Sci. 2007, 96, 2723–2734. [Google Scholar] [CrossRef] [PubMed]
- Ishizaka, T.; Miyanaga, Y.; Mukai, J.; Asaka, K.; Nakai, Y.; Tsuji, E.; Uchida, T. Bitterness evaluation of medicines for pediatric use by a taste sensor. Chem. Pharm. Bull. 2004, 52, 943–948. [Google Scholar] [CrossRef] [PubMed]
- Sipos, L.; Kovács, Z.; Sági-Kiss, V.; Csiki, T.; Kókai, Z.; Fekete, A.; Héberger, K. Discrimination of mineral waters by electronic tongue, sensory evaluation and chemical analysis. Food Chem. 2012, 135, 2947–2953. [Google Scholar] [CrossRef] [PubMed]
- Thi, T.H.H.; Morel, S.; Ayouni, F.; Flament, M.P. Development and evaluation of taste-masked drug for paediatric medicines—Application to acetaminophen. Int. J. Pharm. 2012, 434, 235–242. [Google Scholar]
- Albert, K.J.; Lewis, N.S.; Schauer, C.L.; Sotzing, G.A.; Stitzel, S.E.; Vaid, T.P.; Walt, D.R. Cross-Reactive Chemical Sensor Arrays. Chem. Rev. 2000, 100, 2595–2626. [Google Scholar] [CrossRef] [PubMed]
- Winquist, F.; Wide, P.; Lundström, I. An electronic tongue based on voltammetry. Anal. Chim. Acta. 1997, 357, 21–31. [Google Scholar] [CrossRef]
- Takagi, S.; Toko, K.; Wada, K.; Ohki, T. Quantification of suppression of bitterness using an electronic tongue. J. Pharm. Sci. 2001, 90, 2042–2048. [Google Scholar] [CrossRef] [PubMed]
- Ito, M.; Ikehama, K.; Yoshida, K.; Haraguchi, T.; Yoshida, M.; Wada, K.; Uchida, T. Bitterness prediction of H 1-antihistamines and prediction of masking effects of artificial sweeteners using an electronic tongue. Int. J. Pharm. 2013, 441, 121–127. [Google Scholar] [CrossRef] [PubMed]
- Baldwin, E.A.; Bai, J.; Plotto, A.; Dea, S. Electronic noses and tongues: Applications for the food and pharmaceutical industries. Sensors 2011, 11, 4744–4766. [Google Scholar] [CrossRef] [PubMed]
- Polshin, E.; Rudnitskaya, A.; Kirsanov, D.; Legin, A.; Saison, D.; Delvaux, F.; Delvaux, F.R.; Nicolaï, B.M.; Lammertyn, J. Electronic tongue as a screening tool for rapid analysis of beer. Talanta 2010, 81, 88–94. [Google Scholar] [CrossRef] [PubMed]
- Peris, M.; Escuder-Gilabert, L. On-line monitoring of food fermentation processes using electronic noses and electronic tongues: A review. Anal. Chim. Acta. 2013, 804, 29–36. [Google Scholar] [CrossRef] [PubMed]
- Zakaria, A.; Shakaff, A.Y.M.; Masnan, M.J.; Ahmad, M.N.; Adom, A.H.; Jaafar, M.N.; Ghani, S.A.; Abdullah, A.H.; Aziz, A.H.A.; Kamarudin, L.M.; et al. A biomimetic sensor for the classification of honeys of different floral origin and the detection of adulteration. Sensors 2011, 11, 7799–7822. [Google Scholar] [CrossRef] [PubMed]
- Escuder-Gilabert, L.; Peris, M. Review: Highlights in recent applications of electronic tongues in food analysis. Anal. Chim. Acta. 2010, 665, 15–25. [Google Scholar] [CrossRef] [PubMed]
- Major, N.; Marković, K.; Krpan, M.; Šarić, G.; Hruškar, M.; Vahčić, N. Rapid honey characterization and botanical classification by an electronic tongue. Talanta 2011, 85, 569–574. [Google Scholar] [CrossRef] [PubMed]
- Zakaria, N.Z.I.; Masnan, M.J.; Zakaria, A.; Shakaff, A.Y.M. A bio-inspired herbal tea flavour assessment technique. Sensors 2014, 14, 12233–12255. [Google Scholar] [CrossRef] [PubMed]
- Zhao, G.; Lin, X.; Dou, W.; Tian, S.; Deng, S.; Shi, J. Use of the smart tongue to monitor mold growth and discriminate between four mold species grown in liquid media. Anal. Chim. Acta. 2011, 690, 240–247. [Google Scholar] [CrossRef] [PubMed]
- Xu, M.; Yang, S.; Peng, W.; Liu, Y.; Xie, D.; Li, X.; Wu, C. A Novel Method for the Discrimination of Semen Arecae and Its Processed Products by Using Computer Vision, Electronic Nose, and Electronic Tongue. Evid. Based Complement. Alternat. Med. 2015, 2015. [Google Scholar] [CrossRef] [PubMed]
- Wu, L.; Luo, D.; Shao, Y.; Li, J. Research on distinguish of Chinese herbal medicine based on electronic tongue technology. Transducer Microsyst. Technol. 2012, 31, 48–50. [Google Scholar]
- Li, W.M.; Wu, C.J.; Ai, L. The Prospect of Making the Characters and Odor of Chinese Materia Medica Express Objectivly Based on Electronic Nose and Electronic Tongue. Chin. Tradit. Patent Med. 2009, 31, 282–284. [Google Scholar]
- Zhong, L.; Wang, Y.; Yang, S.; Li, L.; Liu, Y.; Huang, Q. Connection of Stewing Rehmanniae Radix with Wine and Its “Taste”. Chin. Tradit. Patent Med. 2015, 37, 1041–1044. [Google Scholar]
- Li, X.; Li, H.; Liu, R.; Zhang, X.; Qiu, J.; Wu, Z. Study on Application of Electronic Tongue in the Evaluation of Taste-Masking Effect of Pharmaceutical Formulation. World Sci. Technol. Mod. Tradit. Chin. Med. 2013, 7, 1532–1537. [Google Scholar]
- Wang, Y.; Feng, Y.; Wu, Y.; Liang, S.; Xu, D. Sensory Evaluation of the Taste of Berberine Hydrochloride Using an Electronic Tongue. Fitoterapia 2013, 86, 137–143. [Google Scholar] [CrossRef] [PubMed]
- Wang, J.; Xiao, H. Discrimination of different white chrysanthemum by electronic tongue. J. Food Sci. Technol. 2013, 50, 986–992. [Google Scholar] [CrossRef] [PubMed]
- Newman, J.; Egan, T.; Harbourne, N.; Jacquier, J.C. Correlation of sensory bitterness in dairy protein hydrolysates: Comparison of prediction models built using sensory, chromatographic and electronic tongue data. Talanta 2014, 126, 46–53. [Google Scholar] [CrossRef] [PubMed]
- Domínguez, R.B.; Moreno-Barón, L.; Muñoz, R.; Gutiérrez, J.M. Voltammetric electronic tongue and support vector machines for identification of selected features in Mexican coffee. Sensors 2014, 14, 17770–17785. [Google Scholar]
- Liu, R.; Zhang, X.; Zhang, L.; Gao, X.; Li, H.; Shi, J.; Li, X. Bitterness intensity prediction of berberine hydrochloride using an electronic tongue and a GA-BP neural network. Exp. Ther. Med. 2014, 7, 1696–1702. [Google Scholar] [CrossRef] [PubMed]
- Wu, R.; Zhao, J.; Chen, Q.; Huang, X. Quality assessment of green tea taste by using electronic tongue. Trans. Chin. Soc. Agric. Eng. 2011, 27, 378–381. [Google Scholar]
- Verboven, S.; Hubert, M. Matlab library LIBRA. Wiley Interdiscip. Rev. Comput. Stat. 2010, 2, 509–515. [Google Scholar] [CrossRef]
- Verboven, S.; Hubert, M. LIBRA: A MATLAB library for robust analysis. Chemometr. Intell. Lab. Syst. 2005, 75, 127–136. [Google Scholar] [CrossRef]
- Leuven University, Leuven, Belgium, RSIMPLS Toolbox. Available online: http://wis.kuleuven.be/stat/robust/LIBRA/ (accessed on 23 January 2016).
- LS-SVMlab Toolbox. Available online: http://www.esat.kuleuven.be/sista/lssvmlab/ (accessed on 23 January 2016).
© 2016 by the authors; licensee MDPI, Basel, Switzerland. This article is an open access article distributed under the terms and conditions of the Creative Commons by Attribution (CC-BY) license (http://creativecommons.org/licenses/by/4.0/).
Share and Cite
Lin, Z.; Zhang, Q.; Liu, R.; Gao, X.; Zhang, L.; Kang, B.; Shi, J.; Wu, Z.; Gui, X.; Li, X. Evaluation of the Bitterness of Traditional Chinese Medicines using an E-Tongue Coupled with a Robust Partial Least Squares Regression Method. Sensors 2016, 16, 151. https://doi.org/10.3390/s16020151
Lin Z, Zhang Q, Liu R, Gao X, Zhang L, Kang B, Shi J, Wu Z, Gui X, Li X. Evaluation of the Bitterness of Traditional Chinese Medicines using an E-Tongue Coupled with a Robust Partial Least Squares Regression Method. Sensors. 2016; 16(2):151. https://doi.org/10.3390/s16020151
Chicago/Turabian StyleLin, Zhaozhou, Qiao Zhang, Ruixin Liu, Xiaojie Gao, Lu Zhang, Bingya Kang, Junhan Shi, Zidan Wu, Xinjing Gui, and Xuelin Li. 2016. "Evaluation of the Bitterness of Traditional Chinese Medicines using an E-Tongue Coupled with a Robust Partial Least Squares Regression Method" Sensors 16, no. 2: 151. https://doi.org/10.3390/s16020151
APA StyleLin, Z., Zhang, Q., Liu, R., Gao, X., Zhang, L., Kang, B., Shi, J., Wu, Z., Gui, X., & Li, X. (2016). Evaluation of the Bitterness of Traditional Chinese Medicines using an E-Tongue Coupled with a Robust Partial Least Squares Regression Method. Sensors, 16(2), 151. https://doi.org/10.3390/s16020151