
Smart Pipe System for a Shipyard 4.0

 ,
, 
 ,
,
Abstract
:1. Introduction
- Naval Command, Control, Communications, Computers, Intelligence, Surveillance and Reconnaissance (C4ISR) capabilities will be impacted by the development of a number of technologies based on the information extracted from the emerging data.
- Curved 3D organic light emitting diode (OLED) displays will be supported by form factors that take advantage of capabilities such as voice, handwriting, touch, gesture, eye movement, or even brain control. Designers will be able to interact with their designs without a keyboard or mouse, Human-Computer Interfaces (HCI) will encourage innovation and efficient design workflow. Such interfaces will be able to support more natural modes of interaction and will be more intuitive and therefore easier to operate, reducing the need for training.
- Data obtained from remote sensing and intelligent algorithms will accelerate the ship design process, and 2D design will be easily converted into 3D.
- Complex construction and inspection tasks will be supported by augmented reality.
- Graphene strips, with allocated sensors alongside the hull, will provide more accurate data about the hull’s working conditions. These will monitor external (seawater temperature, impacts, and fouling) and internal factors (stresses, microbial induced corrosion, and bending). This information will enable a new approach called Hull-Skin-Data centered decisions that would be adopted according to those working parameters.
- An increasing number of embedded sensors will be fitted to pipes so that new laser technologies and robotics can speed up the cutting process. Adaptable hull forms will be developed to tackle better different speed profiles and changing load conditions. Robots will also control the curvature of materials more precisely, thus offering optimal hull form. Moreover, a ballast free design will be further developed to reduce the transfer of marine invasive species across different waters.
- Instead of leaving the majority of outfitting tasks until the moment after launching, some outfitting, such as piping and heavy machinery, will be developed together with the hull structure speeding up the building process.
- Progressive sensorization process will enable automated casting, forging, rolling, cutting, welding or cleaning [4].
- Time spent on the outfitting along the quay will be minimized. Robotics will capture 3D images throughout the vessel and will establish a reference dataset to support real-time ship operations and life maintenance.
- Enhanced crane-lifting capabilities will speed up production time.
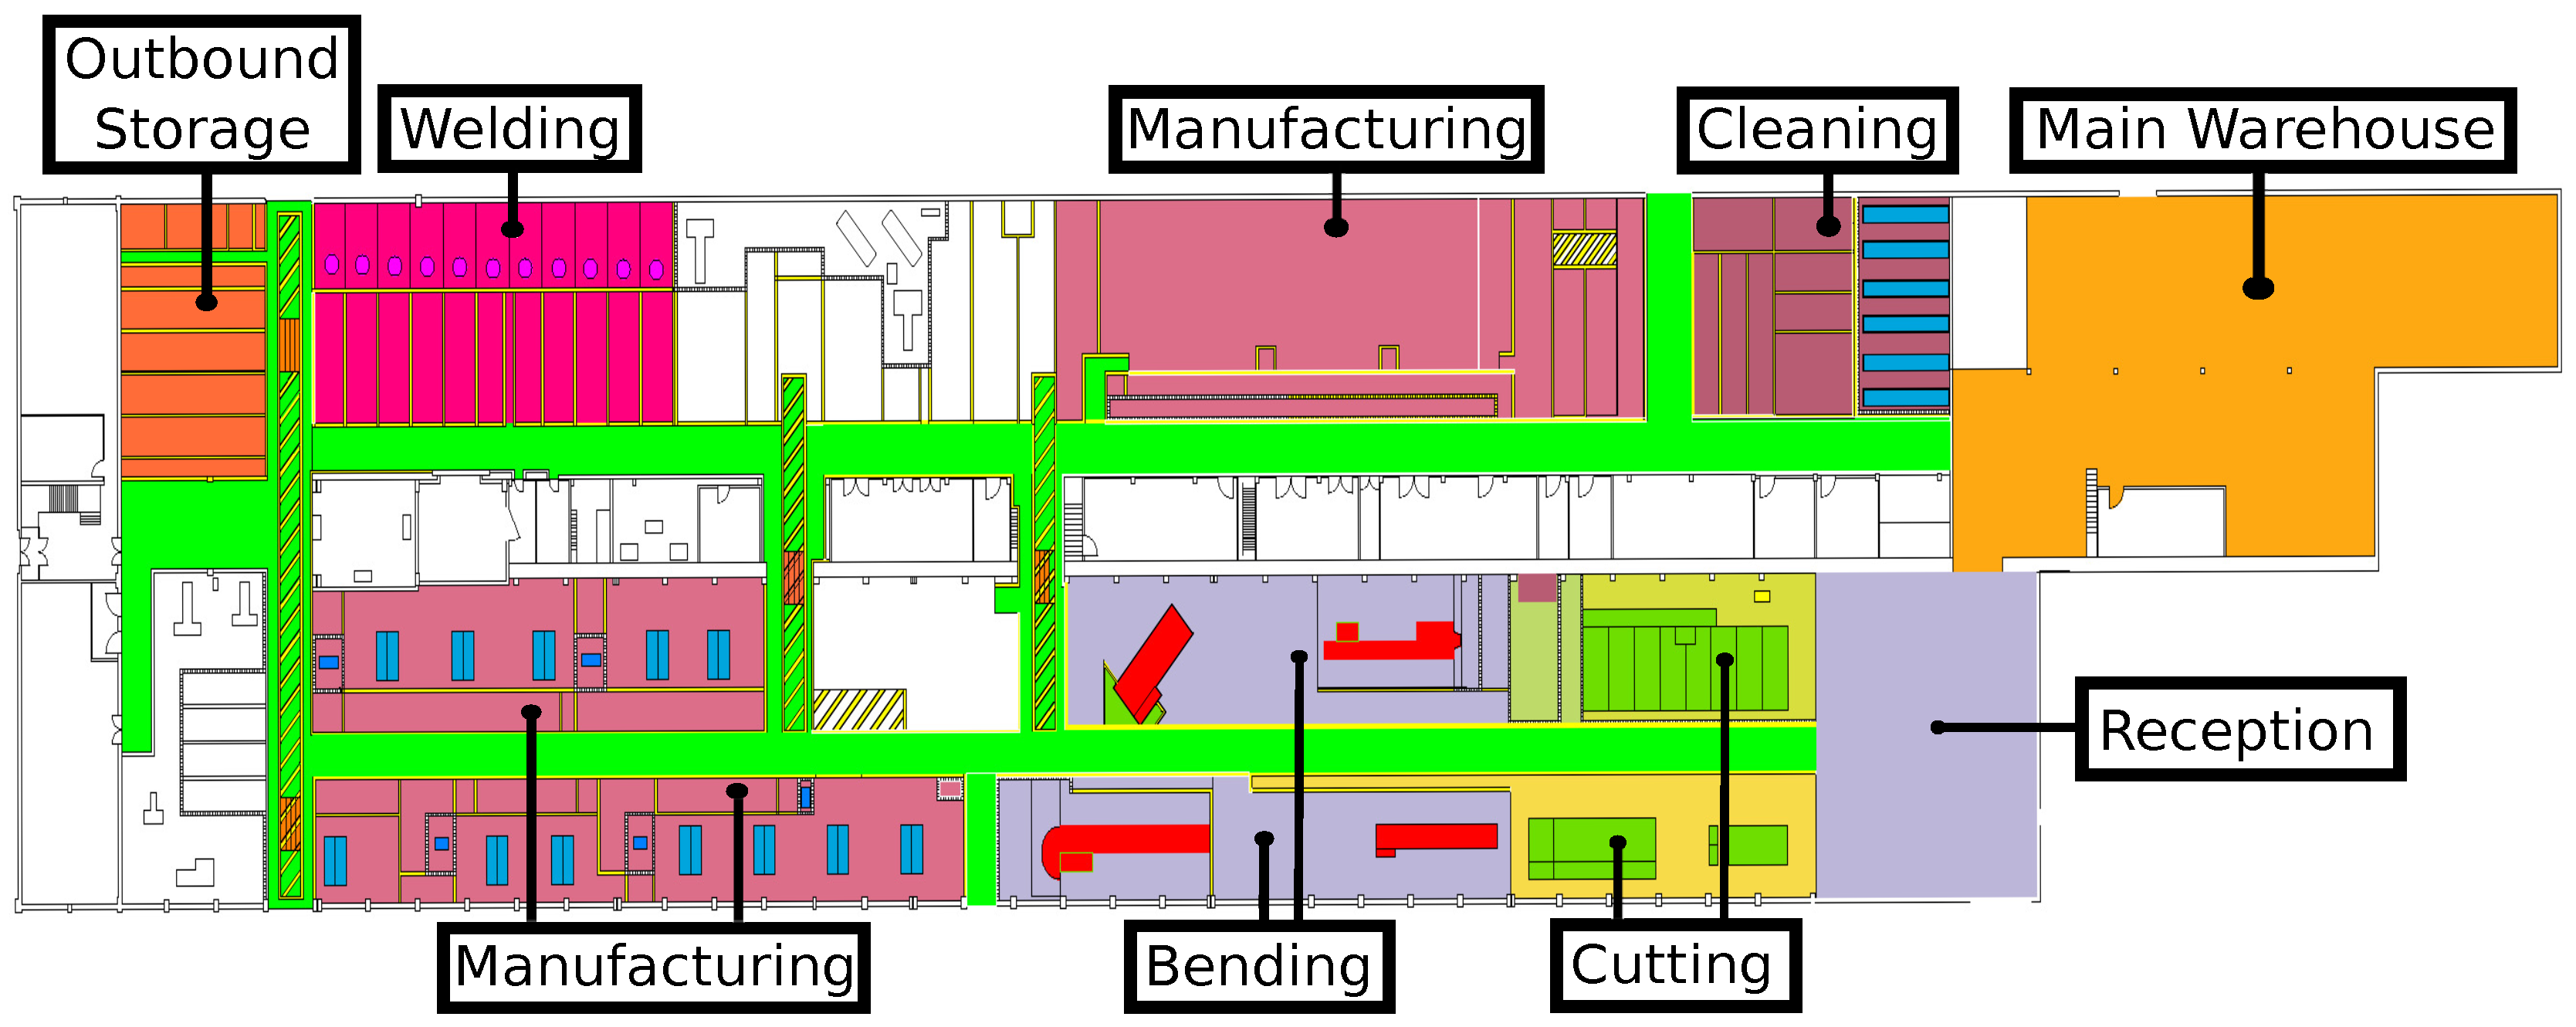
- Pipe reception. In this area raw pipes are stacked by the suppliers. It is divided into two different areas: small pipes are stored in a robotic storage, while large pipes are placed on the floor on diverse spots.
- Cutting. This is where pipes are cut according to the engineering requirements.
- Bending. Some pipes need to be bent to adapt them to the characteristics of the place where they will be installed on the ship.
- Manufacturing. These are actually three areas of the workshop where operators add accessories and where pipes made of multiple sub-pipes are joined.
- Provider’s outbound storage. In times of excessive production load, some is derived to external providers. The outbound storage area is where providers collect the pipes and return them after their processing.
- Welding. There are different booths where operators carry out welding tasks.
- Cleaning. Before manufacturing, pipes have to be cleaned. This area contains bathtubs to expose pipes to hot water, acids, or pressurized water.
- Main warehouse. This is where accessories and tool supplies are stored.
- It presents the concept of Shipyard 4.0, which consists in the application of the principles of Industry 4.0 to a shipyard.
- It describes in detail how a shipyard pipe workshop works and what are the requirements for building a smart pipe system.
- The paper indicates how to build a positioning system from scratch in an environment as harsh in terms of communications as a shipyard. Furthermore, it was not found in the literature any practical analysis on the application of RFID technology in any similar application and scenario.
- It defines the concept of smart pipe and shows an example of its implementation and the architecture that supports it.
- The article proposes the use of spatial diversity techniques to stabilize Received Signal Strength (RSS) values, a kind of technique whose application in RFID systems has not been found in the literature.
2. Related Work
2.1. Pipe Manufacturing in a Modern Shipyard
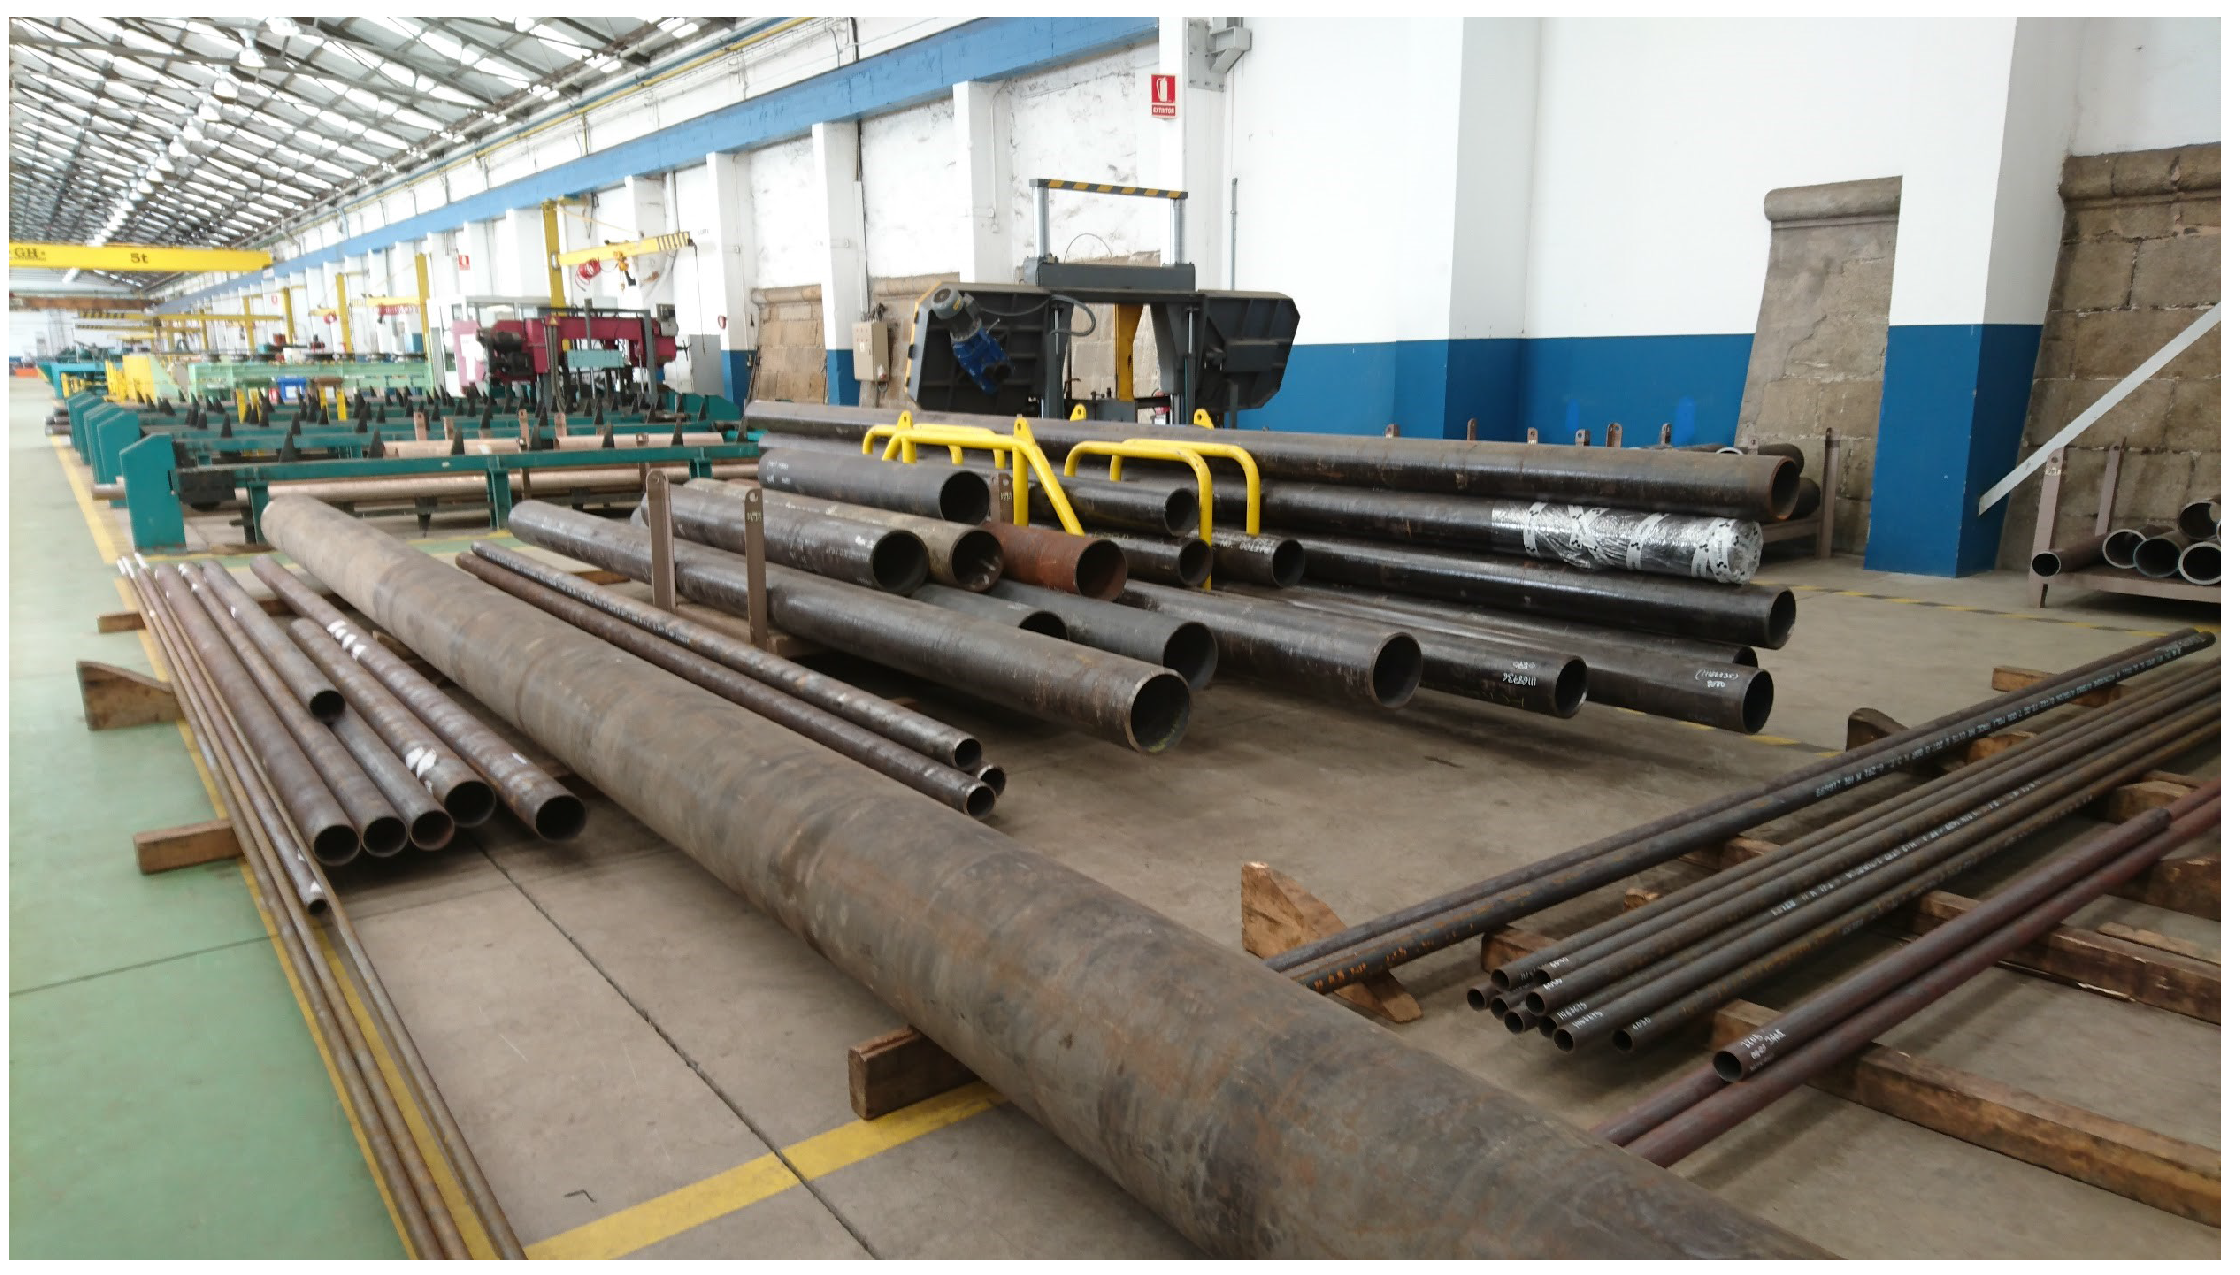
- Initially, pipes are placed in a storage area, where they will be collected by operators according to production needs. In the case of the shipyard that Navantia owns in Ferrol, two zones can be distinguished: one for small pipes and another for the large ones. The area for small pipes is an intelligent warehouse where an operator registers the pipes that arrive and then extracts them on demand according to the characteristics specified. Figure 2 shows the stacking area for large pipes, whose occupancy level is not determined automatically.
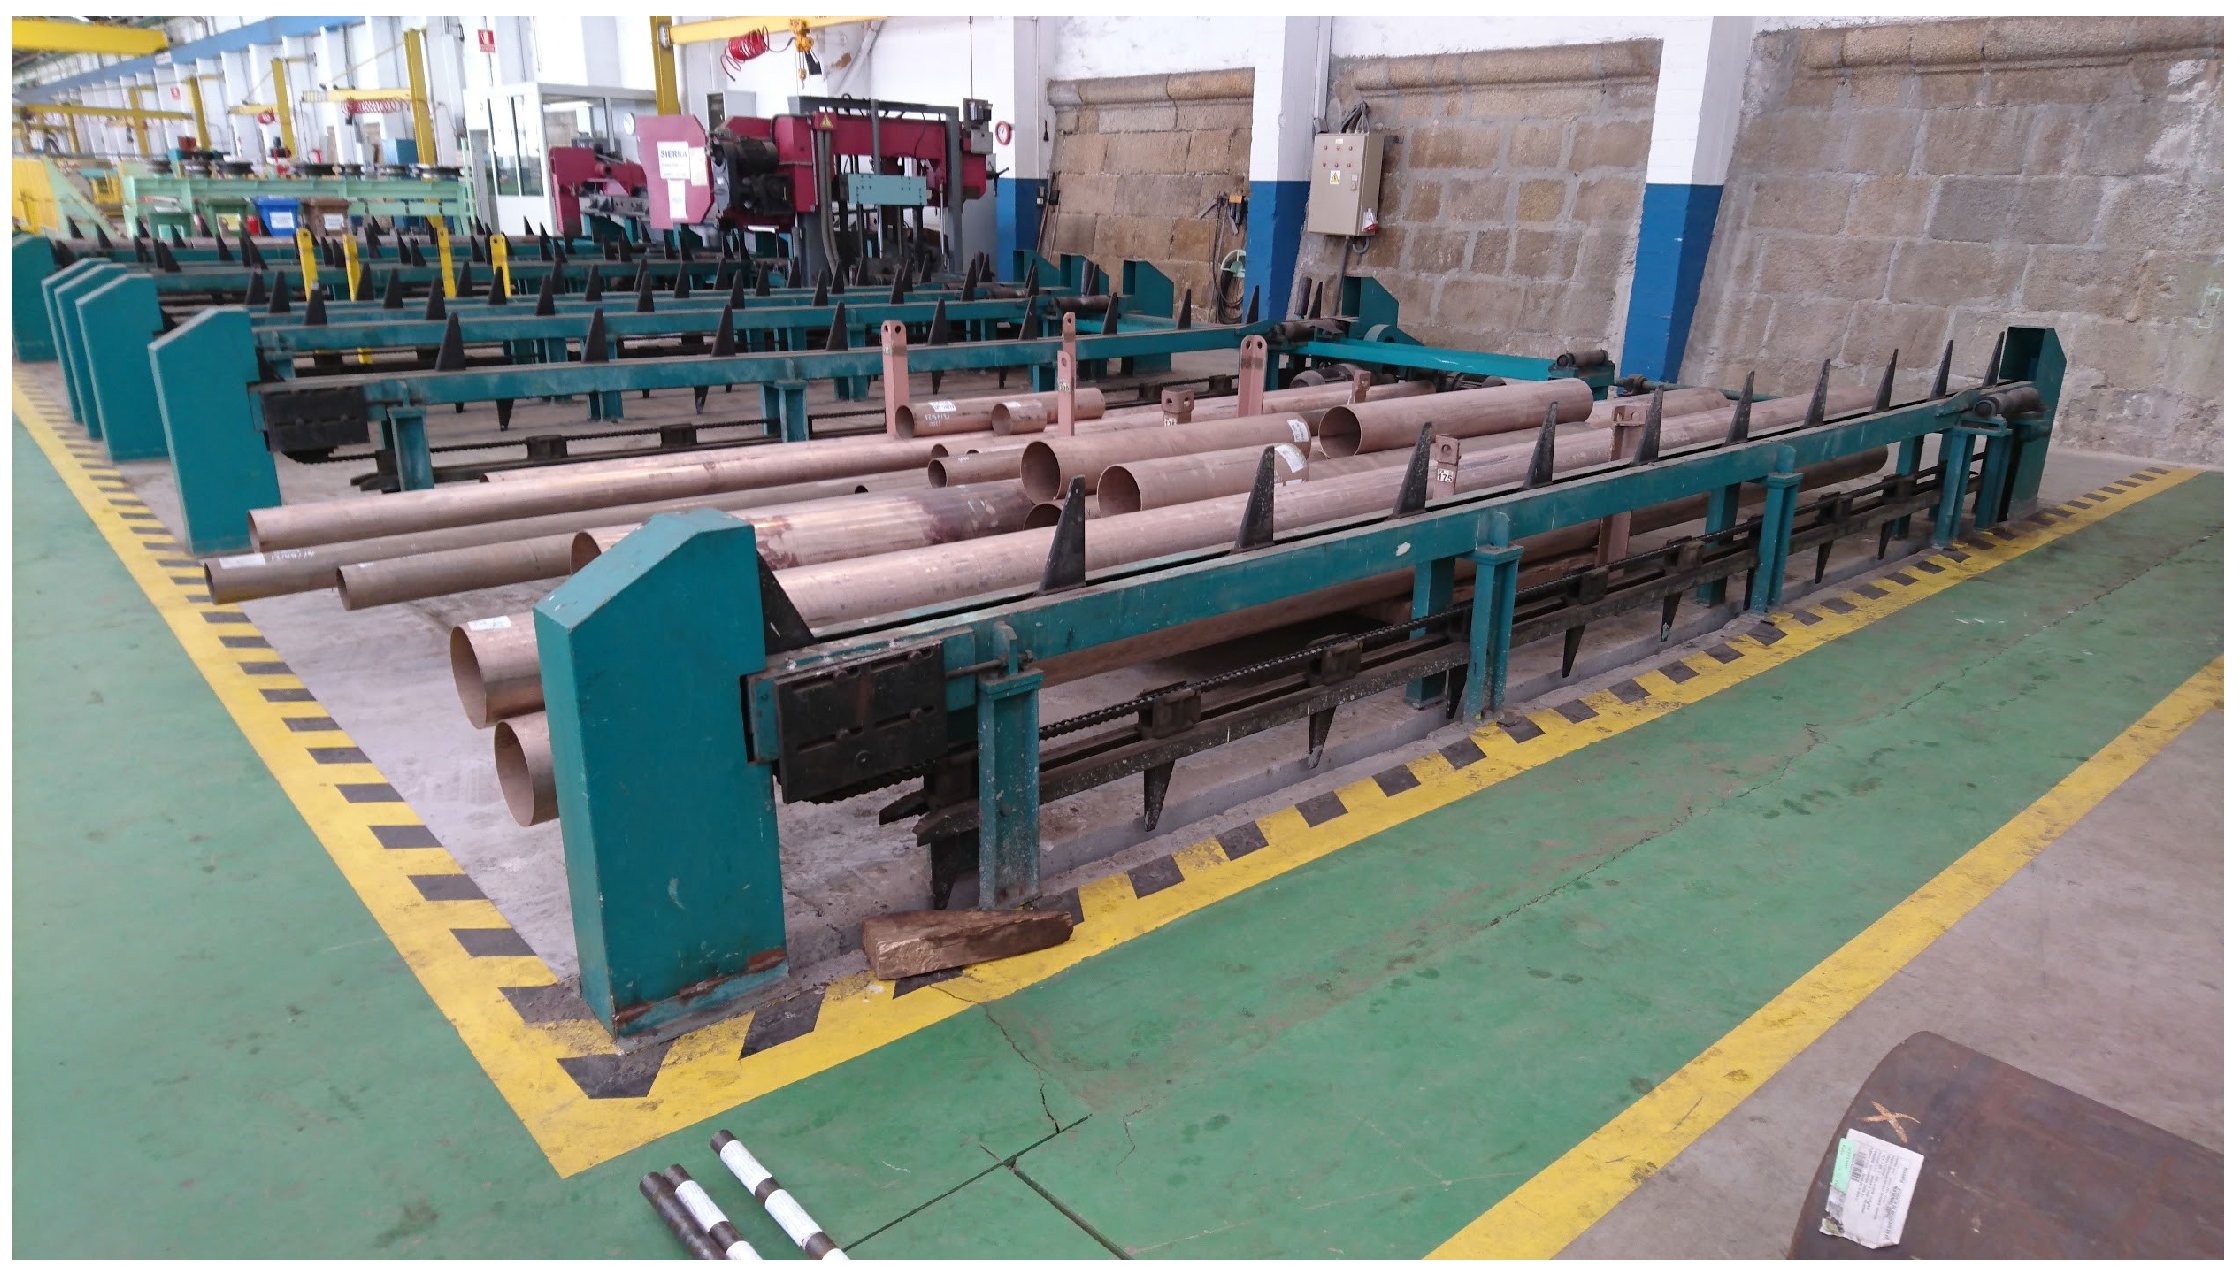
- The first pipe processing point is the cutting area (in Figure 3). In production, as soon as the first cut of a pipe is made, operators place a plastic label that is attached using electric cable (this kind of cable is used because it has to resist being exposed to acids and hot water). This label contains alphanumeric identification information and includes a barcode. Pipes are stacked on pallets, which allow for moving them easily between the different stages of the production chain. Regarding such pallets, it is important to note that:
- Operators distinguish visually each pallet through an identifier painted on it.
- Pallets are moved by cranes through the workshop. They are not usually moved until they are considered to be full. When a pallet is moved to a new section, pipes are checked by operators who, by reading the label barcode with a scanner, get information on the process that should be carried out on the pipe. At the same time, the barcode reading operation allows for registering its location, since every scanner is associated with a specific place.
- Each pallet carries paper documentation related to the pipes contained.
- The second stage of the pipes is bending (if it is required). There are three benders in the workshop, which can be controlled from a Windows-based PC that is also able to receive and load design files from the engineering department.
- Before manufacturing, pipes might need to be cleaned. For such a purpose, there is an area for degreasing and rinsing pipes by using water or certain acids.
- Next, pipes are moved to the manufacturing area, where accessories are added. These elements are transported in metal pallets from the workshop warehouse. There is not a quick communication between the warehouse and manufacturing to indicate when the accessories associated with a pipe are available (i.e., operators have to walk to the warehouse and check the availability of the accessories).
- After manufacturing, pipes are packed with others on pallets. This packaging is registered before the pallet leaves the manufacturing area.
- Large pipes can be stored temporarily in a reserved area located at one end of the workshop. Although there are more stacking areas, both indoors and outdoors, there is no real-time control of the occupancy percentage of the areas (i.e., the number of pipes in them).
- Next to the temporary storage, there is an area of welding stations with plastic separations and other auxiliary areas, mainly dedicated to store pipes.
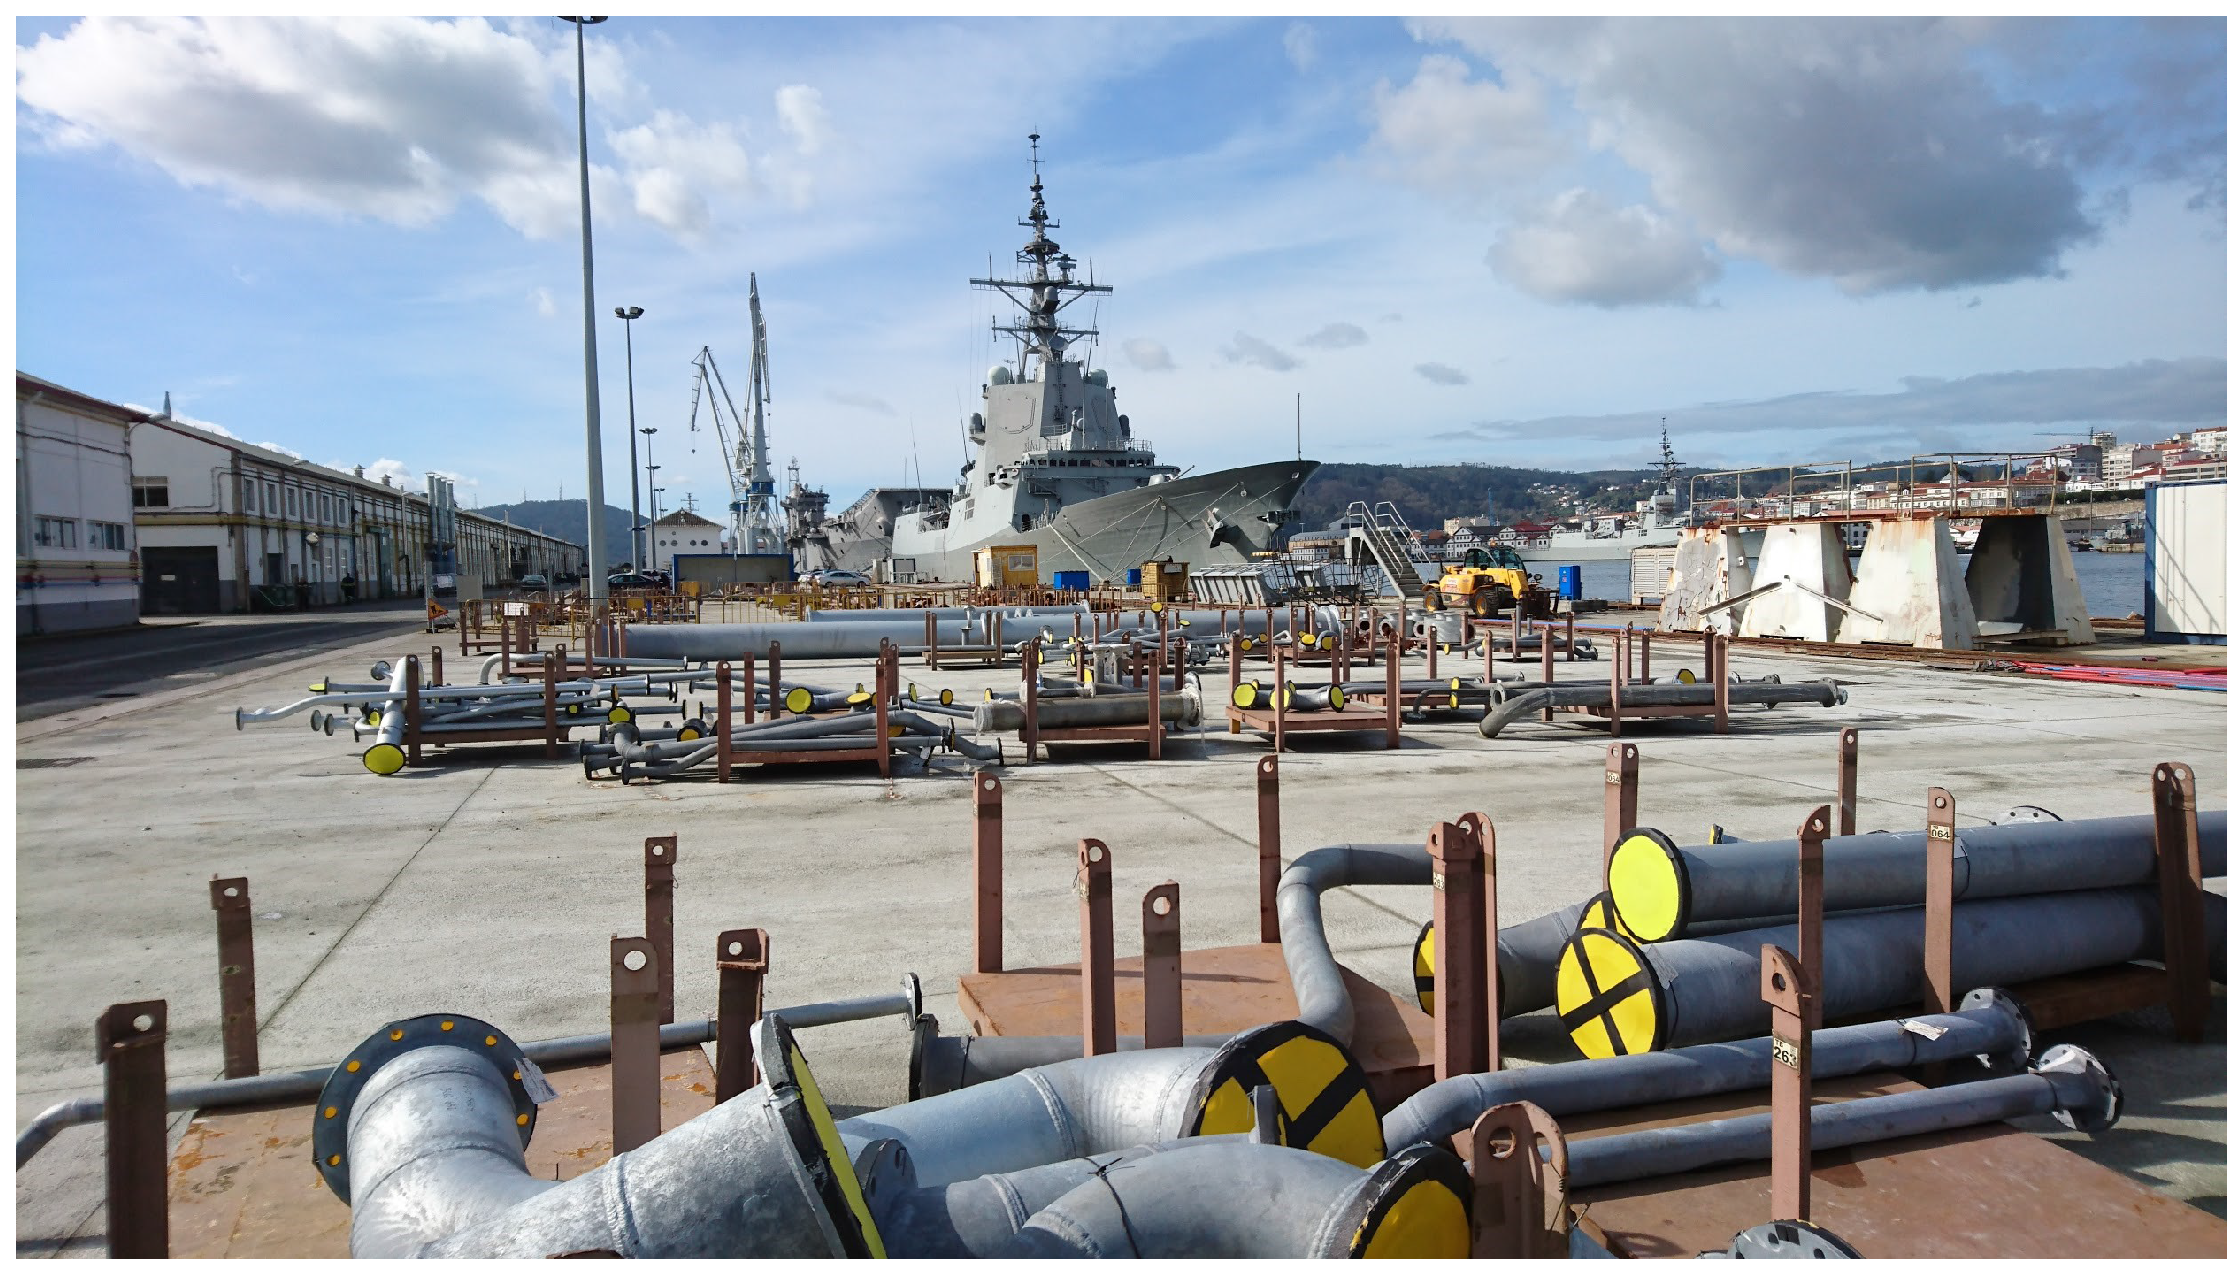
- Once the pallet leaves the production area, the traceability of the pipes is lost, and there are no records of their movements and/or location in the different storage areas. The largest storage area is outdoors, next to the workshop, in a nearby dock (as it is shown in Figure 4).
2.2. Identification, Tracking and Location Systems for Shipyards and Smart Manufacturing
2.3. Technologies for Identifying Pipes
- LF (Low Frequency) RFID. According to the ITU (International Telecommunications Union), the LF band goes between 30 KHz and 300 KHz. Frequency and power in this band are not regulated globally in the same way: most systems operate at 125 KHz, but there are some at 134 KHz. The reading range provided is short (between 1 and 5 cm and, generally, up to 10 cm), so, in practice, LF devices are not usually sensitive to radio interference. The most popular LF RFID applications are access control and animal identification (mainly for pets and livestock). They can be used for communications in harsh environments (presence of metals and liquids) due to their long wavelengths. However, they present low reading speeds and they are not recommended for environments where many tags are together in a small space.
- HF (High Frequency) RFID. Although the HF band goes from 3 MHz to 30 MHz, most systems operate at 13.56 MHz. HF systems can reach a reading distance of up to 1 m (they usually reach roughly 30 cm), what can lead to interference and to the implementation of MAC (Medium-Access Control) mechanisms. This sort of RFID systems is massively used in transportation, payment, ticketing, and access control. HF systems present more interference than LF in unfavorable environments, but they allow for a larger reader range, more speed, and more space for information.
- UHF (Ultra-High Frequency) RFID. The UHF band actually covers from 300 MHz to 3 GHz, but most systems operate in the Industrial, Scientific and Medical (ISM) bands around 860–960 MHz and 2.45 GHz. UHF tags can be easily read at 10 m, so they are ideal for inventory management and item tracking. It has better performance in both transmission speed and distance with respect to LF and HF systems. However, UHF tags consume more power, they are more sensitive to harsh environments, and, generally, they store less information that HF tags.
- Passive systems. They do not need internal batteries to operate, since they rectify the energy sent through the reader’s antenna. There are passive LF, HF, and UHF systems, which nowadays can be easily read at a 10-m distance.
- Active systems. They include batteries, what allow them to reach further distances (usually up to 100 m). Due to power regulations, almost all active systems operate in the UHF band.
- Semi-active, semi-passive or BAP (Battery-Assisted Passive) systems. They decrease power consumption by using batteries just for powering the tags for certain functionality. Commonly, batteries are used to power up the basic electronics, while the energy obtained from the reader is used for powering the communications interface. Tags have a battery to power part of the circuitry, thus, they are more reliable than passive, but require more maintenance.
3. Design of the System
3.1. Operational Requirements of Smart Shipyard Pipes
3.1.1. Automating the Identification of the Pipes in the Workshop
3.1.2. Location of the Pipes
3.1.3. Pipe Tracking
3.1.4. Optimization of the Manufacturing Time
3.1.5. Route Optimization
3.2. Technical Requirements of Smart Shipyard Pipes
3.2.1. Hardware Requirements
Tagging System
- Deployment. Tags are deployed on a workshop, where there are different areas (a detailed description of the workshop is given previously performed in Section 1). In addition, it must be emphasized that tags should be as small as possible so as not to cause problems during the treatment and handling of the pipes.
- Presence of metals. In the workshop there are many metallic elements that originate signal reflections and interfere in RF communications in the HF and higher bands. Therefore, only technologies prepared to tolerate the presence of a significant level of metallic elements should be considered.
- Presence of water. Navantia’s pipe workshop is not particularly cold, but it is next to the sea, so humidity levels are relatively high (between 40% and 95%).
- Exposure to liquids, acids, salinity, fuel or other corrosive substances. The tags selected should support the degreasing, metal pickling, and rinsing processes that are carried out in the workshop during the manufacturing of the pipes. Specifically, Table 2 indicates examples of the exposure to different chemical solutions, temperatures, and time durations that should be supported.
- -
- During cleaning, pipes might be exposed to pressurized water through a pressure washing machine.
- -
- During testing, pipes could be also exposed to hot air, water and oil (in hydraulic systems).
- -
- If the tags do not support the aggressive processes described in Table 2, it has to be considered the addition of an external protection.
- -
- The encapsulation of tags/readers must be able to resists acids, salinity, fuel and other substances that may corrode them.
- Potential communications interference. The technology selected must be able to transmit in the presence of the most common sources of electromagnetic interference (e.g., Wi-Fi, Bluetooth, the use of mechanical saws) and other unusual sources (e.g., radar tests, whose frequency ranges from tens of MHz to GHz, and their power can reach several KW).
- Reading distances. The monitoring system must be able to provide access to location data from a remote computer. Such identification/location information must be as accurate as possible, regardless of the distance required to read the pipes/pallets to be monitored. It is important to note that the workshop is 205 m long, so a network of readers would probably need to be created to cover the whole building.
- Tolerance to high temperatures. During manufacturing, pipes can be exposed to high temperatures in two processes: while washing them in water/acids, or during welding.
- Pressure. Both during the storage and the transfer of the pipes it is possible that they (and their tagging system) will be exposed to pressure due to the accumulation of weight and collisions. Pressure varies depending on the weight and strength supported by the base material. Note that, in general, between 30 and 35 pipes are moved into each pallet, and that such pallets support up to 2 T.
- -
- When moving a pallet with other pipes on top. There is no standard criteria for stacking pipes, but, usually, the heaviest are placed at the bottom of the pallet.
- -
- When lifting a block to its mounting position.
- -
- During manufacturing, it may be necessary to round heads/ends, thus strokes can be applied, what involve deformations.
- Battery duration. Since pipes arrive to the workshop, up to three years may go by until they depart from the storage areas to be installed on a ship. Therefore, battery should last at least such a period of time.
- Mobility. The technological solution selected must provide portable readers for dynamic and in-situ operation on the various identification, location, and traceability systems.
Readers/Scanners Location
- Electricity. The typical workshop usually has numerous electrical outlets in different locations, thus it should not be a problem to power the hardware of the system.
- Data. Ethernet and Wi-Fi networks should be available to allow for receiving and sending data to the readers deployed. In Navantia’s workshop, while these networks are available in most of the workshop, the number of Ethernet sockets, except in certain locations, is scarce, and they are almost always associated to control equipment (e.g., the pipe storage robot or the bending machines). For such a reason, it is almost essential to place switches or hubs that allow for adding new Ethernet devices easily.
3.2.2. Software Requirements
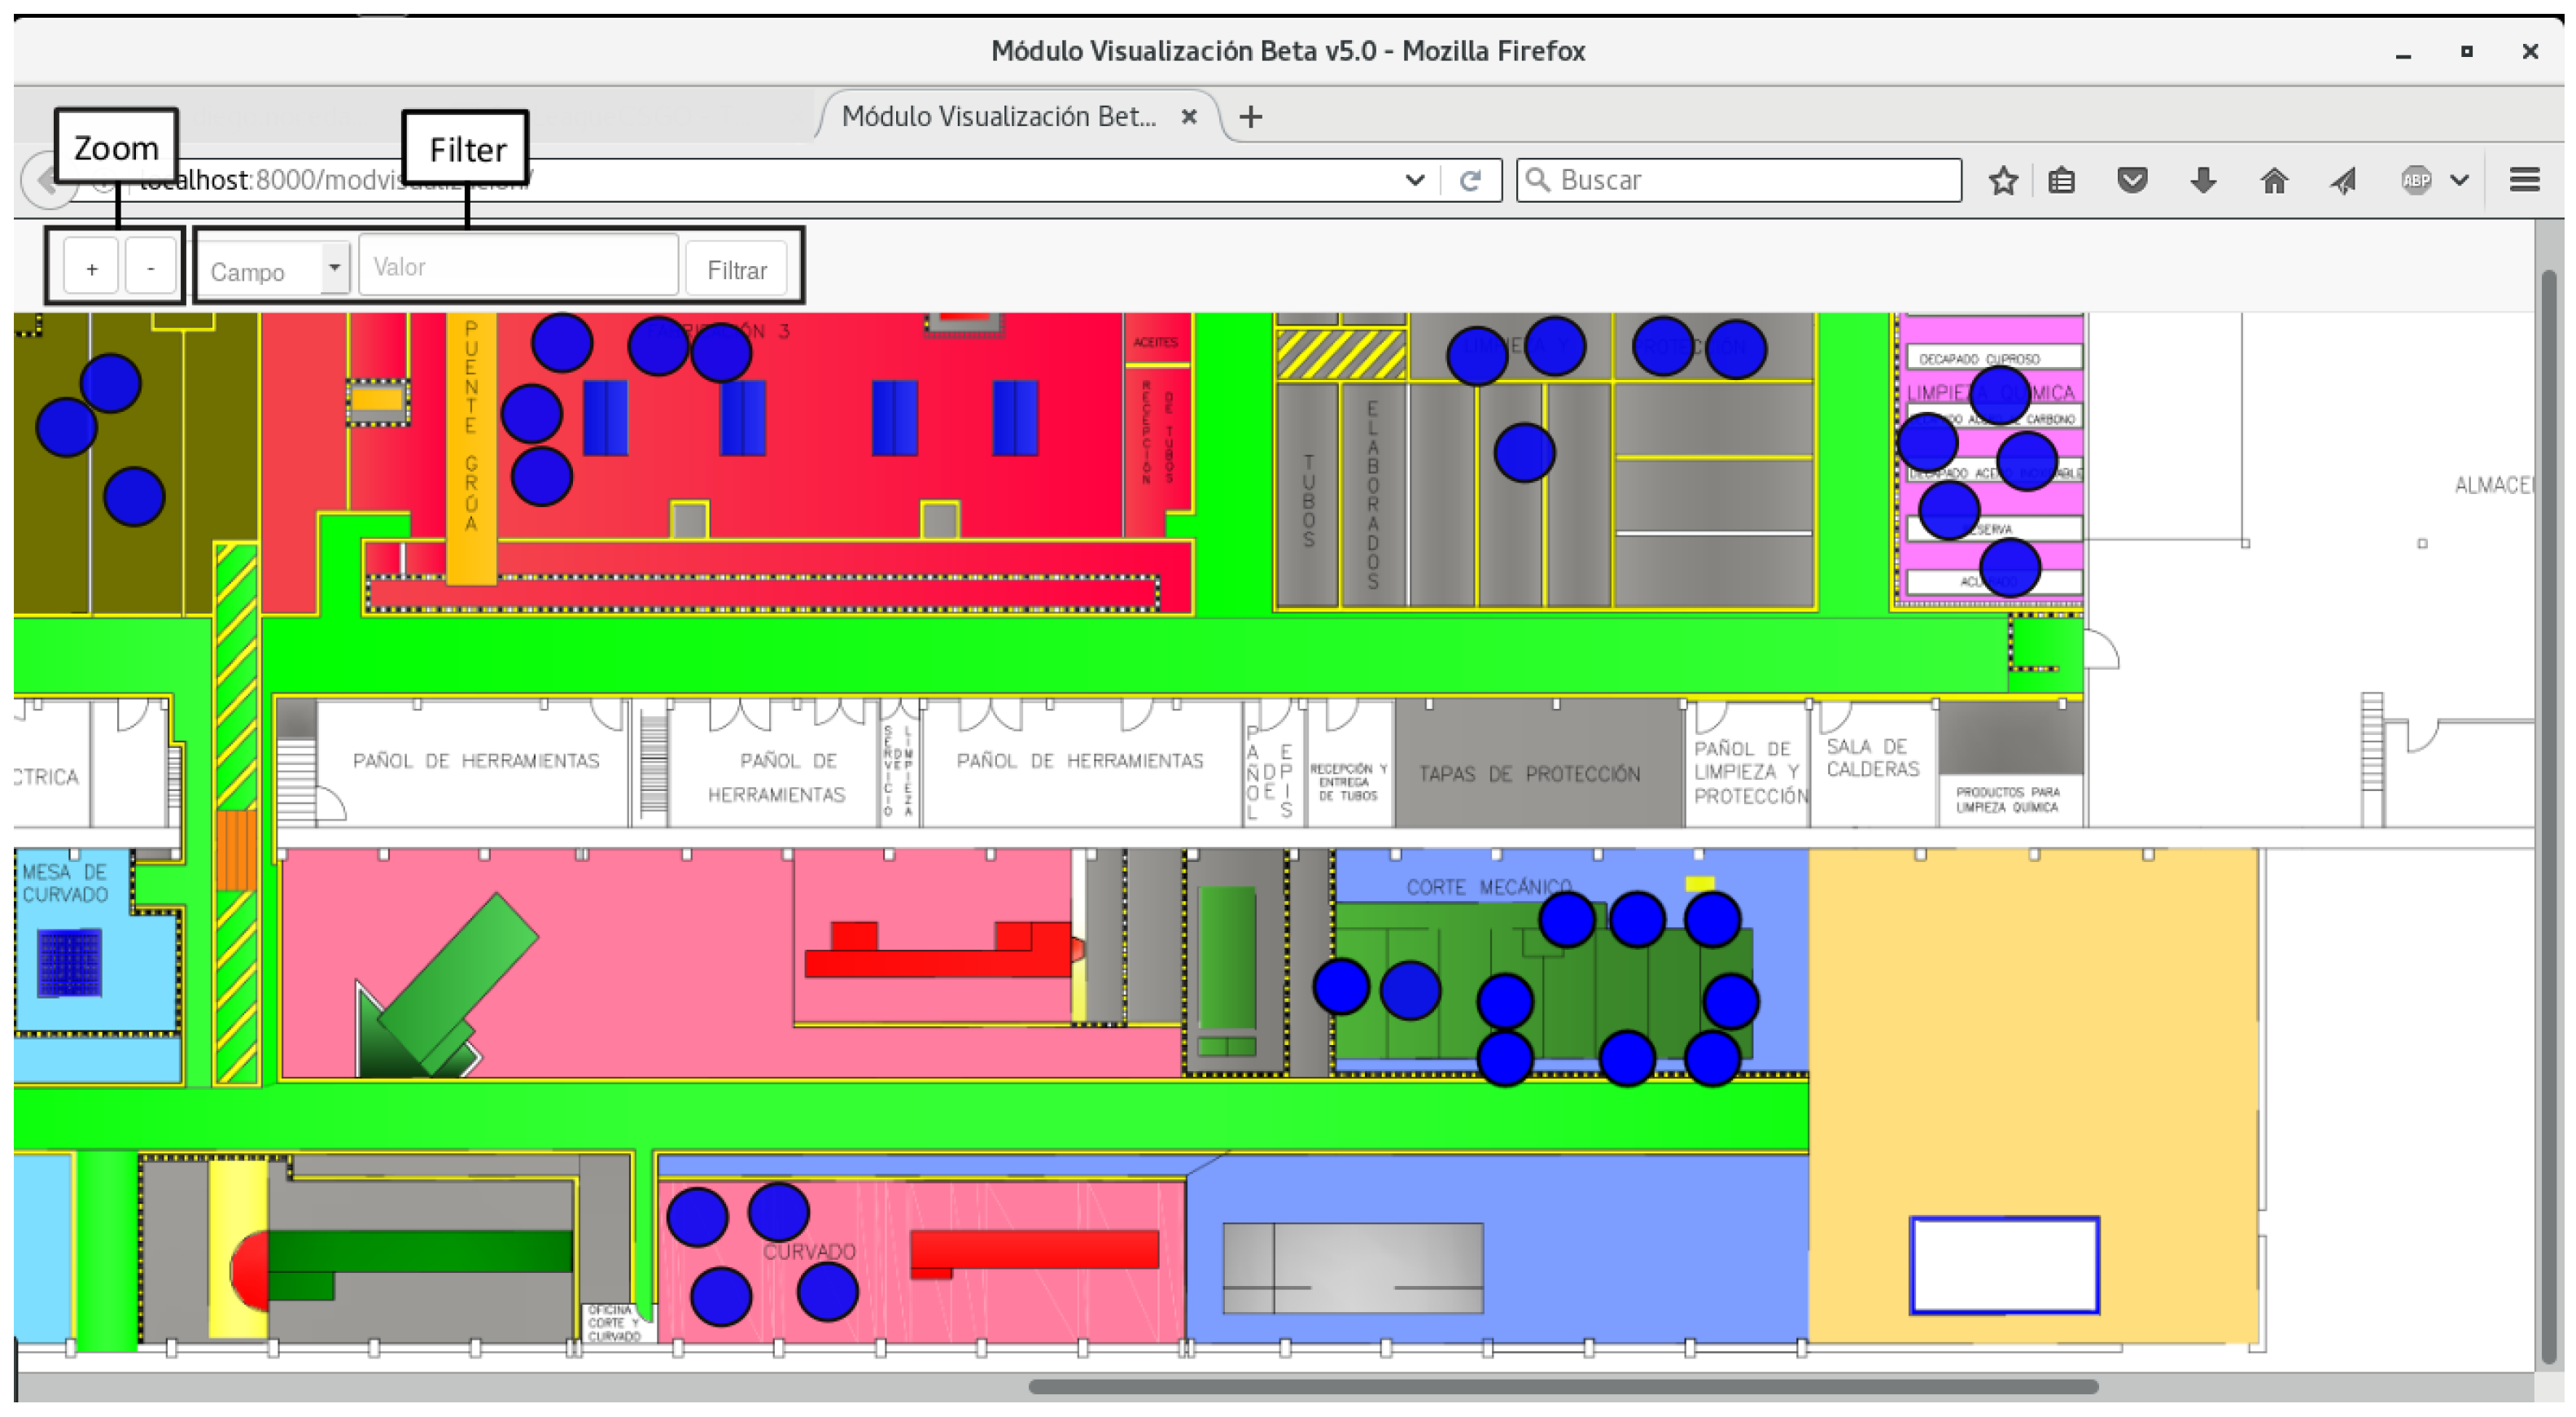
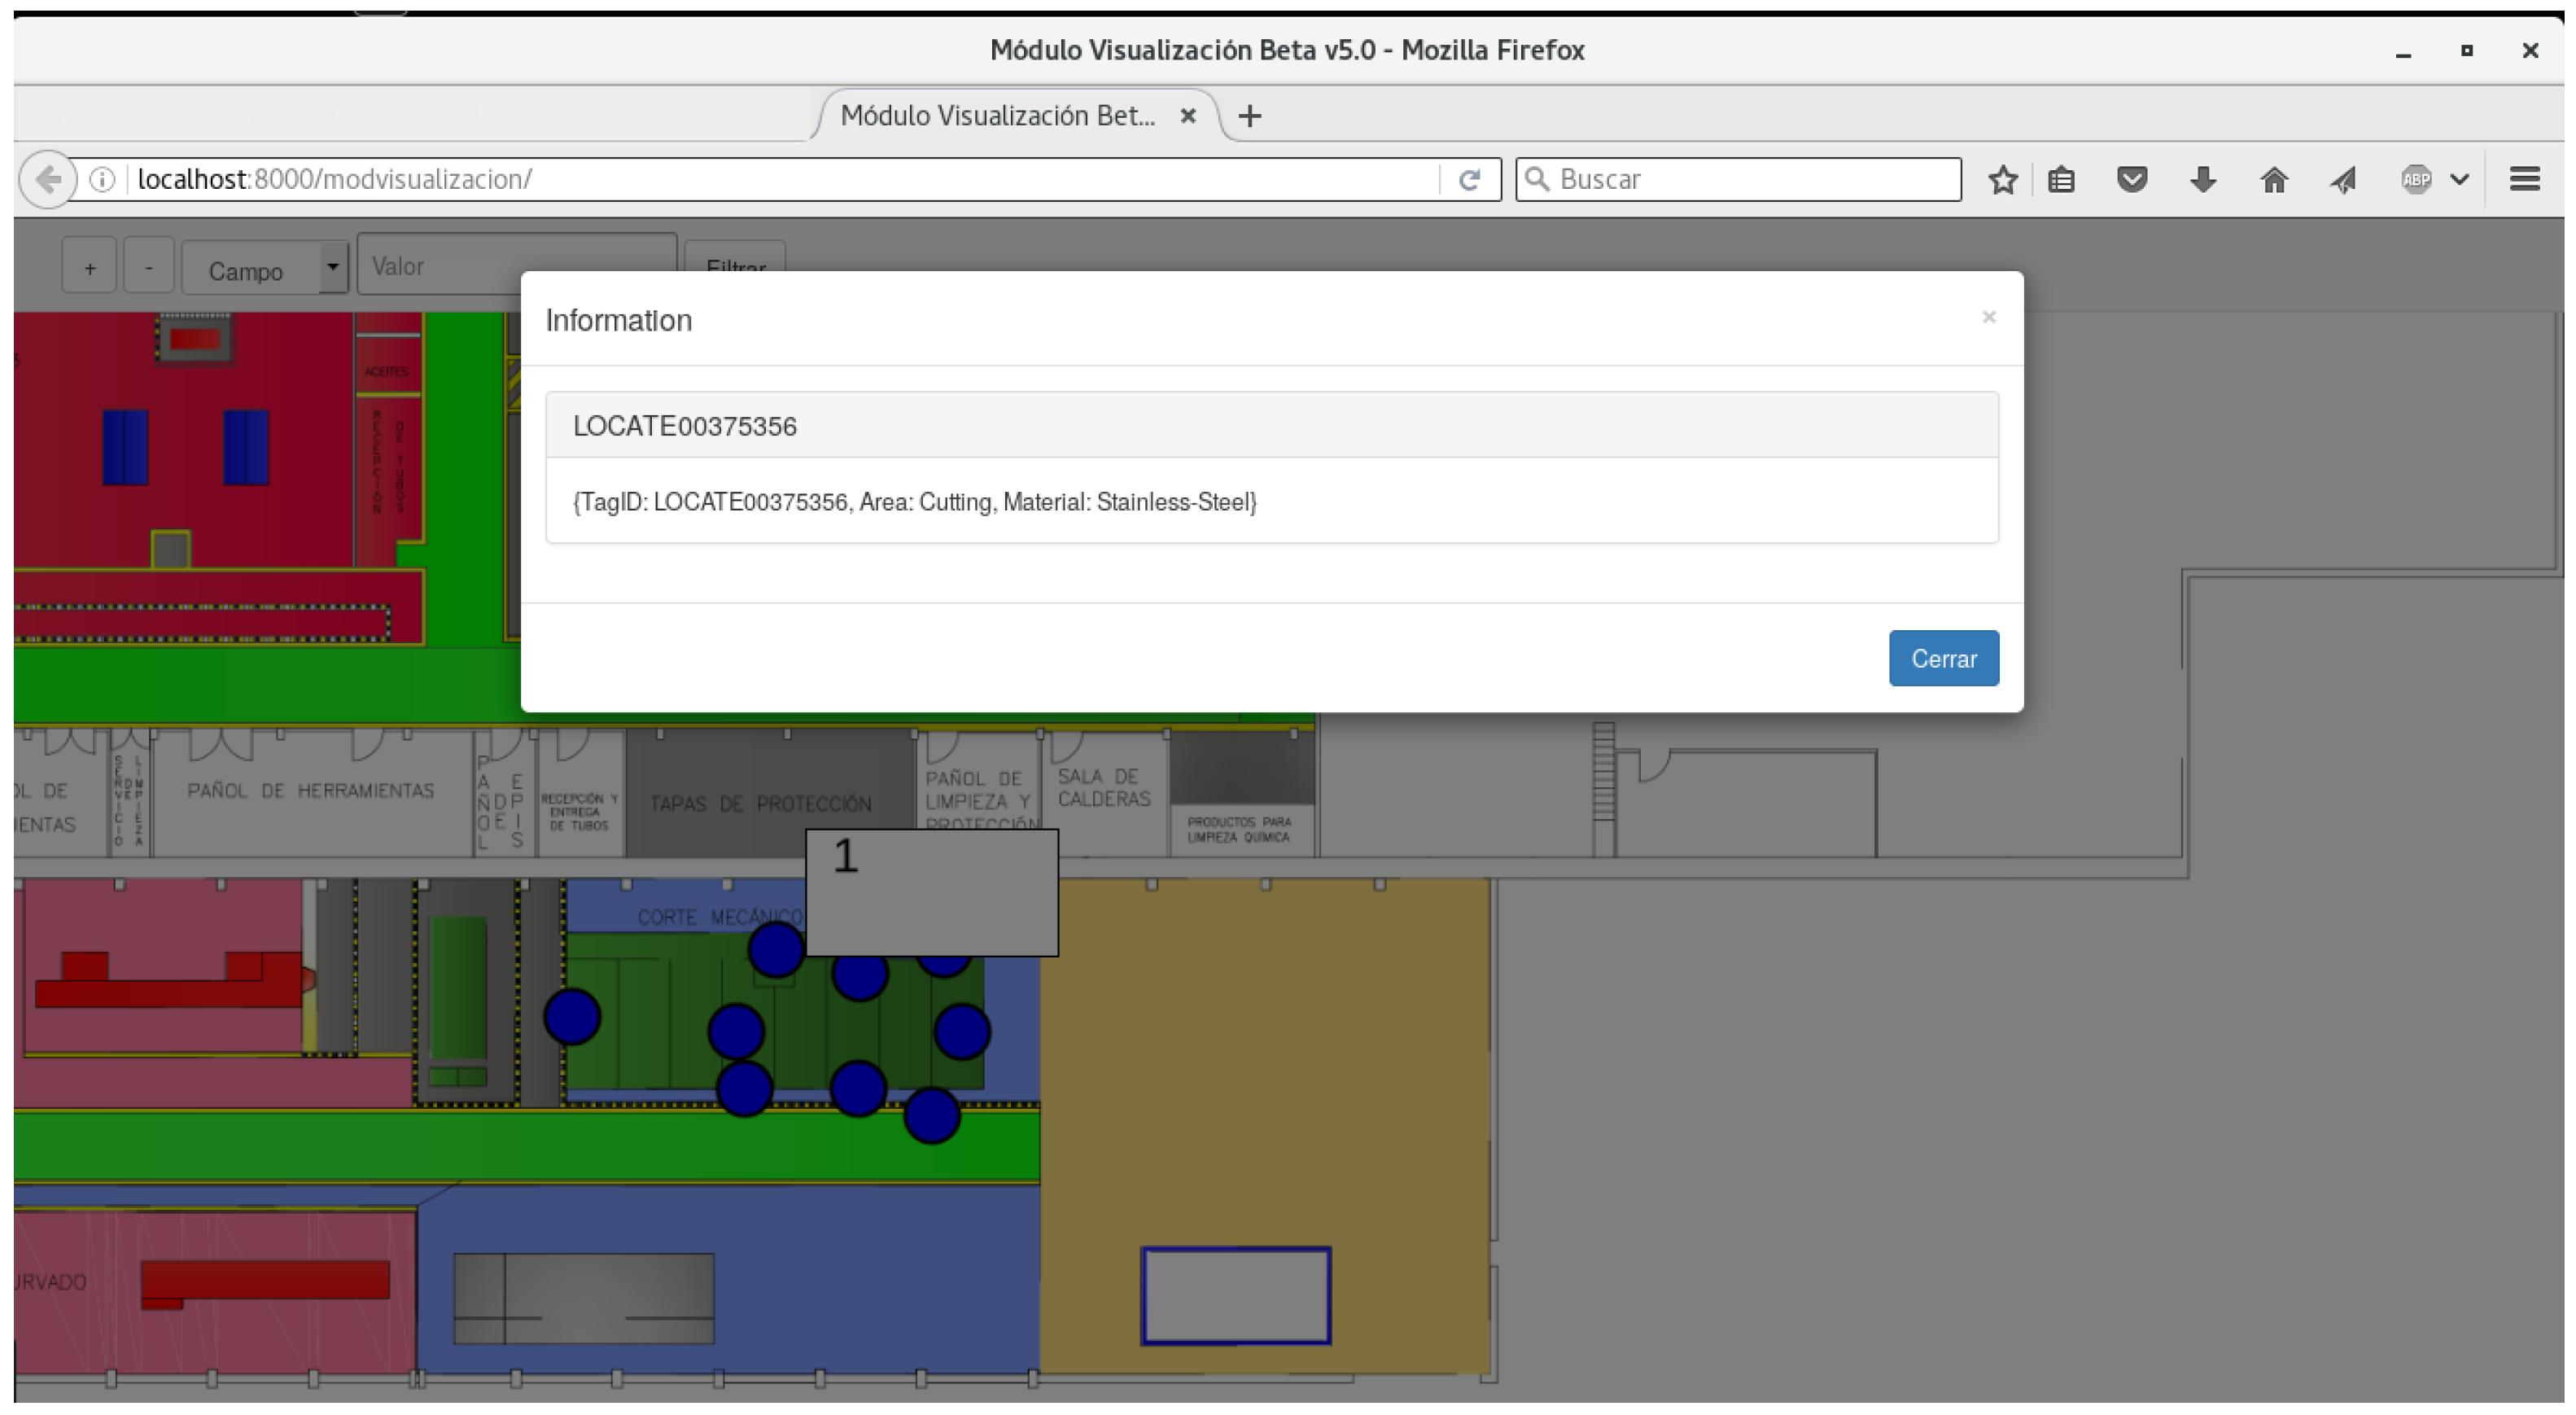
- The system should display the location of the pipes in the workshop in real or near-real time. Ideally, the visualization should be implemented in a multi-platform system, which should allow for monitoring the whole workshop from a remote computer, a tablet, and even a smartphone.
- Easy interaction with the basic pipe information. In addition to viewing pipes in a map, it is desirable that users can access certain information about them.
- Filtering the pipes displayed. Once the system is operating, numerous pipes would be displayed while moving through the workshop. Therefore, it is convenient that a user can filter them in order to only show a specific pipe or a subset that meet certain criteria.
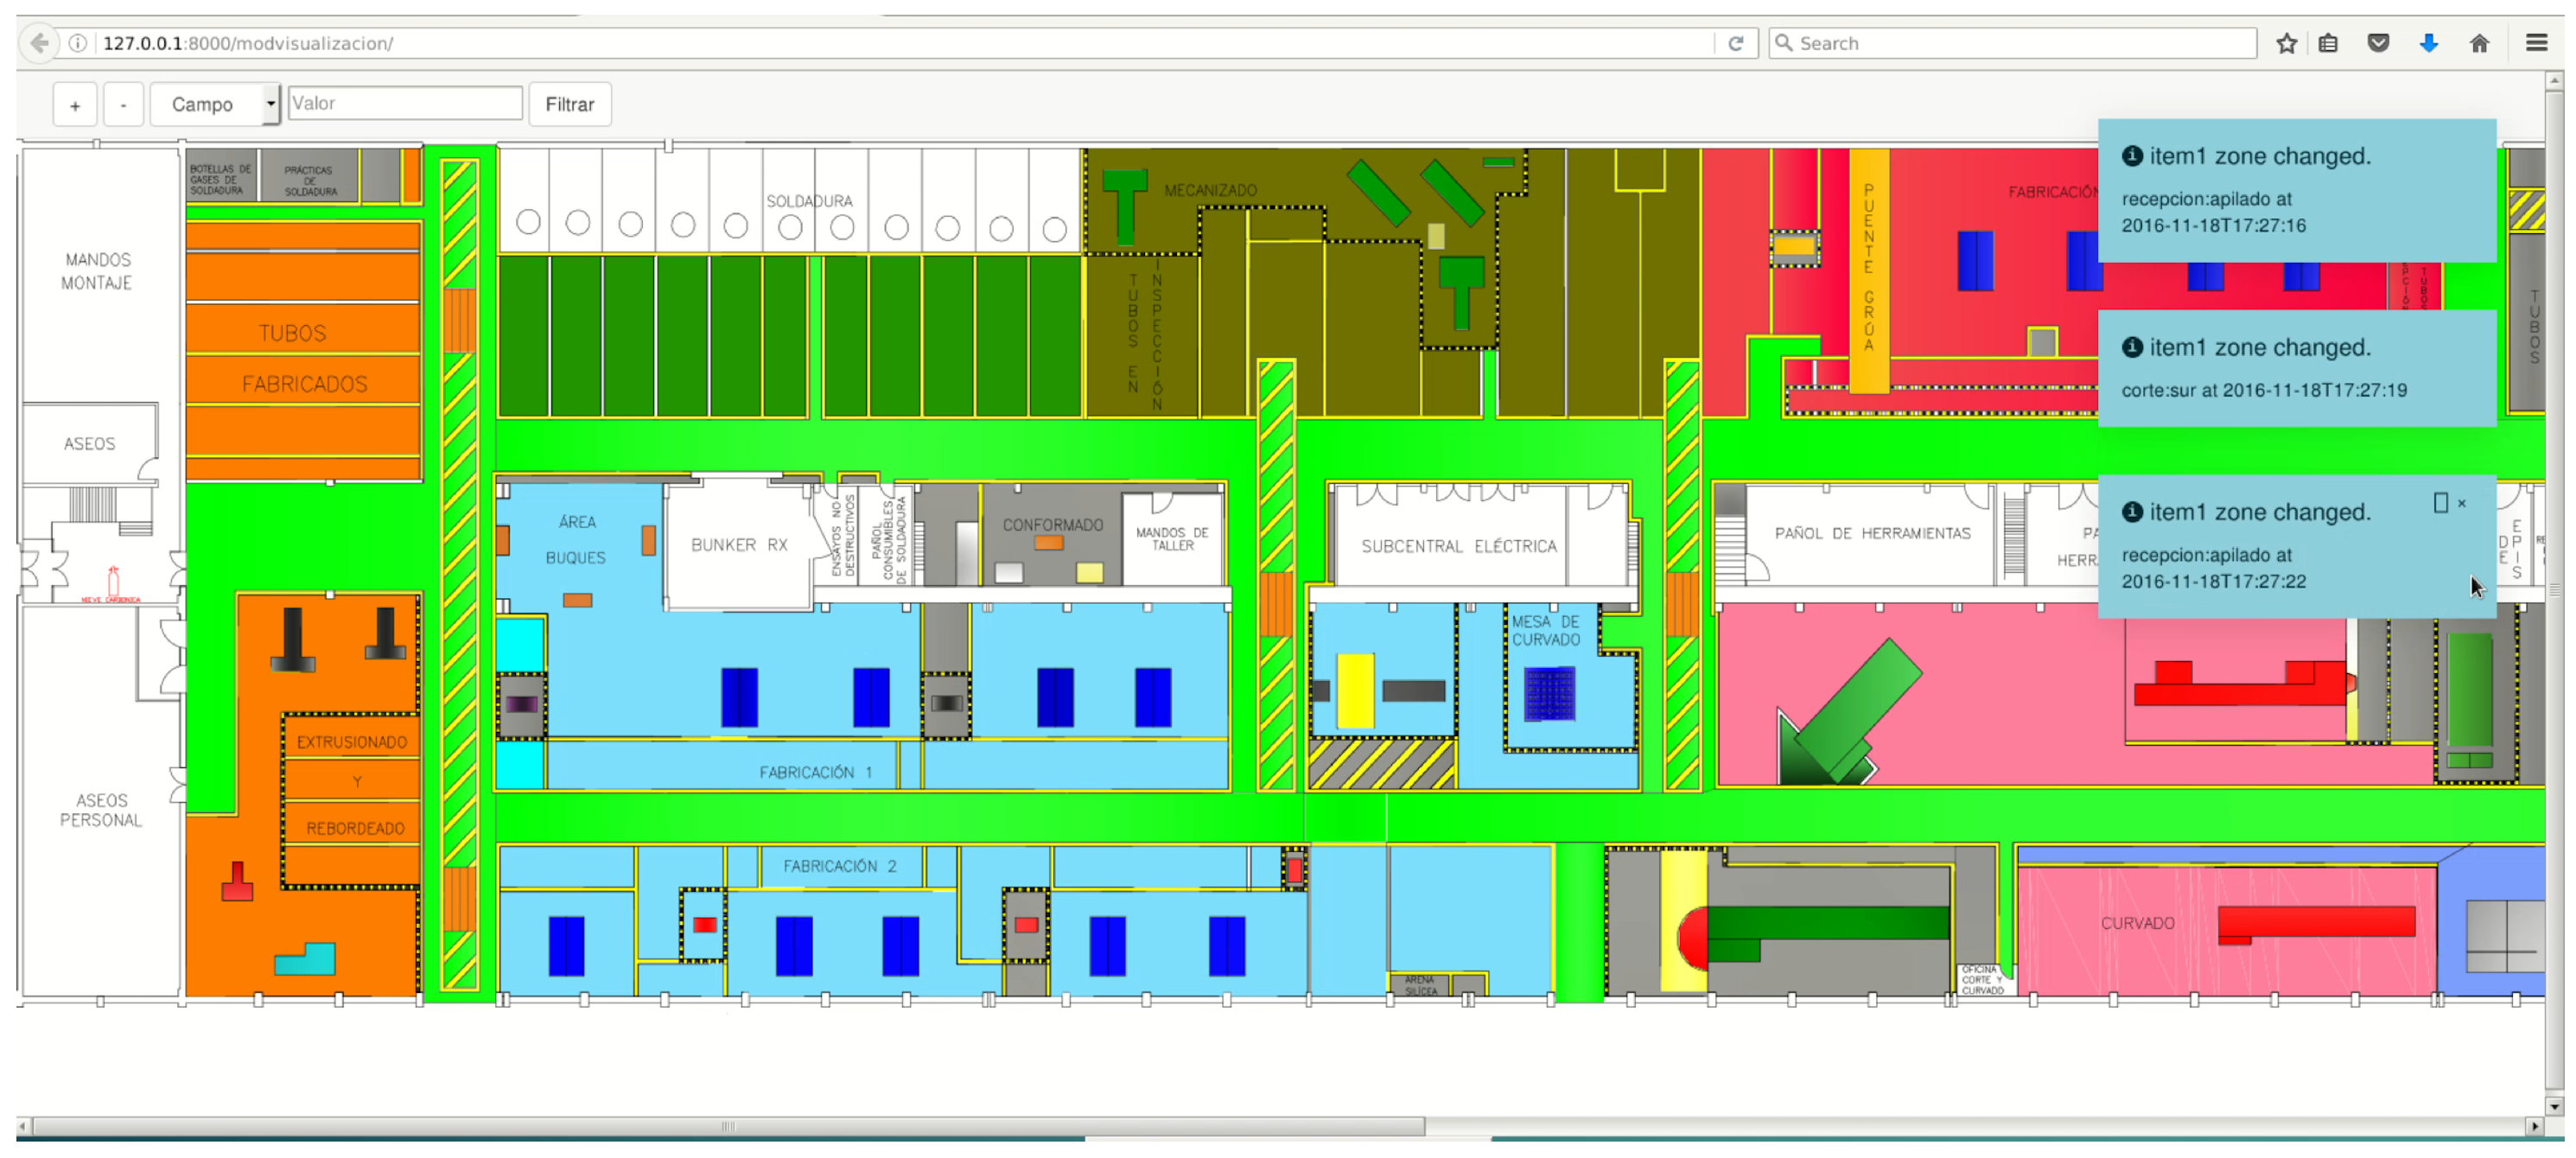
- The system should be able to issue different notifications about relevant events that happen in the workshop. For instance, a Business Intelligence (BI) module should issue a notification when a pipe goes from one workshop stage to another (e.g., from the cutting area to bending).
3.3. Selection of the Identification Technology
3.3.1. Analysis of the Technologies
3.3.2. Discussion
- LF and HF RFID: the reading distance they reach is not enough for building a ubiquitous real-time CPS system.
- 2.4 GHz RFID: due to its operating frequency, its performance decreases in the presence of metals, liquids, or the interference from other systems that work on the same frequency band.
- BLE and Wi-Fi: these technologies share operating frequency with the 2.4 GHz RFID, so they suffer from the same problems in terms of interference.
- ZigBee, Z-Wave, and WirelessHART. These technologies are aimed at creating sensor networks: their application in location is possible, but they are not suitable for the shipyard environment described in this paper. In addition, ZigBee and WirelessHART work in the 2.4 GHz band, which must be avoided.
- Ultrasounds. Its biggest disadvantage is the need for direct LOS between the reader and the tags. Although the frequencies used do not interfere directly with the test environment, they can interfere with sensor communications and/or armament of the ships, and even with marine animals.
- UWB. They obtain an excellent precision in location applications, but it is difficult to adapt to the shipyard environment described due to its short range and its problems with the presence of metal objects.
- RuBee. It does not suffer from electromagnetic interference. Moreover, RuBee tags are designed to withstand adverse conditions and their battery lasts up to 15 years. It has been also tested in weapon control environments, where it was shown that its use is safe [51].
- DASH7/active UHF RFID. Both UHF RFID and DASH7 work in a frequency range to some extent sensitive to the interference present in the shipyard environment, but that it is slightly less aggressive than in the 2.4 GHz band. They have a theoretical reading distance of up to 100 m.
- UHF RFID. As it has been already mentioned, the use of frequencies below 1 GHz decreases the influence of the environment conditions. UHF technology has the advantage of having been tested thoroughly in location and tracking applications. In addition, tags are usually inexpensive.
3.4. Communications Architecture
4. Implementation
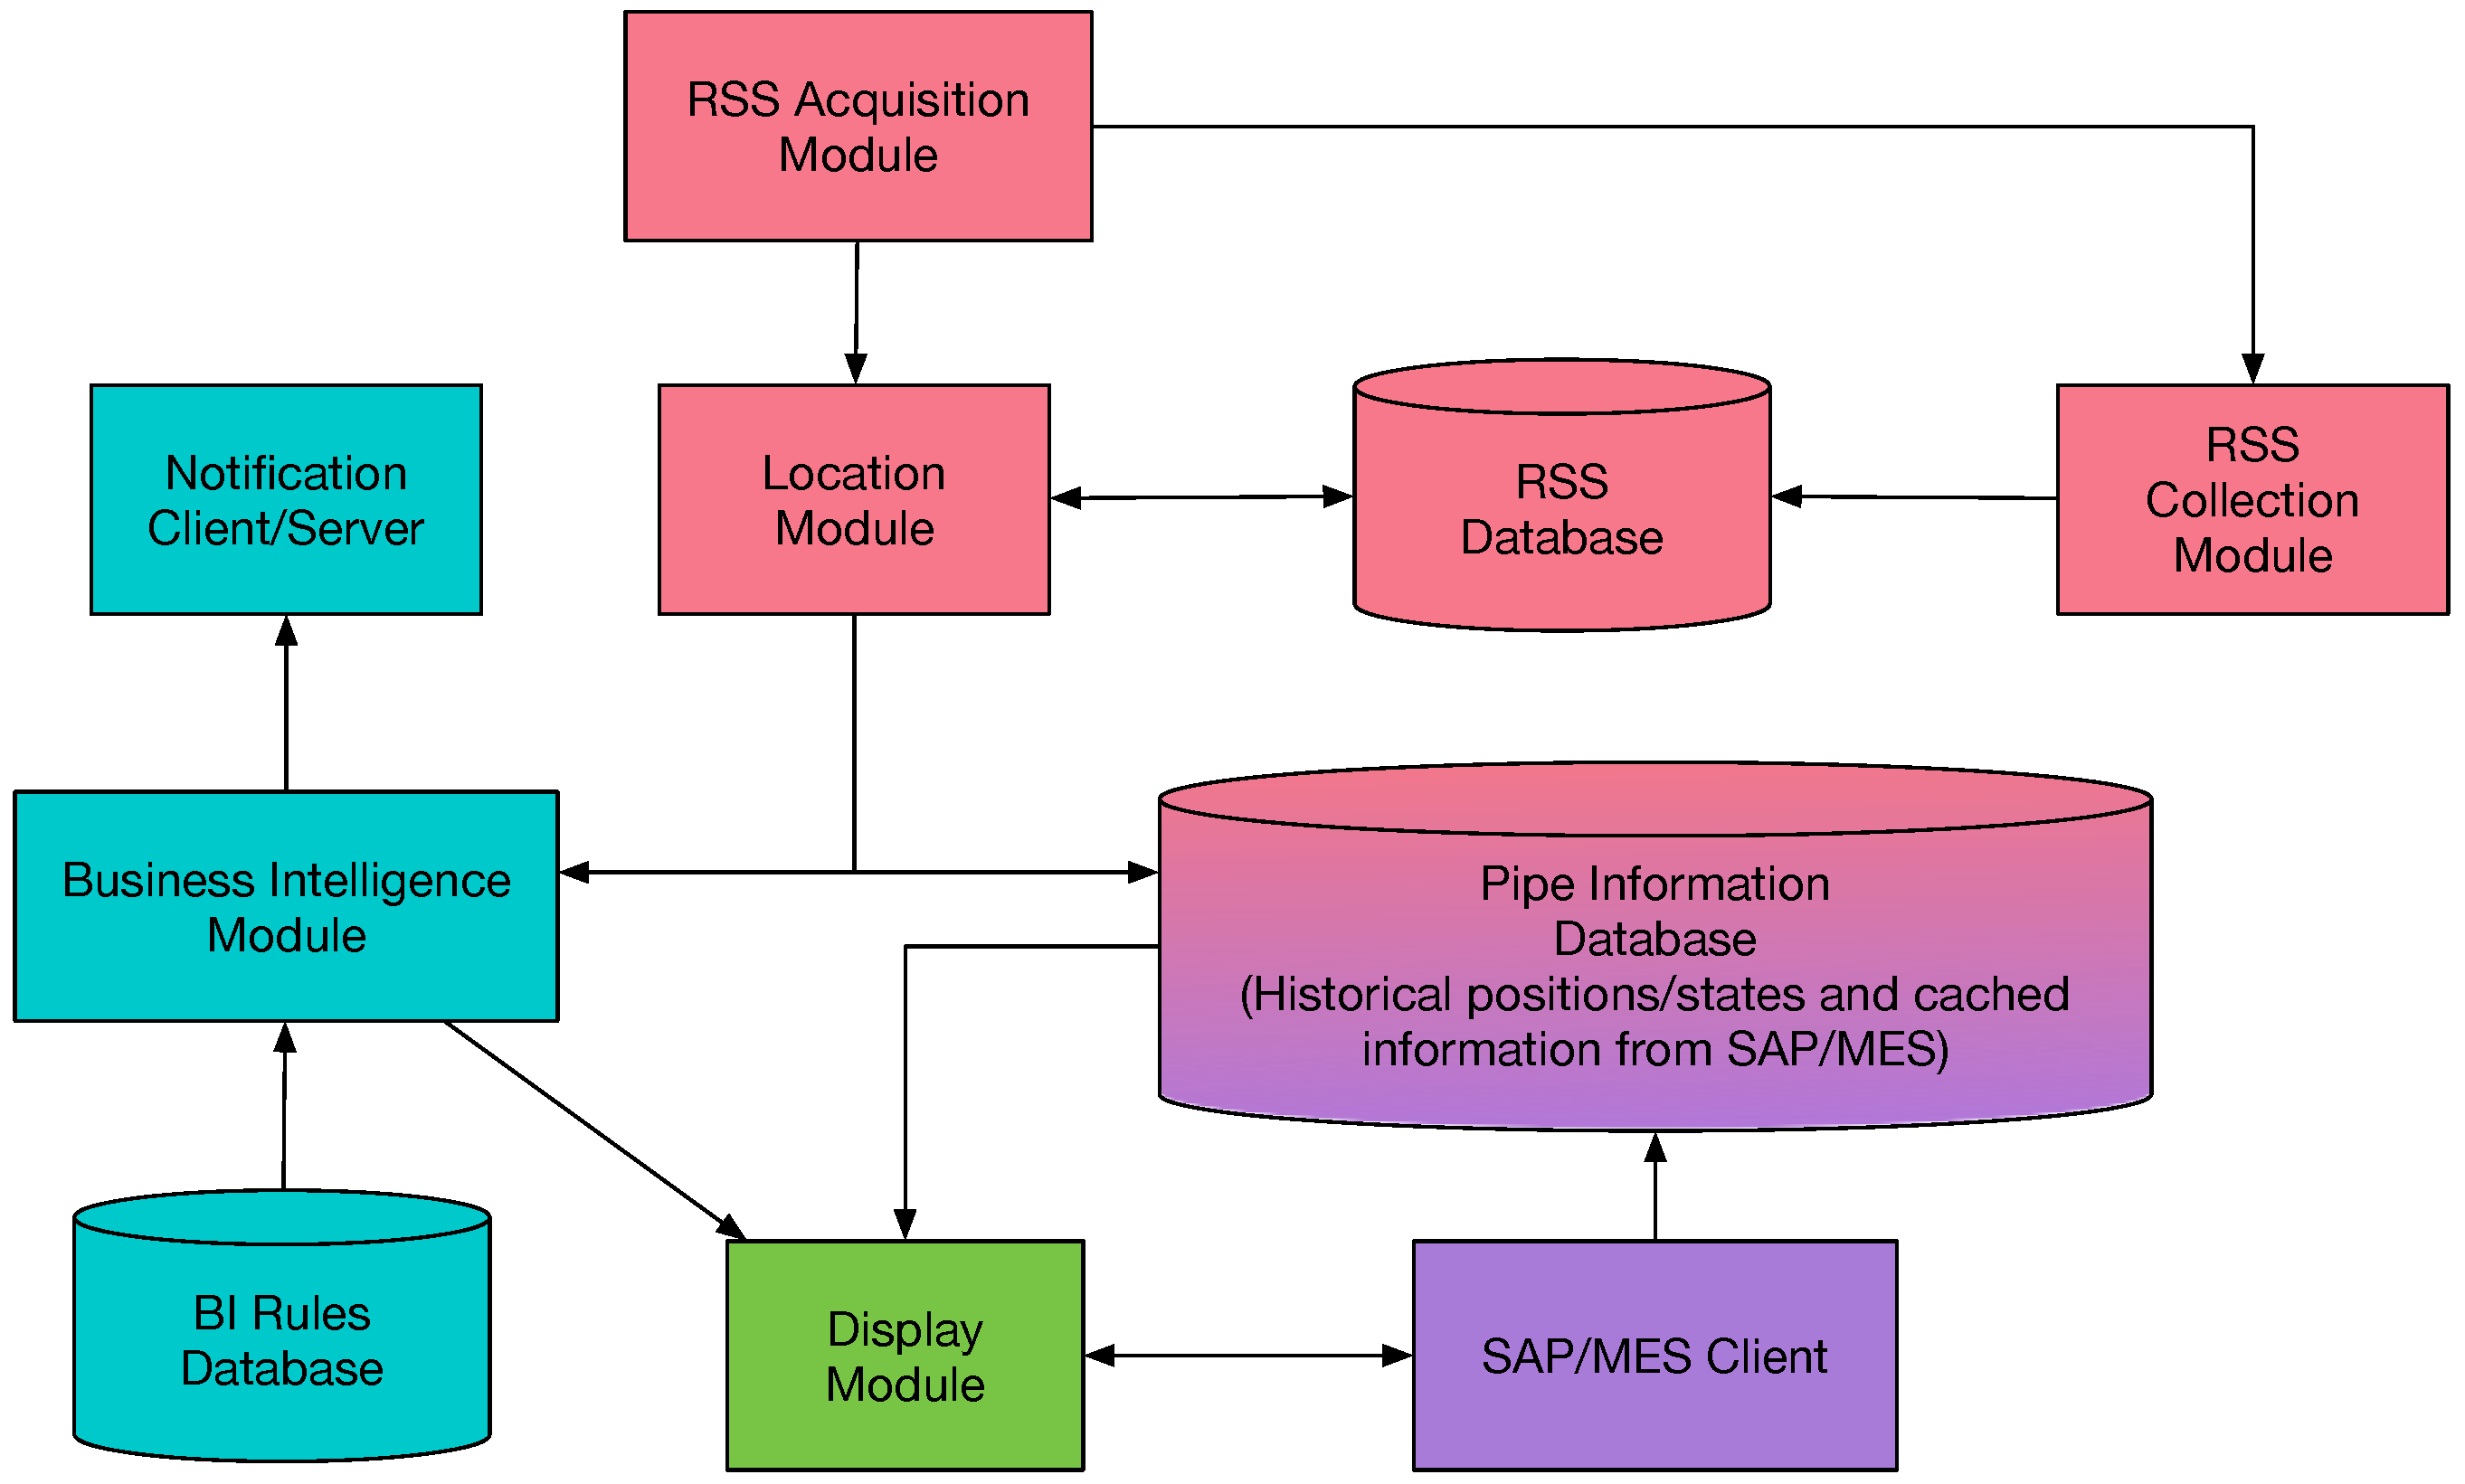
4.1. System Modules
- Location module: it is the core of the system. It obtains the coordinates of each tag after processing the signal strength.
- RSS acquisition module: it is the interface with the RFID readers. It allows for obtaining the signal strength from each tag.
- RSS collection module: it is in charge of storing the signal strength values in the RSS database.
- Business Intelligence module: it decides which notifications should be launched depending on the current position of a pipe, its historical position (where it has been in the past), and the states through which it has passed.
- Display module: it displays the positions of the pipes and the relevant notifications on a user screen. It allows operators to filter the pipes based on various parameters for easy viewing.
- SAP/Manufacturing Execution System (MES) client: it allows for obtaining the data about the characteristics of the pipes, which are stored in different remote repositories.
- RSS database: it stores the signal strength values collected by the RSS Collection Module. At the same time, it can be used by the real-time Location Module to determine the location of the tag.
- Pipe information database: it stores the information received about the pipes from third-party systems such as SAP or MES.
- Business intelligence rules database: it contains the necessary rules for the BI system to determine when to launch notifications.
4.2. RSS-Based Location Techniques
4.2.1. RSS Mathematical Model
- is the attenuation in decibels suffered at distance d.
- is the attenuation in decibels at a reference distance . Typically obtained through measurements.
- n is a calculated value that minimizes the Minimum-Squared Error (MSE) difference between the model and the empirical results.
- is a Gaussian variable with mean zero and standard deviation σ.
4.2.2. Kalman Filtering
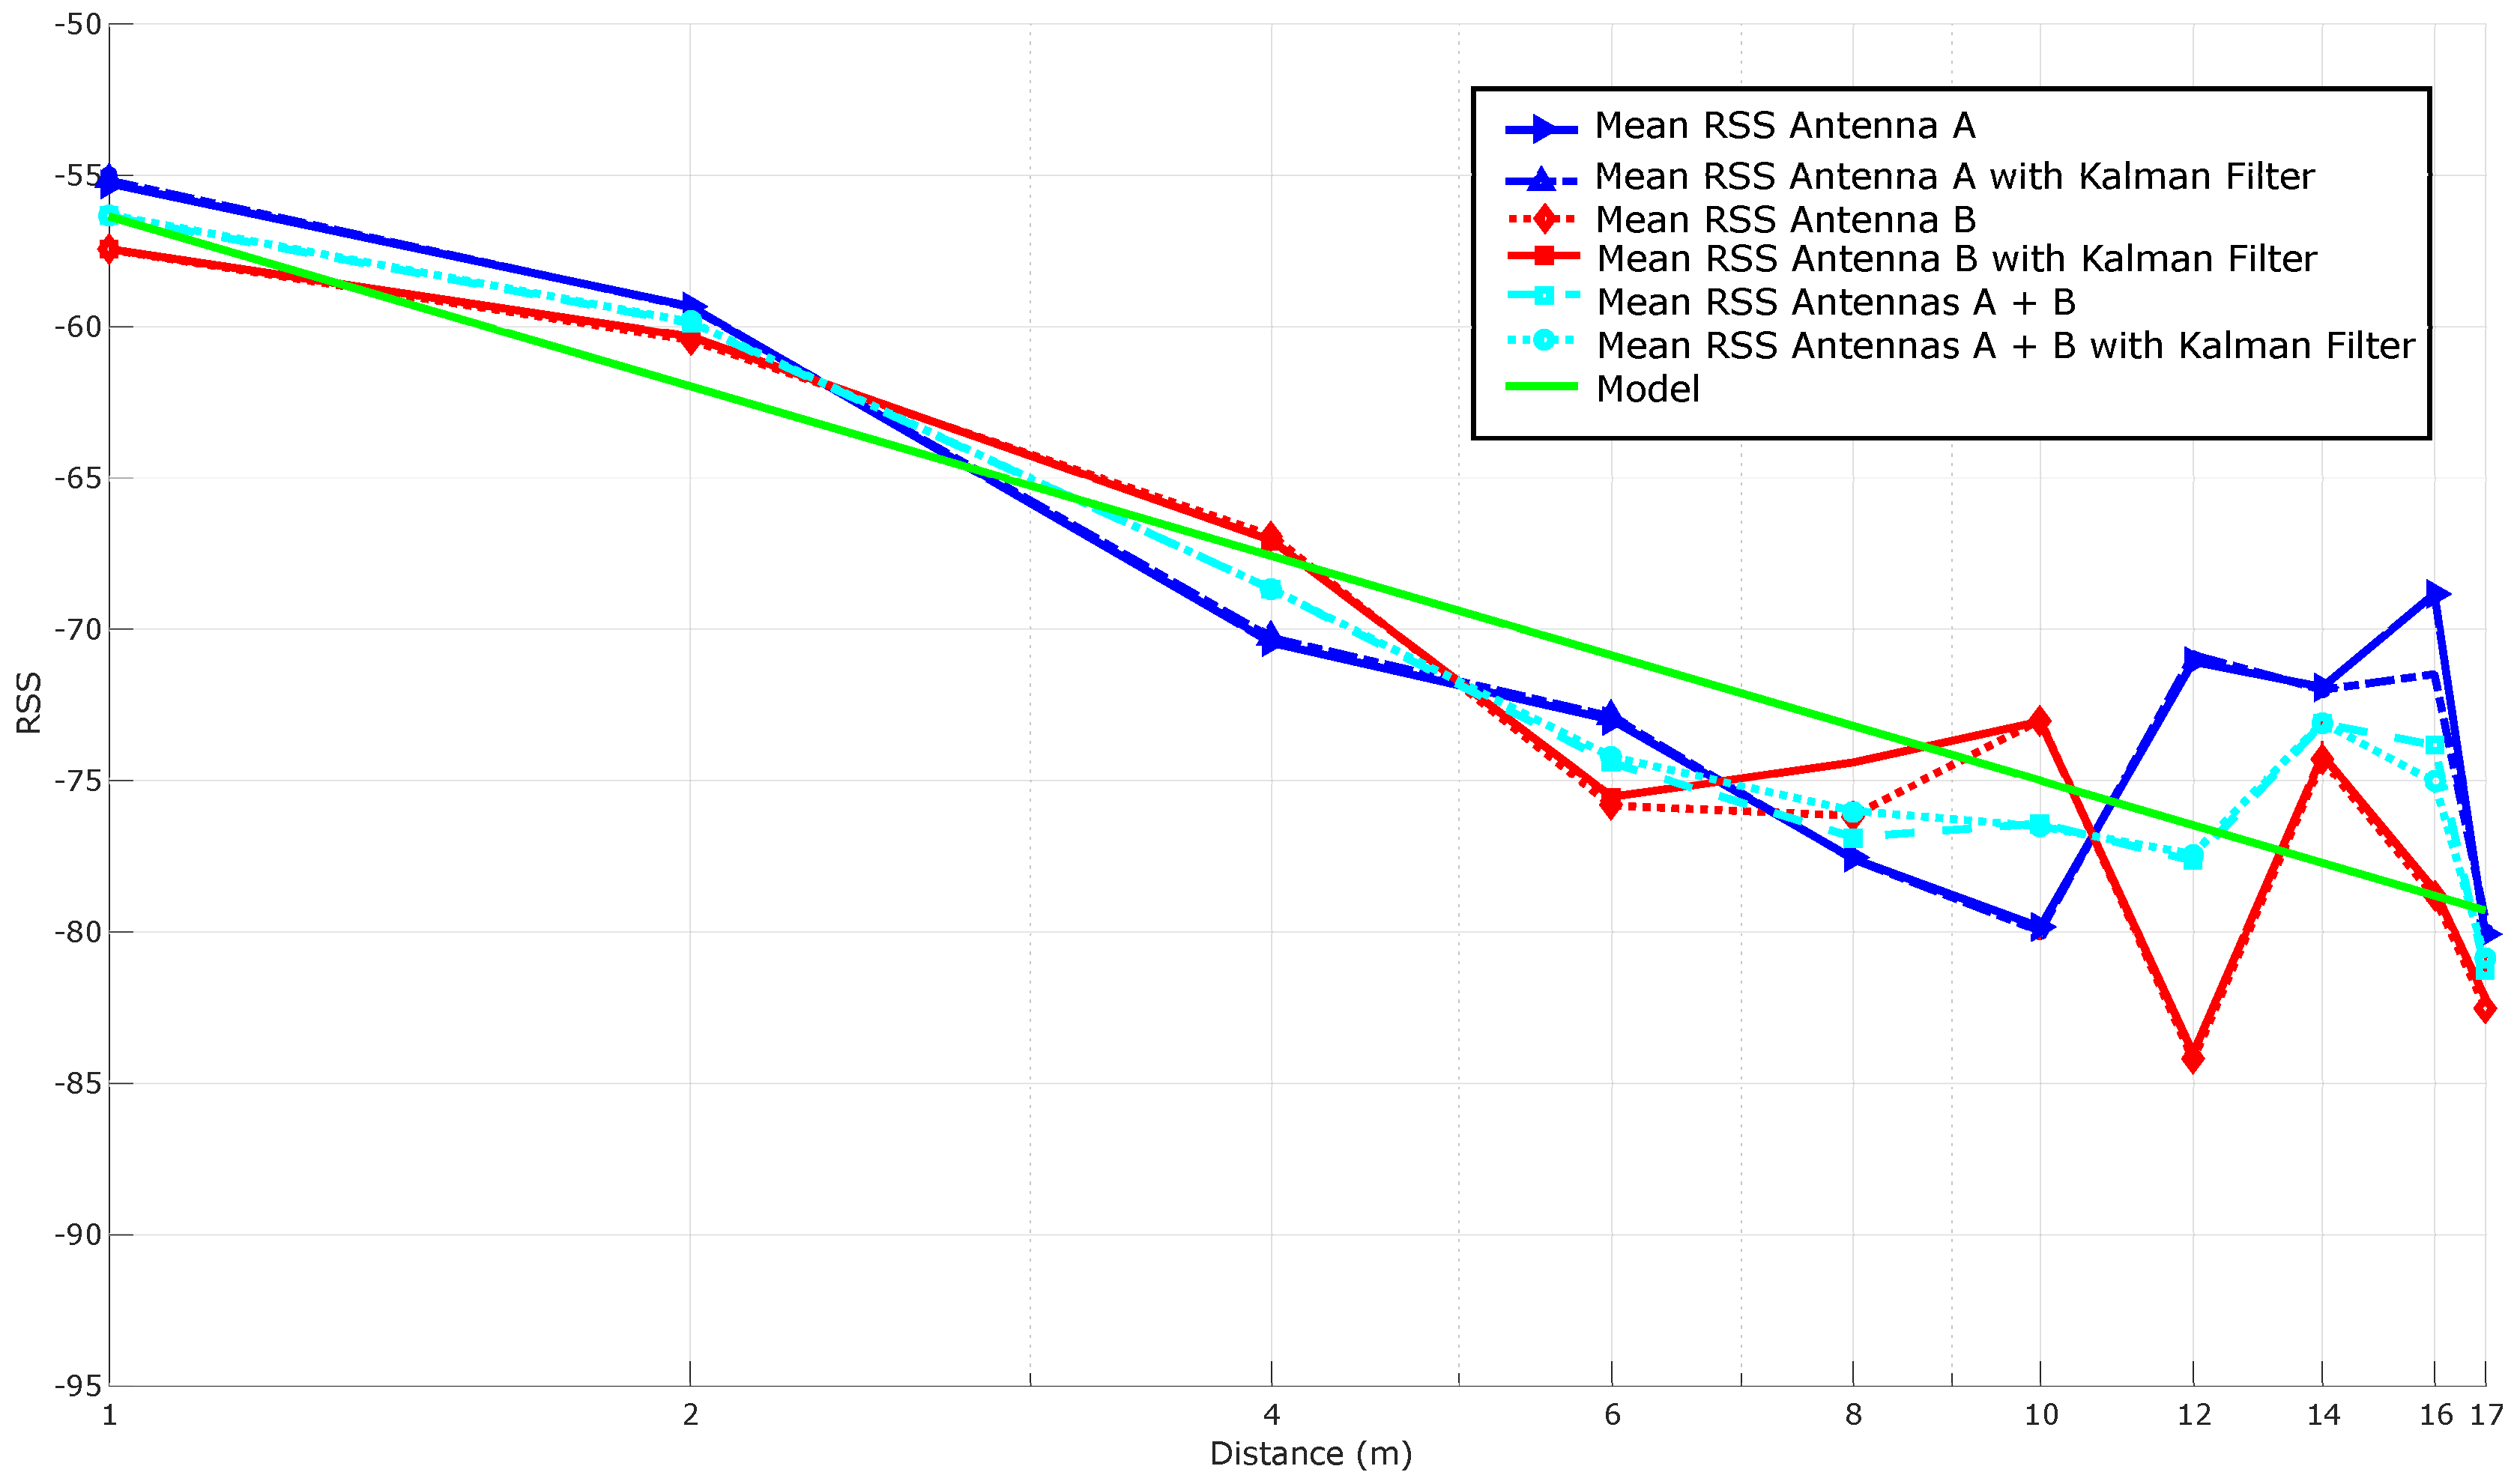
4.2.3. Spatial Diversity Techniques
Combination Methods
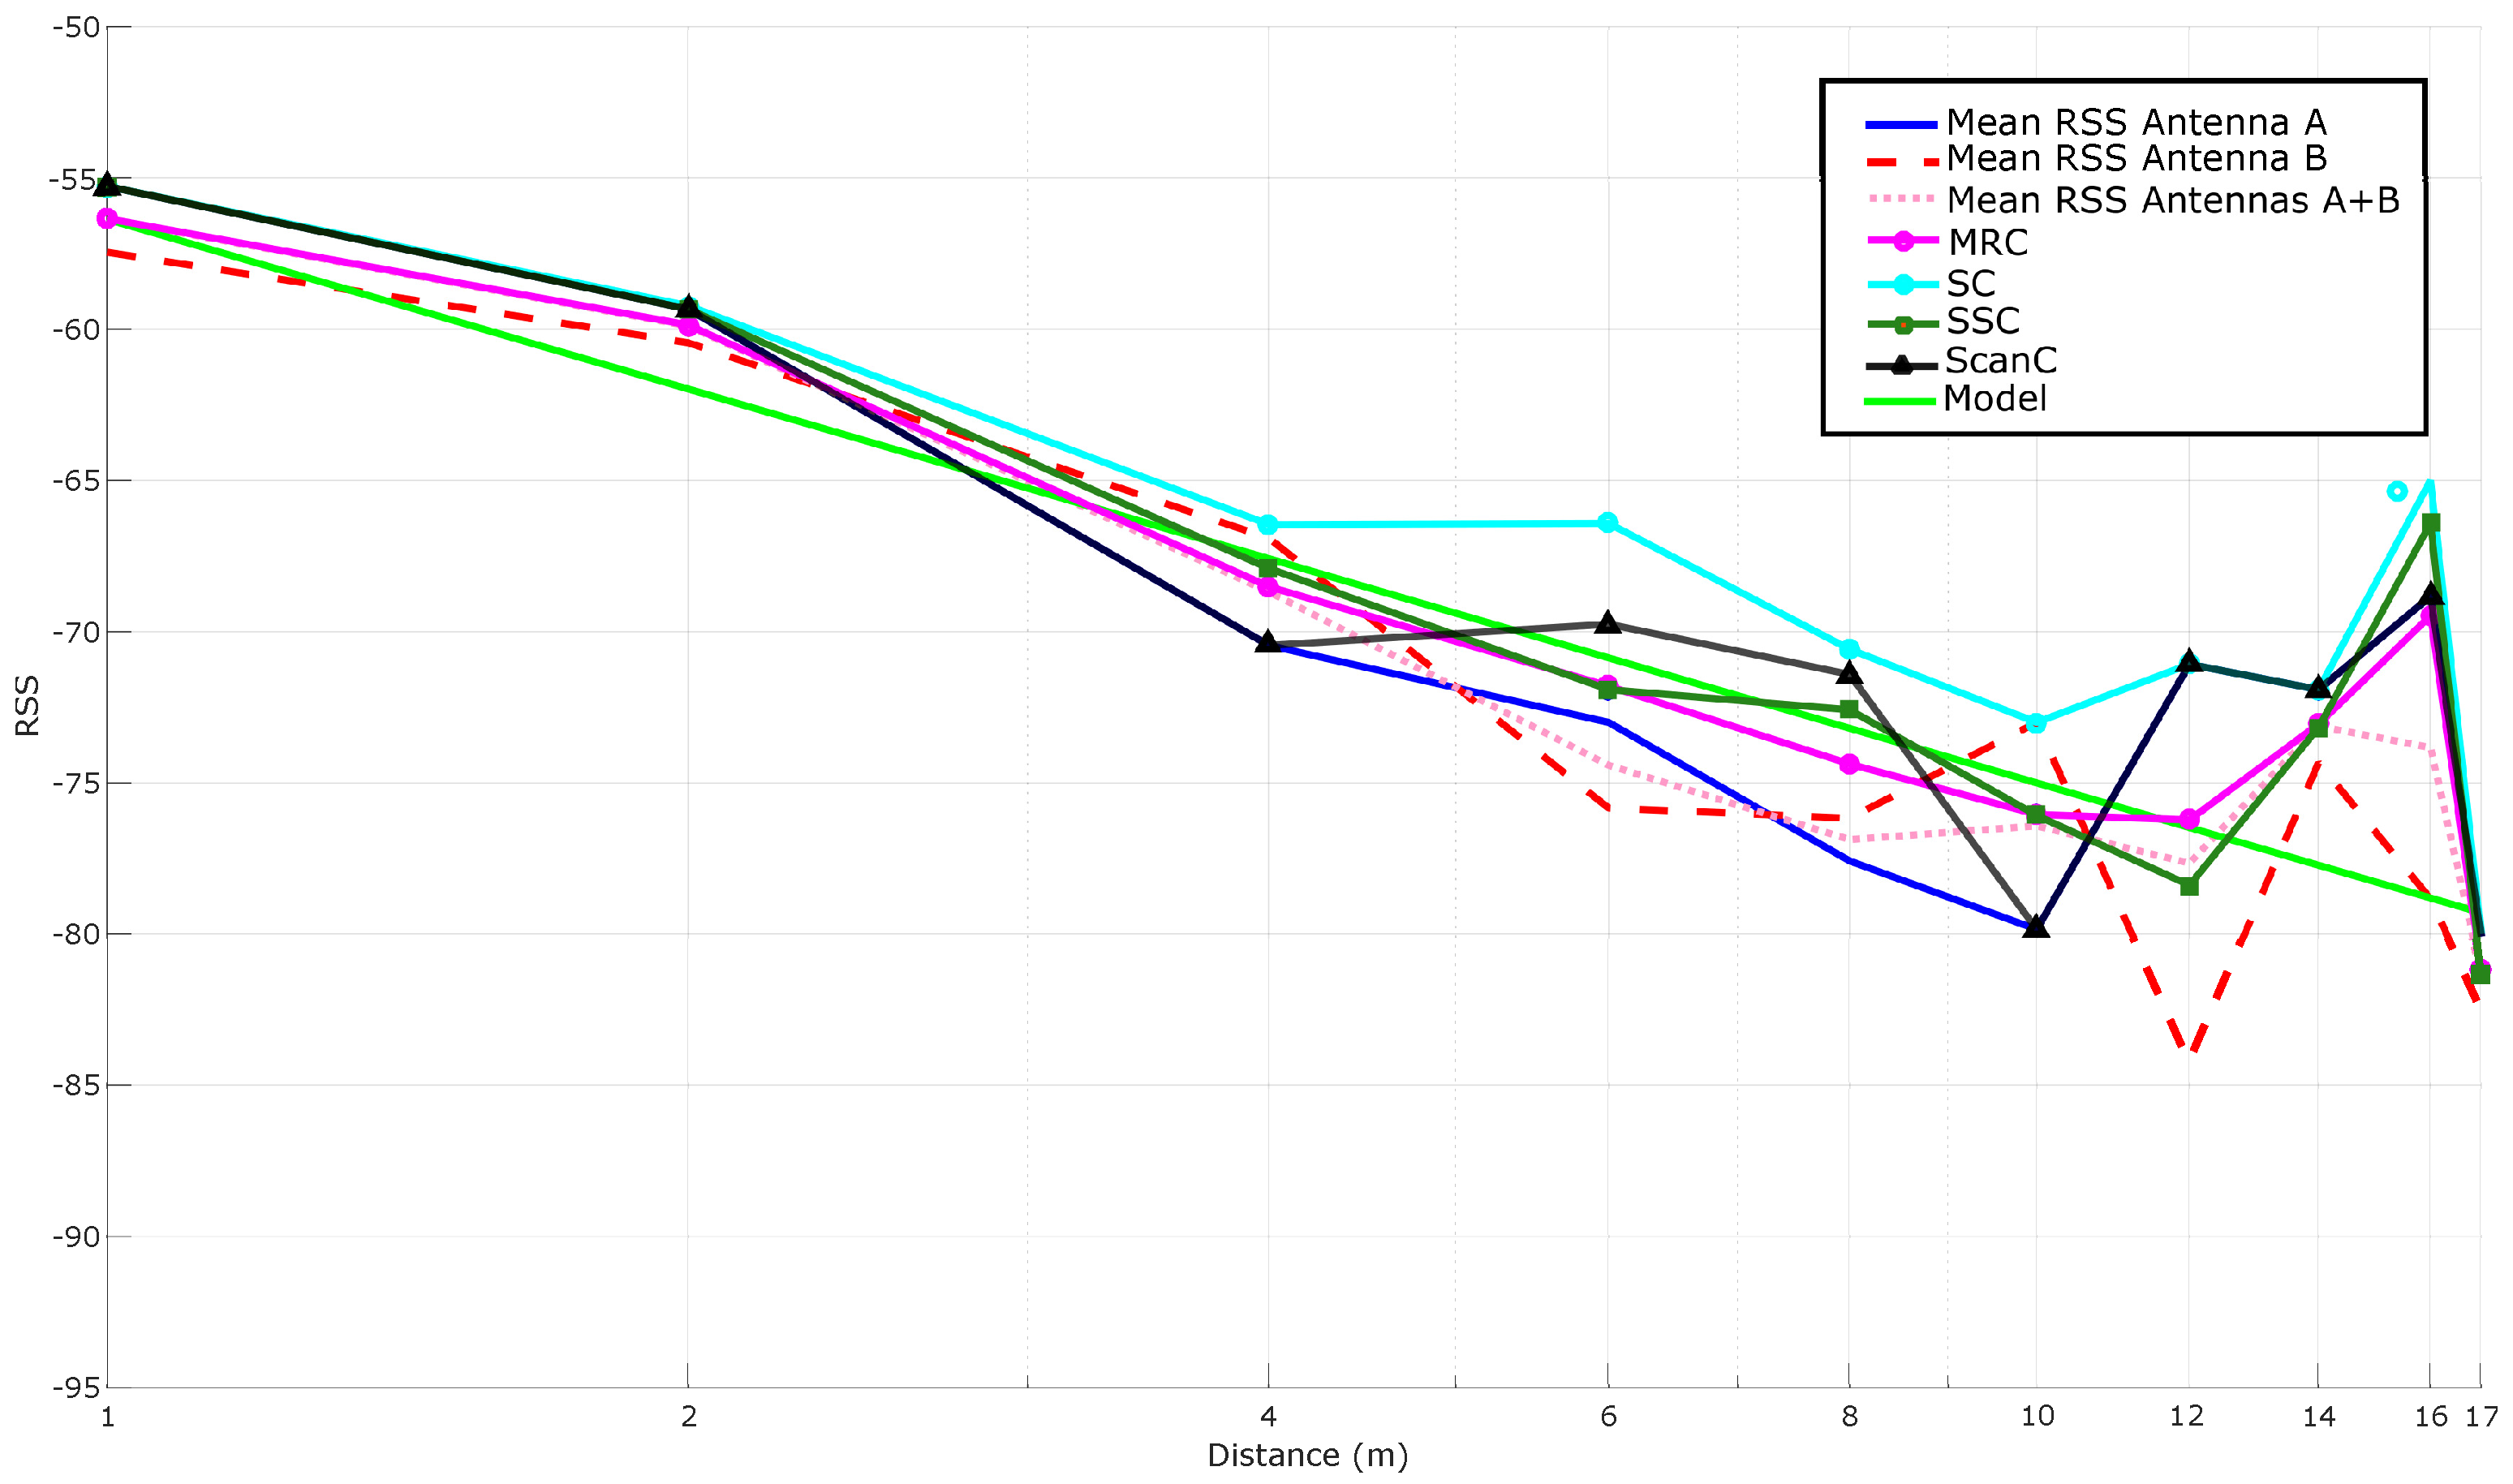
- Equal Gain Combiner (EGC). This method weights equally all the antennas, performing the average of all the RSSs, following the equation:where N is the number of antennas and is the level of received signal for the i-th antenna. For the sake of clarity, in the curves shown in the experiments section, the term “Mean” was used instead of “EGC”, but its computation is identical.
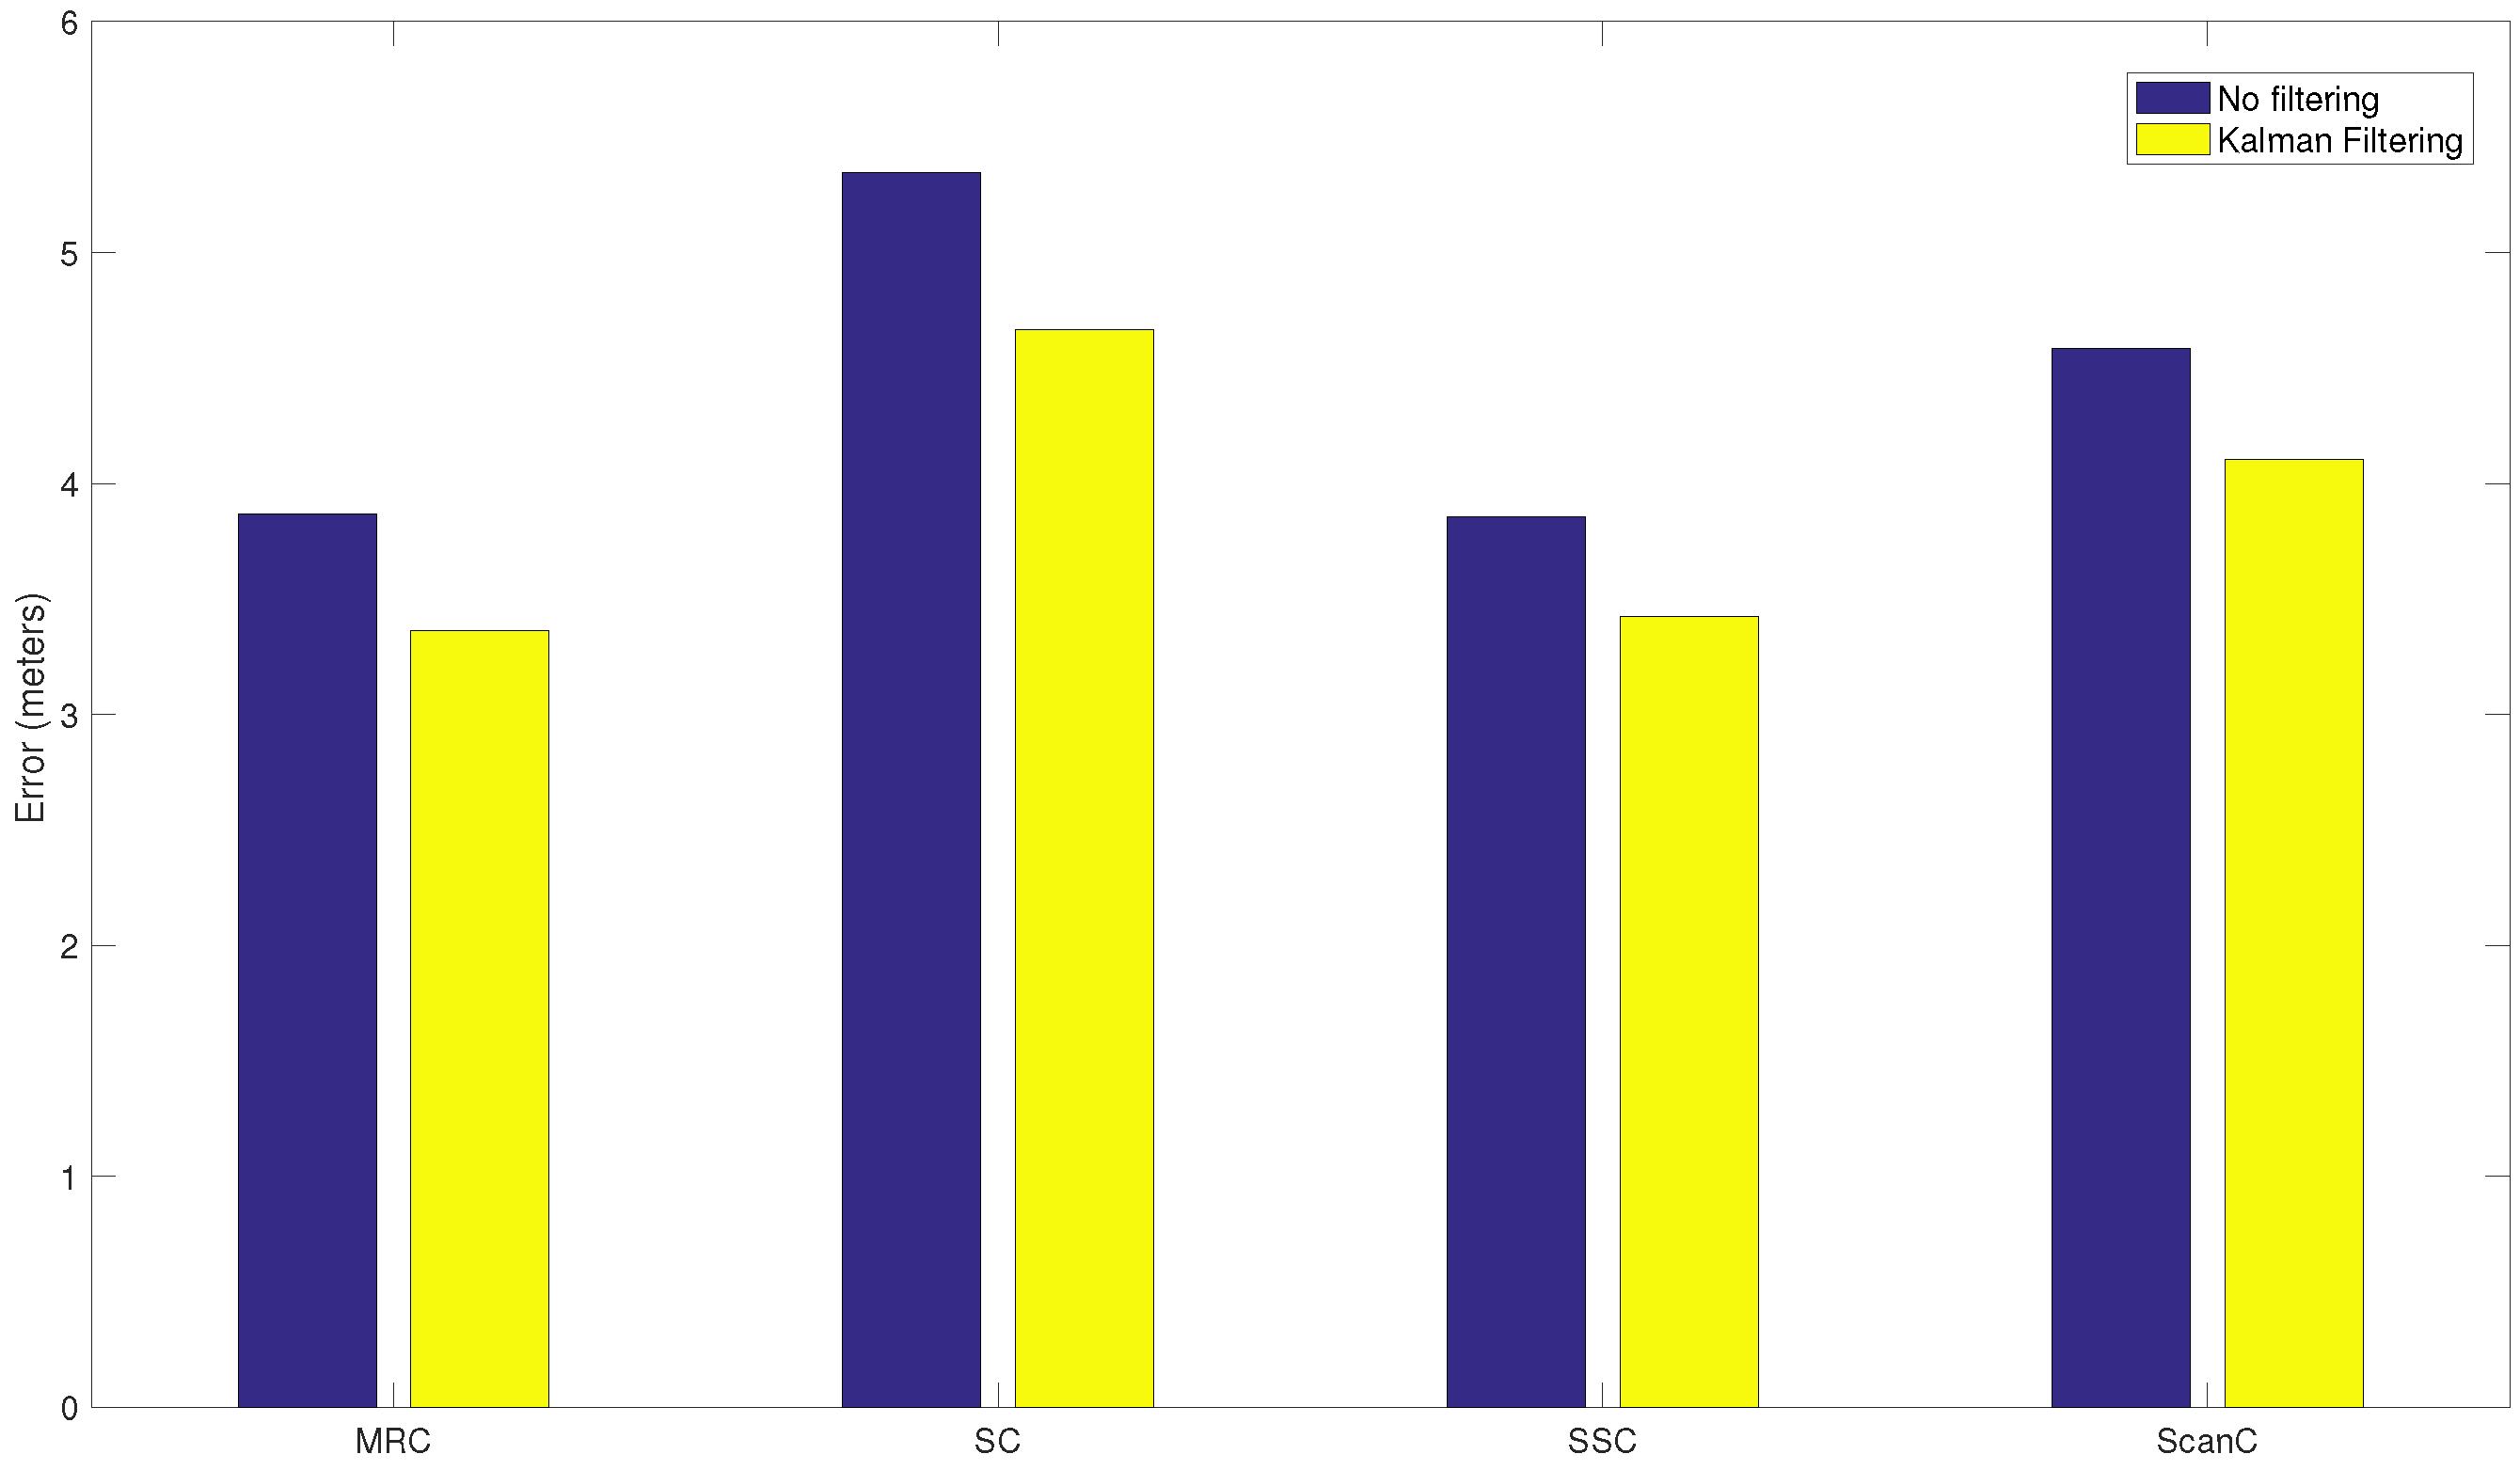
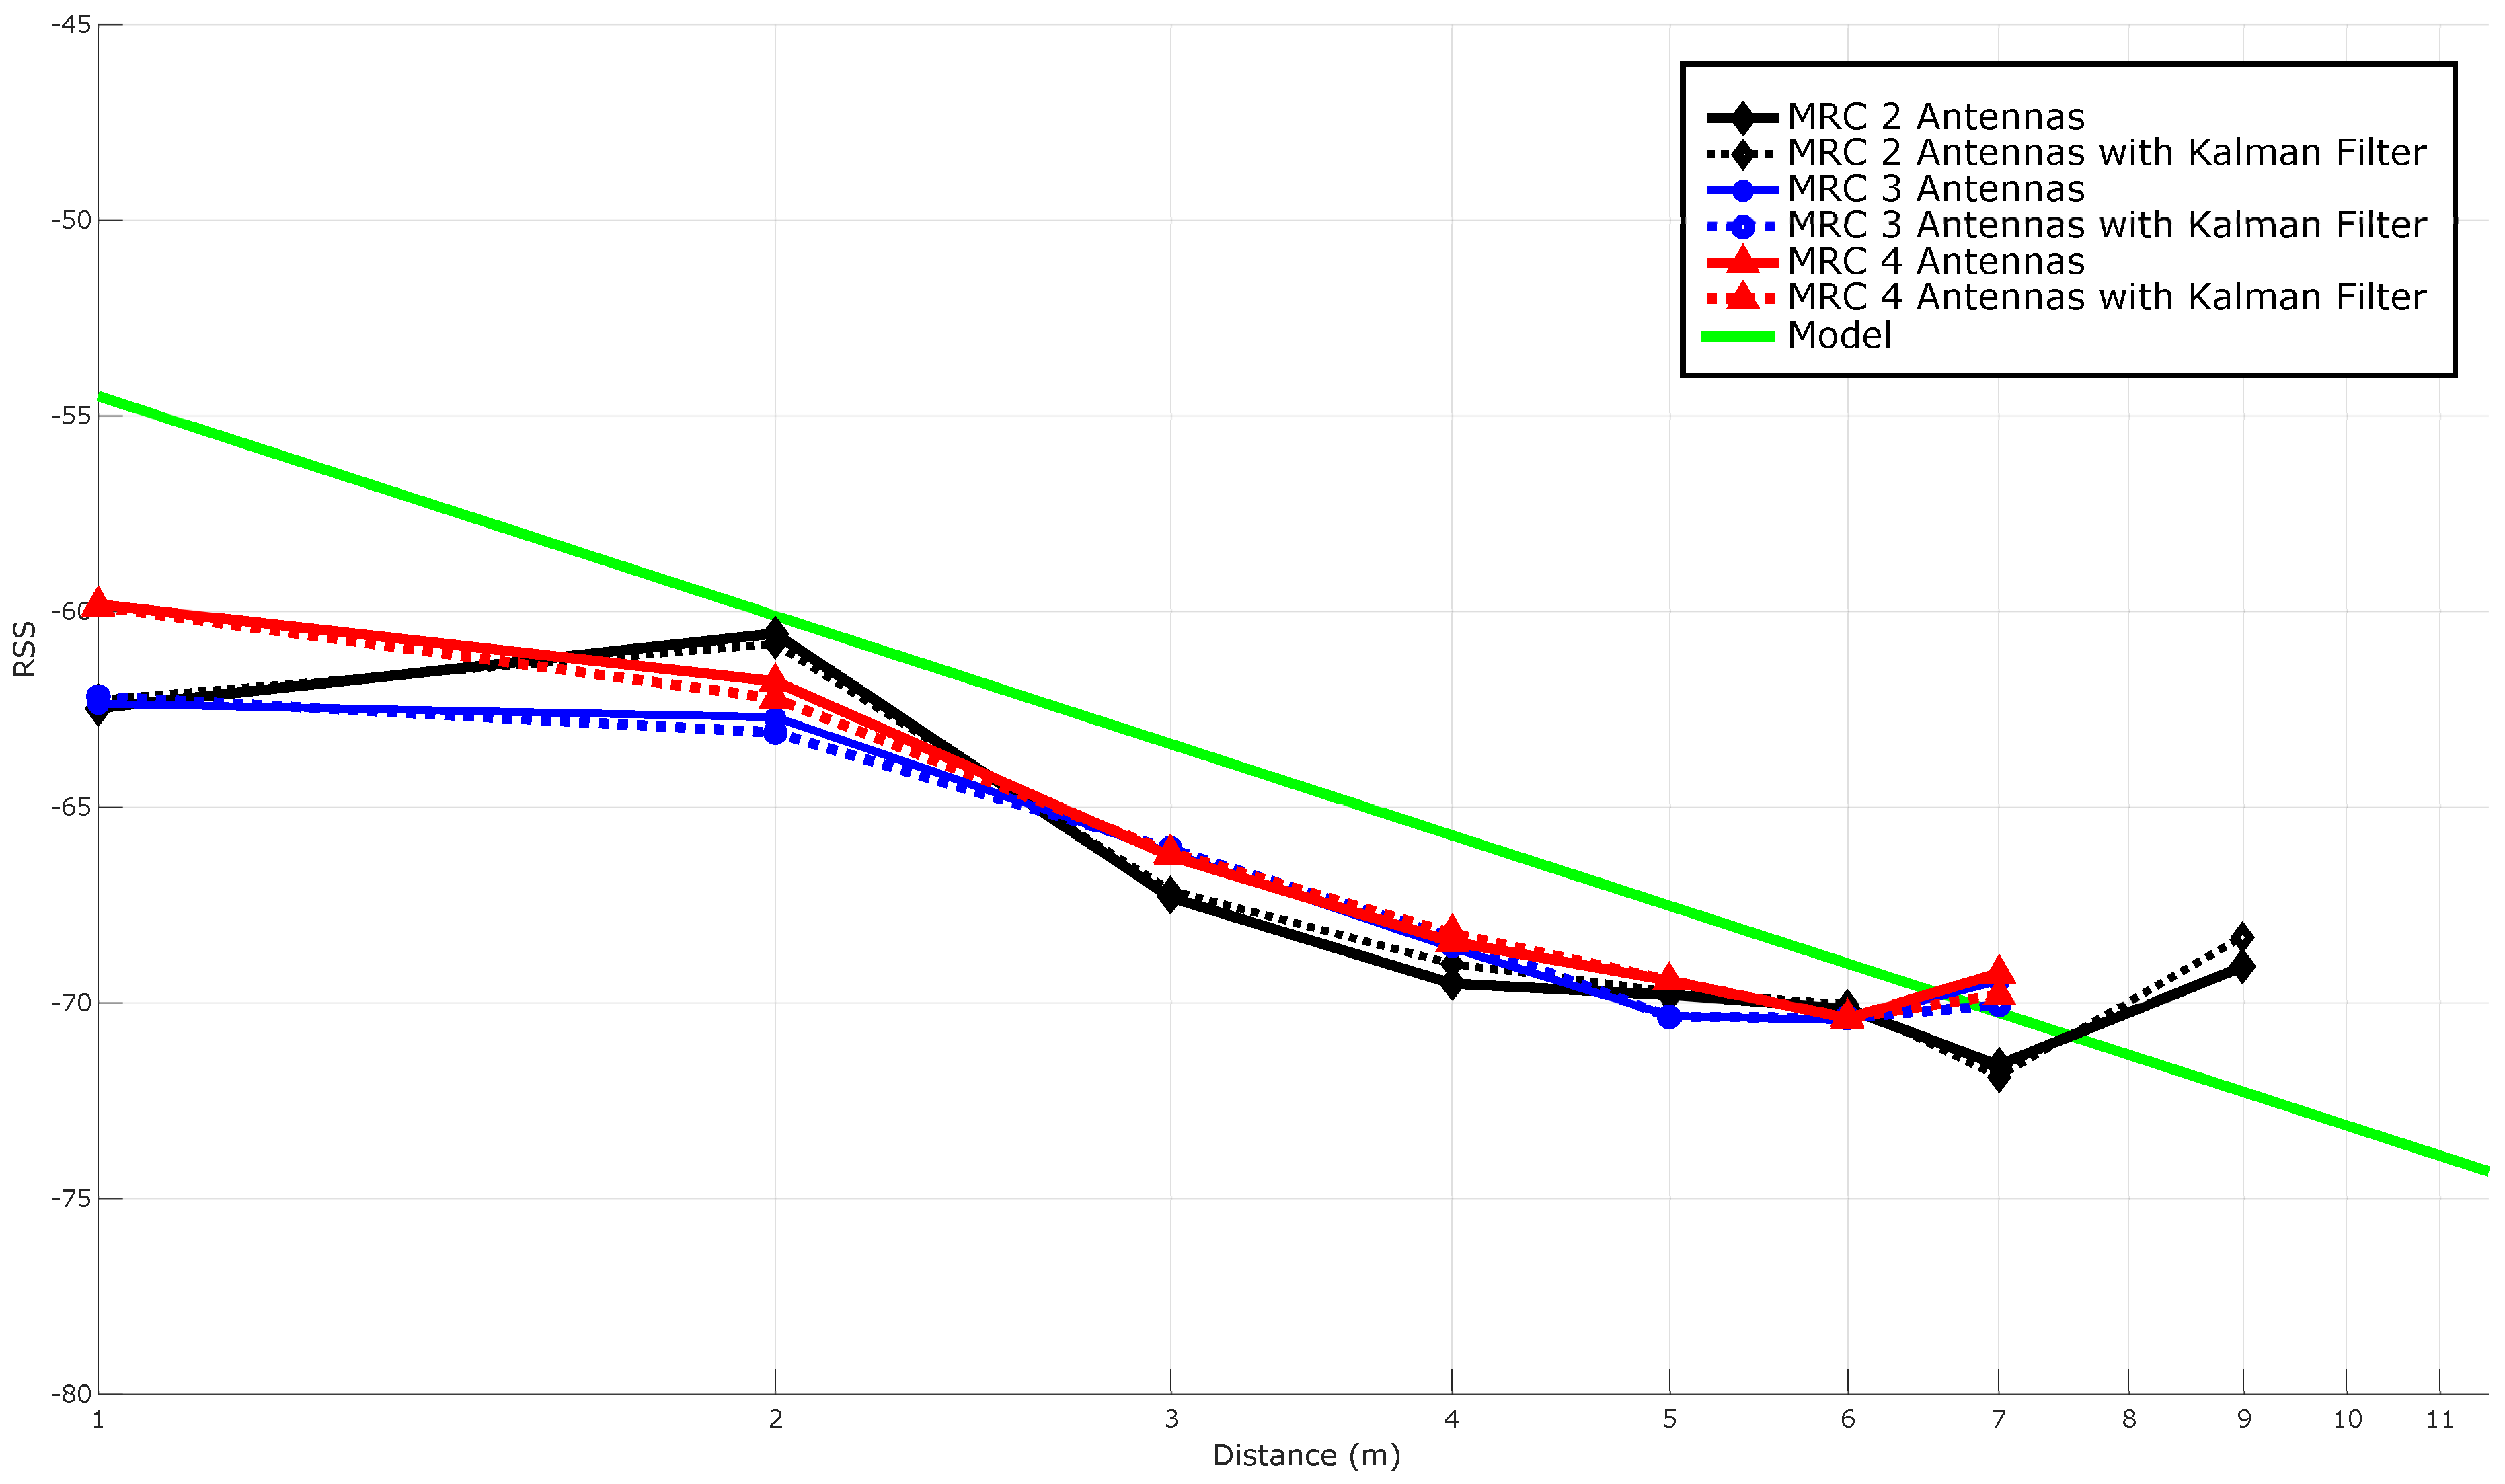
- Maximum-Ratio Combiner (MRC). Unlike EGC, this method weights each RSS depending on its signal quality. That is, it gives more weight to the most positive RSSs than to the lower ones. To carry out this computation the following expression was chosen:where is the smallest RSS that can be obtained.
Selection Methods
- Selection Combiner (SC). This technique consists in sorting the available measurements from higher to lower, choosing only one value. The aim of this method is to achieve the best RSS level for each instant, without considering the RSS fluctuations. In practical applications, the highest value is usually chosen, which is the criterion used in the implementation evaluated in the Experiments Section.
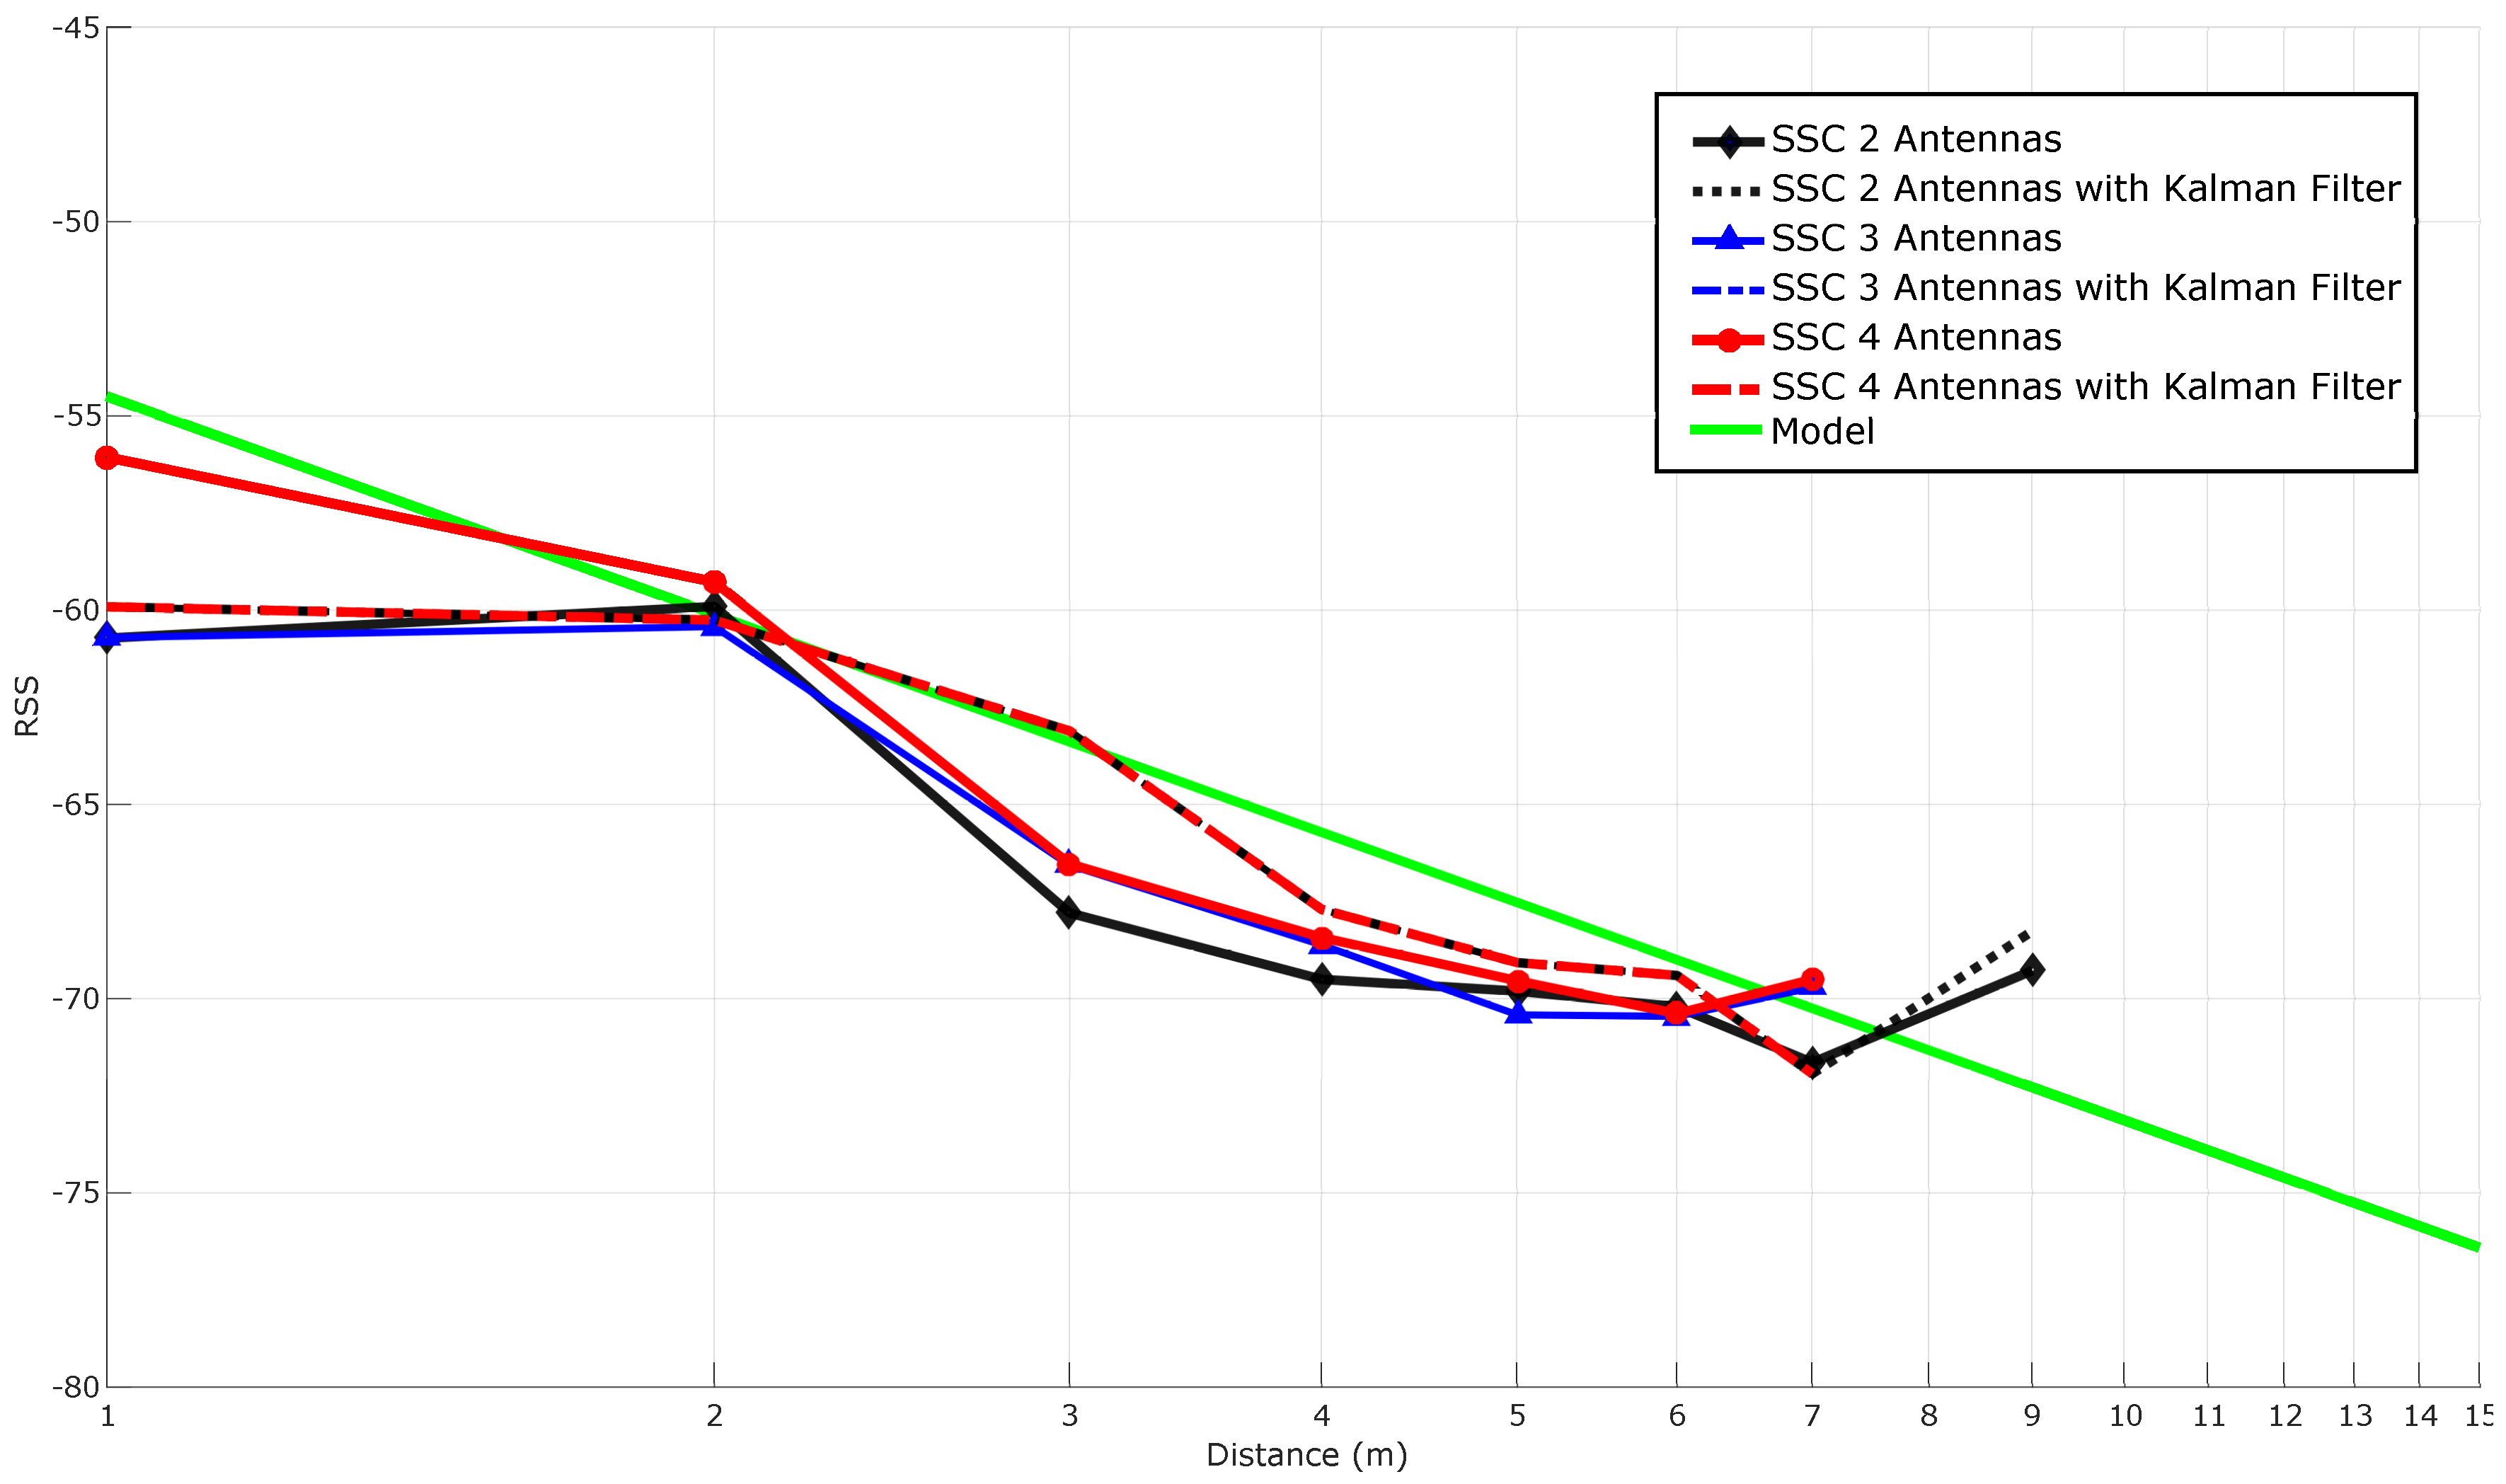
- Switch-and-Stay Combiner (SSC). This algorithm first chooses one antenna, through which the RSS is received until it falls under a threshold, which has been previously set. In that moment, the algorithm switches to the next antenna without verifying its RSS. There exists the possibility of changing the threshold dynamically, but in the present paper it is only considered the case when the threshold remains constant. It is important to emphasize that the switching between antennas is performed in a blind way, so it is not guaranteed to get a better RSS with the switching. Without a doubt, the most important issue for this method is the calibration of the optimum switching threshold. To carry out this task, the optimum threshold was decided according to an estimator of the signal dispersion. Specifically, in the experiments, the threshold was set depending on the signal variance.
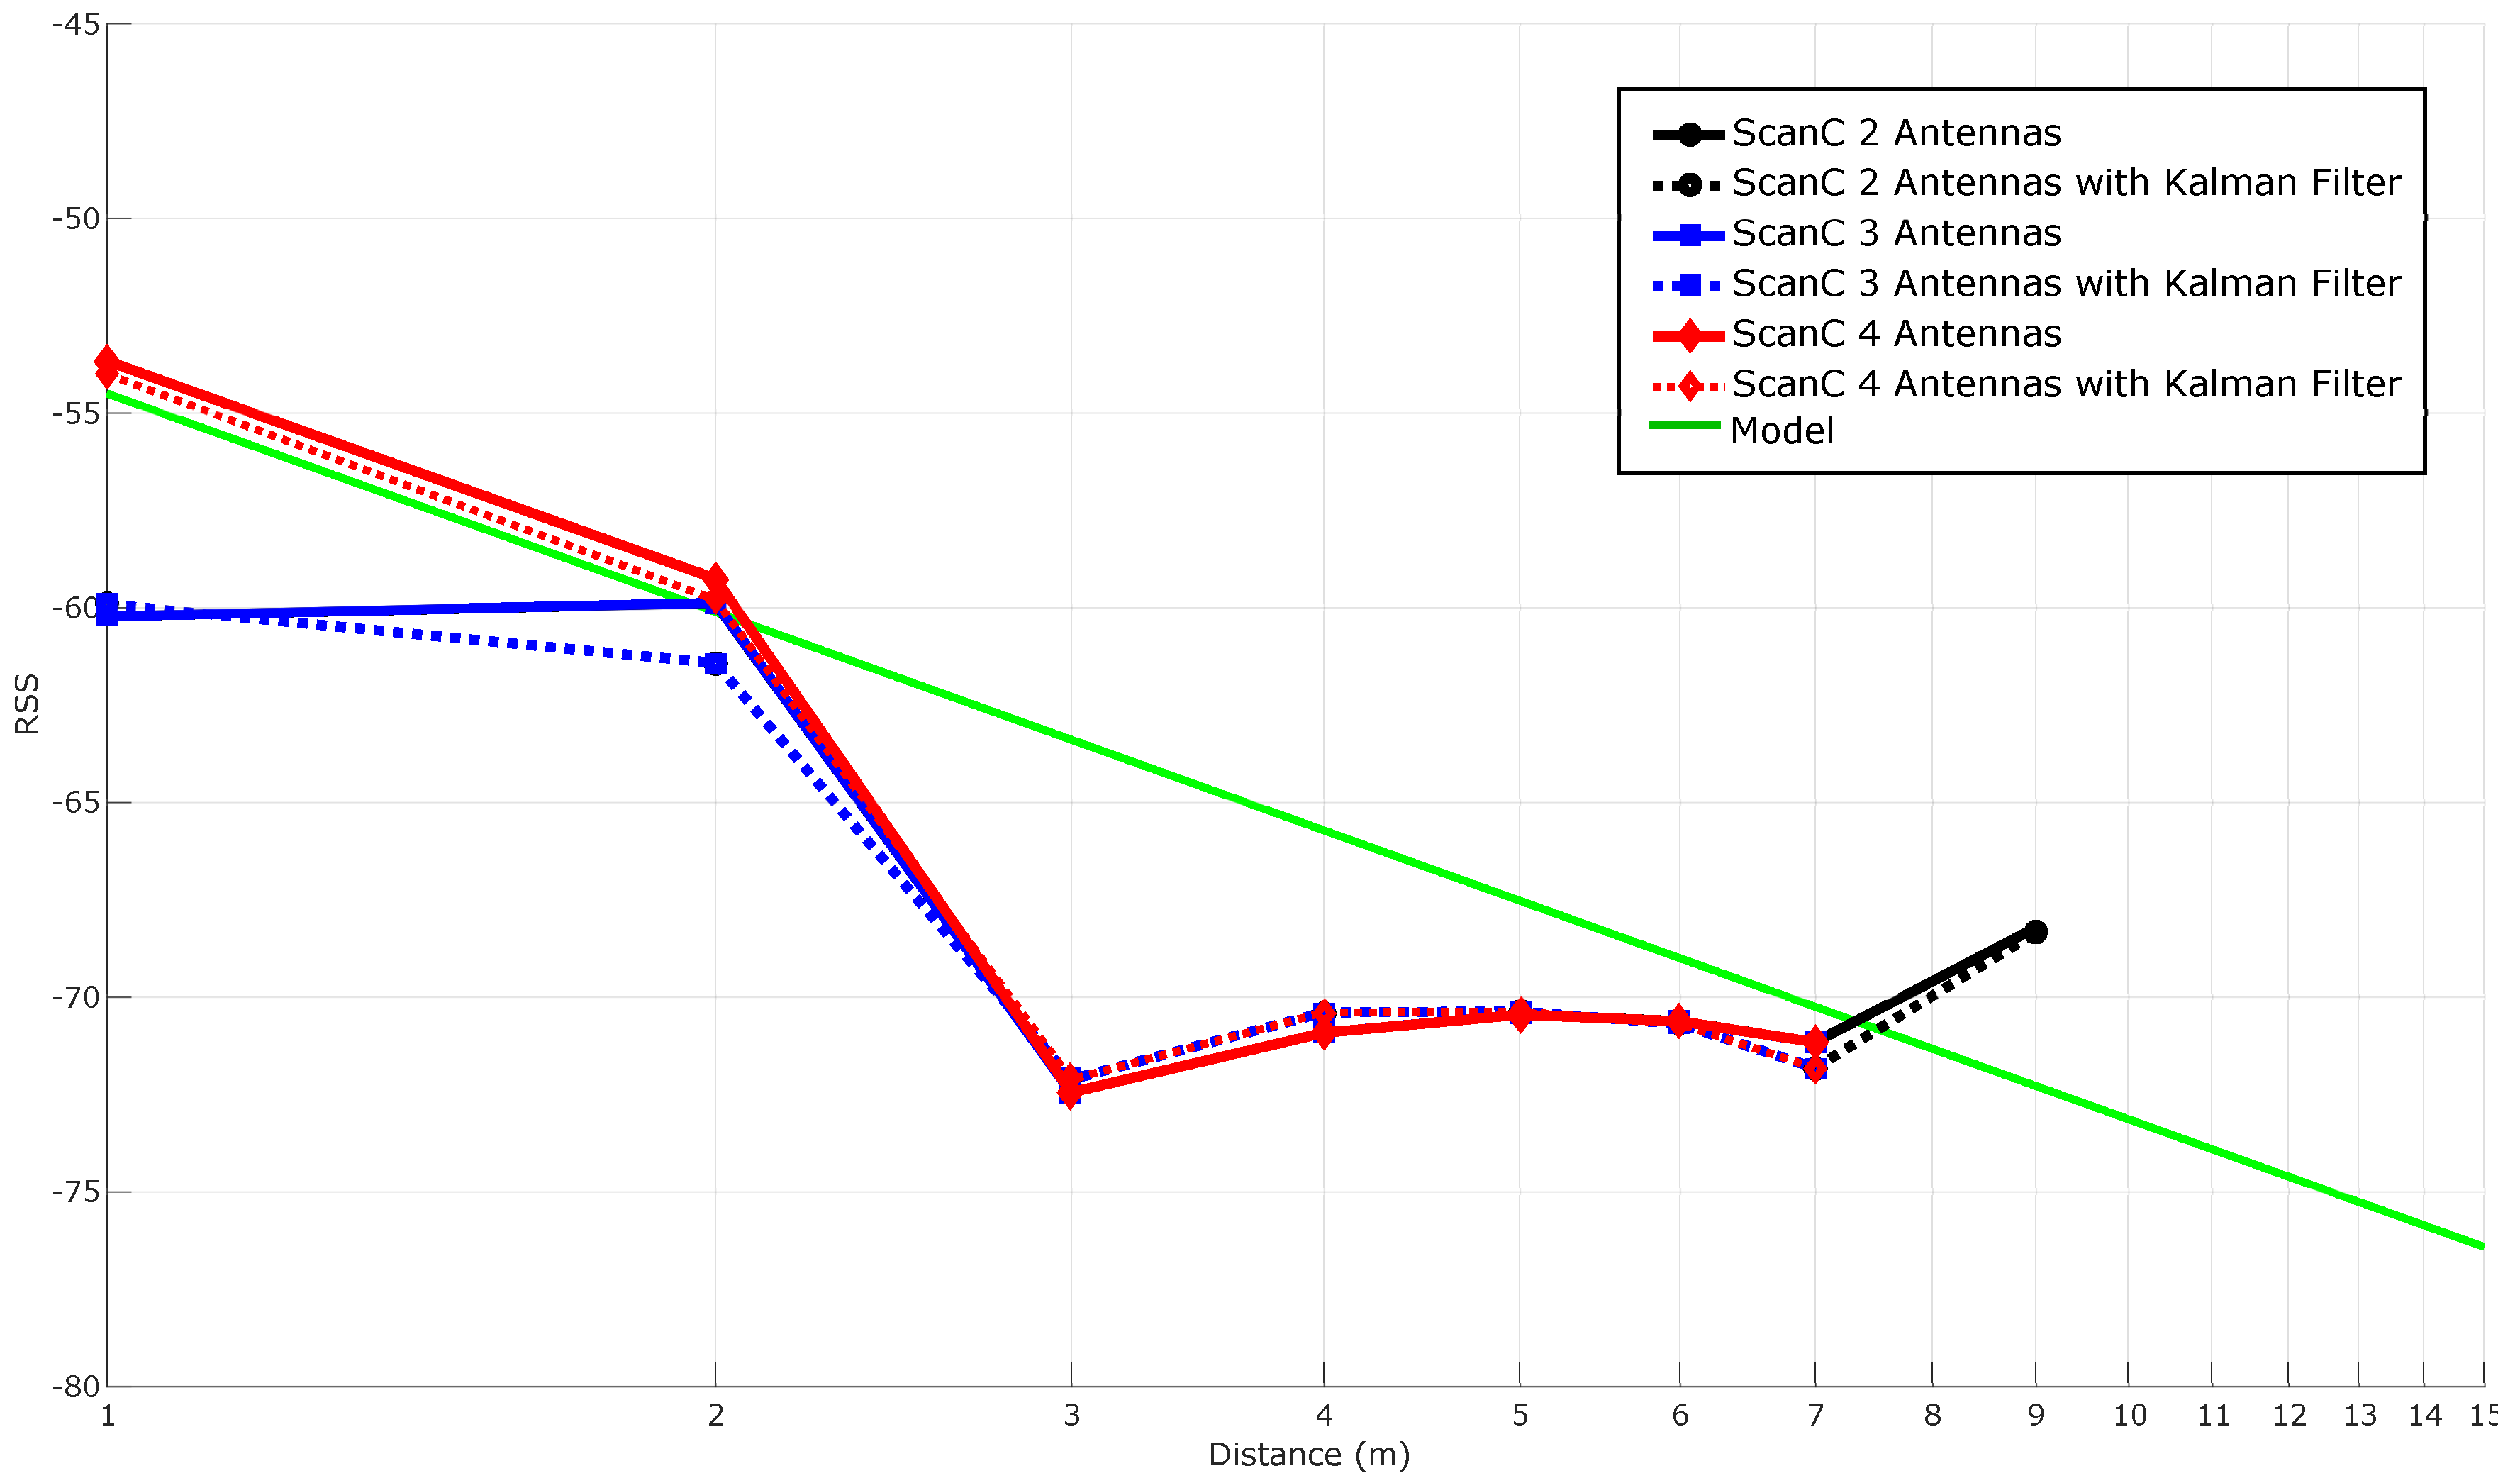
- Scanner Combining (ScanC). This method is similar to SCC, but instead of making a blind switching when the threshold is exceeded, it checks each antenna until it finds one over the threshold. If there are not any antennas above the threshold, the method keeps on using the same antenna. Like with SCC, the value of the switching threshold is very important, because it decides the system behavior. Besides, as in the SCC algorithm, during the experiments, it was considered a switching threshold that minimizes the variance.
5. Experiments
5.1. Selected Hardware
5.1.1. Passive RFID Hardware
5.1.2. Active RFID Hardware
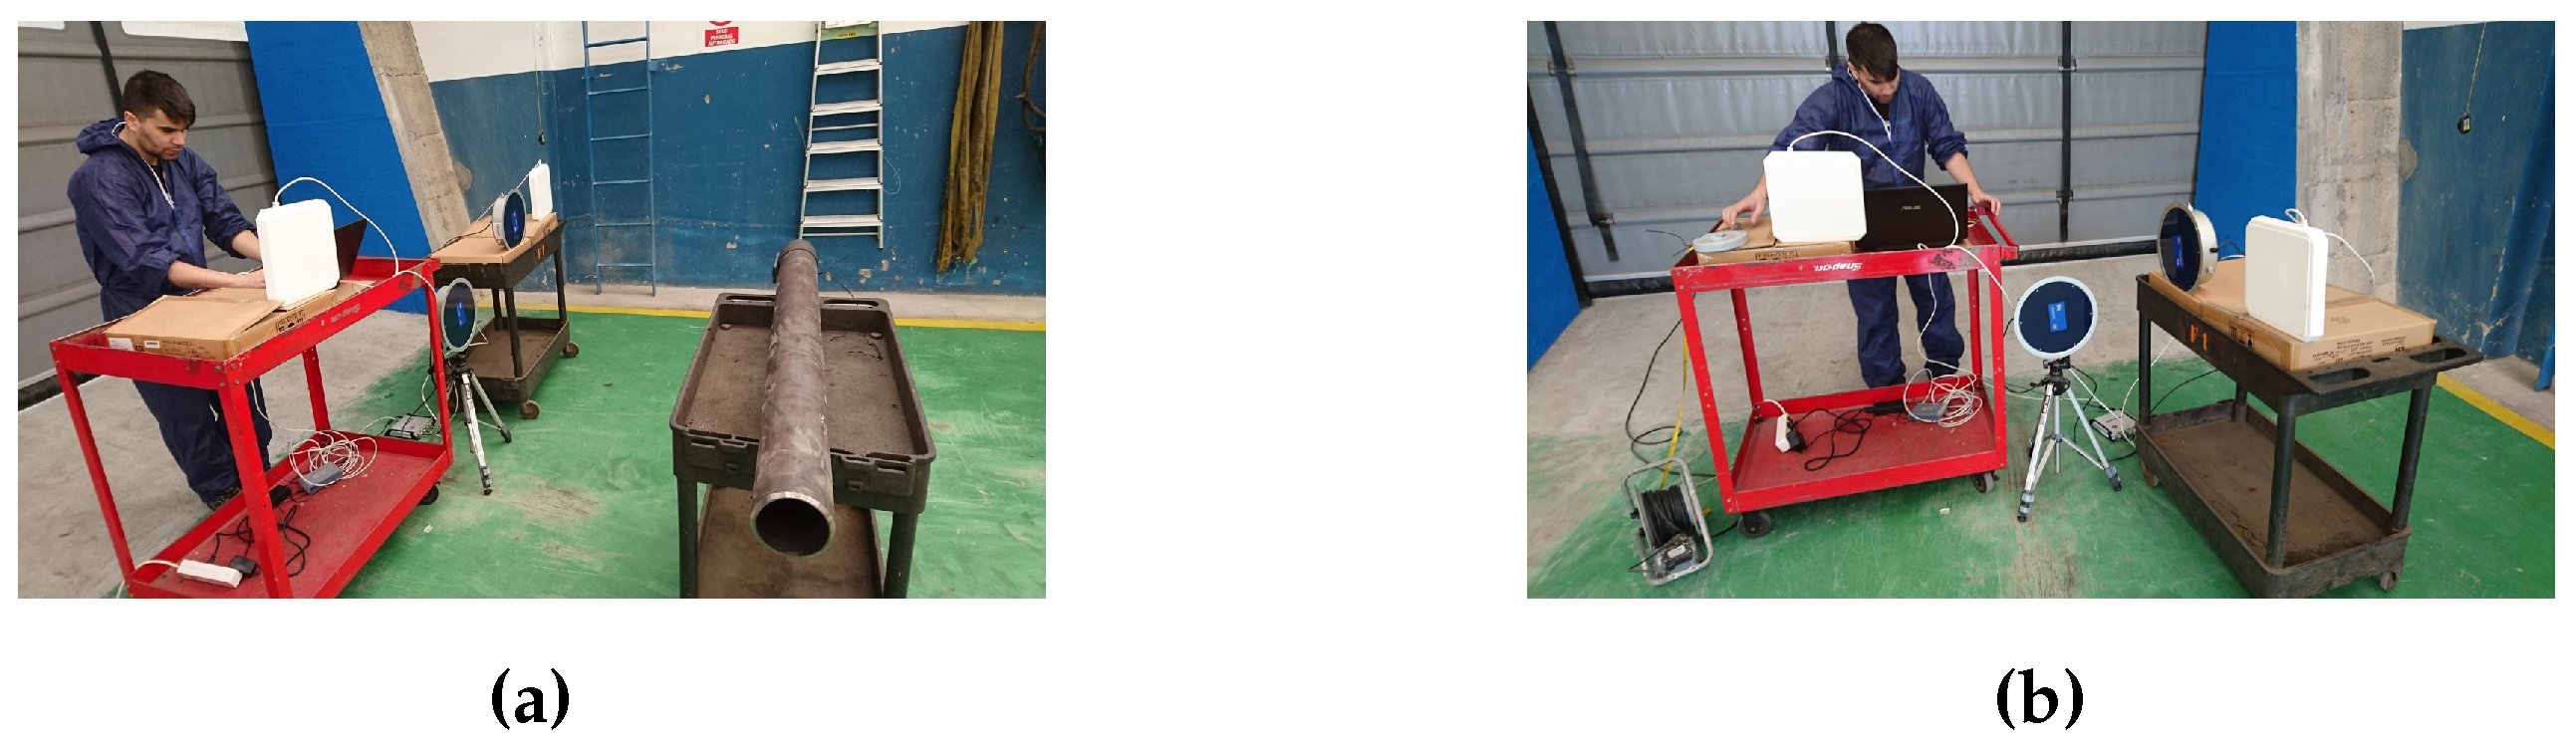
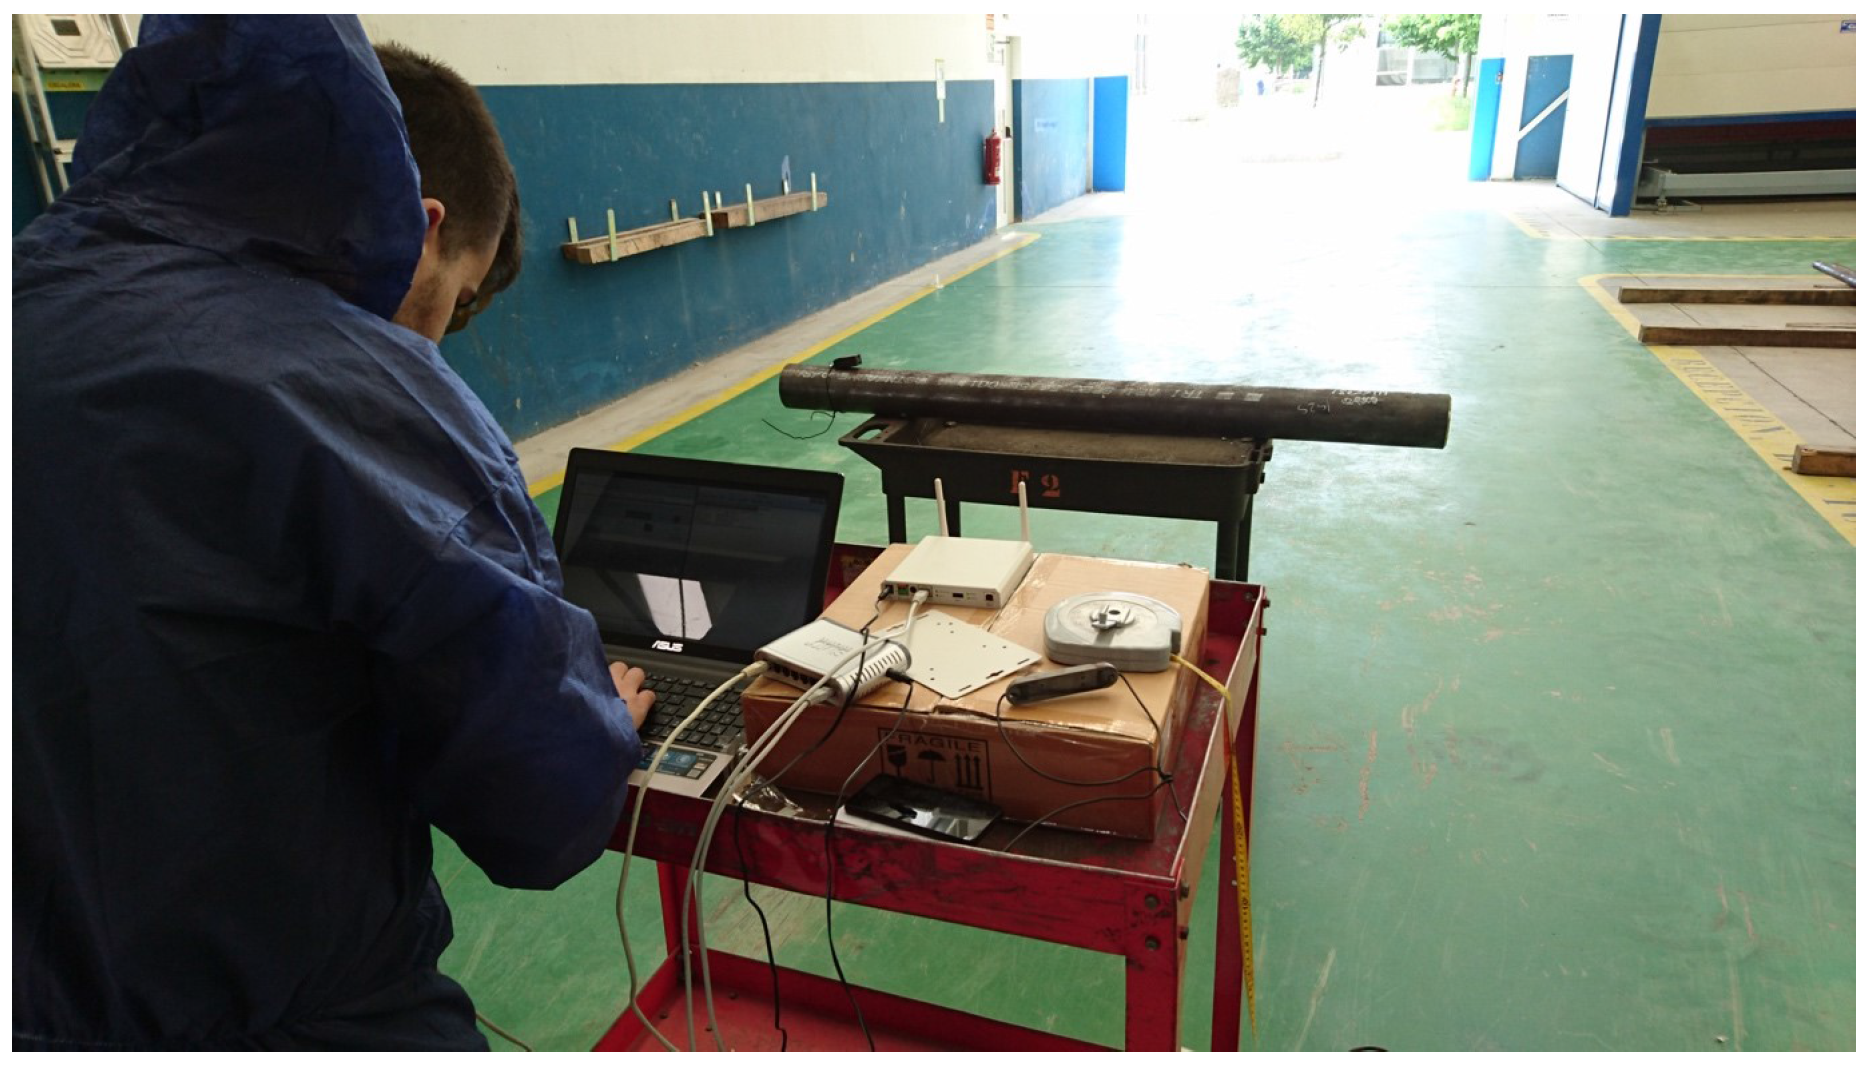
5.2. Test Methodology
5.3. Passive RFID Tests
5.3.1. Maximum Reading Distance
5.3.2. Improving the Antenna’s Reading Angle
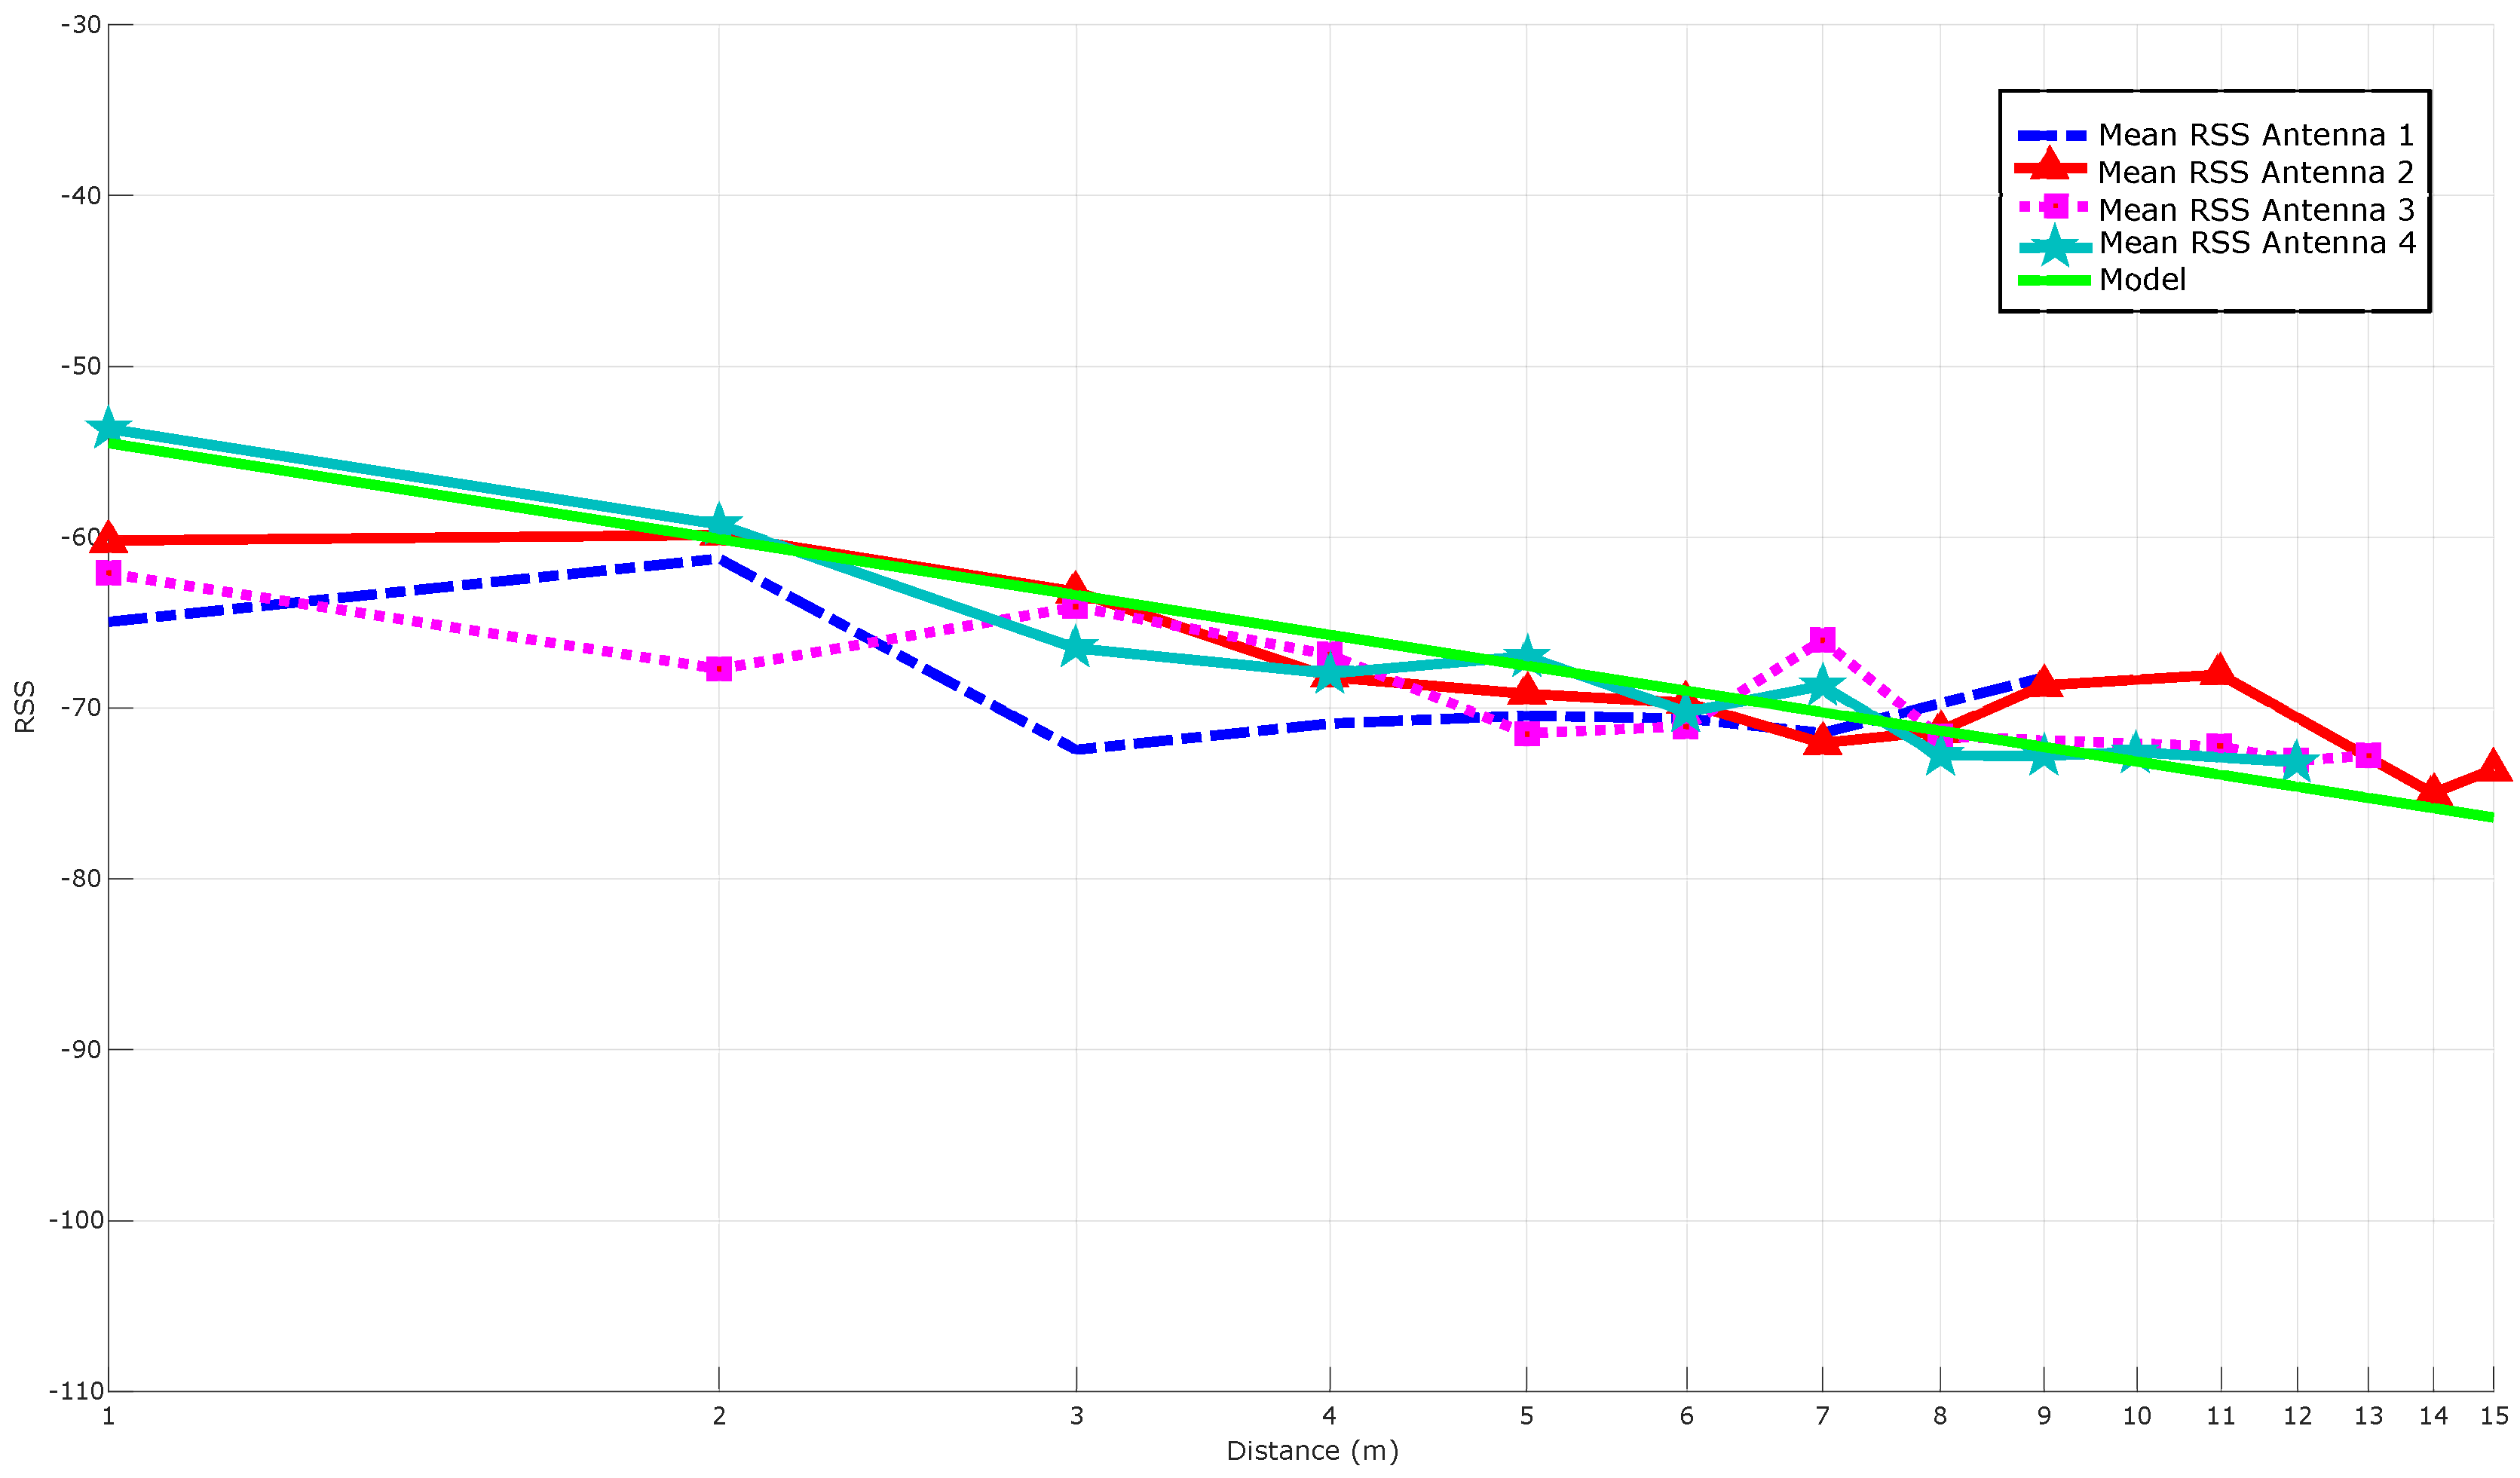
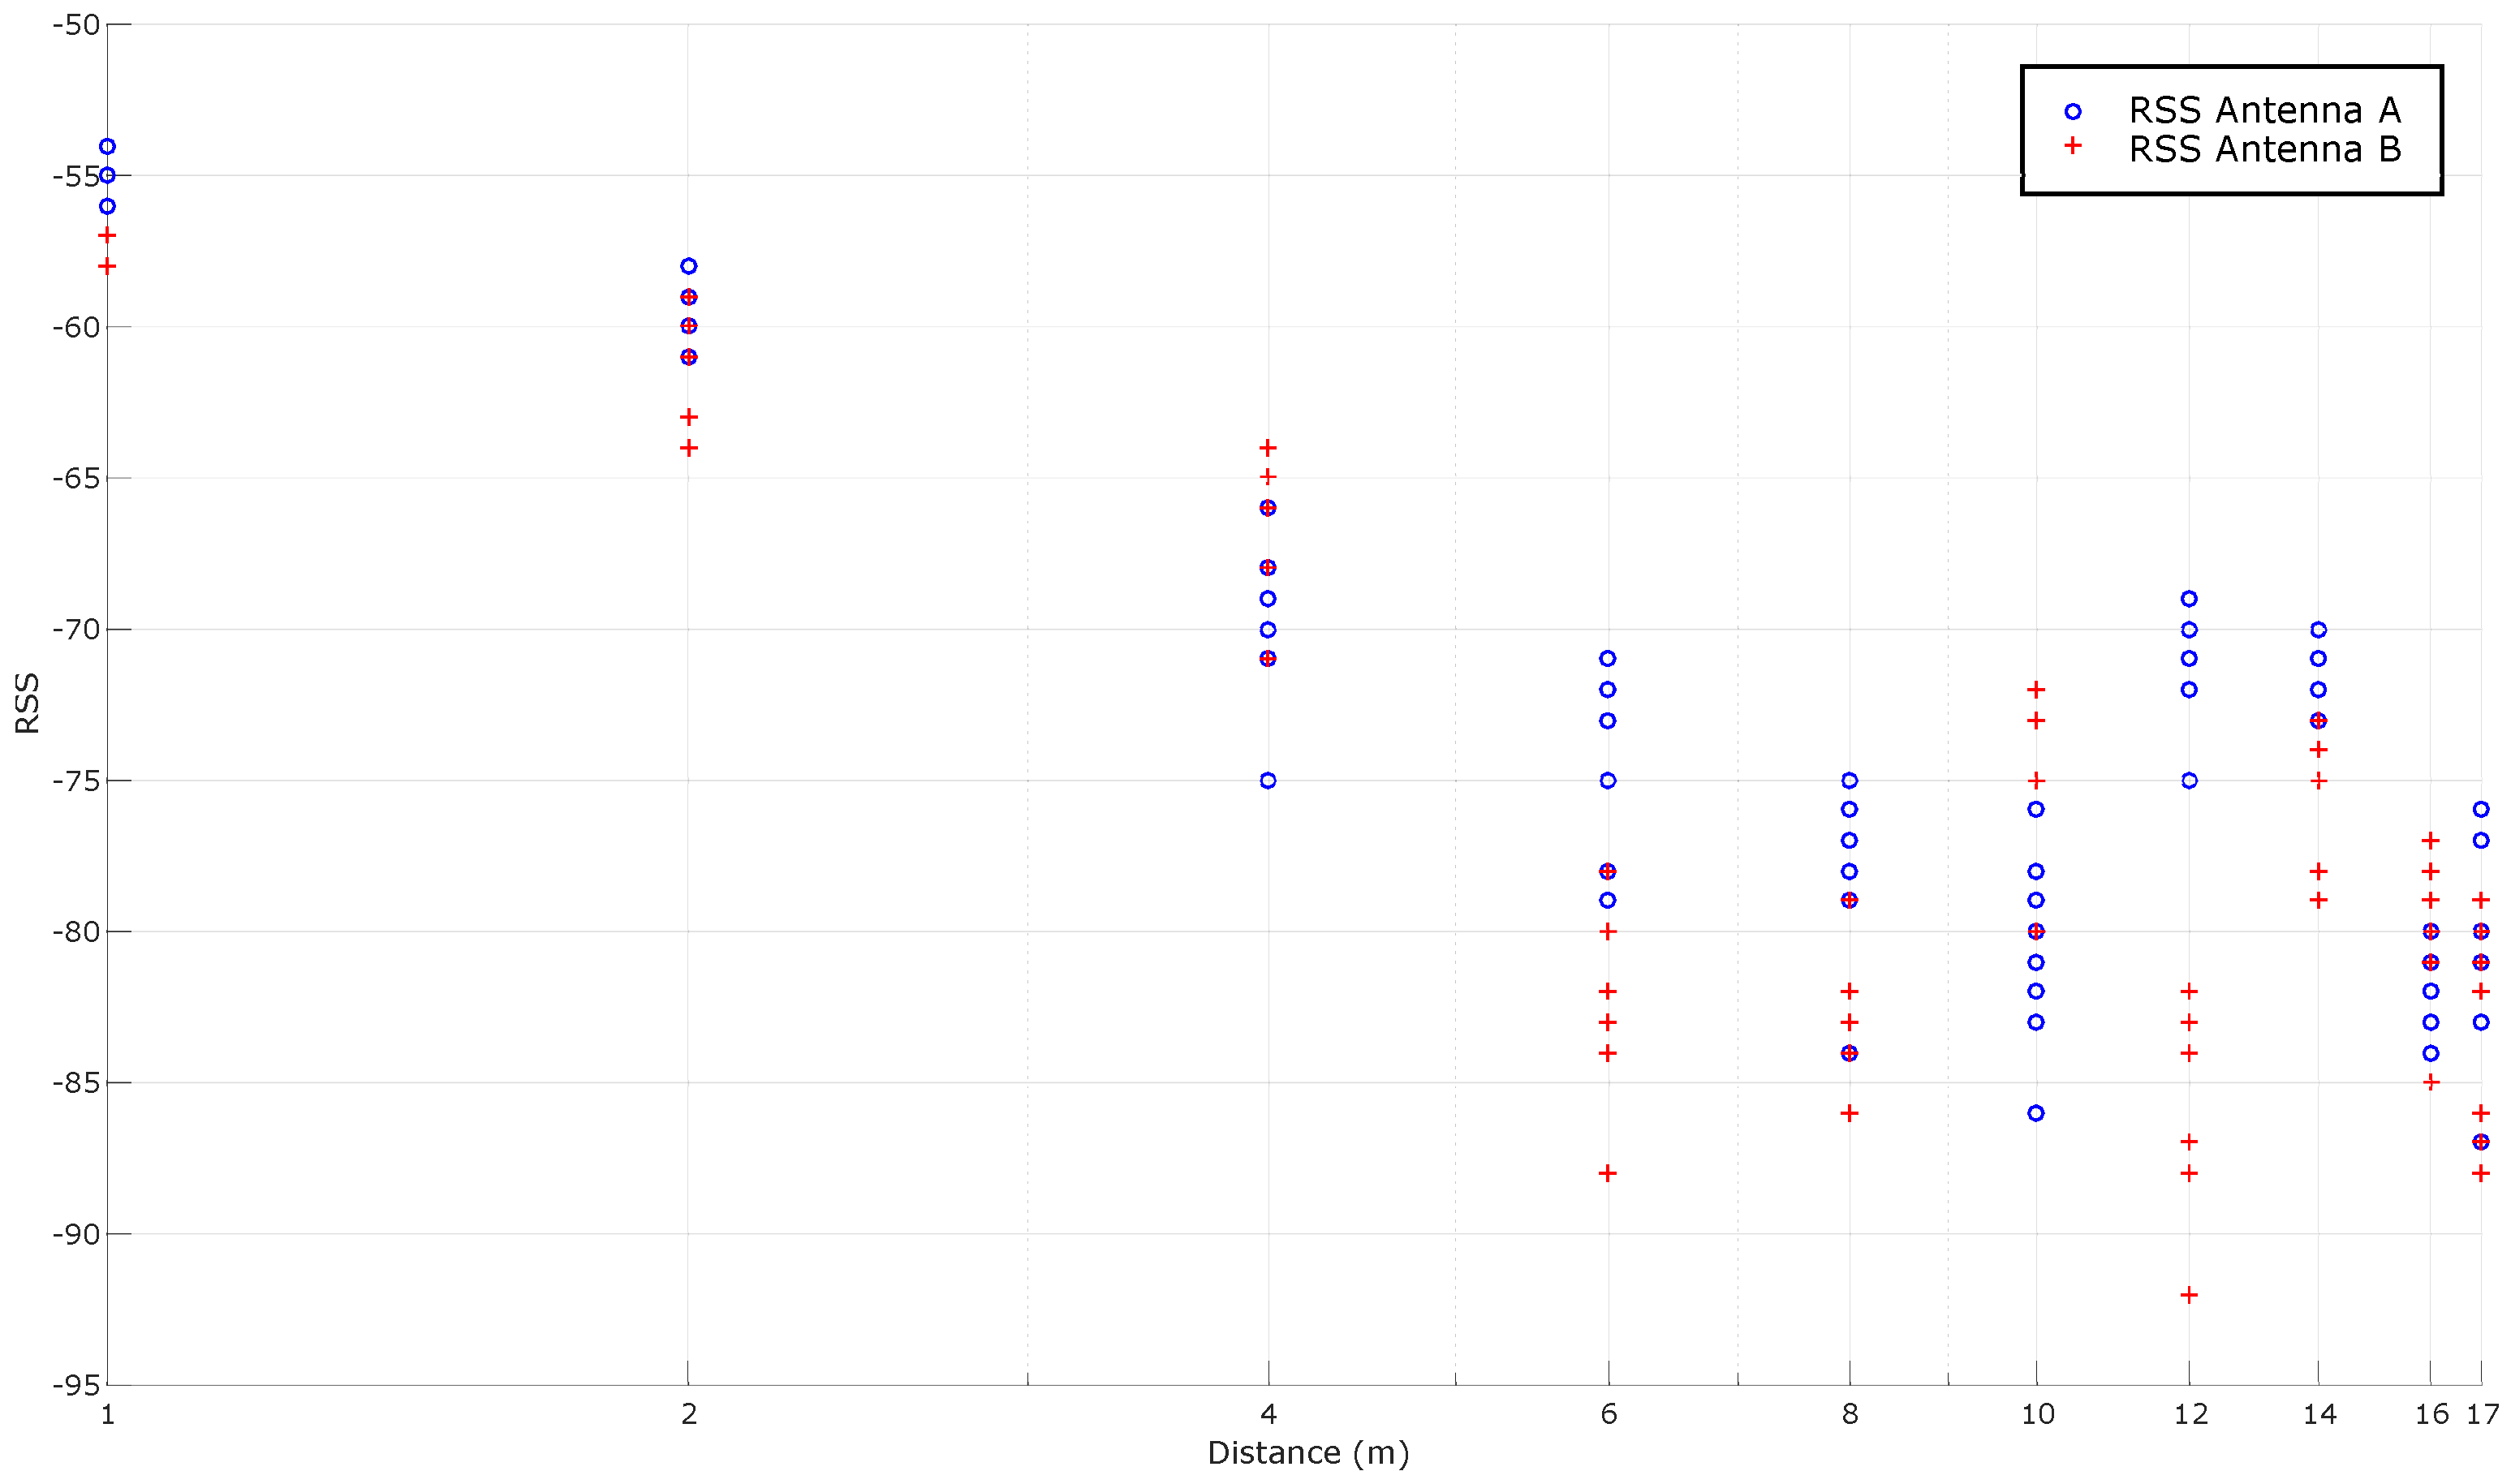
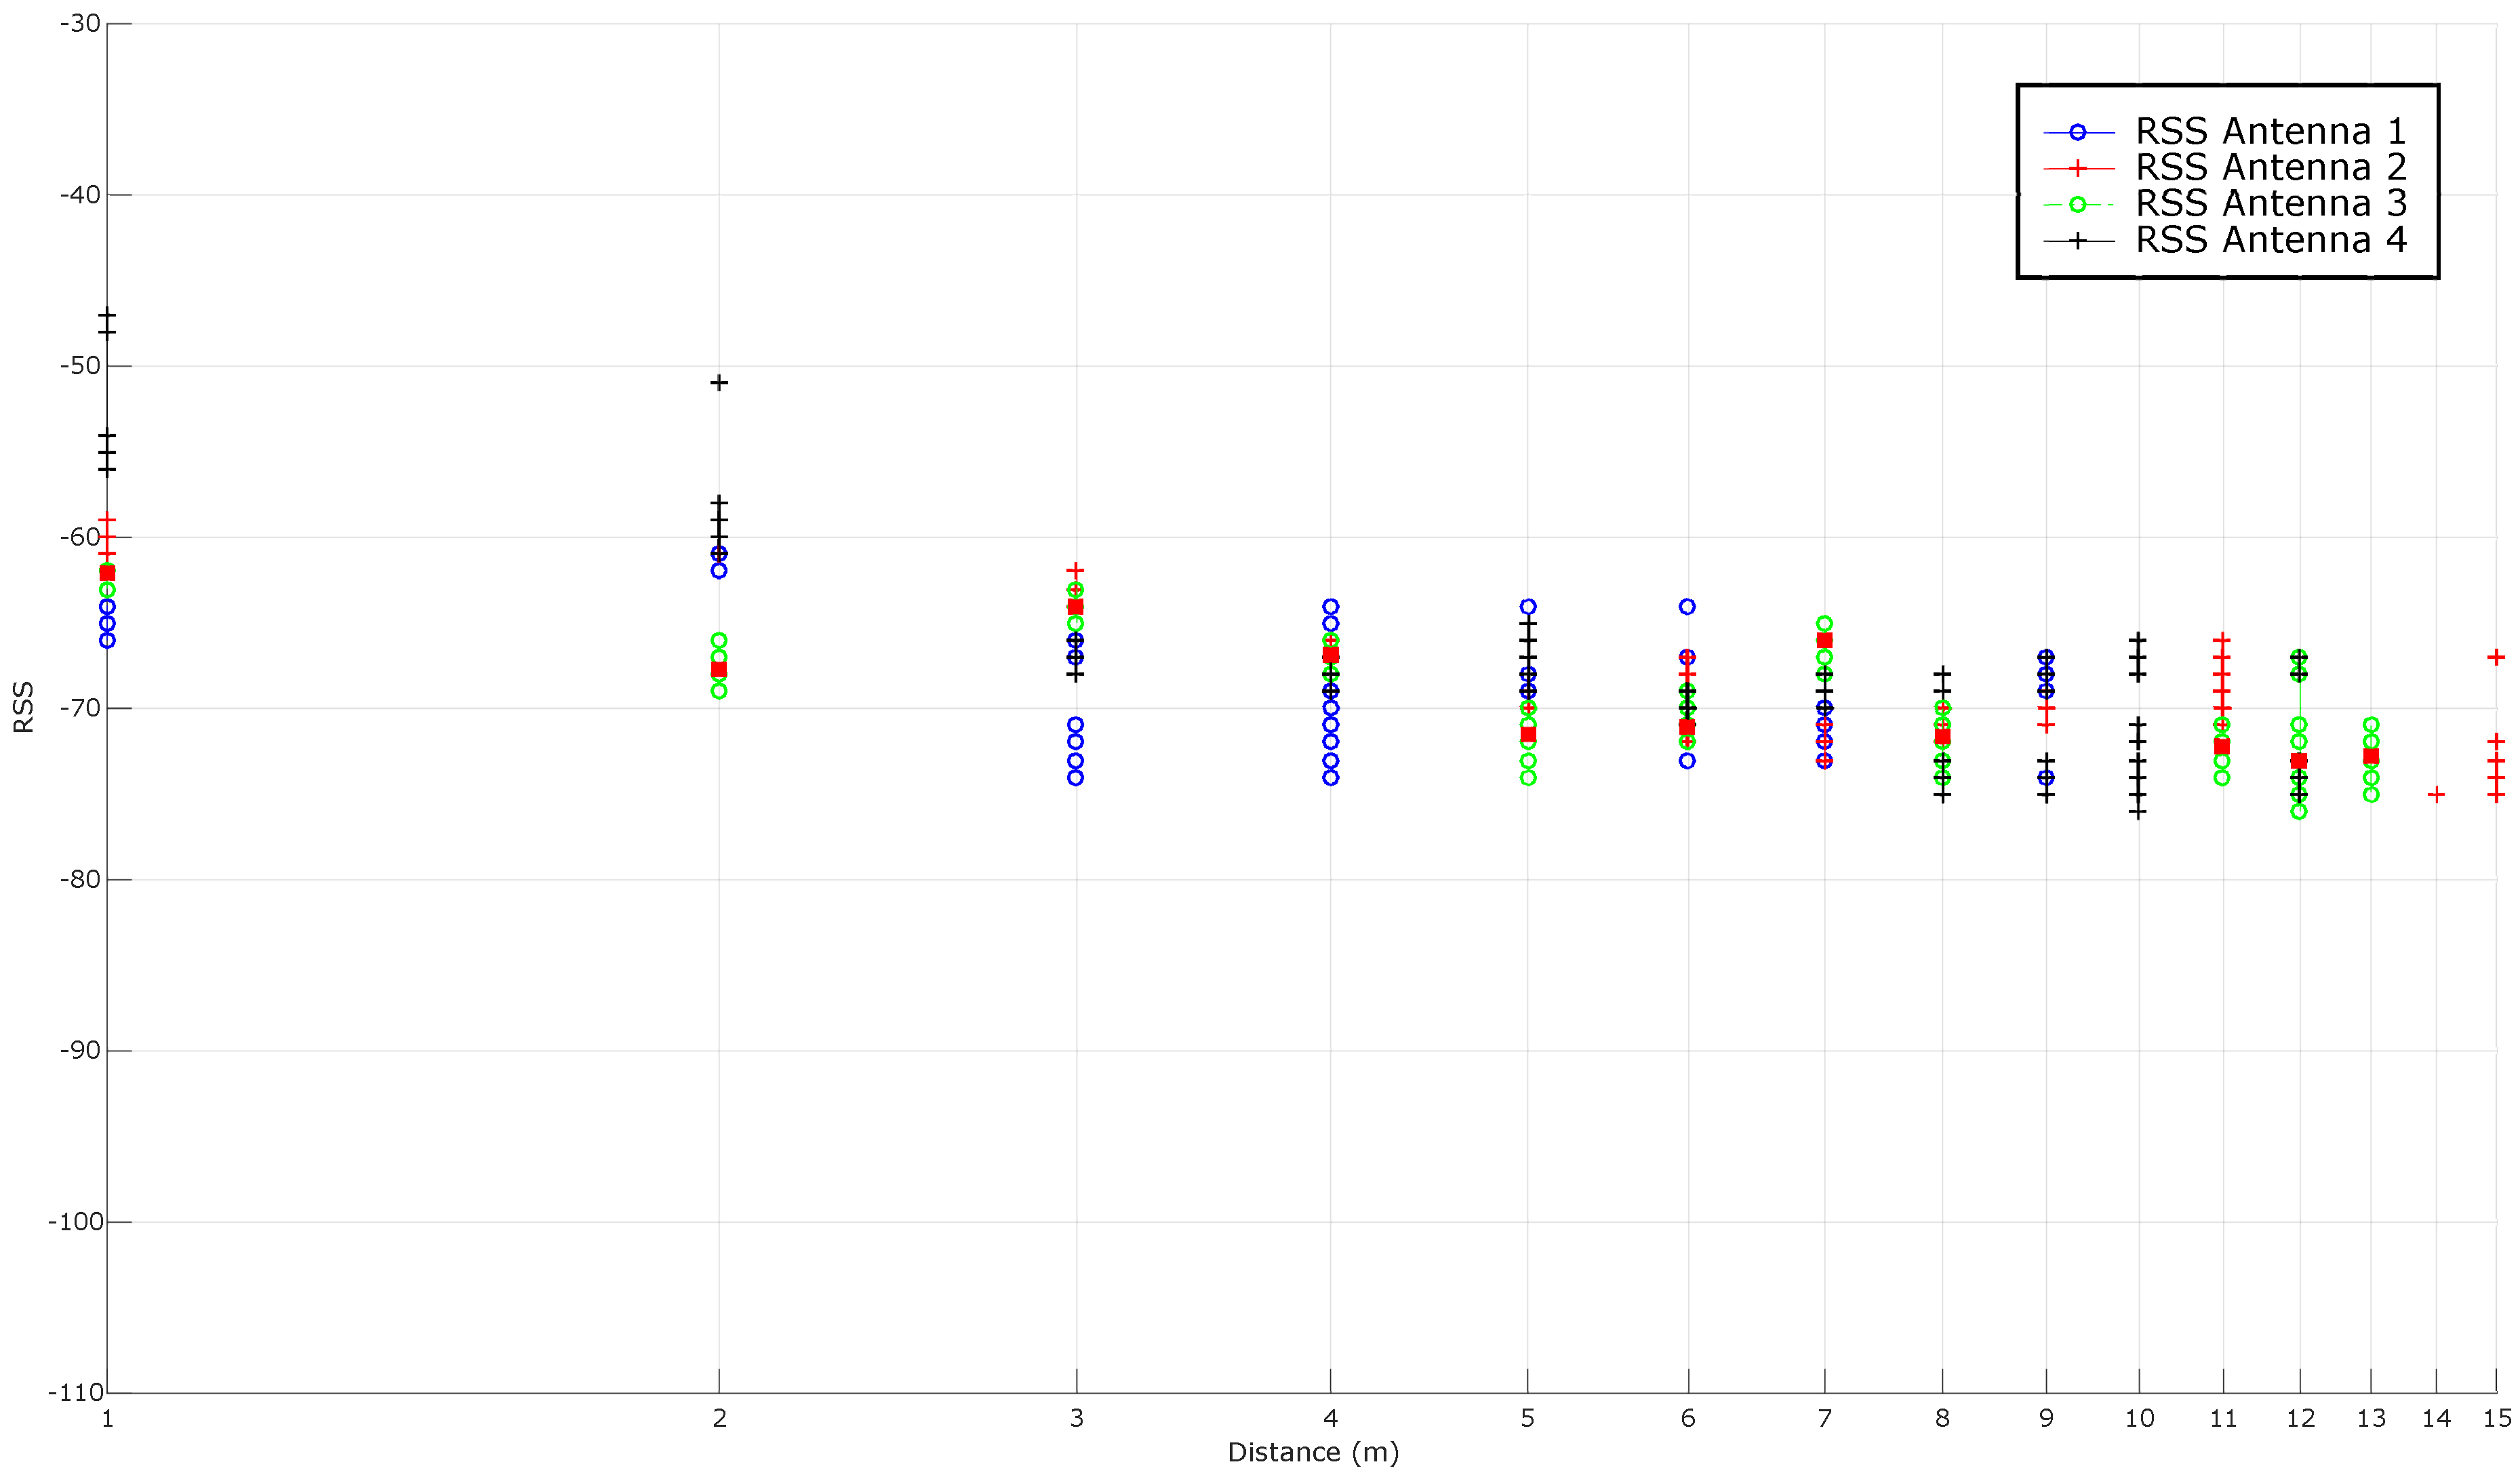
5.3.3. Modeling RSS vs. Distance
5.3.4. Reducing Noise: Kalman Filtering
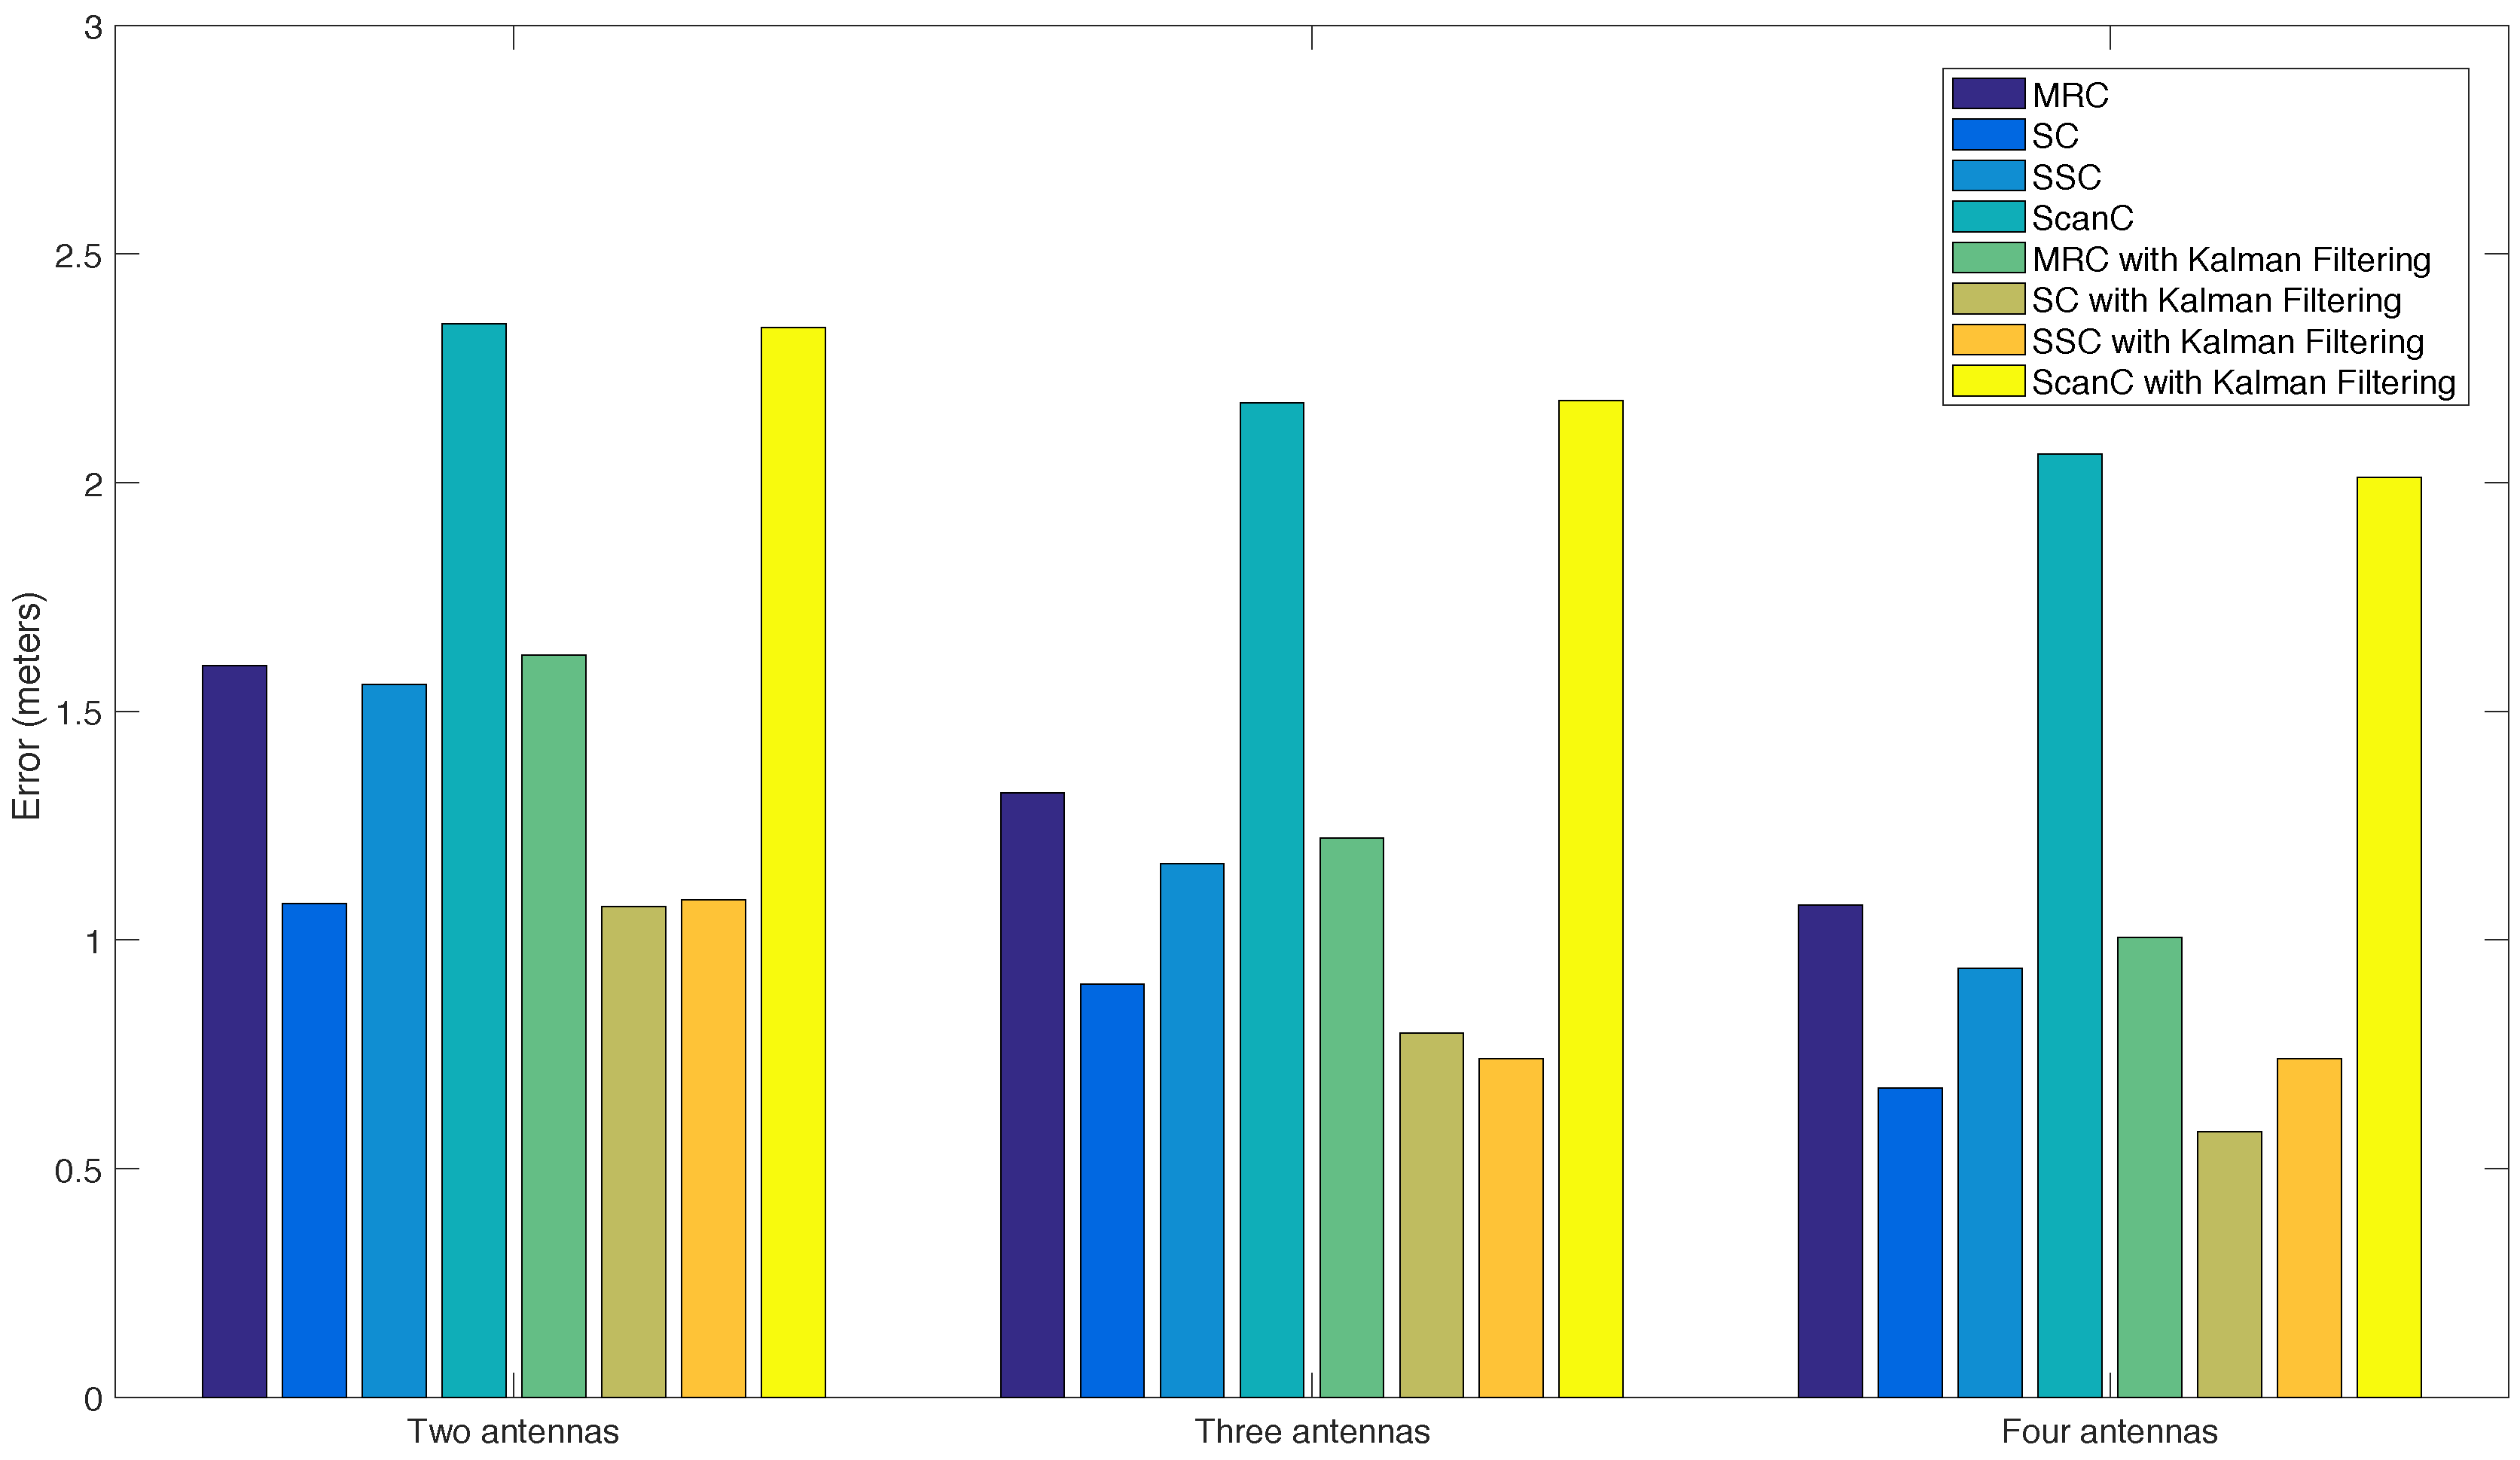
5.3.5. Stabilizing RSS with Spatial Diversity Techniques
5.3.6. Key Findings
5.4. Active RFID
5.4.1. Maximum Reading Distance
5.4.2. Modeling RSS vs. Distance
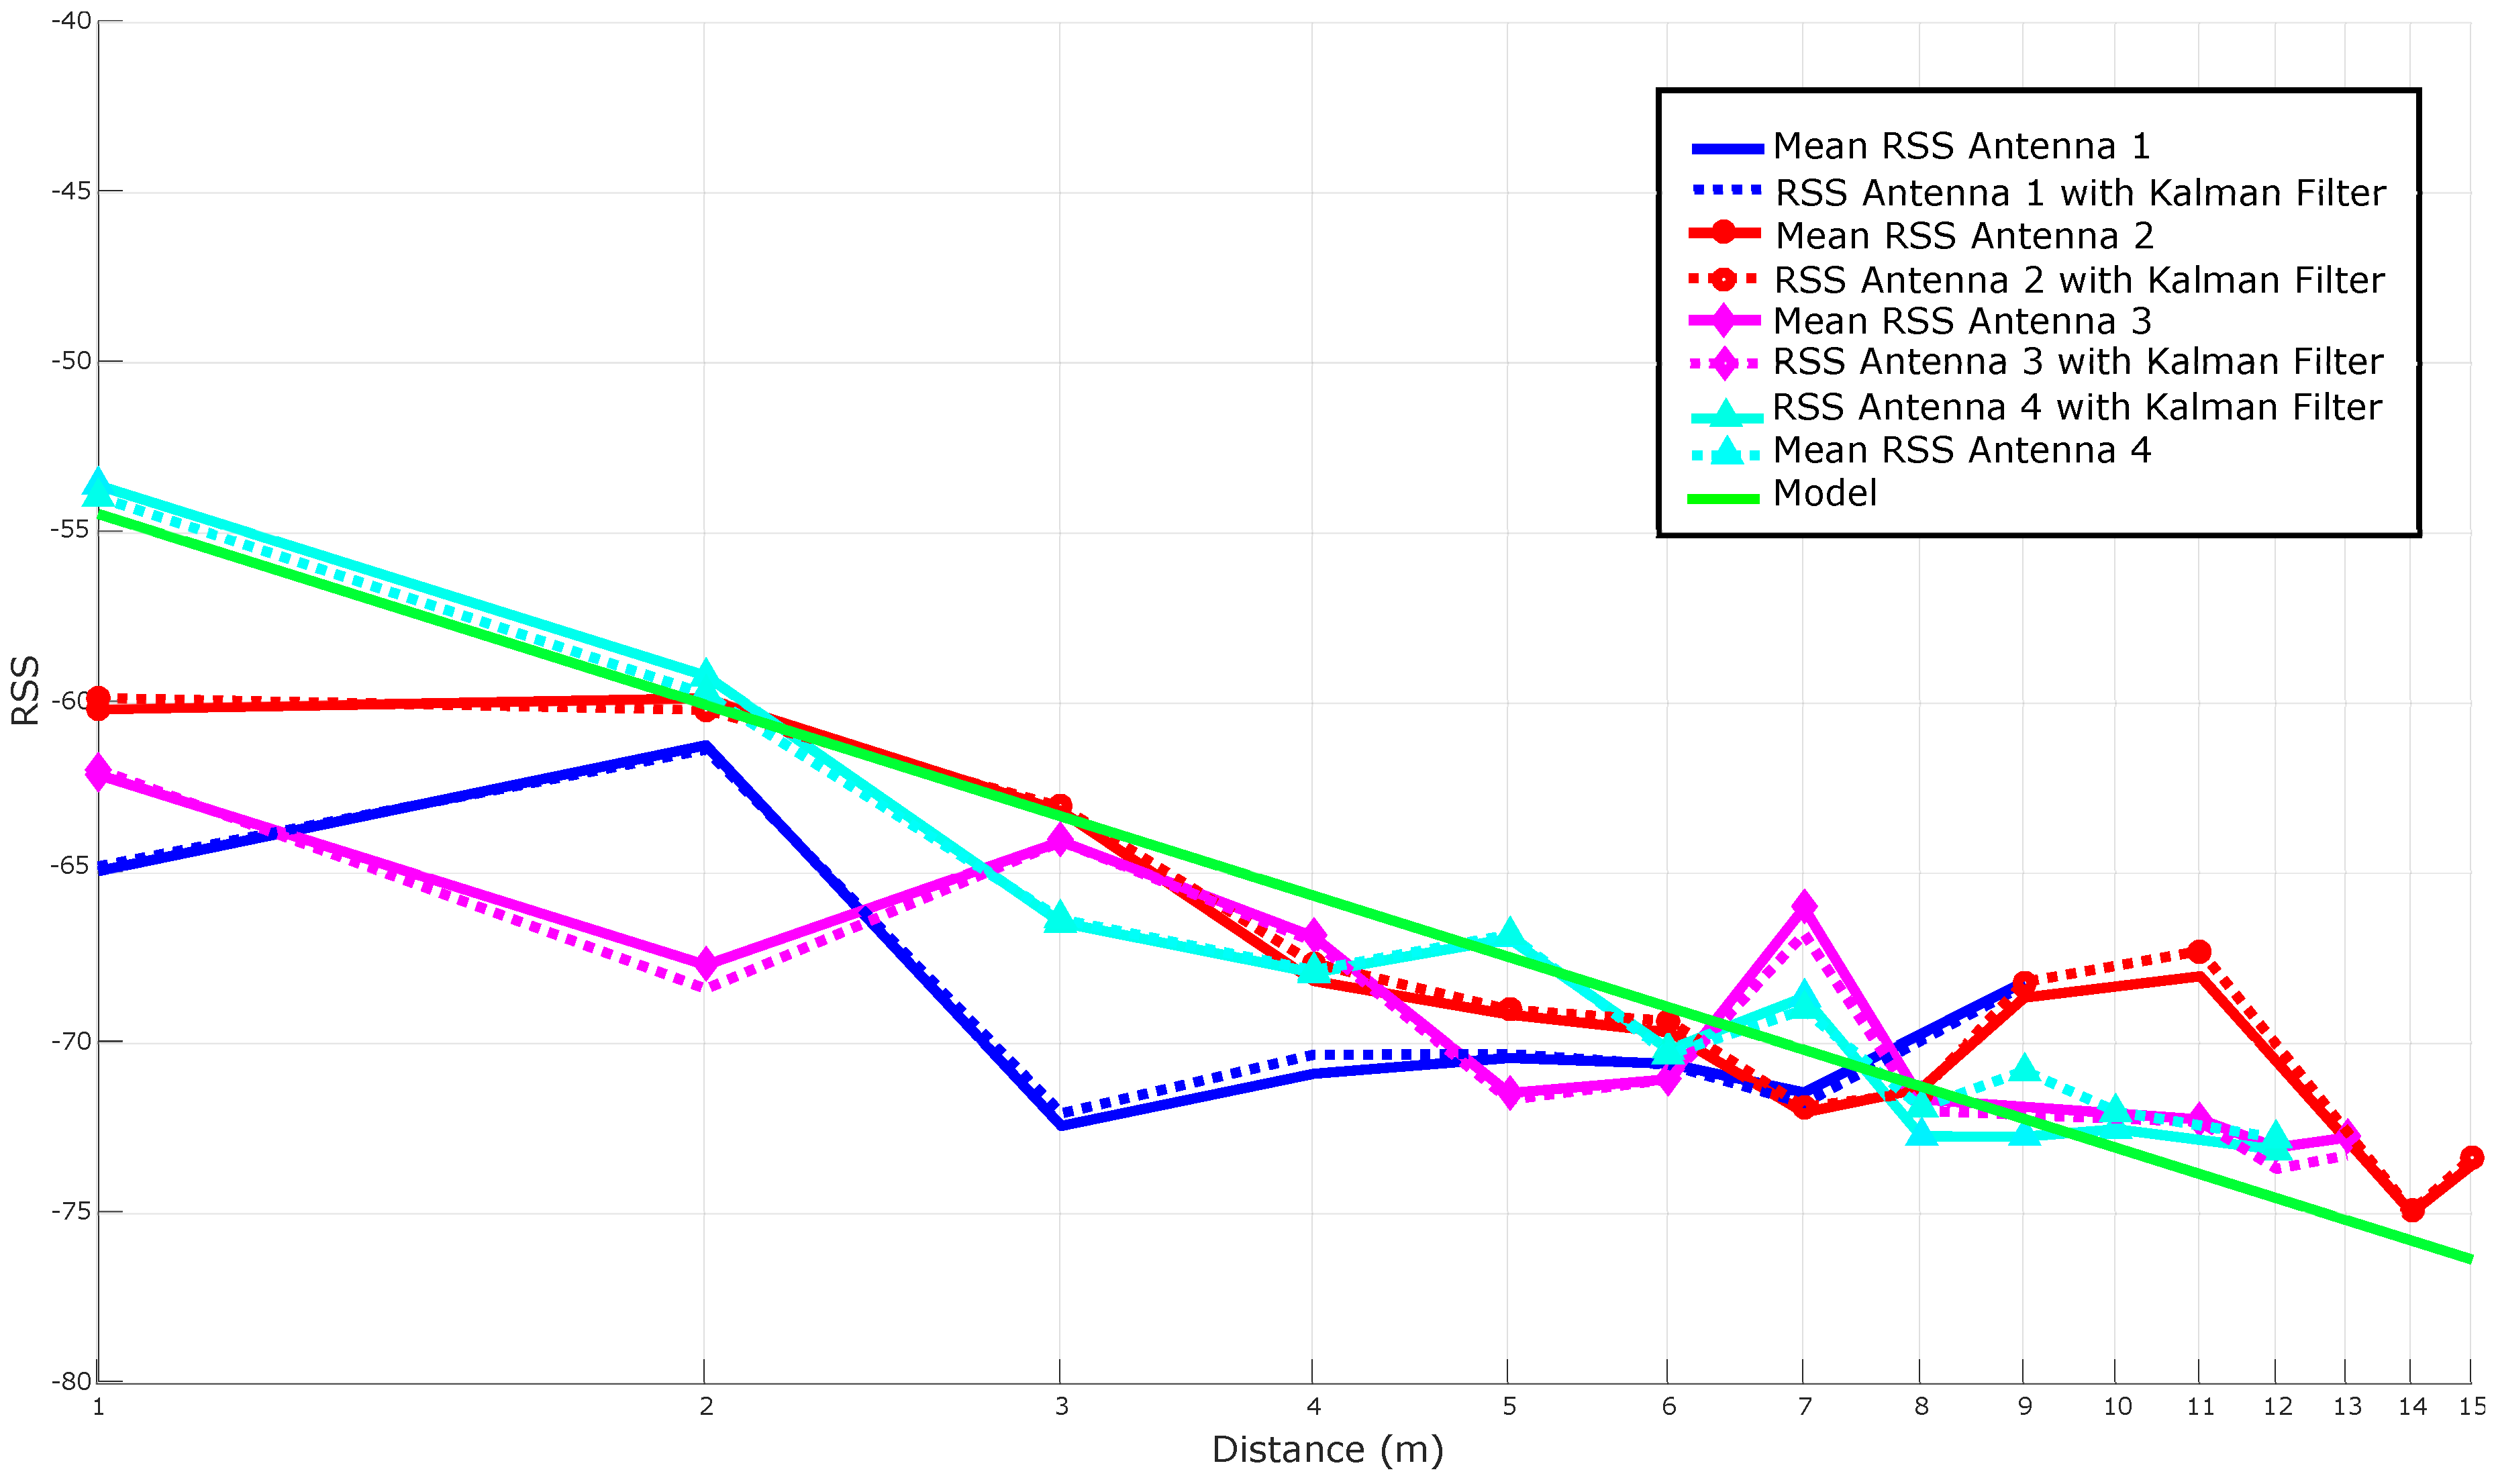
5.4.3. Kalman Filtering
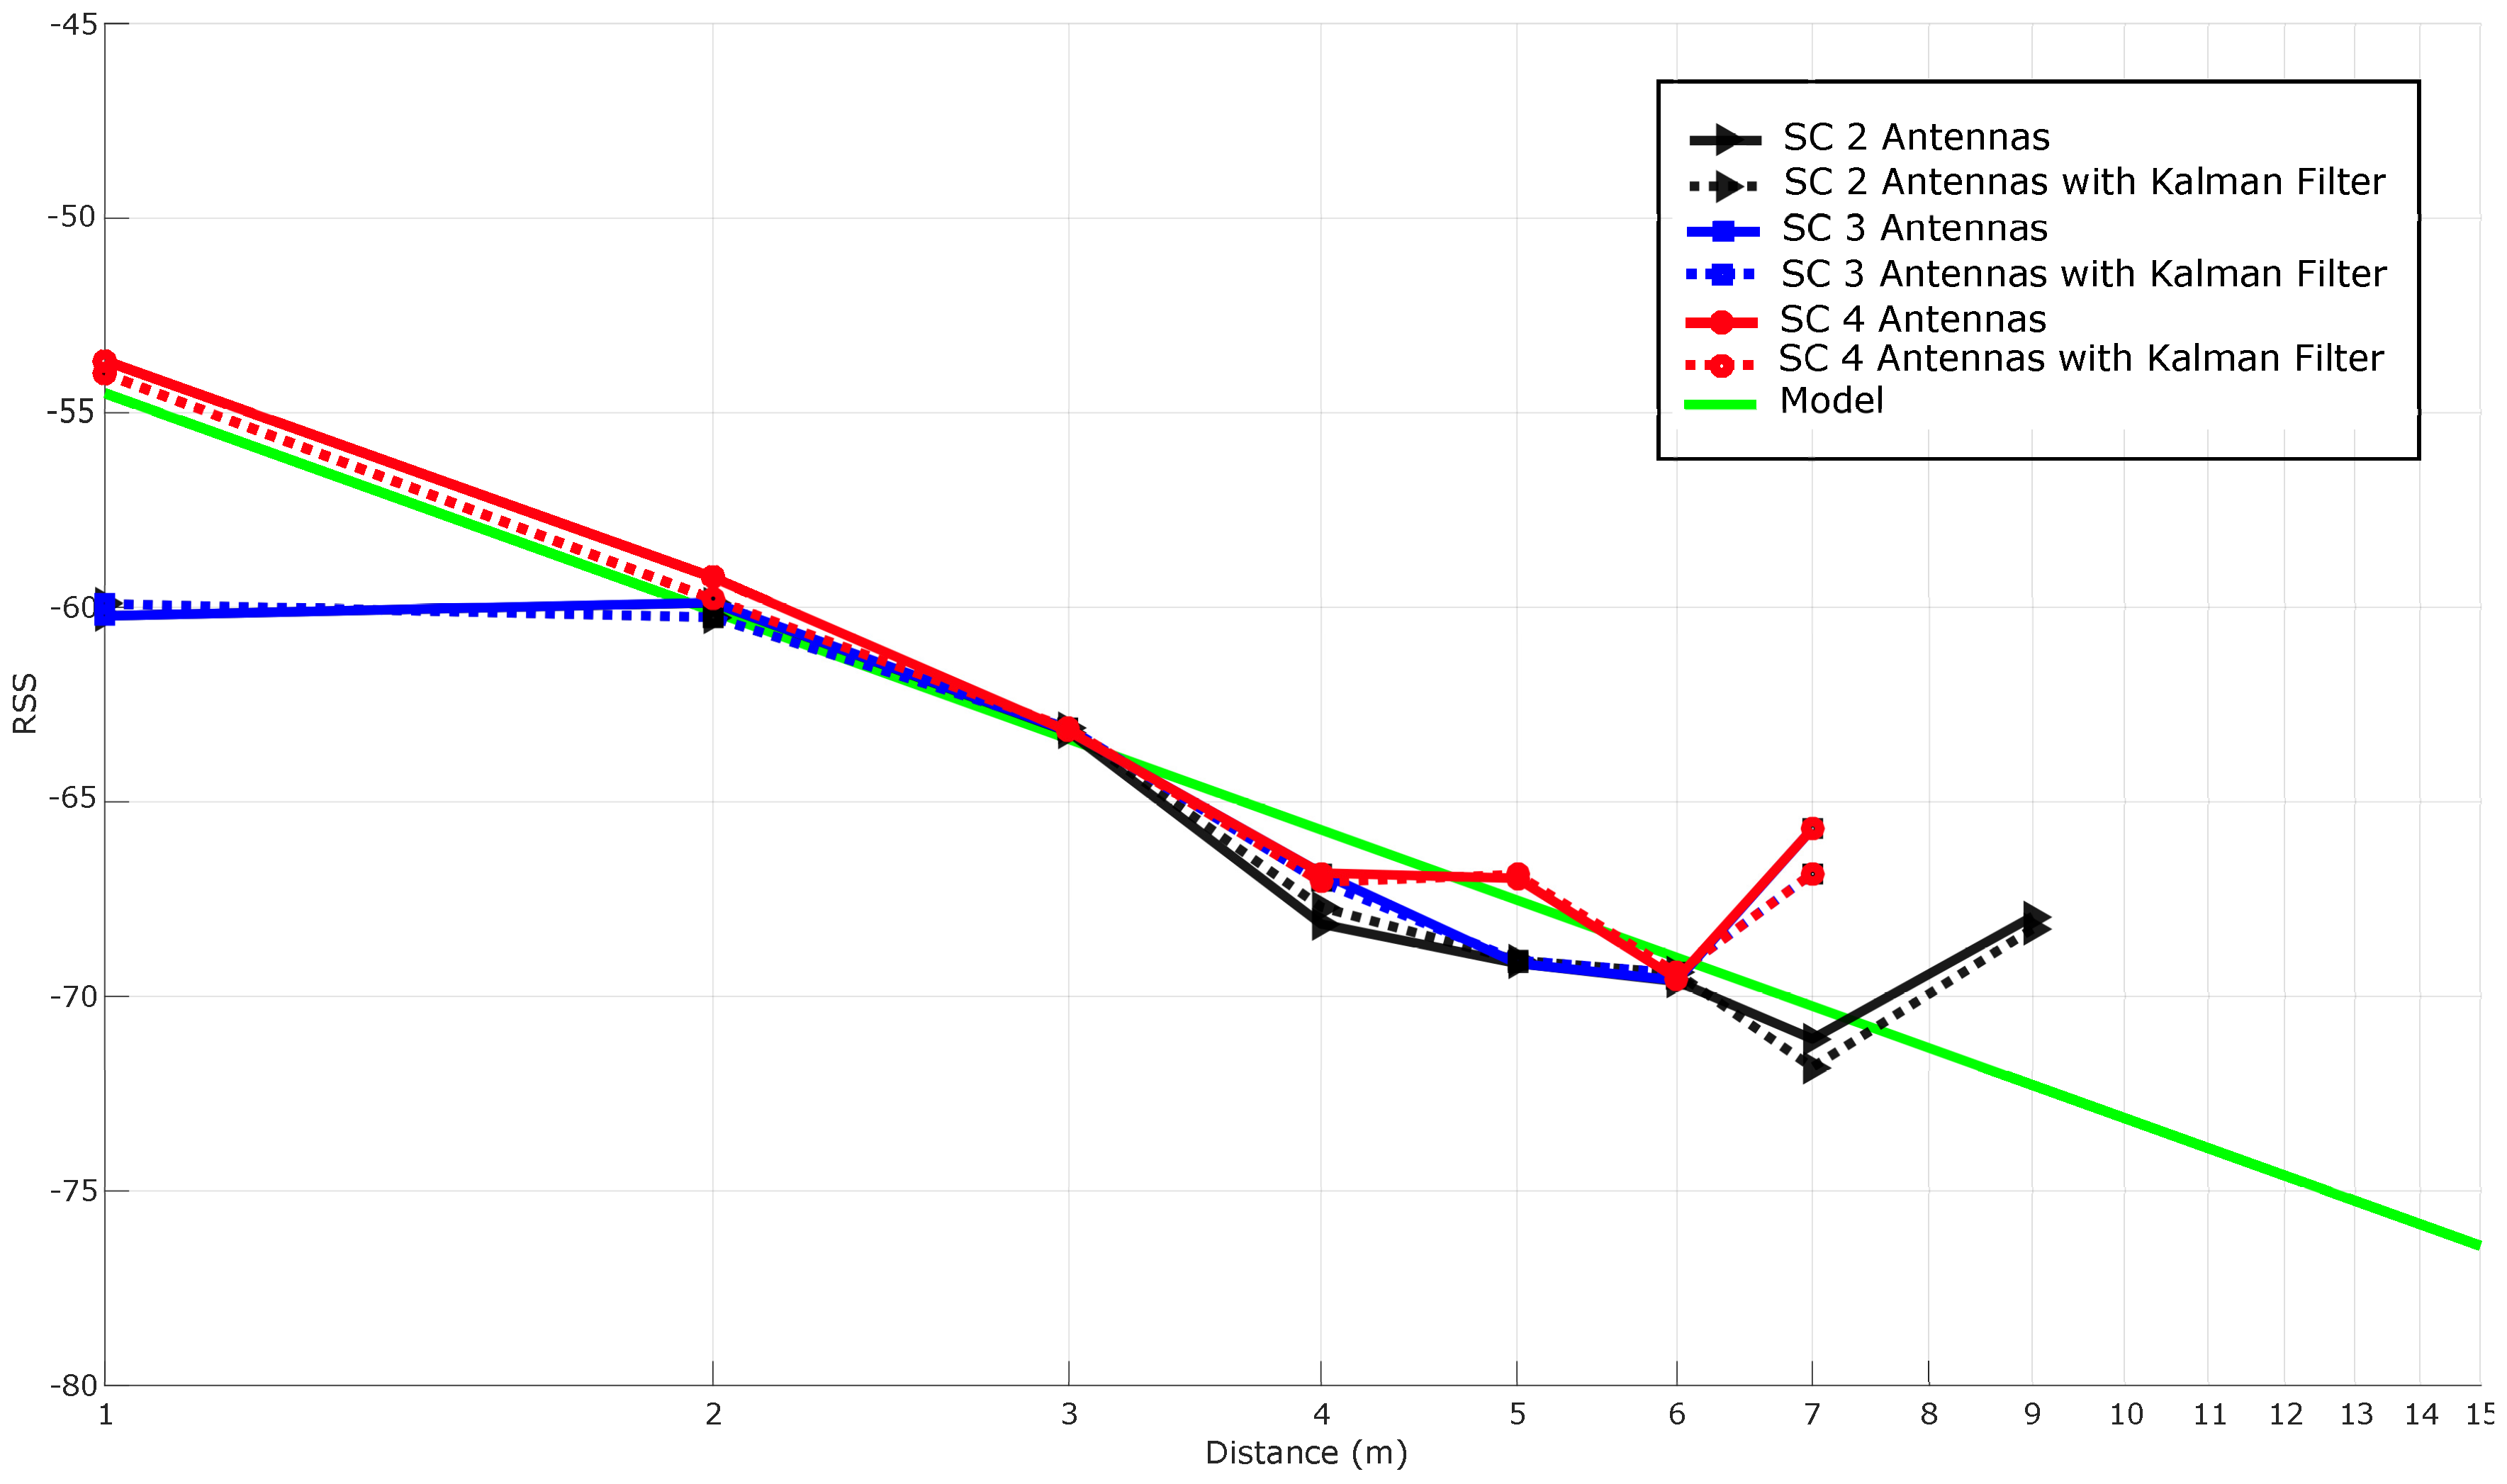
5.4.4. Increasing RSS Stability through Spatial DiversityTechniques
5.4.5. Key Findings
5.5. Display Module of the Smart Pipe System
5.6. Automatic Event Detection Using Smart Pipes
6. Conclusions
- The passive RFID system, due to its limited range, is only suitable for situations where the aim is to control the movement between areas, but it would not be suitable for ubiquitous real-time control.
- This passive system, when making use of an ’L-shaped’ array of antennas, mitigates the low angle of reading, but it reduces the reading distance to almost a half.
- In the case of active RFID readers, their use allows for reaching longer distances and get constant monitoring of tags in wide areas. However, the longer the distance, the less accurate the RSS-based distance estimations are.
- Multi-antenna algorithms and Kalman filtering help to stabilize RSS and improve the accuracy of the positioning system.
- It presented the novel concept of Shipyard 4.0, a shipyard built on the application of the principles of Industry 4.0.
- It described in detail how a shipyard pipe workshop works and what are the requirements for building a smart pipe system.
- It indicated how to build a positioning system from scratch in an environment as harsh in terms of communications as a shipyard. Additionally, it was not found in the literature any practical analysis on the application of RFID technology in any similar application and scenario.
- It defined the concept of smart pipe and showed an example of its implementation and the architecture that surrounds it.
- It proposed the use of spatial diversity techniques to stabilize RSS values. It has not been found any other publication describing the application of such techniques in RFID systems in the way it is proposed in this paper.
Acknowledgments
Author Contributions
Conflicts of Interest
Abbreviations
| BI | Business Intelligence |
| BLE | Bluetooth Low Energy |
| C4ISR | Command, Control, Communications, Computers, Intelligence, Surveillance and Reconnaissance |
| CPS | Cyber-Physical Systems |
| EGC | Equal Gain Combiner |
| HCI | Human-Computer Interfaces |
| HF RFID | High Frequency Radio Frequency IDentification |
| IoT | Internet of Things |
| IrDA | Infrared |
| LAN | Local Area Network |
| LF RFID | Low Frequency Radio Frequency IDentification |
| LOS | Line Of Sight |
| QR | Quick Response |
| RFID | Radio Frequency IDentification |
| REST | REpresentational State Transfer |
| RSS | Received Signal Strength |
| MES | Manufacturing Execution System |
| MIMO | Multiple-input Multiple-output |
| MRC | Maximum-Ratio Combiner |
| MSE | Minimum-Squared Error |
| NFC | Near-Field Communication |
| N-LOS | Non-line-of-sight |
| SC | Selection Combiner |
| ScanC | Scanner Combiner |
| SSC | Switch-and-Stay Combiner |
| UHF RFID | Ultra-High Frequency Radio Frequency IDentification |
| UWB | Ultrawideband |
| WirelessHART | Wireless Highway Addressable Remote Transducer Protocol |
| WPAN | Wireless Personal Area Network |
| WSN | Wireless Sensor Networks |
| Wi-Fi | Wireless Fidelity |
References
- McKinsey & Company. Manufacturing’s Next Act; White Paper; Cornelius, B., Wee, D., Eds.; McKinsey & Company: New York, NY, USA, 2015. [Google Scholar]
- PricewaterhouseCoopers (PwC). 2016 Global Industry 4.0 Survey. Industry 4.0: Building the Digital Enterprise; Technical Report; PwC: London, UK, 2016. [Google Scholar]
- Wang, S.; Wan, J.; Li, D.; Zhang, C. Implementing smart factory of industrie 4.0: An outlook. Int. J. Distrib. Sens. Netw. 2016, 2016, 1–10. [Google Scholar] [CrossRef]
- Navarro, P.J.; Muro, J.S.; Alcover, P.M.; Fernández-Isla, C. Sensors systems for the automation of operations in the ship repair industry. Sensors 2013, 13, 12345–12374. [Google Scholar] [CrossRef] [PubMed]
- Navantia’s web page. Available online: https://www.navantia.es/index.php (accessed on 31 October 2016).
- Faíña, A.; Souto, D.; Deibe, A.; López-Peña, F.; Duro, R.J.; Fernández, X. Development of a climbing robot for grit blasting operations in shipyards. In Proceedings of the ICRA’09 2009 IEEE International Conference on Robotics and Automation, New York, NY, USA, 12–17 May 2009; pp. 200–205.
- Kuss, A.; Schneider, U.; Dietz, T.; Verl, A. Detection of assembly variations for automatic program adaptation in robotic welding systems. In Proceedings of the ISR 2016 47th International Symposium on Robotics, Munich, Germany, 21–22 June 2016; pp. 1–6.
- Mun, S.; Nam, M.; Lee, J.; Doh, K.; Park, G.; Lee, H.; Kim, D.; Lee, J. Sub-assembly welding robot system at shipyards. In Proceedings of the 2015 IEEE International Conference on Advanced Intelligent Mechatronics (AIM), Busan, Korea, 7–11 July 2015; pp. 1502–1507.
- Lee, D.; Ku, N.; Kim, T.-W.; Kim, J.; Lee, K.-Y.; Son, Y.-S. Development and application of an intelligent welding robot system for shipbuilding. Robot. Comput. Integr. Manuf. 2011, 27, 377–388. [Google Scholar] [CrossRef]
- Kim, M.Y.; Cho, H.S.; Kim, J. Neural network-based recognition of navigation environment for intelligent shipyard welding robots. In Proceedings of the 14th IEEE/RSJ International Conference on Intelligent Robots and Systems, Maui, HI, USA, 29 October–3 November 2001; pp. 446–451.
- Kim, M.Y.; Ko, K.; Cho, H.S.; Kim, J. Visual sensing and recognition of welding environment for intelligent shipyard welding robots. In Proceedings of the 13th IEEE/RSJ International Conference on Intelligent Robots and Systems, Takamatsu, Japan, 31 October–5 November 2000; pp. 2159–2165.
- Kawakubo, S.; Chansavang, A.; Tanaka, S.; Iwasaki, T. Wireless network system for indoor human positioning. In Proceedings of the 1st International Symposium on Wireless Pervasive Computing, Phuket, Thailand, 16–18 January 2006.
- Pérez-Garrido, C.; González-Castaño, F.J.; Chaves-Díeguez, D.; Rodríguez-Hernández, P.S. Wireless remote monitoring of toxic gases in Shipbuilding. Sensors 2014, 14, 2981–3000. [Google Scholar] [CrossRef] [PubMed]
- Yang, J.; Zhou, J.; Lv, Z.; Wei, W.; Song, H. A real-time monitoring system of industry carbon monoxide based on Wireless Sensor Networks. Sensors 2015, 15, 29535–29546. [Google Scholar] [CrossRef] [PubMed]
- Do Amaral Bichet, M.A.; Hasegawa, E.K.; Solé, R.; Núñez, A. Utilization of hyper environments for tracking and monitoring of processes and supplies in construction and assembly industries. In Proceedings of the Symposium on Computing and Automation for Offshore Shipbuilding (NAVCOMP), Rio Grande, Brazil, 14–15 March 2013; pp. 81–86.
- Wong, S.F.; Zheng, Y. The effect of metal noise factor to RFID location system. In Proceedings of the IEEE International Conference on Industrial Engineering and Engineering Management, Bangkok, Thailand, 10–13 December 2013; pp. 310–314.
- Deavours, D.D. Improving the near-metal performance of UHF RFID tags. In Proceedings of the IEEE International Conference on RFID, Orlando, FL, USA, 14–16 April 2010; pp. 187–194.
- Arumugan, D.D.; Engels, D.W. Characterization of RF propagation in helical and toroidal metal pipes for passive RFID Systems. In Proceedings of the IEEE International Conference on RFID, Las Vegas, NV, USA, 16–17 April 2008; pp. 269–276.
- Rao, K.V.S.; Lam, S.F.; Nikitin, P.V. UHF RFID tag for metal containers. In Proceedings of the Asia-Pacific Microwave Conference, Yokohama, Japan, 7–10 December 2010; pp. 179–182.
- Bovelli, S.; Neubauer, F.; Heller, C. Mount-on-Metal RFID transponders for automatic identification of containers. In Proceedings of the 36th European Microwave Conference, Manchester, UK, 10–15 September 2006; pp. 726–728.
- Jeong, S.H.; Son, H.W. UHF RFID tag antenna for embedded use in a concrete floor. IEEE Antennas Wirel. Propag. Lett. 2011, 10, 1158–1161. [Google Scholar]
- Heiss, M.; Hildebrant, R. High-temperature UHF RFID sensor measurements in a full-metal environment. In Proceedings of the 2013 European Conference on Smart Objects, Systems and Technologies (SmartSysTech), Nuremberg, Germany, 11–12 June 2013.
- Tarjan, L.; Senk, I.; Tegeltija, S.; Stankovski, S.; Ostojic, G. A readability analysis for QR code application in a traceability system. Comput. Electron. Agric. 2014, 109, 1–11. [Google Scholar] [CrossRef]
- Zhong, R.Y.; Dai, Q.Y.; Qu, T.; Hu, G.J.; Huang, G.Q. RFID-enabled real-time manufacturing execution system for mass-customization production. Robot. Comput. Integr. Manuf. 2013, 29, 283–292. [Google Scholar] [CrossRef]
- Barro-Torres, S.J.; Fernández-Caramés, T.M.; Pérez-Iglesias, H.J.; Escudero, C.J. Real-time personal protective equipment monitoring system. Comput. Commun. 2012, 36, 42–50. [Google Scholar] [CrossRef]
- Fernández-Caramés, T.M. An intelligent power outlet system for the smart home of the internet of things. Int. J. Distrib. Sens. Netw. 2015, 2015, 1–11. [Google Scholar] [CrossRef] [PubMed]
- Barro-Torres, S.J.; Fernández-Caramés, T.M.; González-López, M.; Escudero-Cascón, C.J. Maritime freight container management system using RFID. In Proceedings of the Third International EURASIP Workshop on RFID Technology, La Manga del Mar Menor, Spain, 6–7 September 2010.
- Ozdenizci, B.; Coskun, V.; Ok, K. NFC internal: An indoor navigation system. Sensors 2015, 15, 7571–7595. [Google Scholar] [CrossRef] [PubMed]
- Kitazawa, M.; Takahashi, S.; Takahashi, T.B.; Yoshikawa, A.; Terano, T. Improving a cellular manufacturing system through real time-simulation and-measurement. In Proceedings of the 2016 IEEE 40th Annual Computer Software and Applications Conference (COMPSAC), Atlanta, GA, USA, 10–14 June 2016; pp. 117–122.
- Makki, A.; Siddig, A.; Saad, M.; Cavallaro, J.R.; Bleakley, C.J. Indoor localization using 802.11 time differences of arrival. IEEE Trans. Instrum. Meas. 2016, 65, 614–623. [Google Scholar] [CrossRef]
- He, S.; Chan, S.H.G. Wi-Fi Fingerprint-based indoor positioning: Recent advances and comparisons. IEEE Commun. Surv. Tutor. 2016, 18, 466–490. [Google Scholar] [CrossRef]
- Mousa, M.; Zhang, X.; Claudel, C. Flash flood detection in urban cities using ultrasonic and infrared sensors. IEEE Sens. J. 2016, 16, 7204–7216. [Google Scholar] [CrossRef]
- Ijaz, F.; Yang, H.K.; Ahmad, A.W.; Lee, C. Indoor positioning: A review of indoor ultrasonic positioning systems. In Proceedings of the 2013 15th International Conference on Advanced Communication Technology (ICACT), PyeongChang, Korea, 27–30 January 2013; pp. 1146–1150.
- Alarifi, A.; Al-Salman, A.; Alsaleh, M.; Alnafessah, A.; Al-Hadhrami, S.; Al-Ammar, M.A.; Al-Khalifa, H.S. Ultra wideband indoor positioning technologies: Analysis and recent advances. Sensors 2016, 16, 707. [Google Scholar] [CrossRef] [PubMed]
- Ruan, Q.; Xu, W.; Wang, G. RFID and ZigBee based manufacturing monitoring system. In Proceedings of the 2011 International Conference on Electric Information and Control Engineering (ICEICE), Wuhan, China, 25–27 March 2011; pp. 1672–1675.
- Ergeerts, G.; Nikodem, M.; Subotic, D.; Surmacz, T.; Wojciechowski, B.; de Meulenaere, P.; Weyn, M. DASH7 alliance protocol in monitoring applications. In Proceedings of the 2015 10th International Conference on P2P, Parallel, Grid, Cloud and Internet Computing (3PGCIC), Krakow, Poland, 4–6 November 2015; pp. 623–628.
- Belchior, R.; Júnior, D.; Monterio, A. ANT+ medical health kit for older adults. In Wireless Mobile Communication and Healthcare; Lecture Notes of the Institute for Computer Sciences, Social Informatics and Telecommunications Engineering; Springer: Berlin/Heidelberg, Germany, 2013; Volume 61, pp. 20–29. [Google Scholar]
- Horvath, P.; Yampolskiy, M.; Koutsoukos, X. Efficient evaluation of wireless real-time control networks. Sensors 2015, 15, 4134–4153. [Google Scholar] [CrossRef] [PubMed]
- Augustin, A.; Yi, J.; Clausen, T.; Townsley, W.M. A study of LoRa: Long range & low power networks for the internet of things. Sensors 2016, 16, 1466. [Google Scholar]
- Margelis, G.; Piechocki, R.; Kaleshi, D.; Thomas, P. Low Throughput Networks for the IoT: Lessons learned from industrial implementations. In Proceedings of the 2015 IEEE 2nd World Forum on Internet of Things (WF-IoT), Milan, Italy, 14–16 December 2015; pp. 181–186.
- Boukhtouta, A.; Berger, J. Improving in-transit and in-theatre asset visibility of the Canadian Armed Forces supply chain network. In Proceedings of the 2014 International Conference on Advanced Logistics and Transport (ICALT), Hammamet, Tunisia, 1–3 May 2014; pp. 149–154.
- Fraga-Lamas, P.; Castedo-Ribas, L.; Morales-Méndez, A.; Camas-Albar, J.M. Evolving military broadband wireless communication systems: WiMAX, LTE and WLAN. In Proceedings of the International Conference on Military Communications and Information Systems (ICMCIS), Brussels, Belgium, 23–24 May 2016; pp. 1–8.
- Camas-Albar, J.M.; Morales-Méndez, A.; Castedo-Ribas, L.; Fraga-Lamas, P.; Brown, C.; Tschauner, M.; Hayri-Kucuktabak, M. NATO Task Group ET-IST-068, IST (Information Systems Technology) panel of NATO STO (Science and Technology Organization). In LTE vs. WiMAX for Military Applications; Technical Report; North Atlantic Treaty Organization (NATO): Brussels, Belgium, 2015. [Google Scholar]
- Fraga-Lamas, P.; Camas, J.M.; Carro, A.; Suárez, P.; Castedo, L.; García-Naya, J.A.; Morales, A. Mobile WiMAX for next generation tactical wireless networks. In Proceedings of the Information Systems Technology Panel Symposium on Emerged/Emerging ’Disruptive’ Technologies (NATO IST-099 / RSY-024), Madrid, Spain, 9–10 May 2011.
- Fraga-Lamas, P.; Rodríguez-Piñeiro, J.; García-Naya, J.A.; Castedo, L. Unleashing the potential of LTE for next generation railway communications. In Communication Technologies for Vehicles, Proceedings of the 8th International Workshop on Communication Technologies for Vehicles (Nets4Cars/Nets4Trains/Nets4Aircraft 2015), Sousse, Tunisia, 6–8 May 2015; Lecture Notes in Computer Science; Springer: Berlin/Heidelberg, Germany, 2015; Volume 9066, pp. 153–164. [Google Scholar]
- Rodríguez-Piñeiro, J.; Fraga-Lamas, P.; García-Naya, J.A.; Castedo, L. Long term evolution security analysis for railway communications. In Proceedings of the IEEE Congreso de Ingeniería en Electro-Electrónica, Comunicaciones y Computación (ARANDUCON 2012), Asunción, Paraguay, 28–30 November 2012.
- Fraga-Lamas, P.; Rodríguez-Piñeiro, J.; García-Naya, J.A.; Castedo, L. A survey on LTE networks for railway services. In Proceedings of the IEEE Congreso de Ingeniería en Electro-Electrónica, Comunicaciones y Computación (ARANDUCON 2012), Asunción, Paraguay, 28–30 November 2012.
- Li, H.; Chen, Y.; He, Z. The survey of RFID attacks and defenses. In Proceedings of the 8th International Conference on Wireless Communications, Networking and Mobile Computing, Shanghai, China, 21–23 September 2012; pp. 1–4.
- Fernández-Caramés, T.M.; Fraga-Lamas, P.; Suárez-Albela, M.; Castedo, L. A methodology for evaluating security in commercial RFID systems. In Radio Frequency Identification, 1st ed.; Crepaldi, P.C., Pimenta, T.C., Eds.; INTECH: Rijeka, Croatia, 2016; in press. [Google Scholar]
- Fraga-Lamas, P.; Fernández-Caramés, T.M.; Suárez-Albela, M.; Castedo, L.; González-López, M. A review on internet of things for defense and public safety. Sensors 2016, 16, 1644. [Google Scholar] [CrossRef] [PubMed]
- B&W Pantex. Advanced Inventory and Materials Management at Pantex; White Paper; B&W Pantex: Amarillo, TX, USA, 2011. [Google Scholar]
- Rappaport, T.S. Wireless Communications: Principles and Practice, 2nd ed.; Prentice Hall: Upper Saddle River, NJ, USA, 2002. [Google Scholar]
- Grewal, M.H.; Andrews, A.P. Kalman Filtering: Theory and Practice using Matlab, 3rd ed.; John Wiley & Sons: Hoboken, NJ, USA, 2008. [Google Scholar]
- Bulten, W.; Rossum, A.C.V.; Haselager, W.F.G. Human SLAM, indoor localisation of devices and users. In Proceedings of the IEEE First International Conference on Internet-of-Things Design and Implementation, Berlin, Germany, 4–8 April 2016; pp. 221–222.
- Clerckx, B.; Oestges, C. MIMO Wireless Networks: Channels, Techniques and Standards for Multi-Antenna, Multi-User and Multi-Cell Systems, 2nd ed.; Academic Press: Cambridge, MA, USA, 2013. [Google Scholar]
- Fernández, T.M.; Rodas, J.; Escudero, C.J.; Iglesia, D.I. Bluetooth sensor network positioning system with dynamic calibration. In Proceedings of the 4th IEEE International Symposium on Wireless Communication Systems, Trondheim, Norway, 16–19 October 2007; pp. 45–49.
- Speedway Revolution R420 from Impinj. Available online: http://www.impinj.com/products/readers/speedway-revolution (accessed on 31 October 2016).
- A6-UHFLongRange. Available online: http://www.nextpoints.com/es/productos-rfid/item/196-rugged-pda-a6-rfid-uhf.html (accessed on 31 October 2016).
- Omni-ID Products. Available online: https://www.omni-id.com/industrial-rfid-tags (accessed on 31 October 2016).
- NPR ActiveTrack-2 New Edition. Available online: http://www.nextpoints.com/es/productos-rfid/item/187-npr-active-track-2-new-edition.html (accessed on 31 October 2016).
- Active RuggedTag-175S. Available online: http://www.nextpoints.com/es/productos-rfid/item/319-tag-rfid-activo-active-rugged-tag-175s.html (accessed on 31 October 2016).
- Mascharka, D.; Manley, E. LIPS: Learning Based Indoor Positioning System using mobile phone-based sensors. In Proceedings of the 13th IEEE Annual Consumer Communications & Networking Conference (CCNC), Las Vegas, NV, USA, 8–11 January 2016; pp. 968–971.
- Lim, H.; Kung, L.-C.; Hou, J.C.; Luo, H. Zero-configuration indoor localization over IEEE 802.11 wireless infrastructure. Wirel. Netw. 2010, 16, 405–420. [Google Scholar] [CrossRef]
- Park, J.-G.; Charrow, B.; Curtis, D.; Battat, J.; Minkov, E.; Hicks, J.; Teller, S.; Ledlie, J. Growing an organic indoor location system. In Proceedings of the 8th International Conference on Mobile Systems, Applications, and Services, San Francisco, CA, USA, 15–18 June 2010; pp. 271–284.
- Chintalapudi, K.; Padmanabha Iyer, A.; Padmanabhan, V.N. Indoor localization without the pain. In Proceedings of the Sixteenth Annual International Conference on Mobile Computing and Networking, Chicago, IL, USA, 20–24 September 2010; pp. 173–184.
- Goswami, A.; Ortiz, L.E.; Das, S.R. WiGEM: A learning-based approach for indoor localization. In Proceedings of the Seventh Conference on emerging Networking Experiments and Technologies ACM CoNEXT, Tokyo, Japan, 6–9 December 2011; pp. 1–12.
- Wu, C.; Yang, Z.; Liu, Y.; Xi, W. WILL: Wireless indoor localization without site survey. IEEE Trans. Parallel Distrib. Syst. 2013, 24, 839–848. [Google Scholar]
- Wang, H.; Sen, S.; Elgohary, A.; Farid, M.; Youssef, M.; Choudhury, R.R. No need to war-drive: Unsupervised indoor localization. In Proceedings of the ACM 18th Annual International Conference on Mobile Computing and Networking (MobiCom 2012), Istambul, Turkey, 22–26 August 2012; pp. 197–210.
- Rai, A.; Chintalapudi, K.K.; Padmanabhan, V.N.; Sen, R. Zee: Zero-effort crowdsourcing for indoor localization. In Proceedings of the ACM 18th Annual International Conference on Mobile Computing and Networking (MobiCom 2012), Istambul, Turkey, 22–26 August 2012; pp. 293–304.
- Yang, Z.; Wu, C.; Liu, Y. Locating in fingerprint space: Wireless indoor localization with little human intervention. In Proceedings of the ACM 18th Annual International Conference on Mobile Computing and Networking (MobiCom 2012), Istambul, Turkey, 22–26 August 2012; pp. 269–280.
- Shen, G.; Chen, Z.; Zhang, P.; Moscibroda, T.; Zhang, Y. Walkie-Markie: Indoor pathway mapping made easy. In Proceedings of the 10th USENIX Conference on Networked Systems Design and Implementation, Berkeley, CA, USA, 2–5 April 2013; pp. 85–98.
- Bahl, P.; Padmanabhan, V.N. RADAR: An in-building RF-based user location and tracking system. In Proceedings of the Nineteenth Annual Joint Conference of the IEEE Computer and Communications Societies (INFOCOM 2000), Piscataway, NJ, USA, 26–30 March 2000; Volume 2, pp. 775–784.
- Youssef, M.; Agrawala, A. Handling samples correlation in the horus system. In Proceedings of the Twenty-Third Annual Joint Conference of the IEEE Computer and Communications Societies (INFOCOM 2004), Hong Kong, China, 7–11 March 2004; Volume 2, pp. 1023–1031.
- AiRISTA. Available online: https://www.airistaflow.com/hardware/ (accessed on 31 October 2016).
- IZat. Available online: https://www.qualcomm.com/products/izat (accessed on 31 October 2016).
- Ubisense. Available online: https://ubisense.net/en (accessed on 31 October 2016).
- Dart system. Available online: https://www.zebra.com/us/en/solutions/location-solutions/enabling-technologies/dart-uwb.html (accessed on 31 October 2016).
- Prieto, J.C.; Jiménez, A.R.; Guevara, J.; Ealo, J.L.; Seco, F.; Roa, J.O.; Ramos, F. Performance evaluation of 3D-LOCUS advanced acoustic LPS. IEEE Trans. Instrum. Meas. 2009, 58, 2385–2395. [Google Scholar] [CrossRef]
- Elpas (Gdsystems). Available online: http://www.gdsystems.com/staff-attack-alarms/elpas/ (accessed on 31 October 2016).
- Hightower, J.; Want, R.; Borriello, G. SpotON: An Indoor 3D Location Sensing Technology Based on RF Signal Strength; UW CSE 00-02-02 Technical Report; University of Washington: Seattle, WA, USA, 2000. [Google Scholar]
- Topaz Local Positioning (Tadlys). Available online: http://www.tadlys.co.il/pages/Productcontent.asp?iGlobalId=2 (accessed on 31 October 2016).
- Ni, L.M.; Liu, Y.; Lau, Y.C.; Patil, A.P. LANDMARC: Indoor location sensing using active RFID. Wirel. Netw. 2004, 10, 701–710. [Google Scholar] [CrossRef]
- Yang, P.; Wu, W.; Moniri, M.; Chibelushi, C.C. Efficient object localization using sparsely distributed passive RFID Tags. IEEE Trans. Ind. Electron. 2013, 60, 5914–5924. [Google Scholar] [CrossRef]
- Seco, F.; Plagemann, C.; Jiménez, A.R.; Burgard, W. Improving RFID-based indoor positioning accuracy using Gaussian processes. In Proceedings of the 2010 International Conference on Indoor Positioning and Indoor Navigation, Zurich, Switzerland, 15–17 September 2010; pp. 1–8.
- Ladd, A.M.; Bekris, K.E.; Rudys, A.; Kavraki, L.E.; Wallach, D.S. Robotics-based location sensing using wireless ethernet. Wirel. Netw. 2005, 11, 189–204. [Google Scholar] [CrossRef]
- Prasithsangaree, P.; Krishnamurthy, P.; Chrysanthis, P. On indoor position location with wireless LANs. In Proceedings of the 13th IEEE International Symposium on Personal, Indoor and Mobile Radio Communications, Lisbon, Portugal, 15–18 September 2002; pp. 720–724.
- Luoh, L. ZigBee-based intelligent indoor positioning system soft computing. Soft Comput. 2014, 18, 443–456. [Google Scholar] [CrossRef]
- Gwon, Y.; Jain, R. Error characteristics and calibration-free techniques for wireless LAN-based location estimation. In Proceedings of the Second International Workshop on Mobility Management & Wireless Access Protocols, Philadelphia, PA, USA, 1 October 2004; pp. 2–9.
- Faragher, R.; Harle, R. Location fingerprinting with bluetooth low energy beacons. IEEE J. Sel. Areas Commun. 2015, 33, 2418–2428. [Google Scholar] [CrossRef]
- Otsason, V.; Varshavsky, A.; LaMarca, A.; de Lara, E. Accurate GSM indoor localization. In UbiComp 2005: Ubiquitous Computing; Lecture Notes Computer Science; Springer: Berlin/Heidelberg, Germany, 2005; Volume 3660, pp. 141–158. [Google Scholar]
- Optotrak Certus System. Available online: http://www.ndigital.com/msci/products/optotrak-certus/ (accessed on 31 October 2016).
- Aitenbichler, E.; Mühlhäuser, M. An IR local positioning system for smart items and devices. In Proceedings of the 23rd IEEE International Conference on Distributed Computing Systems Workshops (IWSAWC03), Providence, RI, USA, 19–22 May 2003.
- Bat System. Available online: http://www.cl.cam.ac.uk/research/dtg/attarchive/bat/ (accessed on 31 October 2016).
- Priyantha, N.B. The Cricket Indoor Location System. Ph.D. Thesis, Massachusetts Institute of Technology (MIT), Cambridge, MA, USA, 2005. [Google Scholar]
- Sonitor. Available online: http://sonitor.com/ (accessed on 31 October 2016).
- King, T.; Kopf, S.; Haenselmann, T.; Lubberger, C.; Effelsberg, W. COMPASS: A probabilistic indoor positioning system based on 802.11 and digital compasses. In Proceedings of the First ACM International Workshop on Wireless Network Testbeds, Experimental evaluation and CHaracterization (WiN-TECH), Los Angeles, CA, USA, 29 September 2006; pp. 34–40.
- An, X.; Wang, J.; Prasad, R.V.; Niemegeers, I.G.M.M. OPT: Online person tracking system for context-awareness in wireless personal network. In Proceedings of the 2nd International Workshop on Multi-hop Ad Hoc Networks: From Theory to Reality (REALMAN ’06), Florence, Italy, 26 May 2006; pp. 47–54.
- Brumitt, B.; Meyers, B.; Krumm, J.; Kern, A.; Shafer, S. Easyliving: Technologies for intelligent environments. In Proceedings of the 2nd International Symposium on Handheld and Ubiquitous Computing, Bristol, UK, 25–27 September 2000; pp. 12–29.
- Lopes, C.V.; Haghighat, A.; Mandal, A.; Givargis, T.; Baldi, P. Localization of off-the-shelf mobile devices using audible sound: Architectures, protocols and performance assessment. ACM SIGMOBILE Mob. Comput. Commun. Rev. 2006, 10, 2. [Google Scholar] [CrossRef]


| Technology | Frequency Band | Range | Features | Popular Applications |
|---|---|---|---|---|
| Barcode/QR | - | <4 m | LOS, very low cost, visual decoding | Asset tracking and marketing |
| LF RFID | 30–300 KHz (125 KHz) | 1–5 cm (<10 cm) | N-LOS, durability, low cost | Smart Industry and security access |
| HF RFID | 3–30 MHz (13.56 MHz) | 30 cm (<1 m) | N-LOS, durability, low cost | Smart Industry and asset tracking |
| UHF RFID | 30 MHz–3 GHz | 10 m | N-LOS, durability, low cost | Smart Industry and toll roads |
| NFC | 13.56 MHz | 4–10 cm (<20 cm) | Low cost, no power | Ticketing and payments |
| BLE | 2.4 GHz | <50 m | Low power | Wireless headsets |
| Wi-Fi | 2.4–5 GHz | <100 m | High-speed, ubiquity | LAN, internet access, broadband |
| Infrared (IrDA) | 800 to 1000 m | <1 m | Security, high-speed | Remote control, data transfer |
| UWB | 3.1 to 10.6 GHz | < 10 m | Low power, high-speed data | Radar, video streaming |
| Ultrasound | >20 kHz (2–10 MHz) | <3 m | Inspection of industrial materials | Medicine, positioning and location |
| ZigBee | 868 MHz (EU), 2.4 GHz | <10 m | Mesh network | Smart Home and Industry |
| DASH7 | 315–915 MHz | <5 km | BLAST network technology | Smart industry and military |
| ANT+ | 2.4 GHz | <10 m | Low power | Health, sport monitoring |
| Z-Wave | 868 MHz (EU) | <30 m | Simple protocol | Smart Home |
| WirelessHART | 2.4 GHz | <10 m | HART protocol | Smart Industry |
| LoRa | 2.4 GHz | >15 m | Long battery life and range | Smart city, M2M |
| SigFox | 868 MHz | 3–50 km | Global cellular | Internet of Things, M2M |
| RuBee | 131 KHz | 1–30 m (15 m) | Harsh environments | Mission-critical scenarios |
| Pipe type | Process | Solution | Temperature | Duration | Observation |
|---|---|---|---|---|---|
| Bent pipes | Degreasing | Water and T-149-E (6.25% ± 1%) | 70 C ± 10 C | 15 ± 5 min | |
| Pickling | Hot water | 60 C ± 10 C | PH: from 5 to 8 | ||
| Carbon steel pipes | Degreasing | Water and T-149-E (6.25% ± 1%) | 70 C ± 10 C | 45 ± 5 min | |
| Pickling | Water and DECAPINOX C (10% ± 2%) | 25 C ± 10 C | 15 ± 5 min | ||
| Rinsing | Hot water | 60 C ± 10 C | PH: from 5 to 8 | ||
| Cooper alloys | Degreasing | Water and T-149-E (6.25% ± 1%) | 70 C ± 10 C | 15 ± 5 min | |
| Passive Pickling | Water and SCALE-GO (4.37% ± 1%) | 50 C ± 10 C | 15 ± 5 min | ||
| Rinsing | Hot water | 60 C ± 10 C | PH: from 5 to 8 | ||
| Stainless steel | Degreasing | Water and T-149-E (6.25% ± 1%) | 70 C ± 10 C | 15 ± 5 min | |
| Passive Pickling | Water and DECAPINOX C (10% ± 2%). | 25 C ± 10 C | 15 ± 5 min | ||
| Rinsing | Hot water | 60 C ± 10 C | PH: from 5 to 8 |
| Factor | Deployment | Metal | Water | Corrosion | Interference | Reading Dist. | Temperature | Pressure | Battery | Mobility | Cost |
|---|---|---|---|---|---|---|---|---|---|---|---|
| LF RFID | * | * | * | ||||||||
| HF RFID | * | * | * | ||||||||
| UHF RFID | * | * | * | ||||||||
| BLE | * | * | * | ||||||||
| Wi-Fi | |||||||||||
| UWB | |||||||||||
| Ultrasounds | |||||||||||
| ZigBee | |||||||||||
| DASH7 | * | * | * | ||||||||
| Z-Wave | * | ||||||||||
| WirelessHART | |||||||||||
| RuBee |
| Family | Model | Max. Reading Range (m) | Dimensions (mm) | Weight (g) |
|---|---|---|---|---|
| Fit | 400 | 4 m | 13.1 × 7.1 × 3.1 | 380 g |
| Exo | 600 | Fixed reader: 6 m, handheld: 3 m | With holes: 80 × 15 × 12, without: 60 × 15 × 12 | 12 g |
| 750 | Fixed reader: 7 m, handheld: 3.5 m | 51 × 48 × 12.5 | 25.6 g | |
| 800 | Fixed reader: 8 m, handheld: 4 m | 110 × 25 × 13 | 26 g | |
| Dura | 1500 | Fixed reader: 15 m, handheld: 7.5 m | 140 × 66 × 14 | 75 g |
| 3000 | Fixed reader: 35 m, handheld: 20 m | 210 × 110 × 21 | 265 g | |
| 600 | Fixed reader: 5 m, handheld: 2.5 m | 49 × 38 × 9.5 | 12 g | |
| Adept | 360 | 10 m | 136.5 × 48 × 5.5 | 126 g |
| Reading Distance | 1 m | 2 m | 3 m | 4 m | 5 m | 6 m | 7 m | 8 m | 9 m | 10 m | 11 m | 12 m | 13 m | 14 m | 15 m | 16 m | 17 m | |
|---|---|---|---|---|---|---|---|---|---|---|---|---|---|---|---|---|---|---|
| Tag | ||||||||||||||||||
| Fit 400 | ||||||||||||||||||
| Exo 600 | ||||||||||||||||||
| Exo 750 | ||||||||||||||||||
| Exo 800 | ||||||||||||||||||
| Dura 1500 | ||||||||||||||||||
| Dura 3000 | ||||||||||||||||||
| Dura 600 | ||||||||||||||||||
| Adept 360 | ||||||||||||||||||
| Distance/Angle | 180 | 160 | 135 | 130 | 110 | 90 |
|---|---|---|---|---|---|---|
| 0.5 m | ||||||
| 1 m | ||||||
| 2 m | ||||||
| 3 m | ||||||
| 4 m | ||||||
| 5 m | ||||||
| 6 m | ||||||
| 7 m | ||||||
| 8 m | ||||||
| 9 m | ||||||
| 10 m | ||||||
| 11 m | ||||||
| 12 m | ||||||
| 13 m | ||||||
| 14 m | ||||||
| 15 m |
| Technique | MRC | Filt. MRC | SC | Filt. SC | SSC | Filt. SSC | ScanC | Filt. ScanC | |
|---|---|---|---|---|---|---|---|---|---|
| #Antennas | |||||||||
| 2 | 1.6006 | 1.6235 | 1.0791 | 1.0738 | 1.5583 | 1.0882 | 2.3467 | 2.3399 | |
| 3 | 1.3210 | 1.2236 | 0.9034 | 0.7967 | 1.1668 | 0.7398 | 2.1751 | 2.1790 | |
| 4 | 1.0769 | 1.0061 | 0.6759 | 0.5802 | 0.9381 | 0.7398 | 2.0629 | 2.0119 | |
| Technique | MRC | Filt. MRC | SC | Filt. SC | SSC | Filt. SSC | ScanC | Filt. ScanC | |
|---|---|---|---|---|---|---|---|---|---|
| Max. Distance | |||||||||
| 10 m | 0.9057 | 0.6212 | 1.6425 | 1.1268 | 1.0485 | 1.1008 | 1.0060 | 0.5650 | |
| 16 m | 3.5396 | 2.9744 | 4.8282 | 4.0904 | 3.5497 | 3.2720 | 4.0793 | 3.5286 | |
| 17 m | 3.8662 | 3.3645 | 5.3449 | 4.6672 | 3.8546 | 3.422 | 4.5838 | 4.1054 | |
| System | Scenario | Technology | Accuracy (Average Error) |
|---|---|---|---|
| LIPS [62] | Buildings | Wi-Fi | ∼0.76 m |
| SDM [63] | Small building (598 m) | Wi-Fi | ∼3 m |
| OIL [64] | Area with four rooms | Wi-Fi | Order of meters |
| EZ [65] | Small (486 m) and big buildings (12,600 m) | Wi-Fi | ∼2 m (small) and 7 m (big) |
| WiGEM [66] | Small (600 m) and medium (3,250 m) buildings | Wi-Fi | <8 m |
| WILL [67] | Medium academic buildings (1,600 m) | Wi-Fi | 86% room level accuracy |
| UnLoc [68] | Different setups (largest 4,000 m) | Wi-Fi and inertial sensors | ∼1.69 m |
| Zee [69] | Medium sized building (2,275 m) | Wi-Fi | ∼3 m together with EZ or Horus. |
| LiFS [70] | Medium sized building (1,600 m) | Wi-Fi | 89% room level accuracy |
| Walkie-Markie [71] | Medium size office (3,600 m) and shopping mall | Wi-Fi | ∼1.65 m |
| RADAR [72] | Area 975 m, more than 50 rooms | Wi-Fi | ∼3–5 m |
| Horus [73] | 4th floor of the Computer Science building | Wi-Fi | ∼3–5 m |
| AiRISTA Flow [74] | Asset tracking | Wi-Fi | ∼1 m |
| IZat [75] | Automotive | Wi-Fi, GPS, 4G | ∼5 m |
| Ubisense [76] | Smart factory | UWB | ∼15 cm |
| Dart [77] | Manufacturing | UWB | ∼30 cm |
| 3D-LOCUS [78] | Laboratory | Ultrasound | ∼8 mm |
| Elpas [79] | Healthcare and commercial | IR, UHF and LF RFID | ∼1 m |
| SpotON [80] | Laboratory | Active RFID | ∼3 m |
| Topaz [81] | Areas of ∼1000 m | Bluetooth+IR | 2–3 m |
| Landmarc [82] | Laboratory | Active RFID | <2 m |
| Sparse distribution [83] | Not specified | Passive RFID | <10 cm |
| GPs [84] | Area of 1600 m (55 rooms) | Active RFID | ∼1.5 m |
| Robotics-based [85] | 3rd floor of Duncan Hall at Rice University | Wi-Fi | ∼1.5 m |
| MultiLoc [86] | 4th floor (more than 10 rooms) | Wi-Fi | ∼2.7 m |
| Zigbee IPS [87] | Engineering building 7.26 × 16.5 m | Zigbee | ∼3.01 m |
| TIX [88] | Office (1020 m) | Wi-Fi | ∼5.4 m |
| BLE fingerprinting [89] | Office (600 m) | BLE | <2.6 m, high beacon density |
| GSM fingerprinting [90] | Large multi-floor buildings | GSM | ∼5 m |
| NDI [91] | Industry and healthcare | Infrared (3D) | 0.1 mm |
| IRIS_LPS [92] | Lecture hall (100 m) | Infrared + stereo camara | <16 cm |
| Bat [93] | Building (1000 m), three floors | Ultrasound | 3 cm |
| Cricket [94] | Different rooms | RF + Ultrasound | 10 cm, orientation accuracy 3 |
| Sonitor [95] | Healthcare | Ultrasound, Wi-Fi and LF | Room level accuracy |
| COMPASS [96] | Office building (312 m) | Wi-Fi, no real-time tracking | ∼1.65 m |
| OPT [97] | Context aware app in personal network | IEEE 802.15.4 | 1.5–3.8 m |
| Easy Living [98] | In-home and in-offices | Multiple tech | Accuracy non guaranteed |
| Beep [99] | Room 20 × 9 m: users can use their own devices | Sound source location | 0.4 cm |
© 2016 by the authors; licensee MDPI, Basel, Switzerland. This article is an open access article distributed under the terms and conditions of the Creative Commons Attribution (CC-BY) license (http://creativecommons.org/licenses/by/4.0/).
Share and Cite
Fraga-Lamas, P.; Noceda-Davila, D.; Fernández-Caramés, T.M.; Díaz-Bouza, M.A.; Vilar-Montesinos, M. Smart Pipe System for a Shipyard 4.0. Sensors 2016, 16, 2186. https://doi.org/10.3390/s16122186
Fraga-Lamas P, Noceda-Davila D, Fernández-Caramés TM, Díaz-Bouza MA, Vilar-Montesinos M. Smart Pipe System for a Shipyard 4.0. Sensors. 2016; 16(12):2186. https://doi.org/10.3390/s16122186
Chicago/Turabian StyleFraga-Lamas, Paula, Diego Noceda-Davila, Tiago M. Fernández-Caramés, Manuel A. Díaz-Bouza, and Miguel Vilar-Montesinos. 2016. "Smart Pipe System for a Shipyard 4.0" Sensors 16, no. 12: 2186. https://doi.org/10.3390/s16122186
APA StyleFraga-Lamas, P., Noceda-Davila, D., Fernández-Caramés, T. M., Díaz-Bouza, M. A., & Vilar-Montesinos, M. (2016). Smart Pipe System for a Shipyard 4.0. Sensors, 16(12), 2186. https://doi.org/10.3390/s16122186