Article

Standardization, Calibration, and Evaluation of Tantalum-Nano rGO-SnO2 Composite as a Possible Candidate Material in Humidity Sensors

1
Department of Architectural Engineering, Hanyang University, 1271 Sa 3-dong, Sangrok-gu, Ansan 426791, Korea
2
PG and Research Department of Chemistry, Alagappa Government Arts College, Karaikudi 630003, Tanilnadu, India
3
Department of Civil Engineering, Hannam University, Daejeon 306-791, Korea
4
Corrosion and Materials Protection Division, CSIR-Central Electrochemical Research Institute, Karaikudi 630003, Tamilnadu, India
*
Author to whom correspondence should be addressed.
Sensors 2016, 16(12), 2079; https://doi.org/10.3390/s16122079
Submission received: 9 September 2016 / Revised: 25 November 2016 / Accepted: 30 November 2016 / Published: 7 December 2016
(This article belongs to the Special Issue Humidity Sensors)

Abstract

:
The present study focuses the development and the evaluation of humidity sensors based on reduced graphene oxide—tin oxide (rGO-SnO2) nanocomposites, synthesized by a simple redox reaction between GO and SnCl2. The physico-chemical characteristics of the nanocomposites were analyzed by XRD, TEM, FTIR, and Raman spectroscopy. The formation of SnO2 crystal phase was observed through XRD. The SnO2 crystal phase anchoring to the graphene sheet was confirmed through TEM images. For the preparation of the sensors, tantalum substrates were coated with the sensing material. The sensitivity of the fabricated sensor was studied by varying the relative humidity (RH) from 11% to 95% over a period of 30 days. The dependence of the impedance and of the capacitance with RH of the sensor was measured with varying frequency ranging from 1 kHz to 100 Hz. The long-term stability of the sensor was measured at 95% RH over a period of 30 days. The results proved that rGO-SnO2 nanocomposites are an ideal conducting material for humidity sensors due to their high sensitivity, rapid response and recovery times, as well as their good long-term stability.

1. Introduction

Humidity sensors play a vital role in environmental, industrial, and agricultural applications. Humidity is an important factor in physical, chemical, and biological processes. Optimal humidity is essential for human health and wellbeing. Humidity measurement in industrial processes is also critical because it may affect the quality and business cost of the product. Humidity sensors based on SnO2, TiO2, ZnO, CuO, and cross linked polymers have been reported in recent years [1,2,3,4,5,6,7,8,9,10]. Among them, SnO2 nanomaterials exhibit a higher performance for humidity sensing applications. It is due to their high surface area, high alkaline stability, excellent conductivity, good reversibility, ease of functionalization, robust mechanical properties, and low production cost. Moreover, the size and shape of the particles affect the humidity sensing capacity. Recently, high sensitivity humidity sensors based on a uniform morphology of SnO2 nanowires have been reported. The enhanced surface area and stable humidity sensing of the active material, which was prepared by adding GO, allowed the achievement of good performance in sensor applications [11,12]. In particular, numerous attempts have been made to combine reduced graphene oxide (rGO) with nano metal oxide to enhance their humidity sensing and photo catalytic properties, which are comparable with base materials. Seema et al., reported rGO-SnO2 nanocomposites synthesized by a simple chemical method, that they exhibited enhanced photo catalytic activity regarding the degradation of methylene blue under sunlight [13]. Zhang et al., demonstrated the good performance of NO2 sensing at low temperatures by SnO2 nanoparticles decorated with rGO nanocomposite [14]. Morimutu et al., reported on surface modification of platinum and ruthenium over SnO2 particles for CO gas sensors [15]. However, to the best of our knowledge, there have been few reports that have focused on SnO2 nanoparticle humidity sensors anchored to a graphene sheet.
Most of the studies deal with highly conductive materials used in ceramic substrate coated with noble metals such as Au, Pt, Pd, and Ag. This process can be achieved by physical or chemical methods. These methods tend to be interactive in a number of cases due to random operation cost effects. Alternative cost-effective materials like tantalum exhibit an excellent dielectric constant, high capacitive behavior, and enhanced corrosion resistance to moisture and aqueous solutions [16]. Hence, tantalum is an ideal candidate for the base substrate material for humidity sensor applications.
In the present study, for the first time, attempts were made to attach SnO2 on a graphene sheet for humidity sensing application. This investigation lead to a novel humidity sensor of nano-rGO-SnO2 over a tantalum support.

2. Materials and Methods

2.1. Materials

All used chemicals were of analytical grade and utilized without further purification. Tin chloride dihydrate (SnCl2·2H2O), Hydrochloric acid (HCl) and urea were purchased from SRL Chem. Graphite powder, PVDF (Poly (vinylidene fluoride)), carbon black, and NMP (1-N-methyl-2-pyrrolidinone) were purchased from Alfa Aesar. Tantalum was purchased from Manhar Metal supply Corporation, Mumbai, in India.

2.2. Preparation of Nano SnO2 and rGO-SnO2 Composites

SnCl2·2H2O (1.30 g) was dissolved in HCl (38 wt %, 0.7 mL) and diluted with distilled water (20 mL) to give a SnCl2:HCl solution. In order to form a uniform solution, urea (1.30 g) was added to the SnCl2:HCl solution under vigorous stirring. The resulting solution was then heated up and kept at 90 °C for 12 h. The obtained precipitate was separated by centrifugation and washed with water to remove excess chloride ions. The resulting product was dried in a vacuum oven at 110 °C for 24 h.
GO was prepared from powdered flake graphite (400 mesh) by a modified Hummers method as described elsewhere [17,18]. The obtained graphite oxide (10 mg) was dispersed in distilled water (20 mL) using sonication to form a colloidal suspension. The GO solution was added to a SnCl2:HCl solution: then urea was added to the previously obtained solution and heated up and kept at 90 °C for 12 h. The resulting precipitate was separated by centrifugation and subsequent washing, to remove excess chloride ions. The resulting product was dried in a vacuum oven at 110 °C for 24 h.

2.3. Characterization Techniques

The obtained SnO2 and rGO-SnO2 were analyzed by FTIR spectroscopy. The sample was mixed with KBr crystal and the spectrum was recorded in the transmittance mode in the range of 400–4000 cm−1.
The phase structure of the nanocomposite was characterized by XRD. A computer controlled XRD system—comprised of JEOL, JPX-8030 with Cu-Kα radiation (Ni filter = 13,418 Å), and a power source with 40 kV and 20 A—was used to record the diffraction patterns. Identification of diffraction peaks was done by a computer controlled software application (PAN analytical, X’pert High score plus).
The surface defects, D and G peak, sp2 hybridization of GO, SnO2, and rGO-SnO2 were determined by Laser-Raman spectroscopy (Renishaw Invia Raman Microscope with Wire-2 software) with an excitation wavelength of 633 nm and an exposure time of 50 s (100% intensity).
To visualize the nanocomposites, the particles were dispersed in water, sonicated for an hour and casted onto a copper grid to study the sizes and morphology of the particles on the GO sheet by TEM (Transmission Electron Microscopy) using Tecnai 20G2-FEI, with an acceleration voltage of 200 kV.

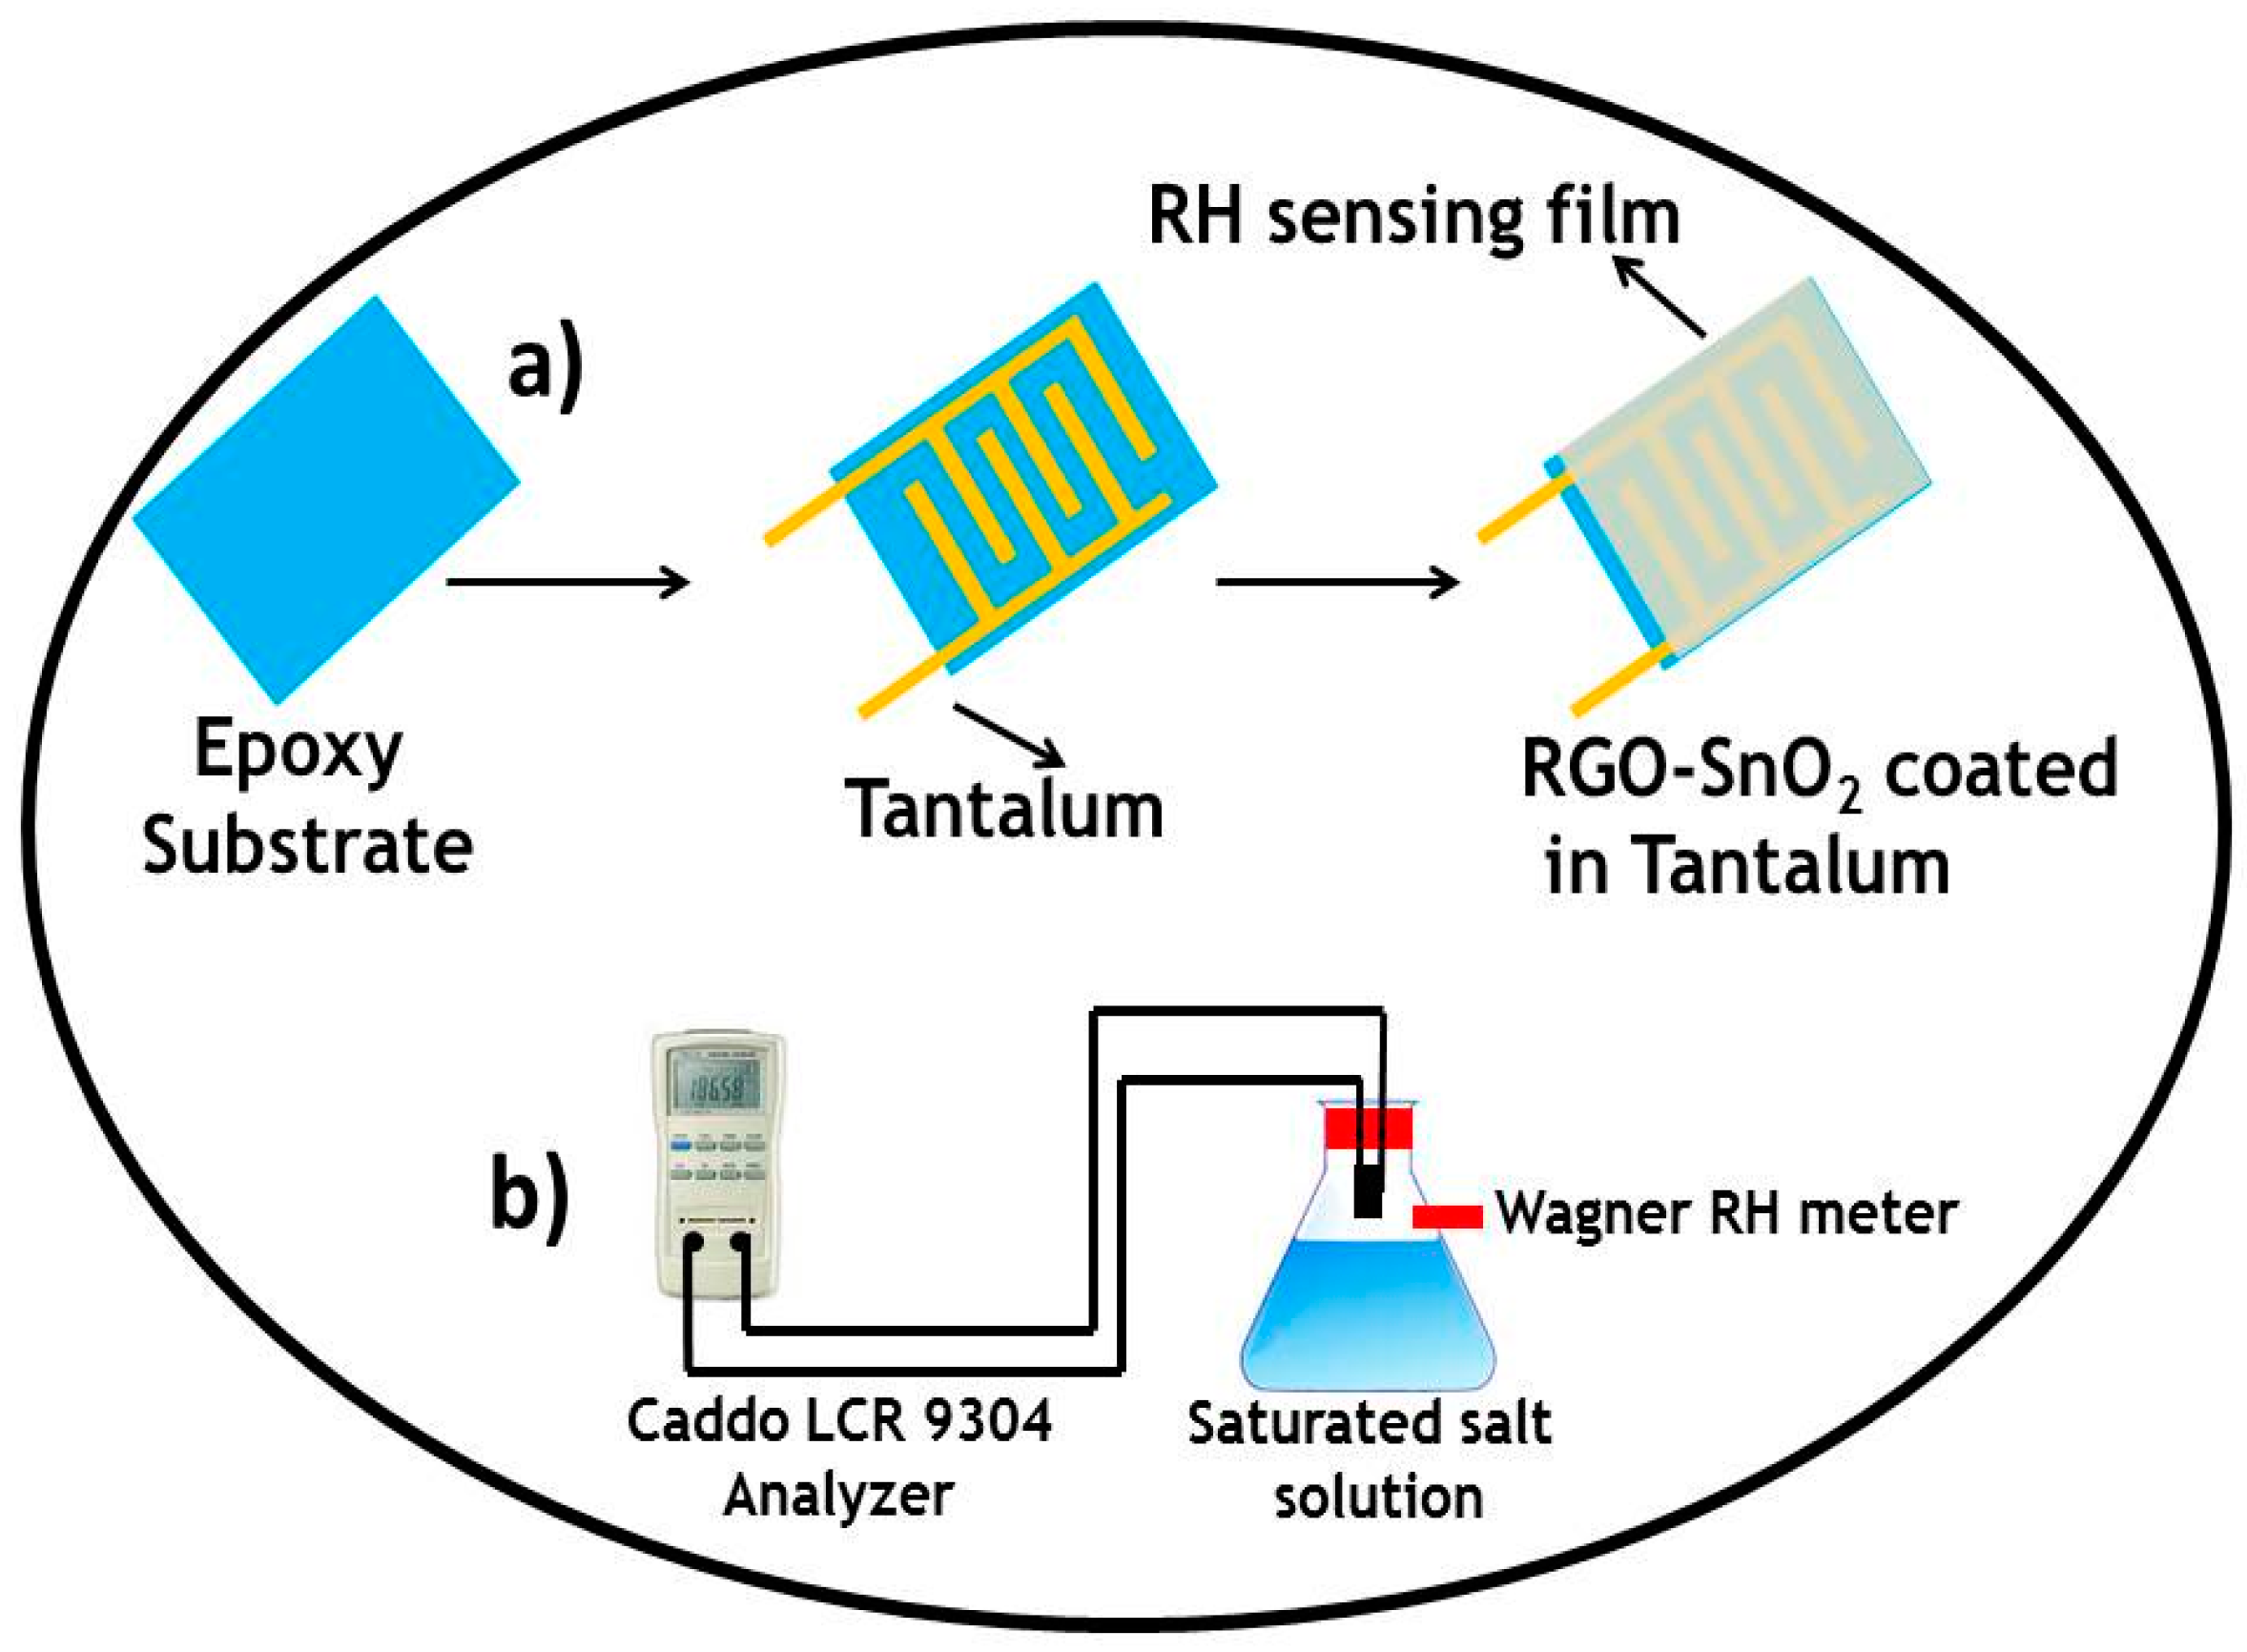
2.4. Assembly and Measurement of Humidity Sensors

Devices with interdigital electrodes were used for humidity sensing measurement. The interdigital electrodes were fabricated by using a tantalum sheet of 1 mm thickness, applying an epoxy substrate, and coating it with rGO-SnO2. As shown in Figure 1a, the width of a finger was about 0.1 mm, and the distance between adjacent fingers around 75 mm. Two lead wires were connected to the tantalum electrodes by tin soldering, followed by masking with epoxy resin. Then, a thick slurry of rGO-SnO2 (90%), carbon black (5%), and Poly vinylidene fluoride (PVDF) (5%) in N-methyl-2-pyrrolidinone (NMP) solvent was prepared and coated on top of the interdigital electrodes (each electrode has six arms) previously treated with an epoxy substrate by the doctor blade technique and dried at 80 °C in air for 12 h in order to evaporate the solvent. Finally, the humidity sensor was fabricated and aged under a relative humidity (RH) of 95%, and with a sinusoidal voltage with an amplitude of 1 V, at 100 Hz, for 24 h. Figure 1a shows a schematic diagram of the humidity sensor. The total thickness of the sensor is 3 mm distributed as follows: epoxy substrate, 2 mm; tantalum, 0.5 mm; and rGO-SnO2 coating, 0.5 mm. The characteristic humidity sensitivity curves were measured on a Caddo LCR-9304 analyzer. For that purpose, a sinusoidal voltage with an amplitude of 1 V, whose frequency varied from 100 Hz to 1 kHz at a temperature of 20 °C, was used. The relative atmospheric humidity was produced using different saturated salt solutions in their equilibrium states, including LiCl for 11% RH, MgCl2 for 33% RH, NaCl for 75% RH, KCl for 85% RH, and K2SO4 for 95% RH at about 20 °C [19]: the uncertainty of the RH values was about ±1%. The humidity sensing measurement system is shown in Figure 1b.

3. Results and Discussion

3.1. Formation Mechanism of SnO2 and rGO-SnO2 Nanocomposites

SnO2 nanoparticle decorated graphene sheets were synthesized via a redox reaction between graphene oxide and SnCl2·2H2O. An aqueous dispersion of GO was mixed with an SnCl2:HCl solution. During the redox reaction, the anchored Sn2+ cations were oxidized to SnO2, while the graphene oxide sheets were reduced to graphene sheets. The even loading of SnO2 nanoparticles on both sides of the graphene layer prevented the aggregation of the graphene layers. The possible reaction mechanism can be written as follows [20]:
SnCl2 + GO + H2O → rGO-SnO2 + 2HCl
CO(NH2)2 + H2O → CO2 + 2NH3
NH3 + H2O → NH4OH
NH4OH + HCl → NH4Cl + H2O

3.2. Characterization of Nano SnO2 and rGO-SnO2 Nanocomposites

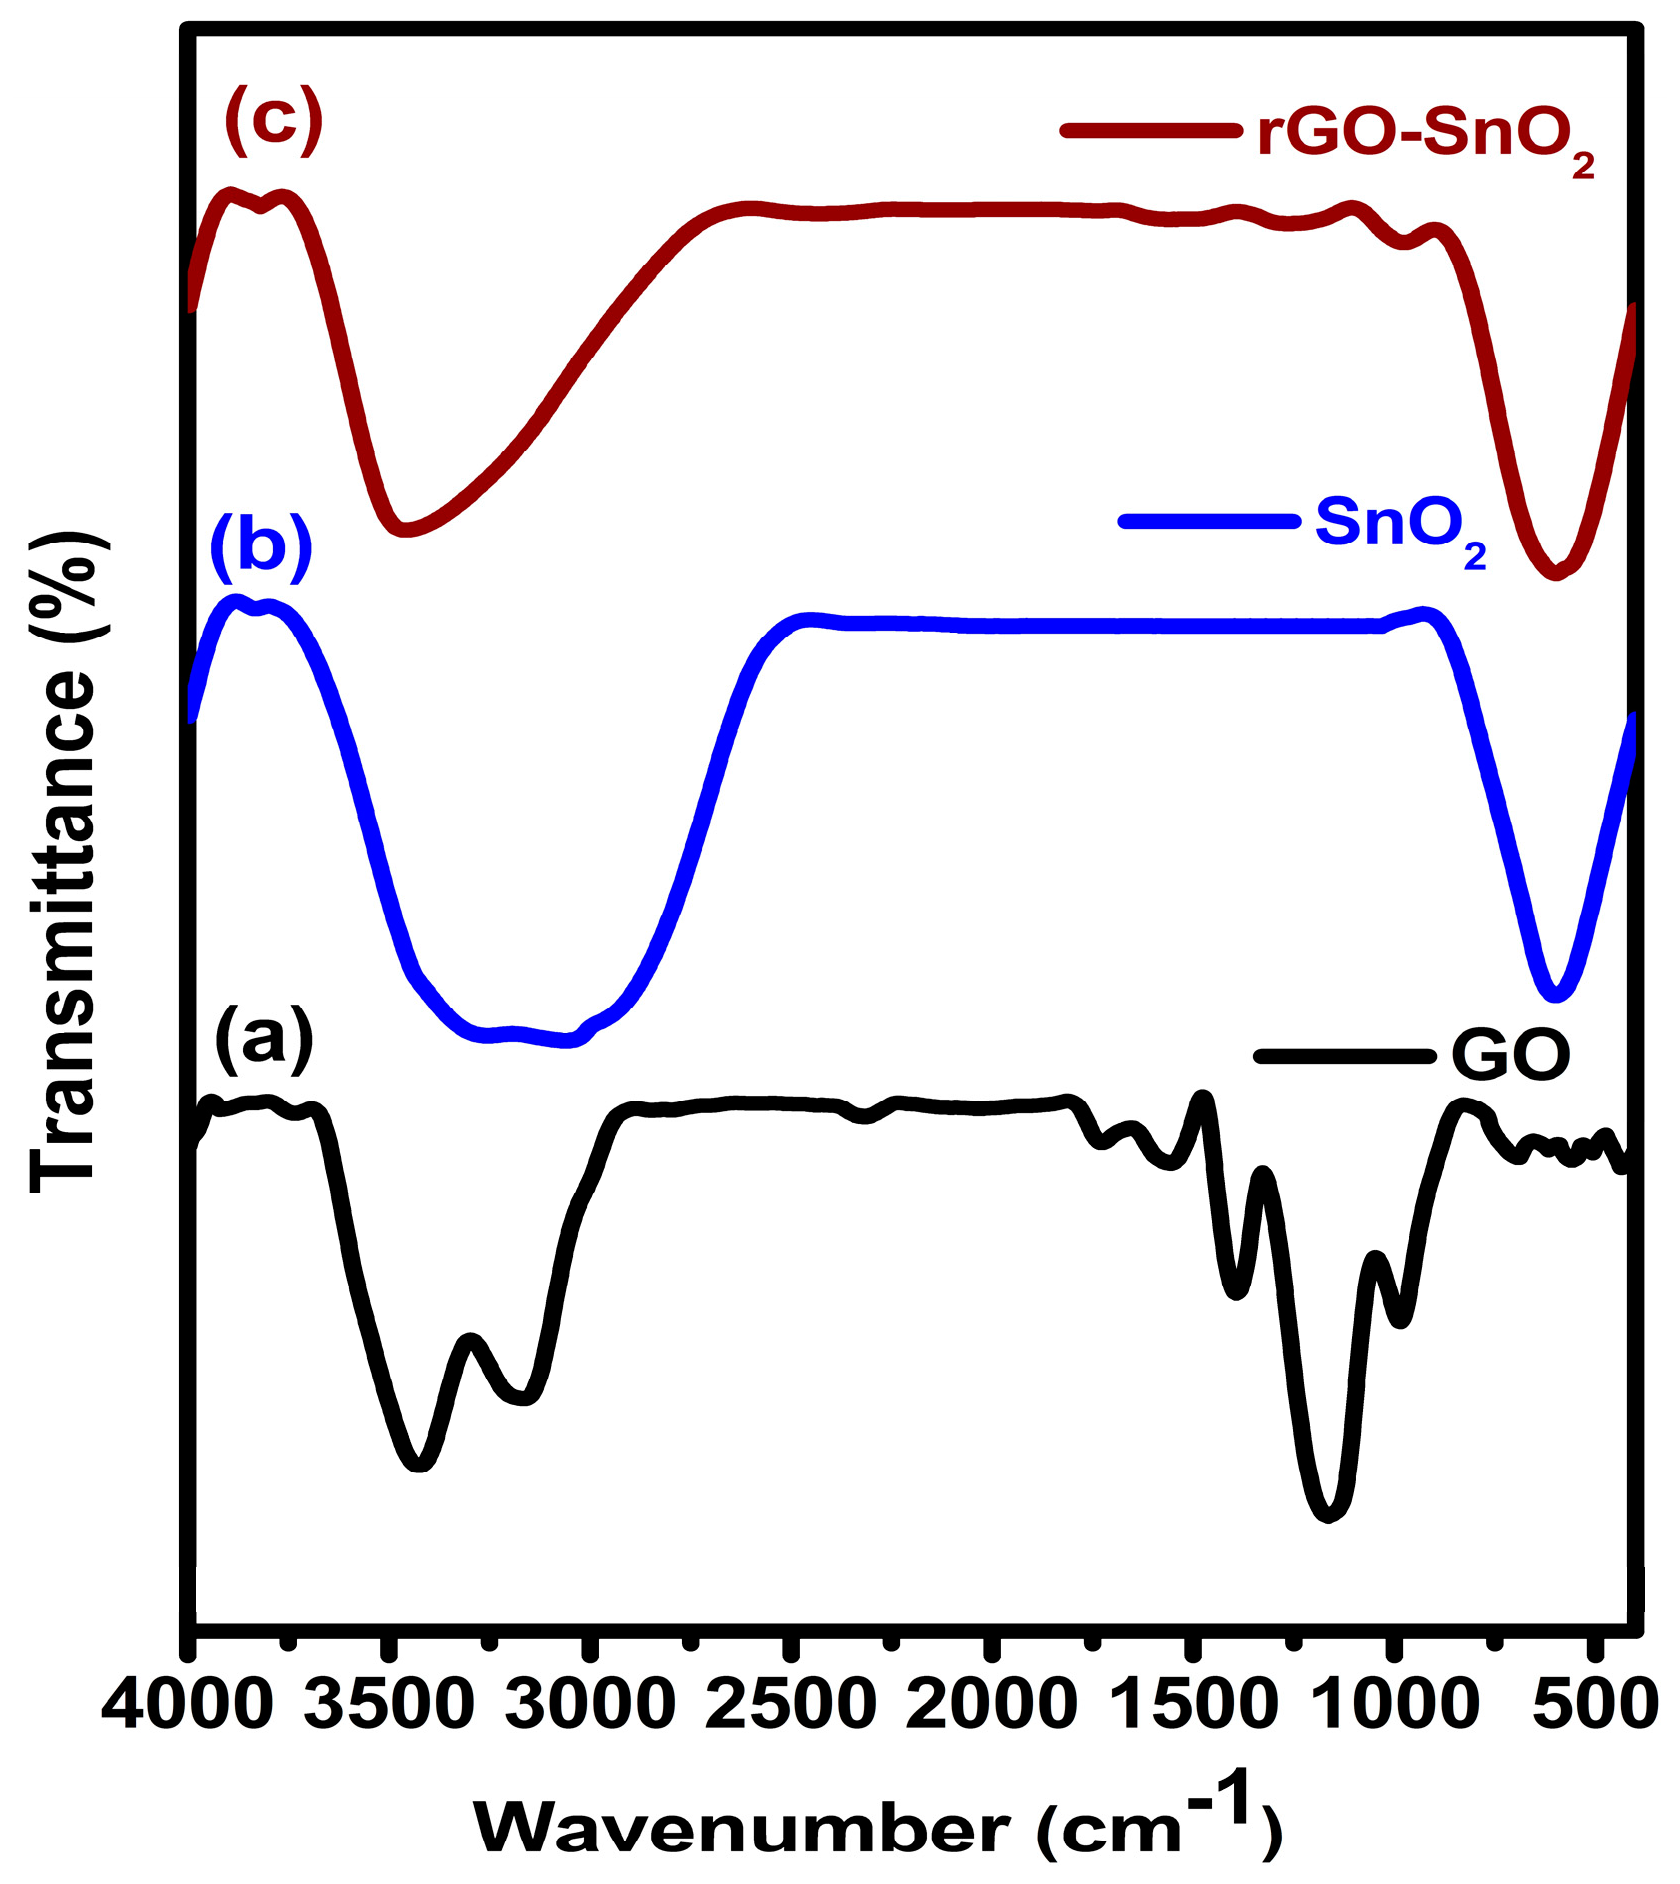
3.2.1. Fourier Transform Infrared Spectroscopy (FTIR)

The GO, SnO2, and rGO-SnO2 were recorded in the FT-IR spectra at transmittance mode and are shown in Figure 2a–c, respectively. The peaks observed at 3453 cm−1 and 1400 cm−1, correspond to the O–H stretching of –COOH in GO and to the vibration of intercalated water, respectively; the characteristic peaks of oxygen moieties—located at 1184 cm−1, 1595 cm−1, and 1747 cm−1—correspond to C–O (ν (epoxy or alkoxy)), C=O in –COOH, and carbonyl moieties (ν (carbonyl), respectively. The GO functional groups are significantly reduced from GO-SnO2 materials. It is clearly indicated that the GO is partially reduced to graphene. Moreover, the new peak (Figure 2b) appeared at 597 cm−1, is attributed to the Sn–O stretching. From this spectrum, it is clear that the rGO-SnO2 peak intensities are similar to the ones of the SnO2 sample. The above facts enunciate the possible compact chemical bonding between SnO2 and rGO, which may be due to the unique synthetic approach.

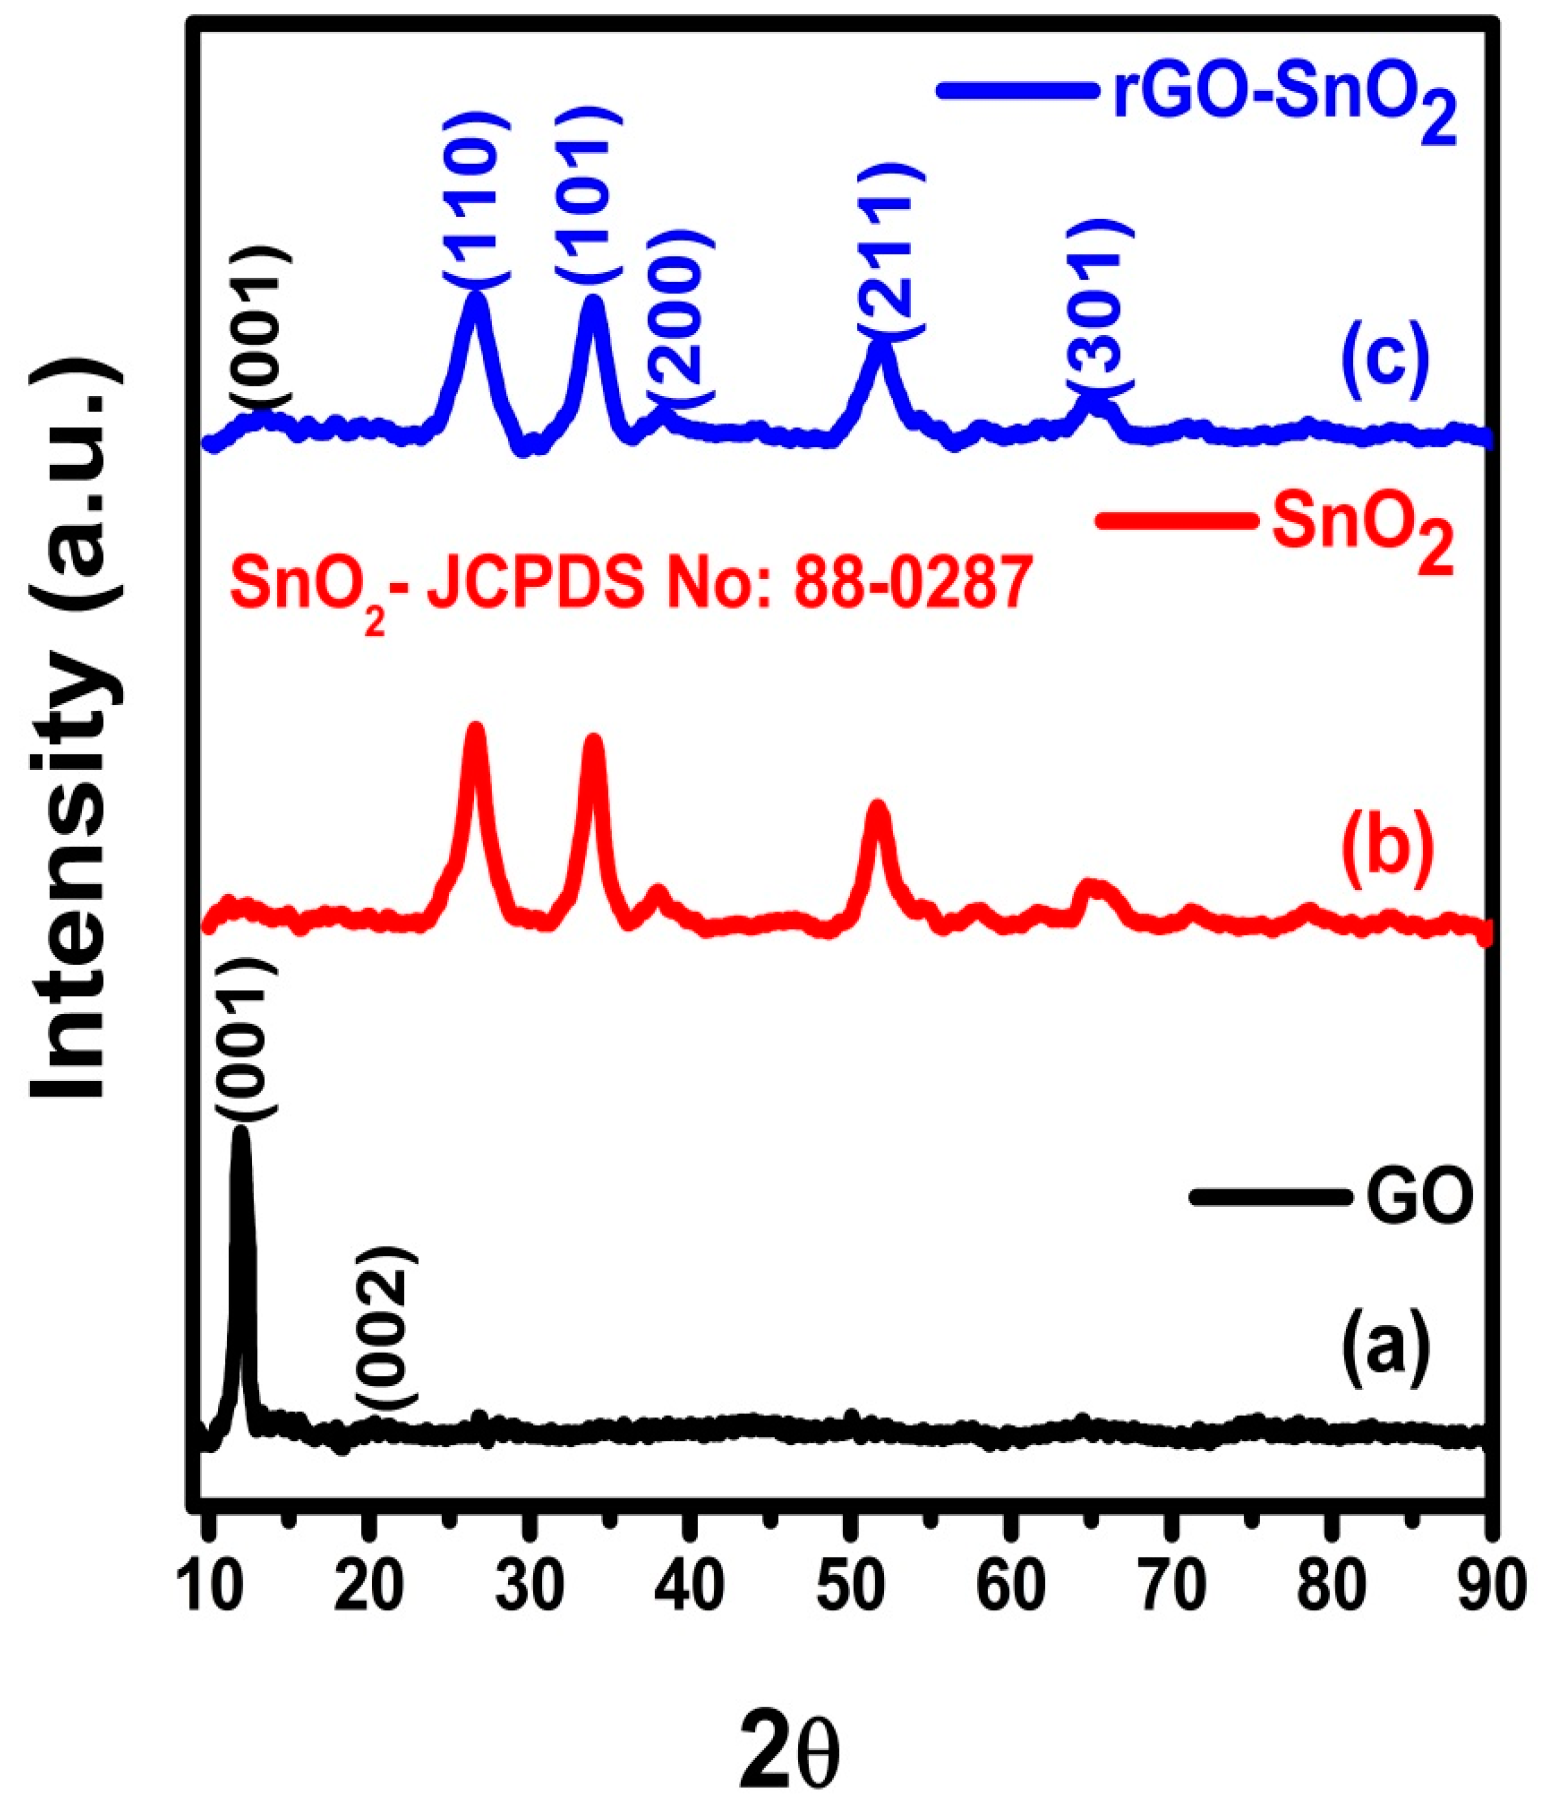
3.2.2. X-ray Diffraction (XRD)

Figure 3a–c shows the XRD pattern for GO (a), SnO2 (b), and rGO-SnO2 (c), respectively. Figure 3a shows the diffraction peaks at 11.9° corresponding to the exfoliation of graphitic plane, i.e., (001) crystal plane structure [21]. In Figure 3b, the diffraction peaks observed at 26.7°, 34.2°, 37.9°, 51.9° and 65.7° correspond to SnO2 (110), (101), (200), (211), and (301) crystal phases, respectively. The diffraction peaks of the synthesized rGO-SnO2 match the ones of the tetragonal crystal phase of SnO2 (ICDD NO: 88-0287). In Figure 3c, the observable diffraction peaks were compared with the patterns of GO and SnO2. Furthermore, the reduced intensity of the diffraction peak corresponding to the graphitic plane confirms the reduction of GO (11.9°) [22]. The mean particle size (D) of the SnO2 nanoparticles was calculated using the Scherrer formula: by applying it to the (110) plane diffraction peak, it was found that D is ~30 nm for the rGO-SnO2 composite and ~50 nm for the SnO2 nanoparticles alone.

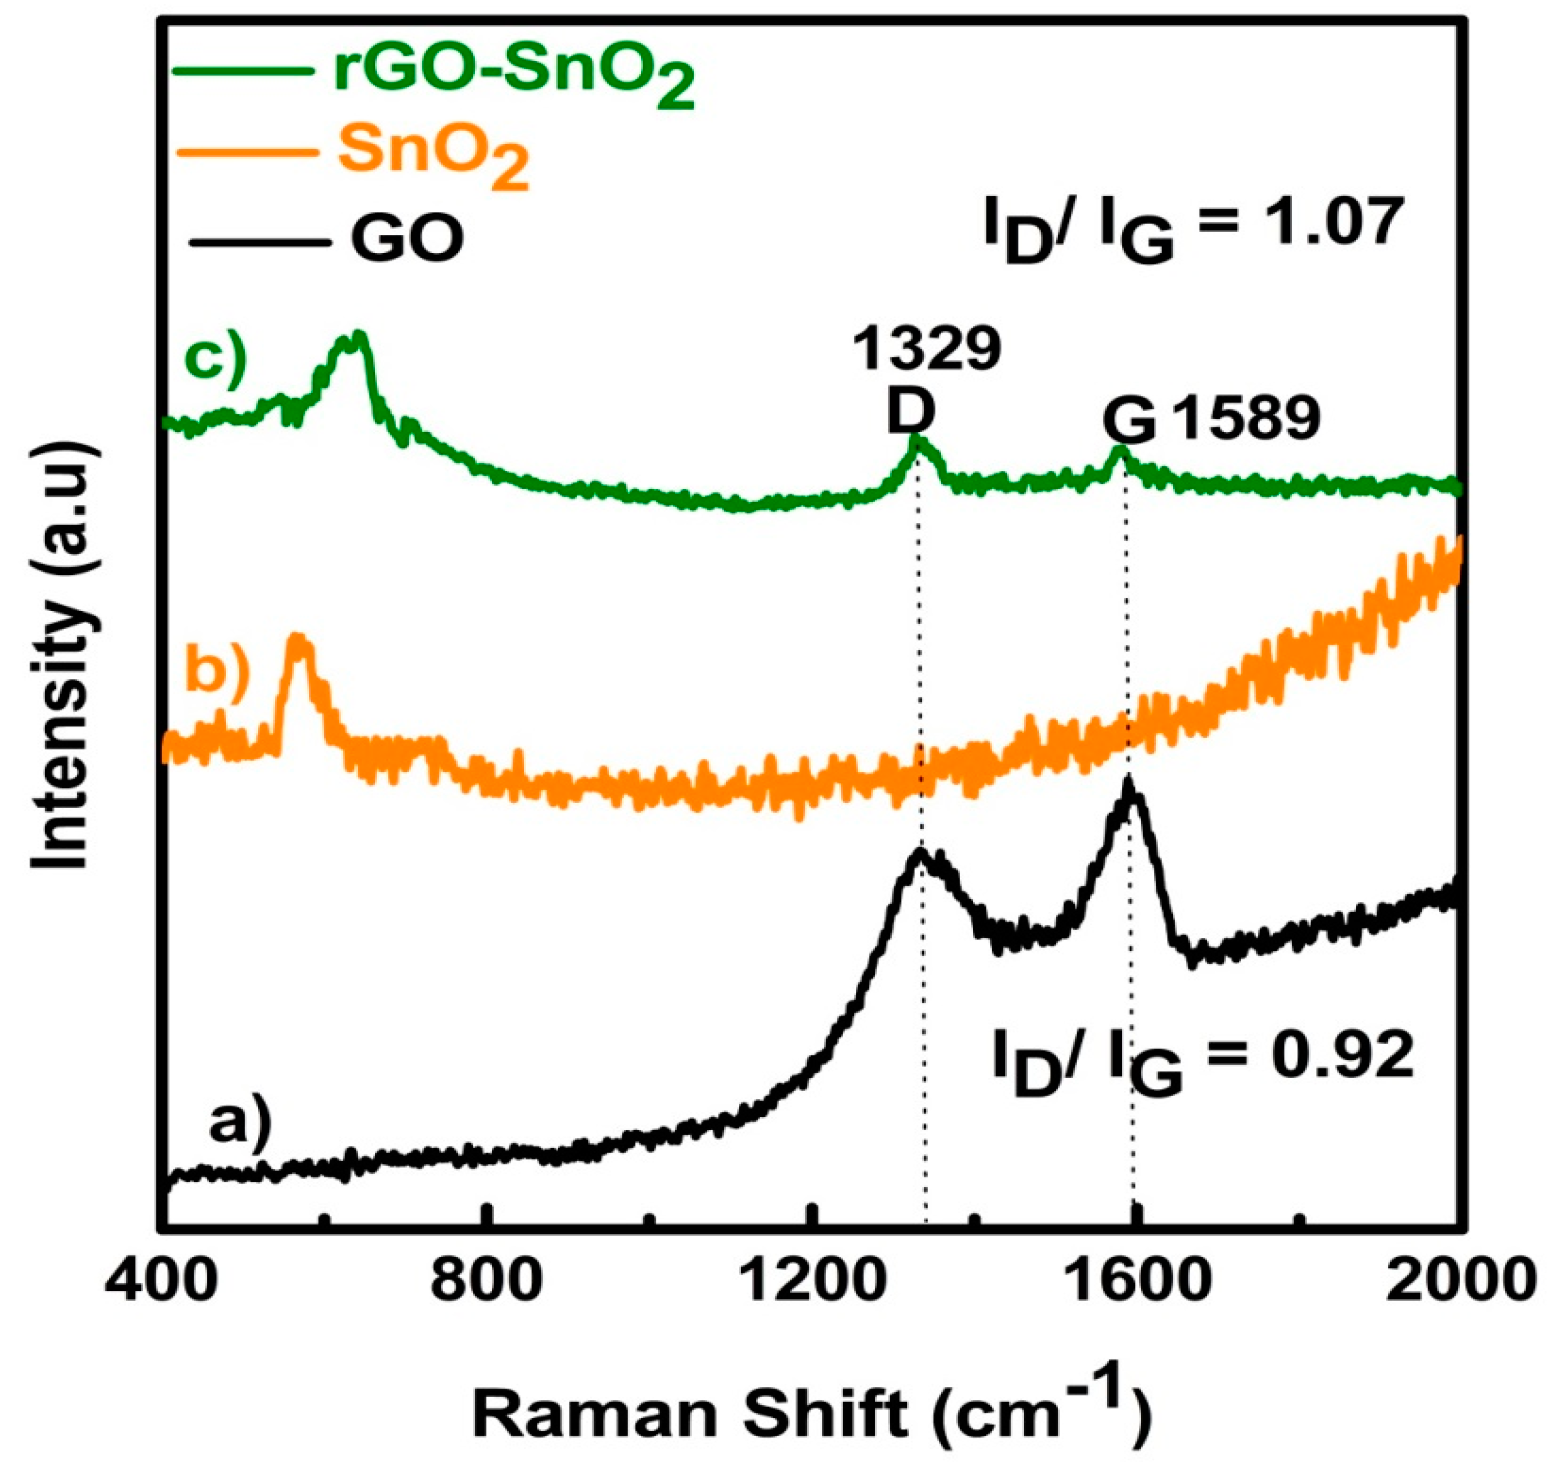
3.2.3. Raman Spectra

In Figure 4, the Raman spectra of GO (a), SnO2 (b), and rGO-SnO2 (c) are plotted respectively. The observed Raman peak shift at 576 and 630 cm−1, in Figure 4b,c, respectively, indicates the presence of SnO2 [23]. Additionally, in the rGO-SnO2 spectrum, the peaks at 1329 and 1589 cm−1 correspond to the D and G band of GO. Previous reports have shown that the D band always appears whether any form of disorders and defects are present; e.g., vacancies, grain boundaries, and amorphous carbon species in carbon materials. The G band is usually generated by the stretching of all sp2 atoms in carbon rings or carbon chains (E2g photons of sp2 atoms). Namely, the ID/IG intensity ratio is closely related with the concentration of defects and with the average size of the p-conjugation in carbon materials. Reasonably, the D band will disappear gradually when the GO is reduced for defect decrease. In the present work, the ID/IG ratios are 0.92 for GO and 1.07 for rGO-SnO2 [24], respectively. Therefore, the existence of SnO2 in rGO results in more defects, as well as in the destruction of sp2 domains. From another point of view, this change also suggests an interesting connection between the SnO2 nanoparticles (NPs) and rGO [25].

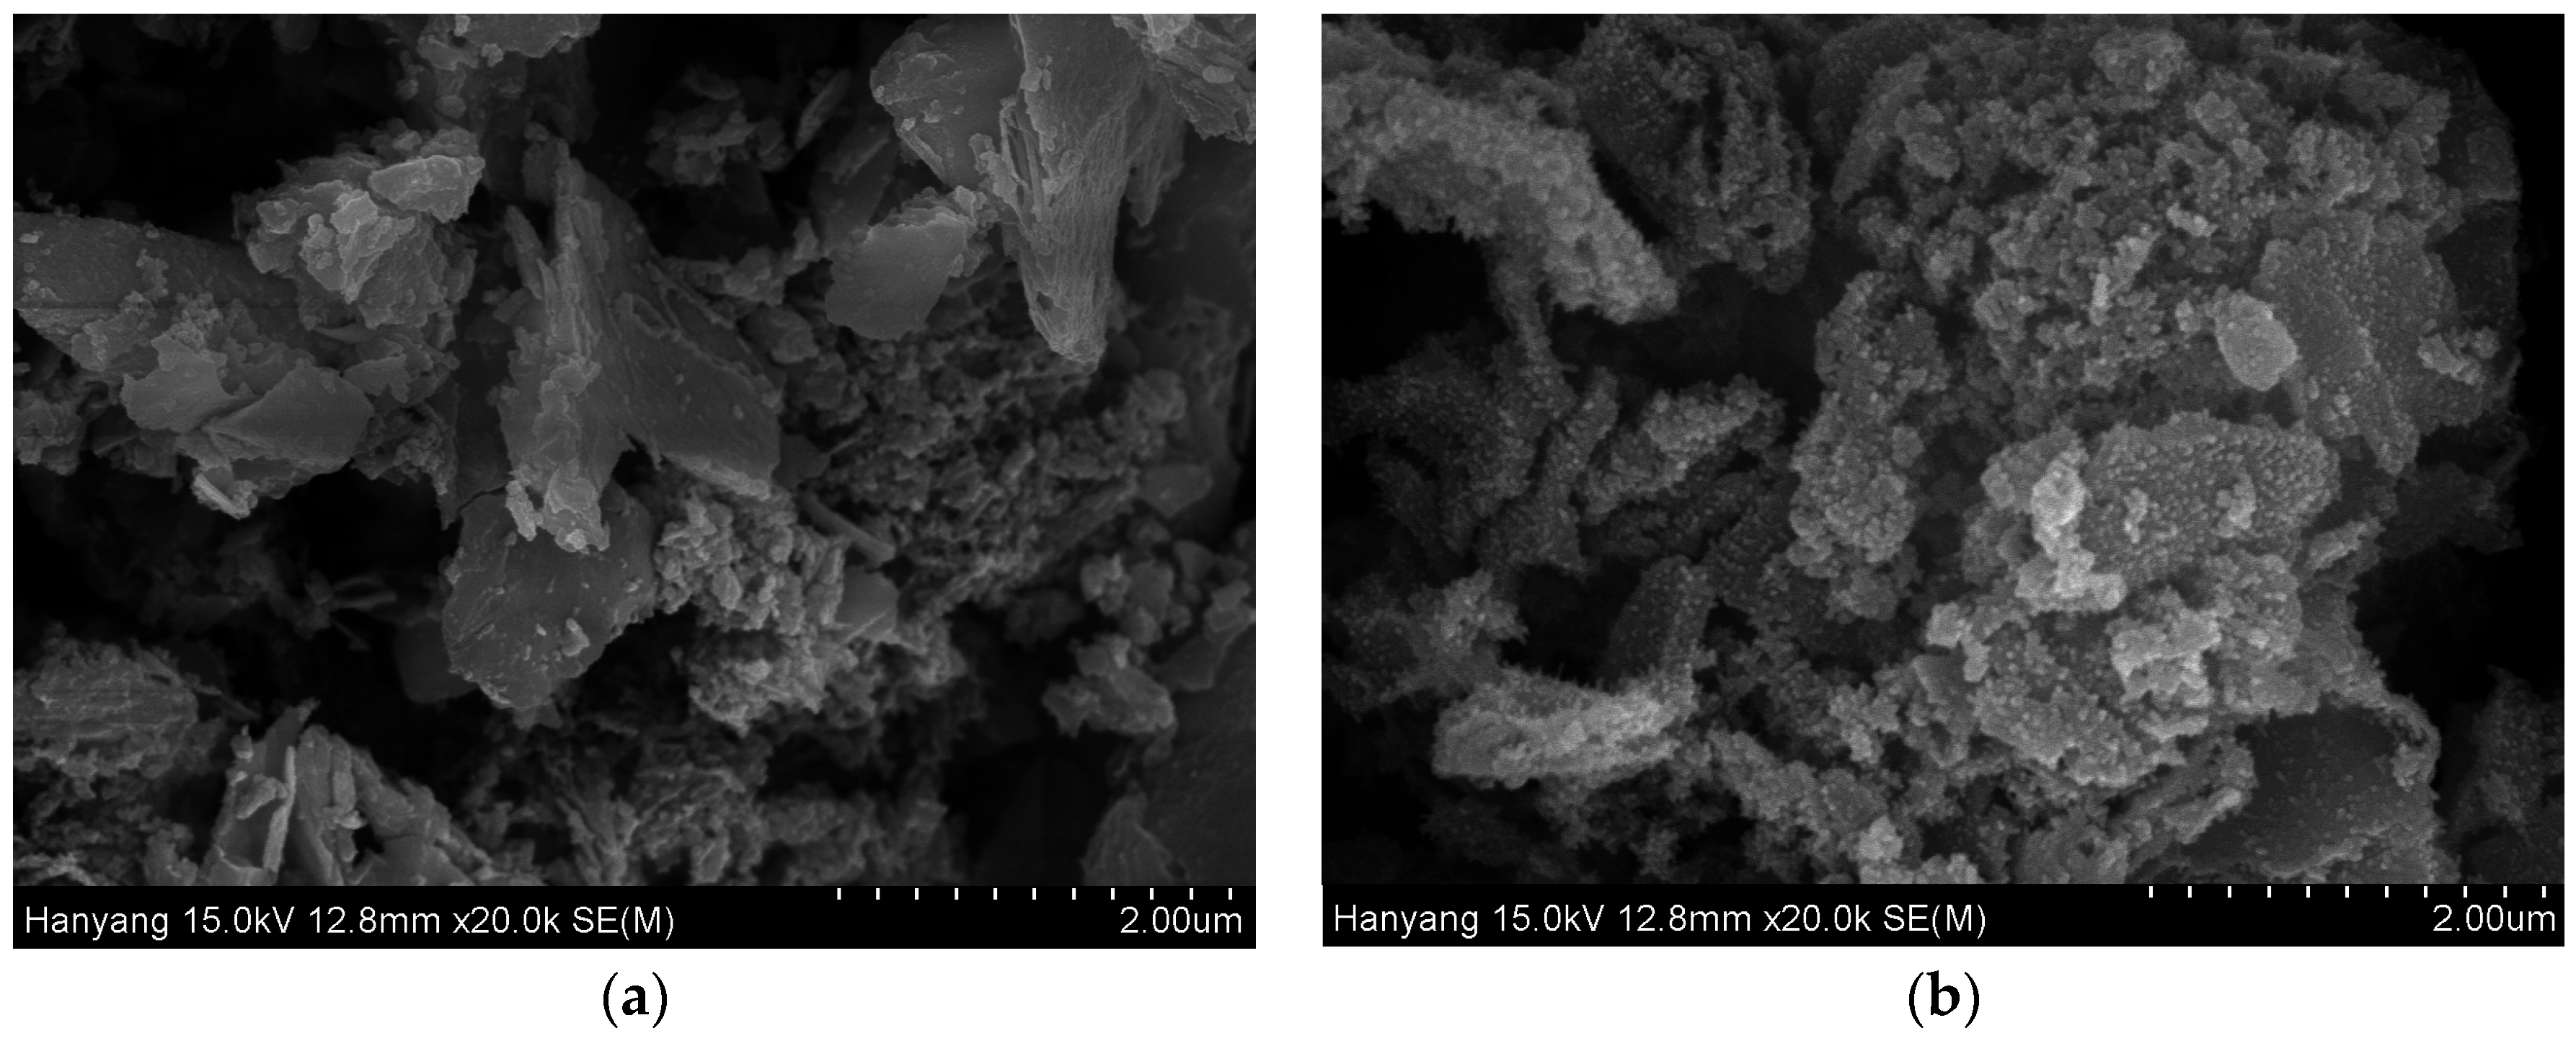
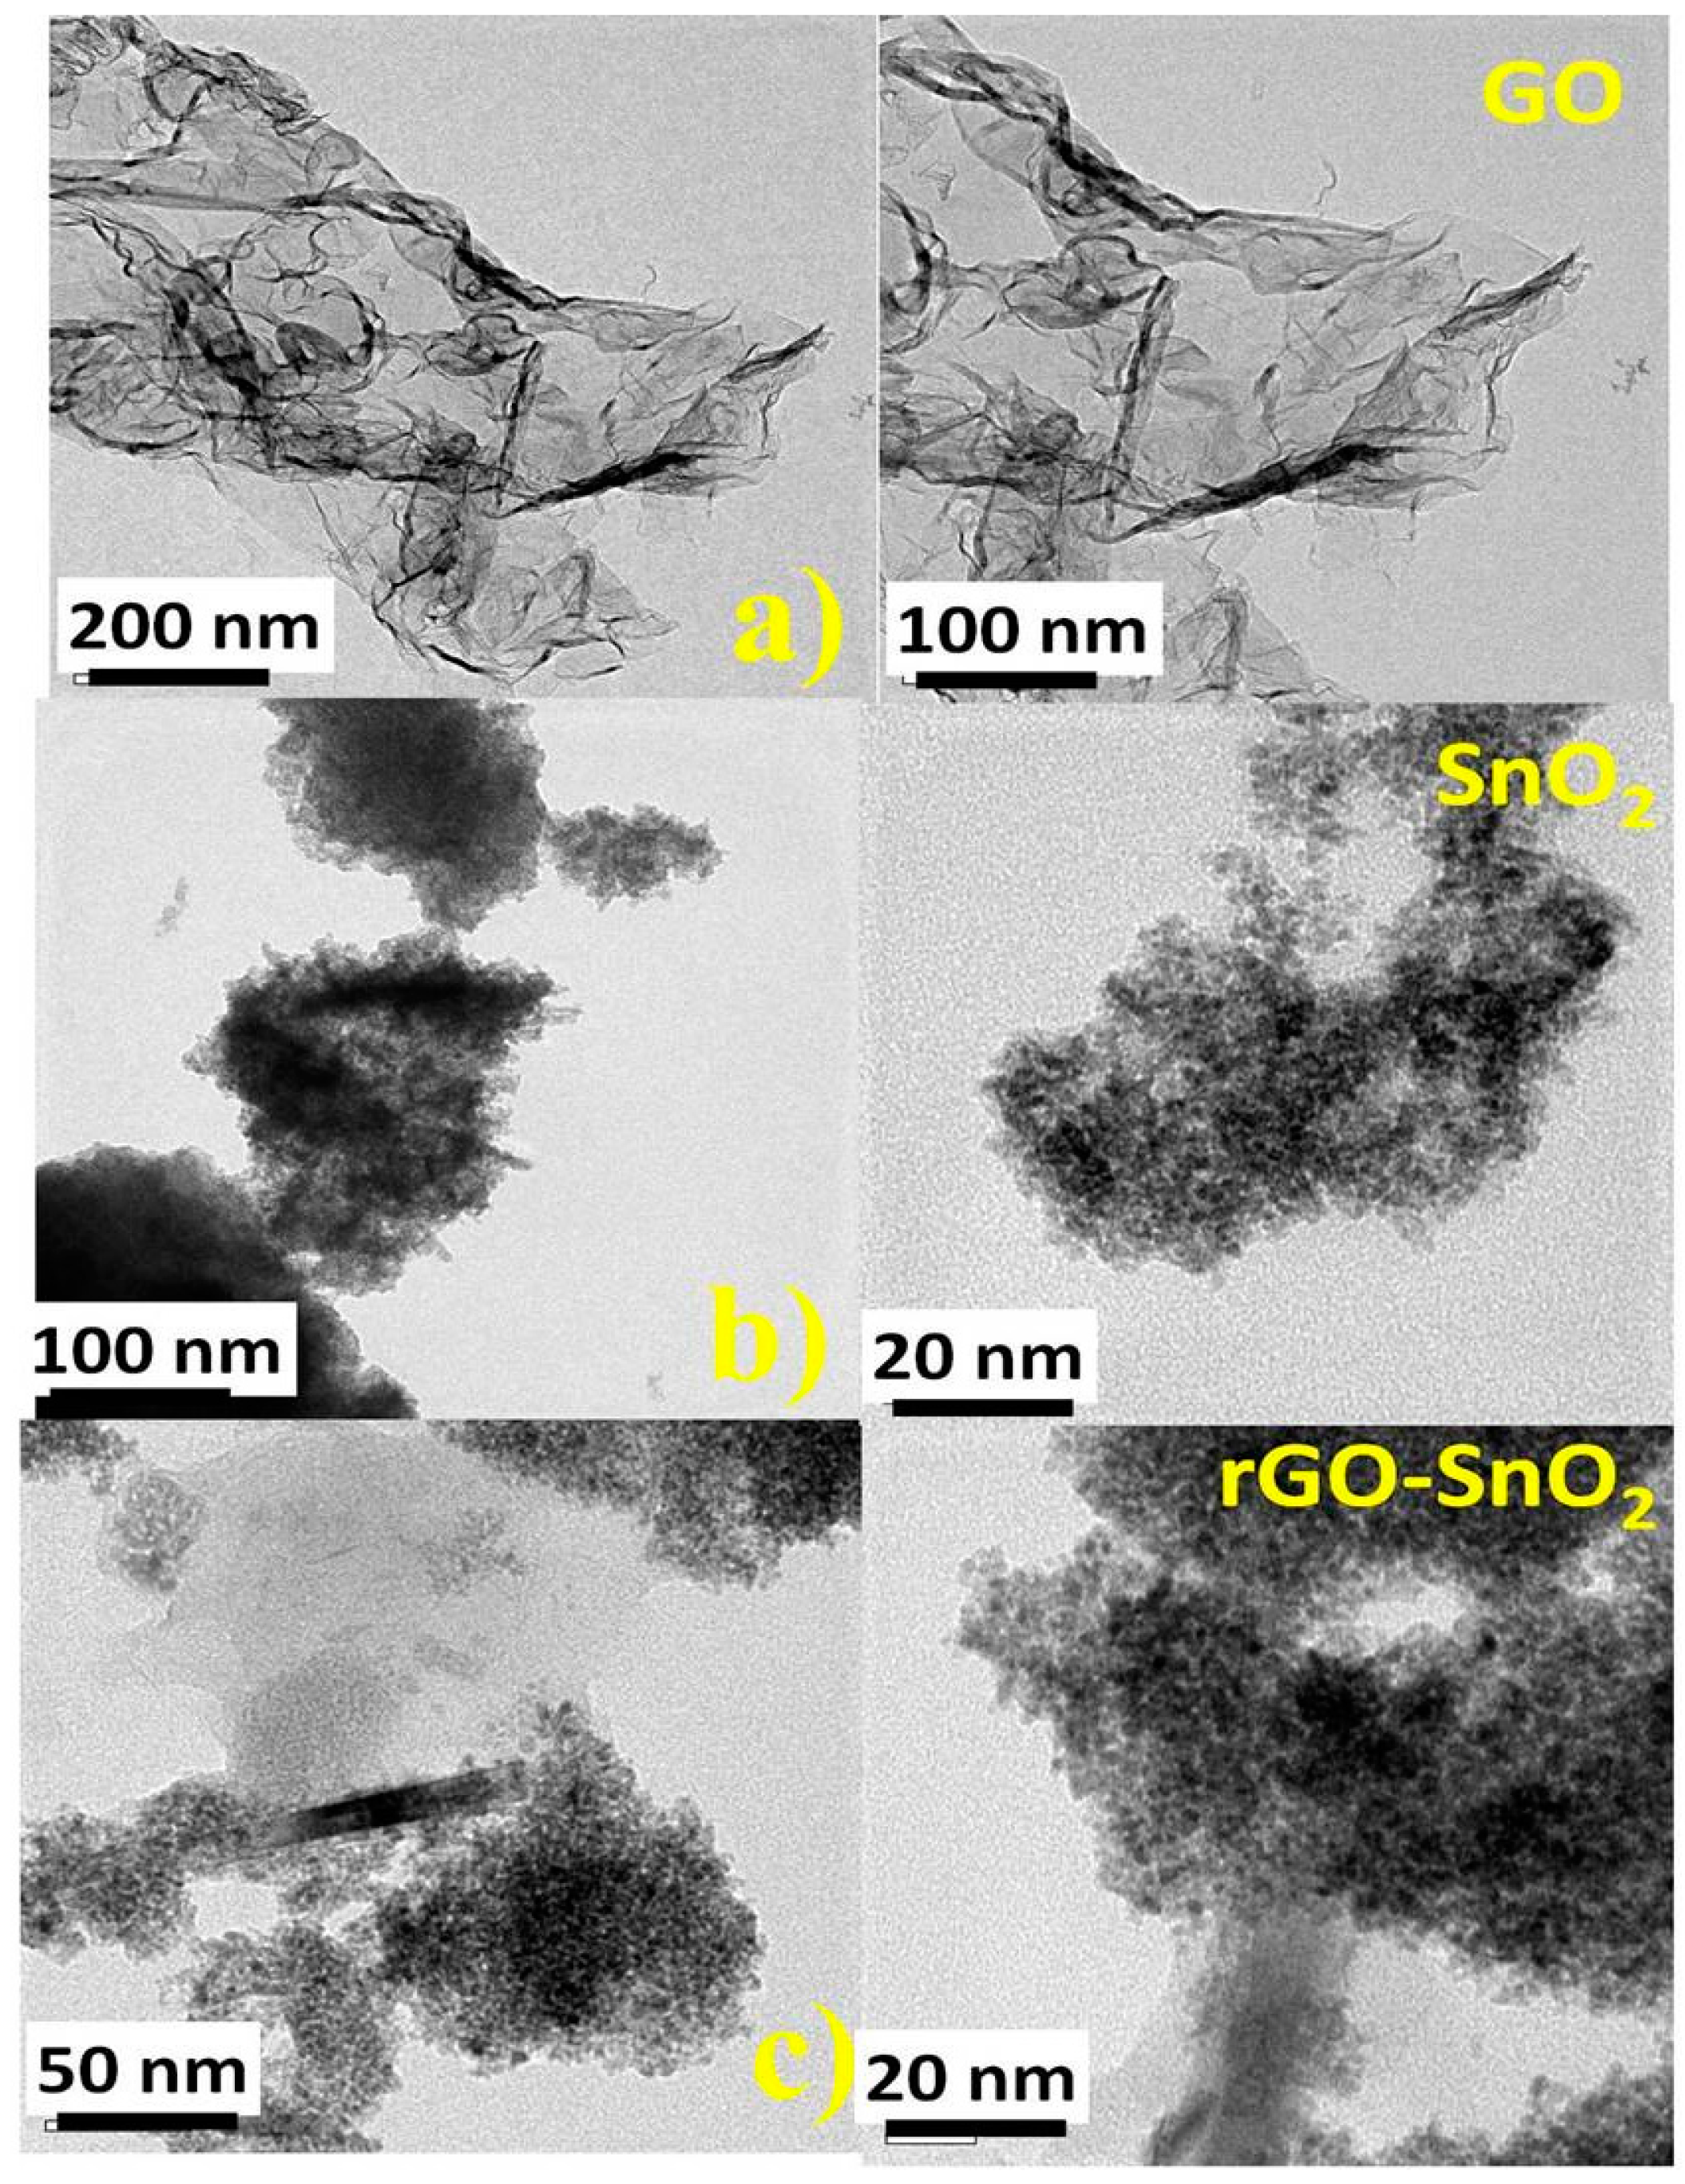
3.2.4. Transmission Electron Microscope (TEM)

TEM images of GO, snO2, and rGO-SnO2 nanocomposites are shown in Figure 5a–c respectively. Figure 5a shows the TEM images of ultrasonically exfoliated graphene oxide. It clearly indicates the typical attributes of GO such as wrinkles and crumpled thin paper-like structure, with numerous folds at the edges of the GO sheet [26]. This feature has been reported previously by various researchers. As expected, the TEM images illustrate that GO was exfoliated into very thin layers. Figure 5b shows the TEM image of the SnO2 nanoparticles. Interestingly, the structure is composed of quasi-spherical nanoparticles. The size distribution and particle diameter were estimated using the ImageJ software application: it was found to lie in the range between 40 nm and 50 nm. A similar SnO2 lattice fringe was also observed for the rGO-SnO2 nanocomposites (Figure 5c). The TEM studies further confirmed the incorporation of SnO2 nanoparticles on the surface of rGO [27].

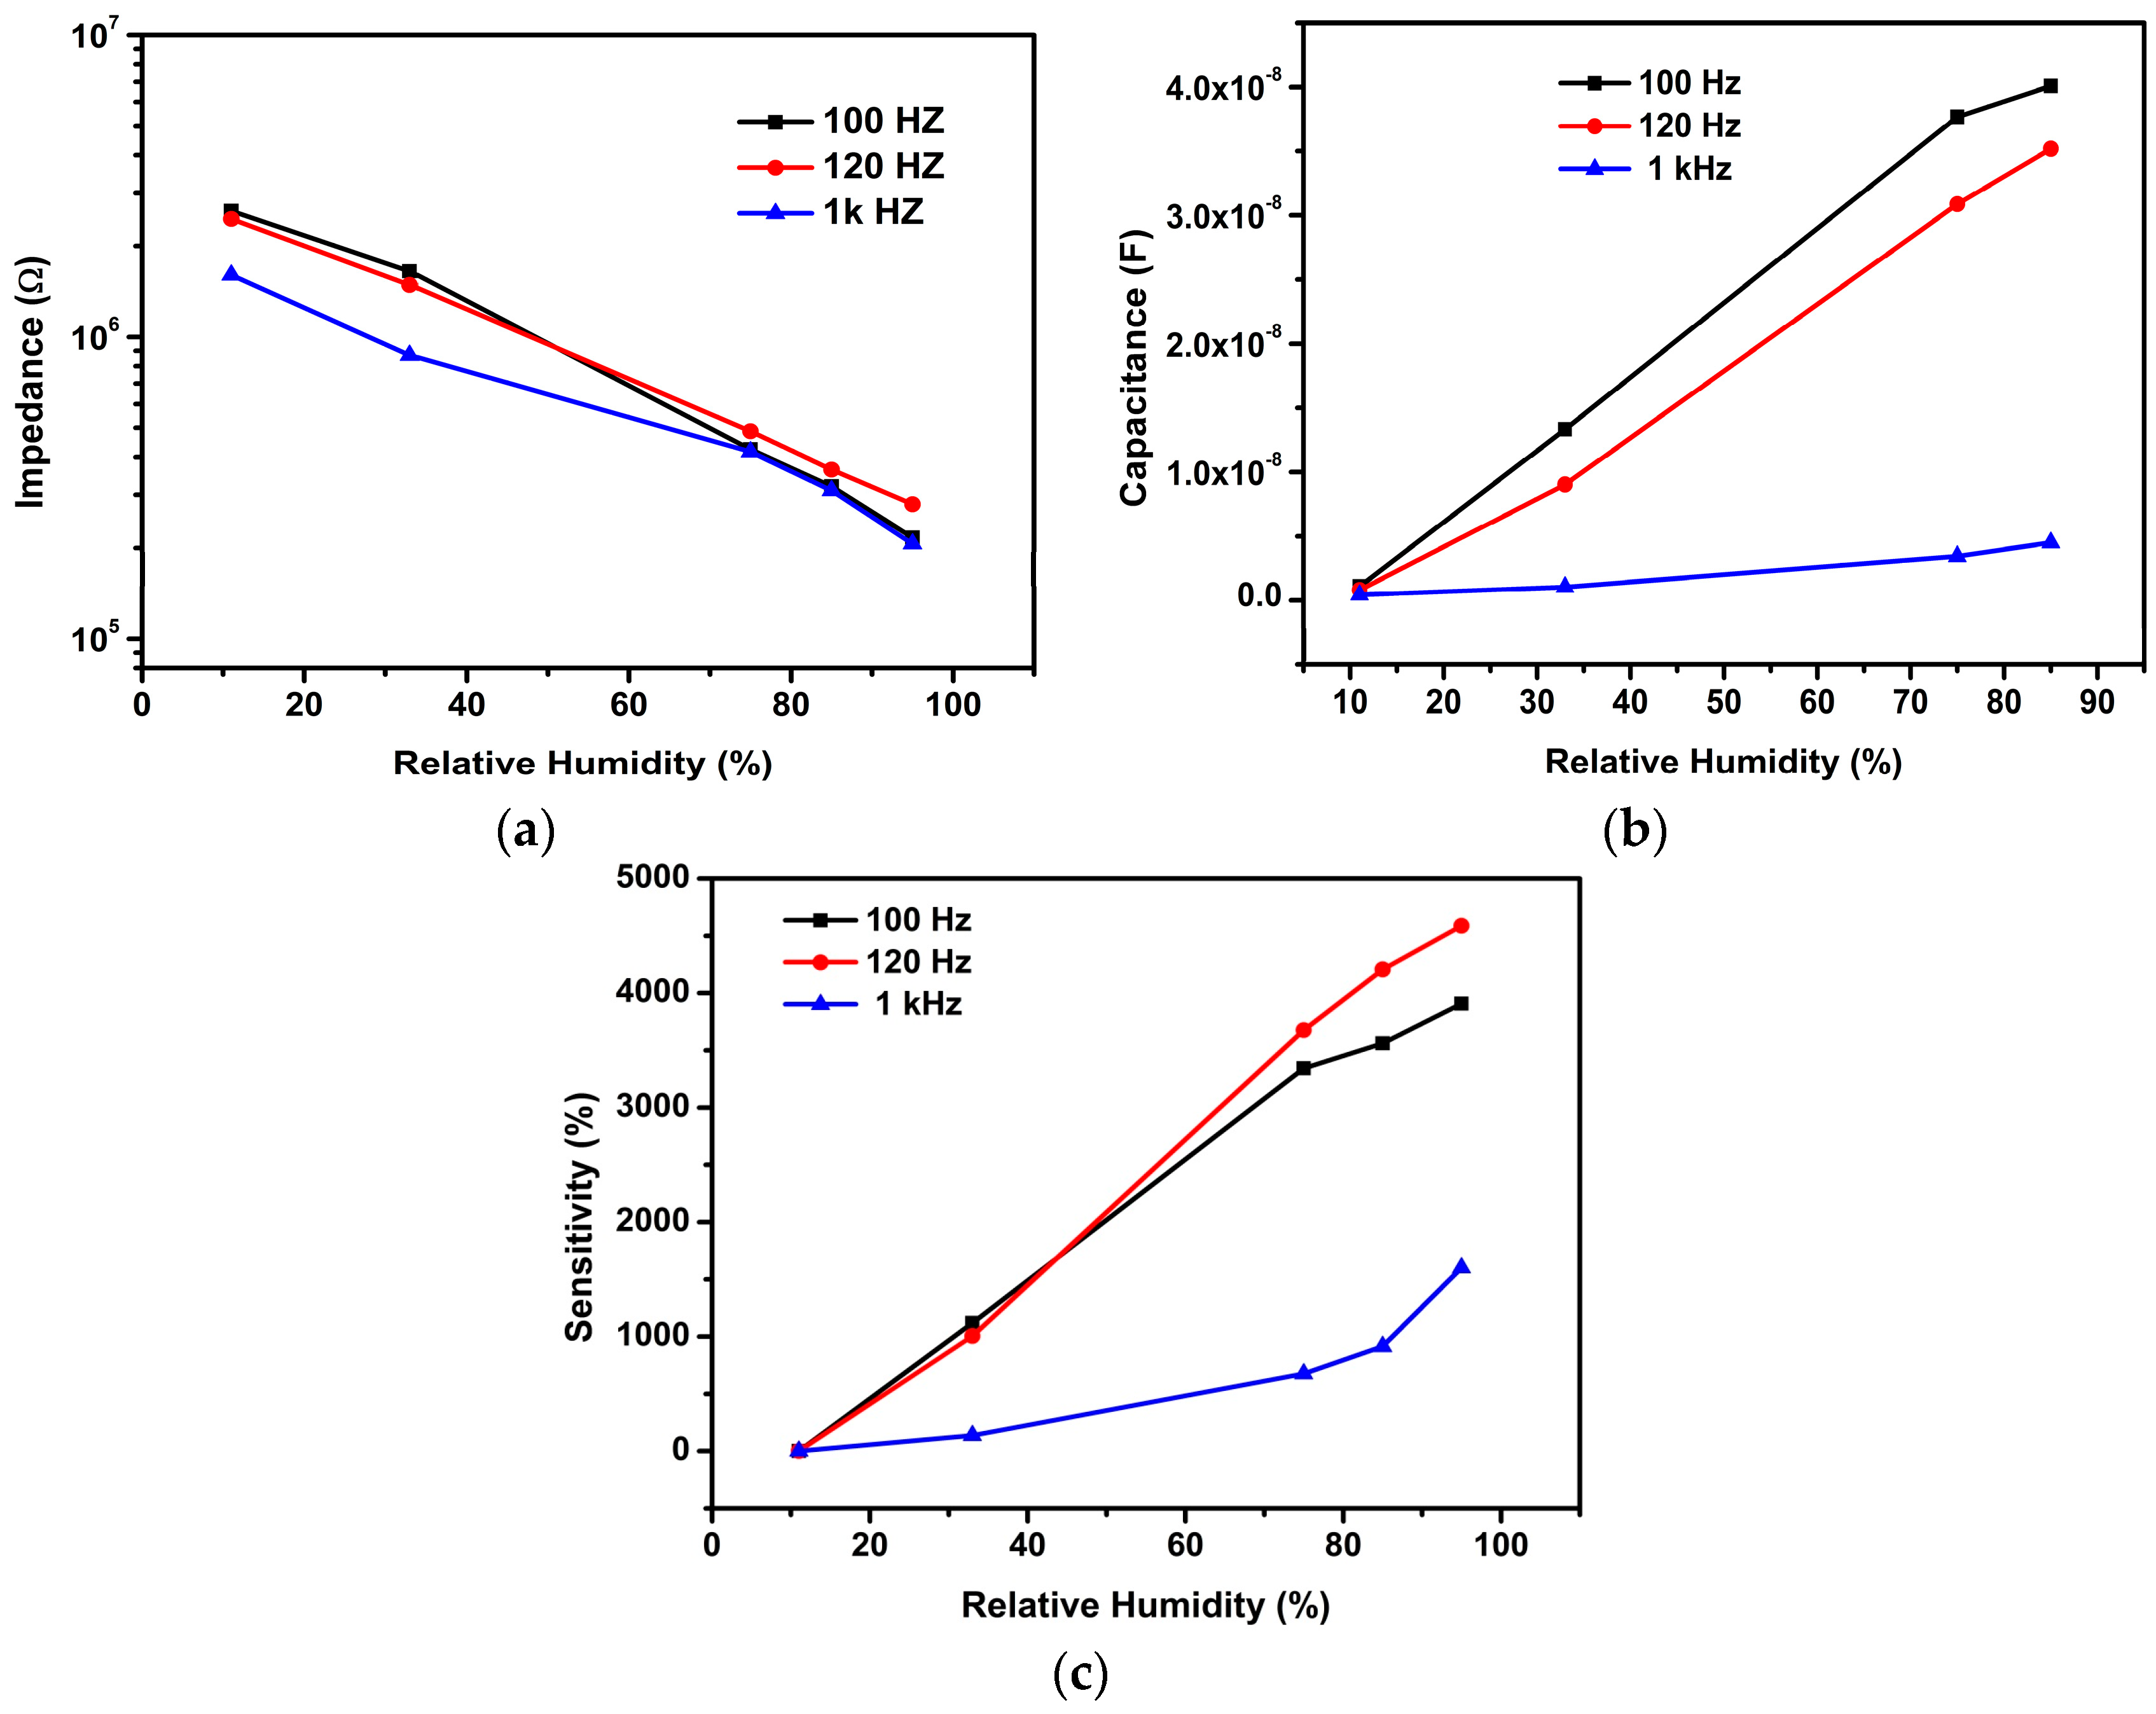
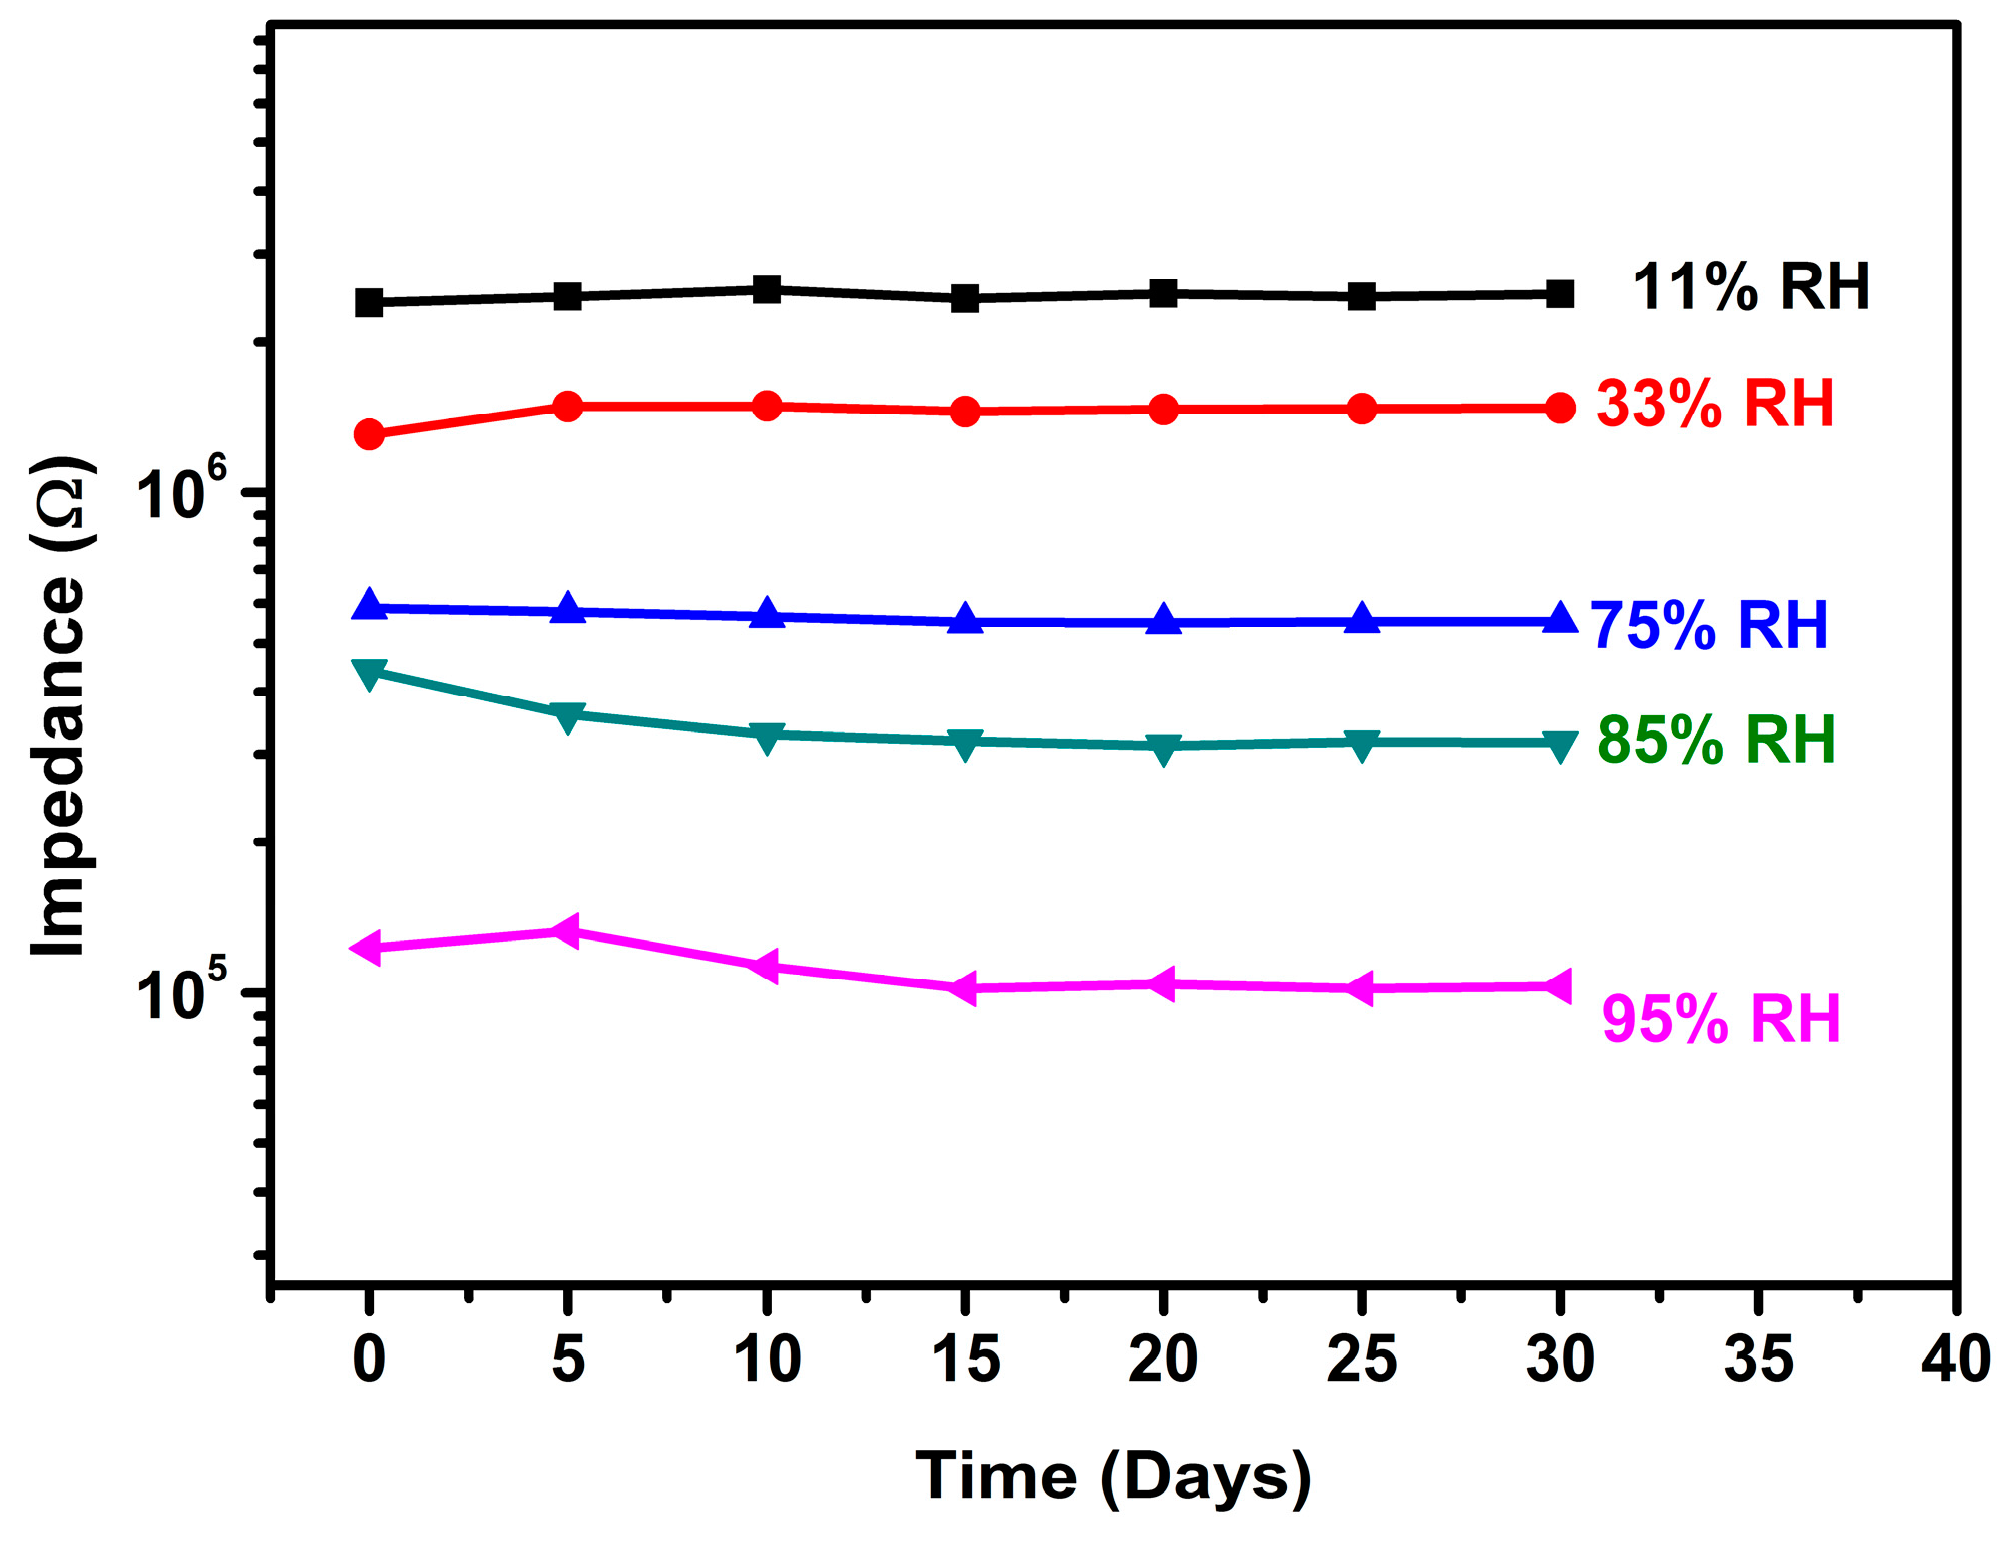
3.3. Humidity Sensing Properties of rGO-SnO2 Sensor

To determine the optimal working parameters, the impedance of the rGO-SnO2 sensor under different RH atmospheres and for different frequencies (100, 120, and 1 kHz) was measured at 20 °C, and the results are shown in Figure 6a. The impedance of the sensor under certain RH decreased with increasing working frequency. It is worth to noting that the impedance variation at low RH is much bigger than that observed at high RH. The sensing curves almost overlap for RH higher than 80%, indicating that the effect of frequencies on impedance was very small for this range. On the other hand, the impedance decreased with the increasing RH, due to the increase of absorbed water molecules onto the sensitive layer [28]. It can be seen that the impedance of the sensor strongly depends on the measuring frequency and the RH level. A large change is observable for the lower tested frequencies of 100 Hz and 120 Hz, while the change is inconspicuous for the higher tested frequency of 1 kHz as reported by other authors [29]. This is because the electrical field direction changes slowly at low frequencies and so polarization of the adsorbed water is strong. However, for the higher frequency ranges, the electrical field direction changes fast, and consequently water polarization cannot catch up with it: in consequence, the dielectric constant is small and does not change with RH [30,31]. The sensing curve at 120 Hz exhibits the best linearity, and at this frequency the sensor is very sensitive for the whole humidity range, with the impedance changing four orders of magnitude when RH varied from 11% to 95% RH. So the optimum measurement conditions were fixed for the remaining experiments: sinusoidal voltage with amplitude of 1 V, and a frequency of 120 Hz. Figure 6b shows the dependence of the sensor capacitance on RH at different frequencies (100 Hz, 120 Hz, and 1 kHz). The reported data are the mean values obtained from several measurement cycles at a temperature of 20 °C. As the RH level increases, the output capacitance of the sensor shifts higher monotonically as observed by other authors [32]. Adsorbed water can increase the dielectric constant and the capacitance. Furthermore, adsorbed water molecules strengthen the polarization and increase the dielectric constant [33]. The sensitivity of the sensors, in percentage, at different RHs was calculated using the following equation [34].
S = C R H C 11 C 11 × 100
where C11 and CRH stand for the capacitances measured at 11% RH and at a certain RH level, respectively. The calculated sensitivity of the sensor across the RH range of 11–95% was ~3900%, ~4600%, and ~1581% for the excitation signal frequencies of 100 Hz, 120 Hz, and 1 kHz respectively The sensitivity of our sensor at the frequency of 120 Hz is higher than that found for the frequencies of 100 Hz and 1 kHz [35]. Therefore, in the remainder of the study, the frequency of 120 Hz was considered the best test frequency for the analysis of sensor characteristics.

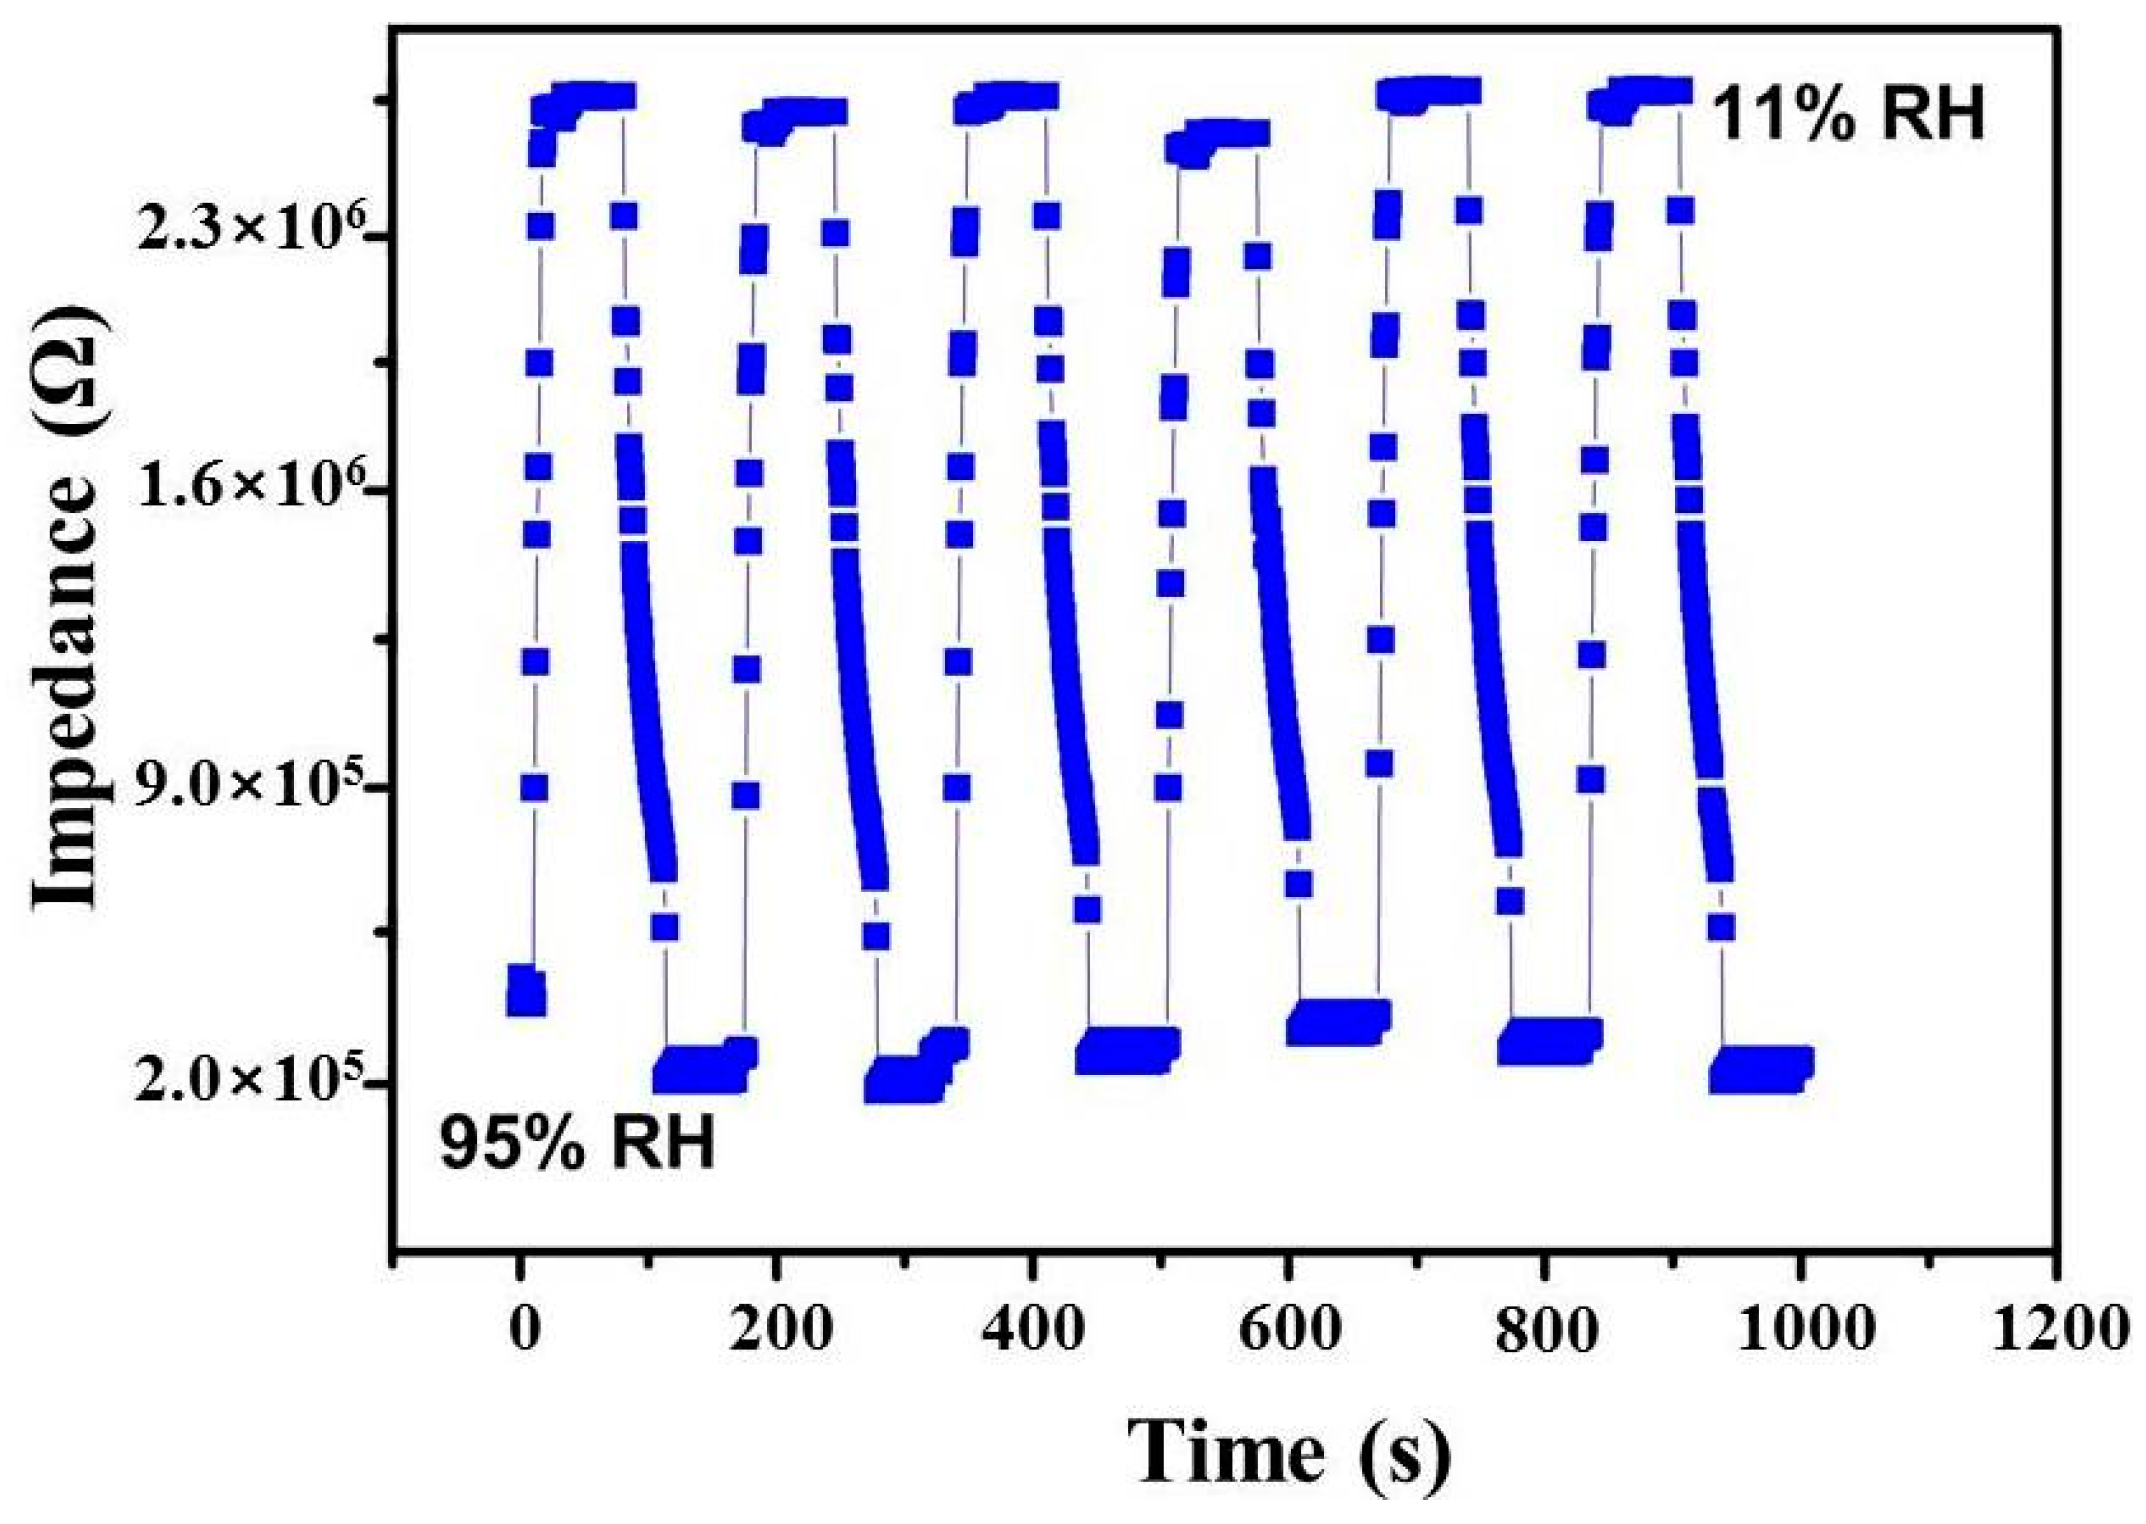
3.4. Humidity Sensors’ Response-Recovery Time

The response and recovery times are important parameters to estimate the effectiveness of humidity sensors. The measurement method was as follows. First, the sensor was put into a glass container at 11% RH for several minutes until the impedance of the sensor became steady. Then, the sensor was transferred into a glass vessel at 95% RH as quickly as possible (less than 2 s) in order to reduce the effect of the laboratory atmosphere. Finally, the sensor was moved back to the chamber containing 11% RH, once the sensor impedance stabilized at 95% RH [36].
The impedance modulus variation of the rGO-SnO2 sensor for four consecutive cycles of the above described process of water adsorption and desorption is shown in Figure 7. The observed response time is 10 s, while the recovery time is 60 s. The response and recovery properties are consistent with the low humidity hysteresis exhibited by the sensor [32,37]. Comparison of response and recovery times between the proposed sensor and other sensors reported in the literature is given in Table 1.
Li et al. [38] have studied the structure and humidity sensing properties of SnO2 zigzag belts and the calculated response and recovery times based on different RHs (5%, 22%, 43%, 69%, and 97%) were in the intervals 30–110 s and 80–150 s, respectively. Similarly, Qin Kuang et al. [39] have prepared a high-sensitivity humidity sensor based on a single SnO2 nanowire: the calculated response and recovery times, based on different RHs (5%, 30%, 48%, 76%, and 85%), were in the ranges 120–170 s and 20–60 s, respectively. Sin et al. [40] have prepared a humidity sensor based on a film of nanocubic ZnO:SnO2 with high sensitivity, by ultrasonic-assisted solution growth method with different Zn:Sn precursor ratios. The calculated response and recovery times were of 411 s and 98 s, respectively. Compared to the above values, the rGO-SnO2 nanoparticles have a better sensitivity factor and faster response and recovery times. The fast response of the sensor is also attributed to the large quantity of hydrophilic quaternary SnO2 groups in the rGO [47], which interact quickly with water molecules, while the rapid recovery speed is due not only to the separation of sensitive points in the framework, but also to the porosity, which is characteristic of rGO-SnO2 [48,49].
To test the long-term stability at high humidity, the rGO-SnO2 sensor was placed in the glass container with 95% RH and the impedance measurements were repeated every five days over a period of 30 days. As shown in Figure 8, a slight variation in impedance was observed with the passage of time, proving that the rGO-SnO2 sensor has good stability and durability at high humidity. This is highly probably due to the cross-linked porous framework of the rGO-SnO2 [50], which could effectively prevent the composites from dissolving in the adsorbed water and immobilize the functional molecules (rGO) in the pores.

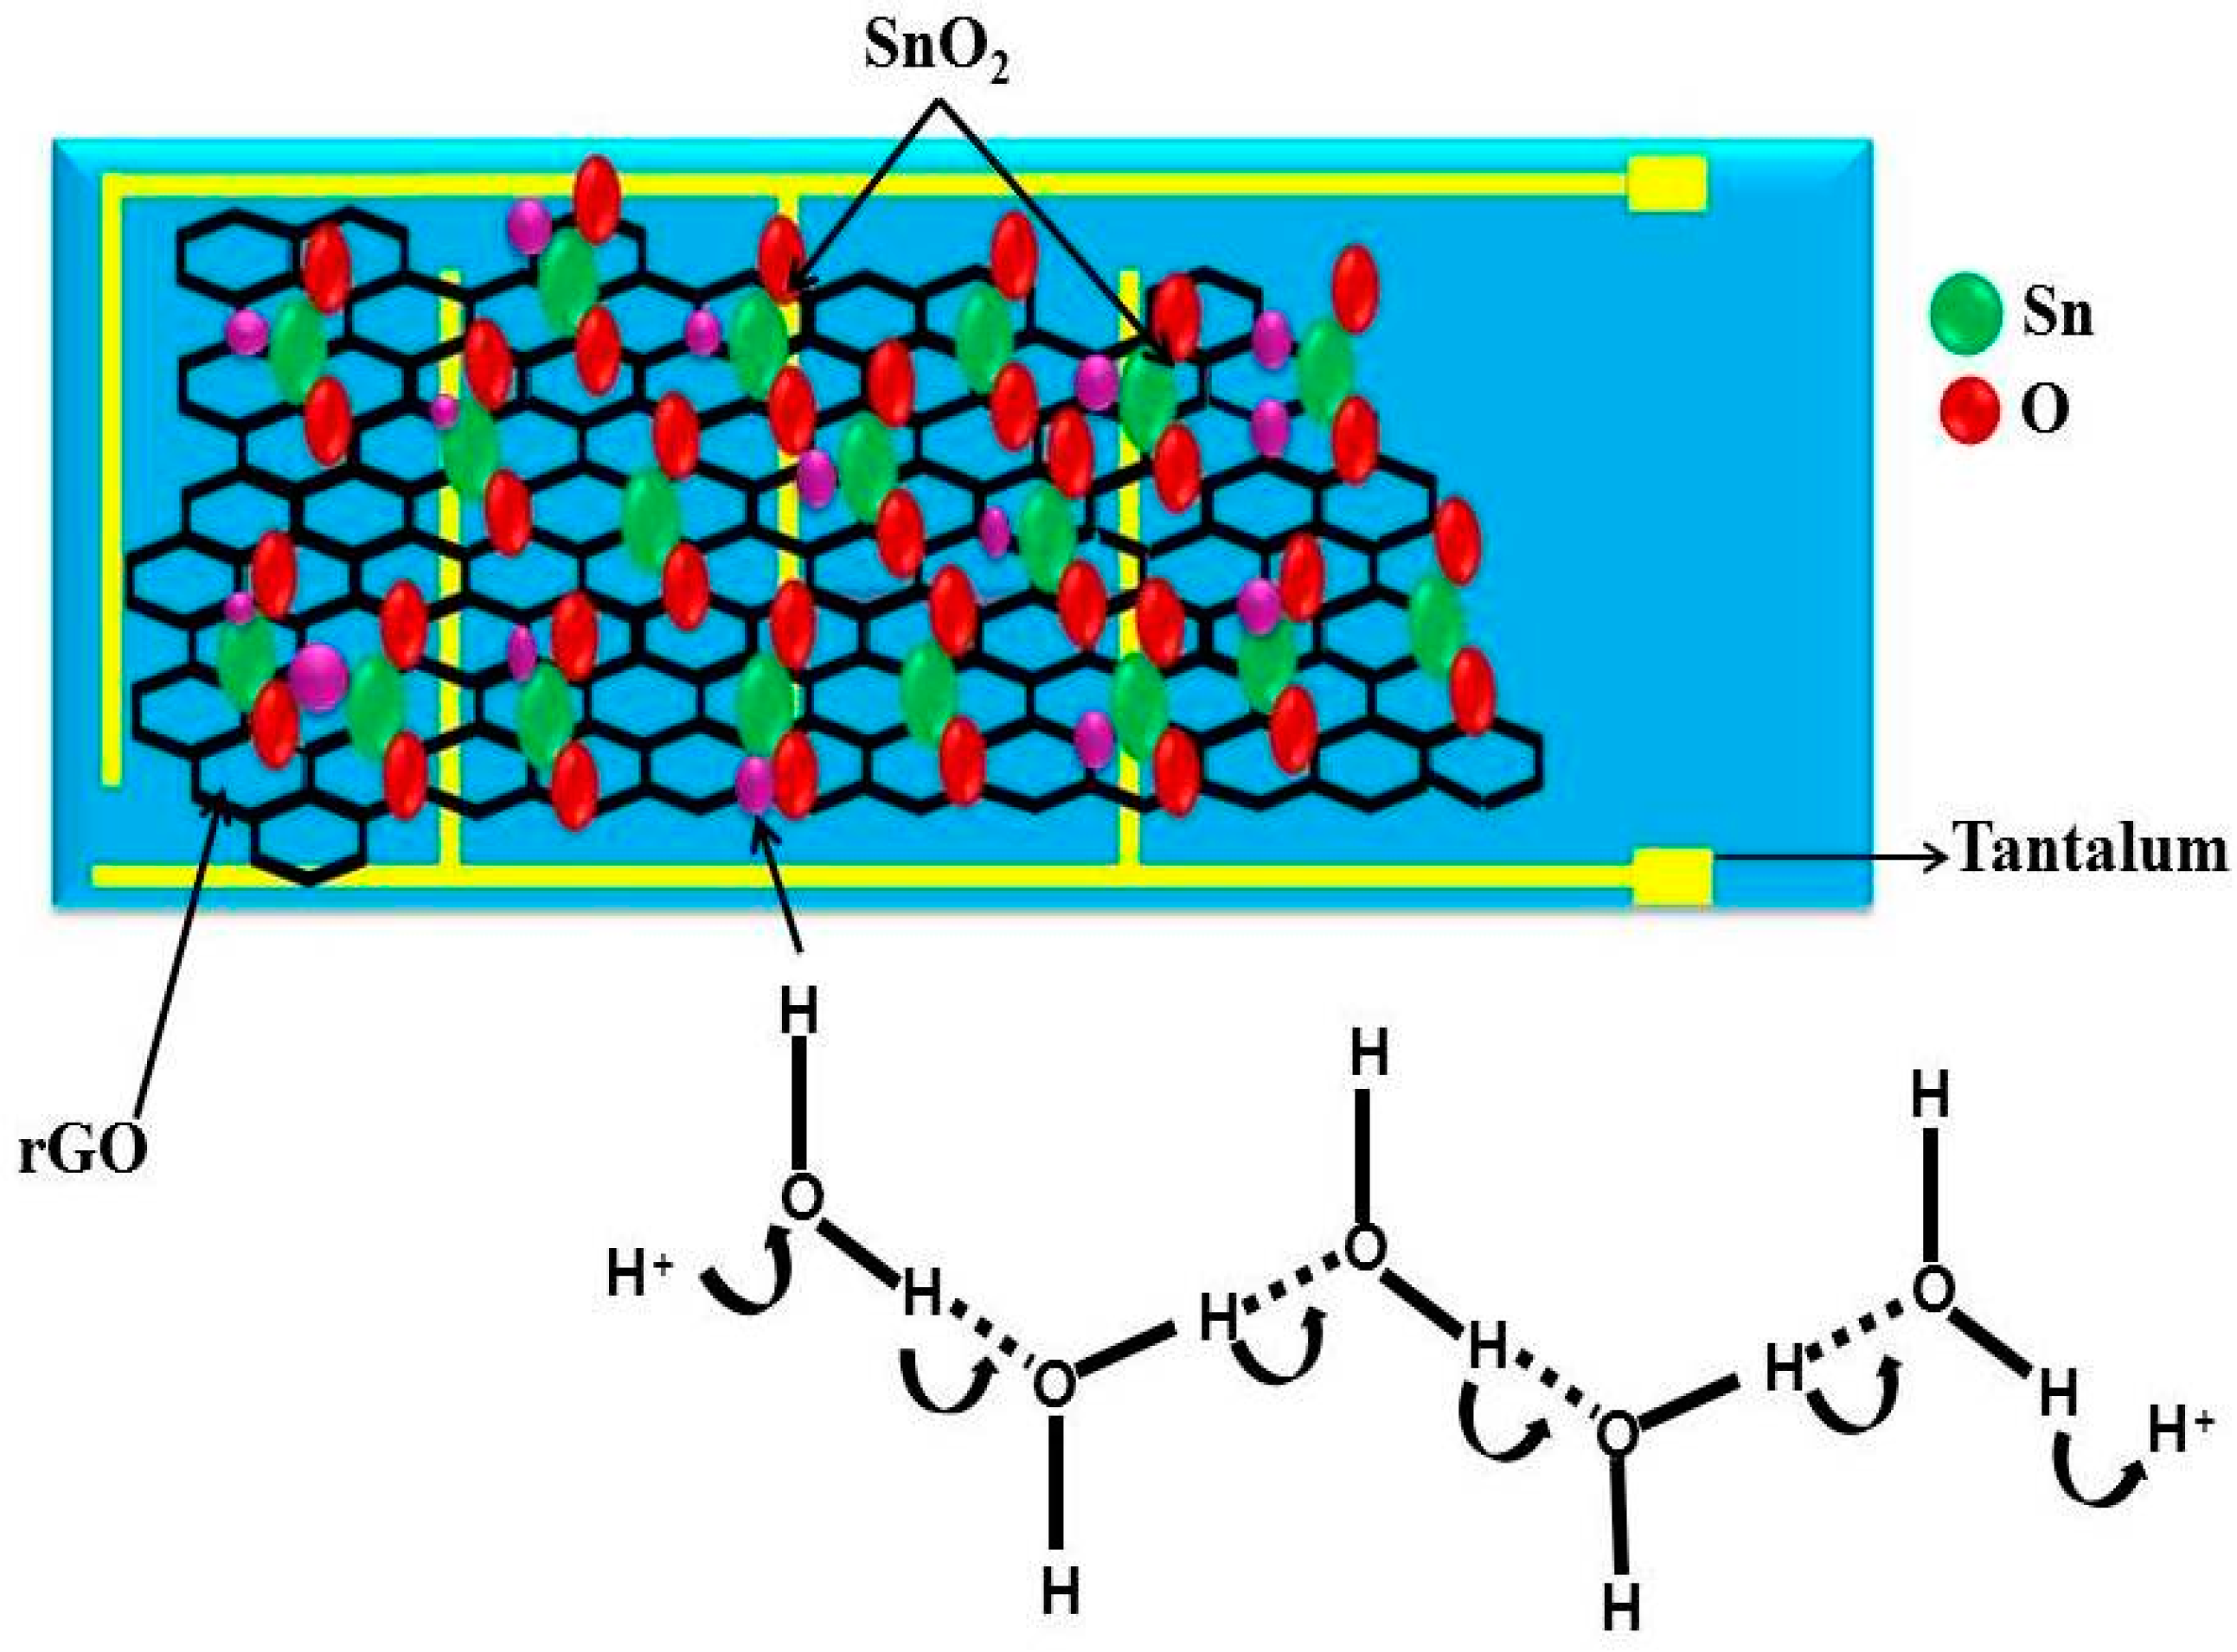
3.5. Sensing Mechanism of rGO-SnO2

The sensing mechanism is based on humidity adsorption and desorption process on the surface structure [51,52]. The sensing adsorption occurs in SnO2 by its conduction inside the water layers and is shown in Figure 9. When a water molecule comes in contact with the surface of the SnO2, hydroxyl ions combine with Sn. The ionized oxygen combined with proton form a surface layer on top of the SnO2 particles [53]. At this stage, water molecules get condensed and cannot move freely due to the two hydrogen bonding. The first physically adsorbed layer has a higher order than the upcoming adsorbed layer. Continuous condensing of water breaks the single hydrogen bonding; protons start to move freely [54]. SnO2 nanocrystals have an effective electronic interaction with rGO [55,56,57], hence the rGO-SnO2 facilitates the detection of water molecule. The rGO-SnO2 system can detect the water molecules that are normally undetectable by rGO, since the rGO-SnO2 system is potentially superior. rGO-SnO2 exhibits higher sensitivity than pure rGO, since SnO2 nanoparticles combined with rGO offer more active sites such as vacancies, defects, and oxygen functional groups, as does the sp2 bonded carbon regarding the adsorption of water molecules; also due to the high surface area and electrical conductivity. The observed microstructure of SnO2 and rGO-SnO2 is shown in Figure 10. SnO2 microstructure has a smooth surface (Figure 10a) and is more hydrophilic in nature [47]. This hydrophilic property of SnO2 always enhances the fast sensing response towards the water molecules, but decreases the recovery time. This is due to the condensed water molecules on the surface of SnO2 that cannot move freely due to the hydrogen bonding [54]. After the anchoring of SnO2 on the rGO sheet, it increases the surface roughness (Figure 10b). Hence, it decreases the physical adsorption between water molecules and the sensing material, which enhances the recovery time.

4. Conclusions

rGO-SnO2 nanocomposites were synthesized via redox reaction and used for humidity sensing application. The humidity sensor was fabricated using rGO-SnO2 on tantalum substrate to access the sensing platform. The sensitivity of the fabricated sensor was studied by varying the relative humidity (RH) from 11% to 95% over a period of 30 days. The impedance and capacitance variation on RH as well as the long-term stability of the sensor measured at 95% RH over a period of 30 days, proving that rGO-SnO2 nanocomposite exhibited high sensitivity, rapid response and recovery times, and good long-term stability.

Acknowledgments

This research was supported by Basic Science Research Program through the National Research Foundation (NRF) of Korea funded by the Ministry of Science, ICT and Future Planning (No. 2015R1A5A1037548).

Author Contributions

S.K. and R.N. conducted the experiments and wrote the initial draft of the manuscript. H.S.L. and V.S. designed the experiments. S.K. and H.S.L. analyzed the data and wrote the final manuscript. H.S.L., S.-J.K. and S.K. reviewed and contributed to the final revised manuscript. All authors contributed to the analysis of the data and read the final paper.

Conflicts of Interest

The authors declare no conflict of interest.

References

  1. Song, X.; Qi, Q.; Zhang, T.; Wang, C. A humidity sensor based on KCl-doped SnO2 nanofibers. Sens. Actuators B Chem. 2009, 138, 368–373. [Google Scholar] [CrossRef]
  2. Qi, Q.; Zhang, T.; Yu, Q.; Wang, R.; Zeng, Y.; Liu, L.; Yang, H. Properties of humidity sensing ZnO nanorods-base sensor fabricated by screen-printing. Sens. Actuators B Chem. 2008, 133, 638–643. [Google Scholar] [CrossRef]
  3. Buvailo, A.I.; Xing, Y.; Hines, J.; Dollahon, N.; Borguet, E. TiO2/LiCl-Based nanostructured thin film for humidity sensor applications. ACS Appl. Mater. Interfaces 2011, 3, 528–533. [Google Scholar] [CrossRef] [PubMed]
  4. Li, G.Y.; Ma, J.; Peng, G.; Chen, W.; Chu, Z.Y.; Li, Y.H.; Hu, T.J.; Li, X.D. Room-temperature humidity-sensing performance of SiC nano paper. ACS Appl. Mater. Interfaces 2014, 6, 22673–22679. [Google Scholar] [CrossRef] [PubMed]
  5. Qi, Q.; Zhang, T.; Zeng, Y.; Yang, H. Humidity sensing properties of KCl-doped Cu–Zn/CuO–ZnO nanoparticles. Sens. Actuators B Chem. 2009, 137, 21–26. [Google Scholar] [CrossRef]
  6. Su, P.G.; Huang, L.N. Humidity sensors based on TiO2 nanoparticles/polypyrrole composite thin films. Sens. Actuators B Chem. 2007, 123, 501–507. [Google Scholar] [CrossRef]
  7. Faia, P.M.; Emanuel, L.J.; Louro, C.S. TiO2:WO3 composite humidity sensors doped with ZnO and CuO investigated by impedance spectroscopy. Sens. Actuators B Chem. 2014, 203, 340–348. [Google Scholar] [CrossRef]
  8. Zainelabdin, A.; Amin, G.; Zaman, S.; Nur, O.; Lu, J.; Hultman, L.; Willander, M. CuO/ZnO nanocorals synthesis via hydrothermal technique: growth mechanism and their application as humidity sensor. J. Mater. Chem. 2012, 22, 11583–11590. [Google Scholar] [CrossRef]
  9. Parthibavarman, M.; Hariharan, V.; Sekar, C. High-sensitivity humidity sensor based on SnO2 nanoparticles synthesized by microwave irradiation method. Mater. Sci. Eng. 2011, 31, 840–844. [Google Scholar] [CrossRef]
  10. Fei, T.; Jiang, K.; Liu, S.; Zhang, T. Humidity sensor based on a cross-linked porous polymer with unexpectedly good properties. RSC Adv. 2014, 4, 21429–21434. [Google Scholar] [CrossRef]
  11. Yu, H.W.; Kim, H.K.; Kim, T.; Bae, K.M.; Seo, S.M.; Kim, J.M.; Kang, T.J.; Kim, Y.H. Self-Powered humidity sensor based on graphene oxide composite film intercalated by Poly(Sodium 4-Styrenesulfonate). ACS Appl. Mater. Interfaces 2014, 4, 8320–8326. [Google Scholar] [CrossRef] [PubMed]
  12. Chi, H.; Liu, Y.J.; Wang, F.; He, C. Highly sensitive and fast response colorimetric humidity sensors based on graphene oxides film. ACS Appl. Mater. Interfaces 2015, 7, 19882–19886. [Google Scholar] [CrossRef] [PubMed]
  13. Seema, H.; Kemp, K.C.; Chandra, V.; Kim, K.S. Graphene-SnO2 composites for highly efficient photocatalytic degradation of methylene blue under sunlight. Nanotechnology 2012, 23, 355705–355713. [Google Scholar] [CrossRef] [PubMed]
  14. Zhang, H.; Feng, J.; Fei, T.; Liu, S.; Zhang, T. SnO2 nanoparticles-reduced graphene oxide nanocomposites for NO2 sensing at low operating temperature. Sens. Actuators B Chem. 2014, 190, 472–478. [Google Scholar] [CrossRef]
  15. Masatsugu, M.; Yasutaka, O.; Sachiyo, S.; Morio, M. Effects of surface modification with platinum and ruthenium on temperature and humidity dependence of SnO2-based CO gas sensors. Sens. Actuators B Chem. 2000, 67, 84–188. [Google Scholar]
  16. Liu, L.L.; Xu, J.; Lu, X.; Munroe, P.; Xie, Z.H. Electrochemical corrosion behavior of nano crystalline β-Ta coating for biomedical applications. ACS Biomater. Sci. Eng. 2016, 2, 579–594. [Google Scholar] [CrossRef]
  17. Hummers, W.S.; Offeman, R.E. Preparation of graphitic oxide. J. Am. Chem. Soc. 1958, 80, 1339. [Google Scholar] [CrossRef]
  18. Kovtyukhova, N.I.; Ollivier, P.J.; Martin, B.R.; Mallouk, T.E.; Chizhik, S.A.; Buzaneva, E.V.; Gorchinskiy, A.D. Layer-by-layer assembly of ultrathin composite films from micron sized graphite oxide sheets and polycations. Chem. Mater. 1999, 11, 771–778. [Google Scholar] [CrossRef]
  19. Li, X.Z.; Liu, S.R.; Ying, G. Polyaniline-intercalated layered double hydroxides: synthesis and properties for humidity sensing. RSC Adv. 2016, 6, 63099–63106. [Google Scholar] [CrossRef]
  20. Li, F.H.; Song, J.F.; Yang, H.F.; Gan, S.Y.; Zhang, Q.X.; Han, D.X.; Ivaska, A.; Niu, L. One-step synthesis of graphene/SnO2 nanocomposites and its application in electrochemical supercapacitors. Nanotechnology 2009, 20, 455602–455607. [Google Scholar] [CrossRef] [PubMed]
  21. Dubin, S.; Gilje, S.; Wang, K.; Tung, V.C.; Cha, K.; Hall, A.S.; Farrar, J.; Varshneya, R.; Yang, Y.; Kaner, R.B. A one-step, solvothermal reduction method for producing reduced graphene oxide dispersions in organic solvents. ACS Nano 2010, 4, 3845–3852. [Google Scholar] [CrossRef] [PubMed]
  22. Paek, S.M.; Yoo, E.; Honma, I. Enhanced cyclic performance and lithium storage capacity of SnO2/graphene nano porous electrodes with three-dimensionally delaminated flexible structure. Nano Lett. 2009, 9, 72–75. [Google Scholar] [CrossRef] [PubMed]
  23. Kar, A.; Sain, S.; Rossouw, D.; Knappett, B.R.; Pradhanb, S.K.; Wheatley, A.E.H. Facile synthesis of SnO2-PbS nanocomposites with controlled structure for applications in photocatalysis. Nanoscale 2016, 8, 2727–2739. [Google Scholar] [CrossRef] [PubMed]
  24. Lee, B.; Han, S.C.; Oh, M.; Lah, M.S.; Sohn, K.S.; Pyo, M. Tin dioxide nanoparticles impregnated in graphite oxide for improved lithium storage and cyclability in secondary ion batteries. Electrochim. Acta 2013, 113, 149–155. [Google Scholar] [CrossRef]
  25. Du, F.; Yang, B.; Zuo, X.; Li, G. Dye-sensitized solar cells based on low-cost nanoscale SnO2@RGO composite counter electrode. Mater. Lett. 2015, 158, 424–427. [Google Scholar] [CrossRef]
  26. Hu, C.; Chen, F.; Lu, T.; Lian, C.; Zheng, S.; Zhang, R. Aqueous production of TiO2-graphene nanocomposites by a combination of electrostatic attraction and hydrothermal process. Mater. Lett. 2014, 121, 209–211. [Google Scholar] [CrossRef]
  27. Prabakar, S.J.R.; Hwang, Y.H.; Bae, E.G.; Shim, S.; Kim, D.; Lah, M.S.; Sohn, K.S.; Pyo, M. SnO2/graphene composites with self-assembled alternating oxide and amine layers for high Li-storage and excellent stability. Adv. Mater. 2013, 25, 3307–3312. [Google Scholar] [CrossRef] [PubMed]
  28. Kuse, T.; Takahashi, S. Transitional behavior of tin oxide semiconductor under a step-like humidity change. Sens. Actuators B Chem. 2000, 67, 36–42. [Google Scholar] [CrossRef]
  29. Tripathy, A.; Pramanik, S.; Cho, J.; Santhosh, J.; Abu Osman, N.A. Role of morphological structure doping and coating of different materials in the sensing characteristics of humidity sensors. Sensors 2014, 14, 16343–16422. [Google Scholar] [CrossRef] [PubMed]
  30. Bondarenka, V.; Grebinskij, S.; Mickevcius, S.; Volkov, V.; Zacharova, G. Thin films of poly-vanadium-molybdenum acid as starting materials for humidity sensors. Sens. Actuators B Chem. 1995, 28, 227–231. [Google Scholar] [CrossRef]
  31. Feng, Y.; Wang, S.; Feng, B.; Wang, R.; He, Y.; Zhang, T. Development of an auto test system for humidity sensors. Sens. Actuators A Phys. 2009, 152, 104–109. [Google Scholar] [CrossRef]
  32. Bi, H.; Yin, K.; Xie, X.; Wan, S.; Ji, J.; Sun, L.; Terrones, M.; Dresselhaus, M.S. Ultrahigh humidity sensitivity of graphene oxide. Sci. Rep. 2013, 3, 2714. [Google Scholar] [CrossRef] [PubMed]
  33. Cheng, B.H.; Tian, B.X.; Xie, C.C.; Xiao, Y.H.; Lei, S.J. Highly sensitive humidity sensor based on amorphous Al2O3 nanotubes. J. Mater. Chem. 2011, 21, 1907–1912. [Google Scholar] [CrossRef]
  34. Wang, W.C.; Tian, Y.T.; Li, K.; Lu, E.Y.; Gong, D.S.; Li, X.J. Capacitive humidity-sensing properties of Zn2SiO4 film grown on silicon nano porous pillar array. Appl. Surface Sci. 2013, 273, 372–376. [Google Scholar] [CrossRef]
  35. Tripathy, A.; Pramanik, S.; Manna, A.; Bhuyan, S.; Azrin Shah, N.F.; Azuan Abu Osman, Z.R.N. Design and development for capacitive humidity sensor applications of Lead-Free Ca,Mg,Fe,Ti-Oxides-based electro-ceramics with improved sensing properties via physisorption. Sensors 2016, 16, 1135. [Google Scholar] [CrossRef] [PubMed]
  36. Zhang, Z.; Huang, J.; Yuan, Q.; Dong, B. Intercalated graphitic carbon nitride: A fascinating two-dimensional nanomaterial for an ultrasensitive humidity nano sensor. Nanoscale 2014, 6, 9250–9256. [Google Scholar] [CrossRef] [PubMed]
  37. Chu, J.; Peng, X.; Feng, P.; Sheng, Y.; Zhang, J. Study of humidity sensors based on nanostructured carbon films produced by physical vapor deposition. Sens. Actuators B Chem. 2013, 178, 508–513. [Google Scholar] [CrossRef]
  38. Li, L.; Yu, K.; Wu, J.; Wang, Y.; Zhu, Z. Structure and humidity sensing properties of SnO2 zigzag belts. Cryst. Res. Technol. 2010, 45, 539–544. [Google Scholar] [CrossRef]
  39. Kuang, Q.; Lao, C.; Wang, Z.L.; Xie, Z.; Zheng, L. High-sensitivity humidity sensor based on a single SnO2 nanowire. J. Am. Chem. Soc. 2007, 129, 6070–6071. [Google Scholar] [CrossRef] [PubMed]
  40. Md Sin, N.D.; Mamat, M.H.; Malek, M.F.; Rusop, M. Fabrication of nano cubic ZnO/SnO2 film-based humidity sensor with high sensitivity by ultrasonic-assisted solution growth method at different Zn:Sn precursor ratios. Appl. Nanosci. 2014, 4, 829–838. [Google Scholar] [CrossRef]
  41. Zhang, Y.; Yu, K.; Jiang, D.; Zhu, Z.; Geng, H.; Luo, L. Zinc oxide nanorod and nanowire for humidity sensor. Appl. Surf. Sci. 2005, 242, 212–217. [Google Scholar] [CrossRef]
  42. Chen, W.P.; Zhao, Z.G.; Liu, X.W.; Zhang, Z.X.; Suo, C.G. A Capacitive Humidity Sensor Based on Multi-Wall Carbon Nanotubes (MWCNTs). Sensors 2009, 9, 7431–7444. [Google Scholar] [CrossRef] [PubMed]
  43. Chen, X.; Zhang, J.; Wang, Z.; Yan, Q.; Hui, S. Humidity sensing behavior of silicon nanowires with hexamethyldisilazane modification. Sen. Actuators B Chem. 2011, 156, 631–636. [Google Scholar] [CrossRef]
  44. Wang, Y.; Park, S.; Yeow, J.T.W.; Langner, A.; Müller, F. A capacitive humidity sensor based on ordered macro porous silicon with thin film surface coating. Sens. Actuators B Chem. 2010, 49, 136–142. [Google Scholar] [CrossRef]
  45. Wang, Z.; Shi, L.; Wu, F.; Yuan, S.; Zhao, Y.; Zhang, M. The sol-gel template synthesis of porous TiO2 for a high performance humidity sensor. Nanotechnology 2011, 22, 275502–275511. [Google Scholar] [CrossRef] [PubMed]
  46. Sun, A.; Li, Z.; Wei, T.; Li, Y.; Cui, P. Highly sensitive humidity sensor at low humidity based on the quaternized polypyrrole composite film. Sens. Actuators B Chem. 2009, 142, 197–203. [Google Scholar] [CrossRef]
  47. Henrich, V.A.; Cox, P.A. The Surface Science of Metal Oxides; Cambridge University Press: Cambridge, UK, 1994; p. 312. [Google Scholar]
  48. Cosentino, I.C.; Muccillo, E.N.S.; Muccillo, R. The Influence of Fe2O3 in the humidity sensor performance of ZrO2:TiO2-based porous ceramics. Mater. Chem. Phys. 2007, 103, 407–414. [Google Scholar] [CrossRef]
  49. Singh, R.; Yadav, A.K.; Gautam, C. Synthesis and humidity sensing investigations of nanostructured ZnSnO3. J. Sens. Technol. 2011, 1, 116–124. [Google Scholar] [CrossRef]
  50. Kang, D.; Liu, Q.; Chen, M.; Gu, J.; Zhang, D. Spontaneous cross-linking for fabrication of nano hybrids embedded with size-controllable particles. ACS Nano 2016, 10, 889–898. [Google Scholar] [CrossRef] [PubMed]
  51. Md Sin, N.D.; Mamat, M.H.; Musa, M.Z.; Abdul Aziz, A.; Rusop, M. Effect of growth duration to the electrical properties of Zn doped SnO2 thin film toward humidity sensor application. In Proceedings of the 2012 IEEE Business, Engineering & Industrial Applications Colloquium (BEIAC), Kuala Lumpur, Malaysia, 7–8 April 2012.
  52. Xu, L.; Wang, R.; Xiao, Q.; Zhang, D.; Liu, Y. Micro humidity sensor with high sensitivity and quick response/recovery based on ZnO/TiO2 composite nanofibers. Chin. Phys. Lett. 2011, 28, 070702. [Google Scholar] [CrossRef]
  53. Farahani, H.; Wagiran, R.; Hamidon, M.N. Humidity sensors principle, mechanism and fabrication technologies: A comprehensive review. Sensors 2014, 14, 7881–7939. [Google Scholar] [CrossRef] [PubMed]
  54. Chen, Z.; Lu, C. Humidity sensors: A review of materials and mechanisms. Sens. Lett. 2005, 3, 274–295. [Google Scholar] [CrossRef]
  55. Zhang, D.; Sun, Y.; Li, P.; Zhang, Y. Facile fabrication of MoS2-modified SnO2 hybrid nanocomposite for ultrasensitive humidity sensing. ACS Appl. Mater. Interfaces 2016, 8, 14142–14149. [Google Scholar] [CrossRef] [PubMed]
  56. Lin, Q.; Li, Y.; Yang, M. Tin oxide/graphene composite fabricated via a hydrothermal method for gas sensors working at room temperature. Sens. Actuators B Chem. 2012, 173, 139–147. [Google Scholar] [CrossRef]
  57. Tammanoon, N.; Wisitsoraat, A.; Sriprachuabwong, C.; Phokharatkul, D.; Tuantranont, A.; Phanichphant, S.; Liewhiran, C. Ultrasensitive NO2 sensor based on ohmic metal-semiconductor interfaces of electrolytically exfoliated graphene/flame-spray-made SnO2 nanoparticles composite operating at low temperatures. ACS Appl. Mater. Interfaces 2015, 7, 24338–24352. [Google Scholar] [CrossRef] [PubMed]
Figure 1. Schematic diagram of (a) the Humidity sensor; (b) the Measurement system.
Sensors 16 02079 g001
Figure 2. FTIR spectra for (a) GO; (b) SnO2; (c) rGO-SnO2.
Sensors 16 02079 g002
Figure 3. XRD pattern for (a) GO; (b) SnO2; (c) rGO-SnO2.
Sensors 16 02079 g003
Figure 4. Raman spectra for (a) GO; (b) SnO2; (c) rGO-SnO2.
Sensors 16 02079 g004
Figure 5. TEM image for (a) GO; (b) SnO2; (c) rGO-SnO2.
Sensors 16 02079 g005
Figure 6. (a) The dependence of impedance on the RH for the rGO-SnO2 sensor measured at various frequencies; (b) The dependence of capacitance on the RH for the rGO-SnO2 sensor measured at various frequencies; (c) The sensitivity of the rGO-SnO2 sensor for different tested RH and frequencies.
Sensors 16 02079 g006
Figure 7. Response and recovery curves of the rGO-SnO2 sensor.
Sensors 16 02079 g007
Figure 8. The long-term stability of the rGO-SnO2 sensor after being exposed to 95% RH for 30 days.
Sensors 16 02079 g008
Figure 9. The schematic of the proposed humidity sensing mechanism of the rGO-SnO2 nanocomposite.
Sensors 16 02079 g009
Figure 10. SEM microstructure image for (a) SnO2; (b) rGO-SnO2.
Sensors 16 02079 g010
Table 1. Comparison of the proposed sensor with other reported sensors in the literature.
ReferenceElectrodeSubstrateSensing MaterialSensor Response Time (s)Sensor Recovery Time (s)
Bi et al. [32]Gold (Au)SiO2Graphene oxide10.541
Li et al. [38]Sliver (Ag)SiO2SnO230–11080–150
Kuang et al. [39]Platinum (Pt)SiO2SnO2120–17020–60
Sin et al. [40]Gold (Au)SiO2ZnO/SnO241198
Zhang et al. [41]Platinum (Pt)SiO2ZnO1030
Chen [42]Copper (Cu)SiO2MWCNTs4515
Chen et al. [43]Silver (Ag)SiSiNWs35052
Chen et al. [43]Silver (Ag)SiHMDS modified SiNWs13262
Wang et al. [44]Porous SiliconSiTa2O51840
Wang et al. [45]Silver (Ag)CeramicTiO2510
Sun et al. [46]Gold electrodeAluminumPolypyrrole41120
Proposed differentiateTantalum electrodeEpoxyrGO-SnO21060

