
Real-Time Analysis of Isoprene in Breath by Using Ultraviolet-Absorption Spectroscopy with a Hollow Optical Fiber Gas Cell


Abstract
:1. Introduction
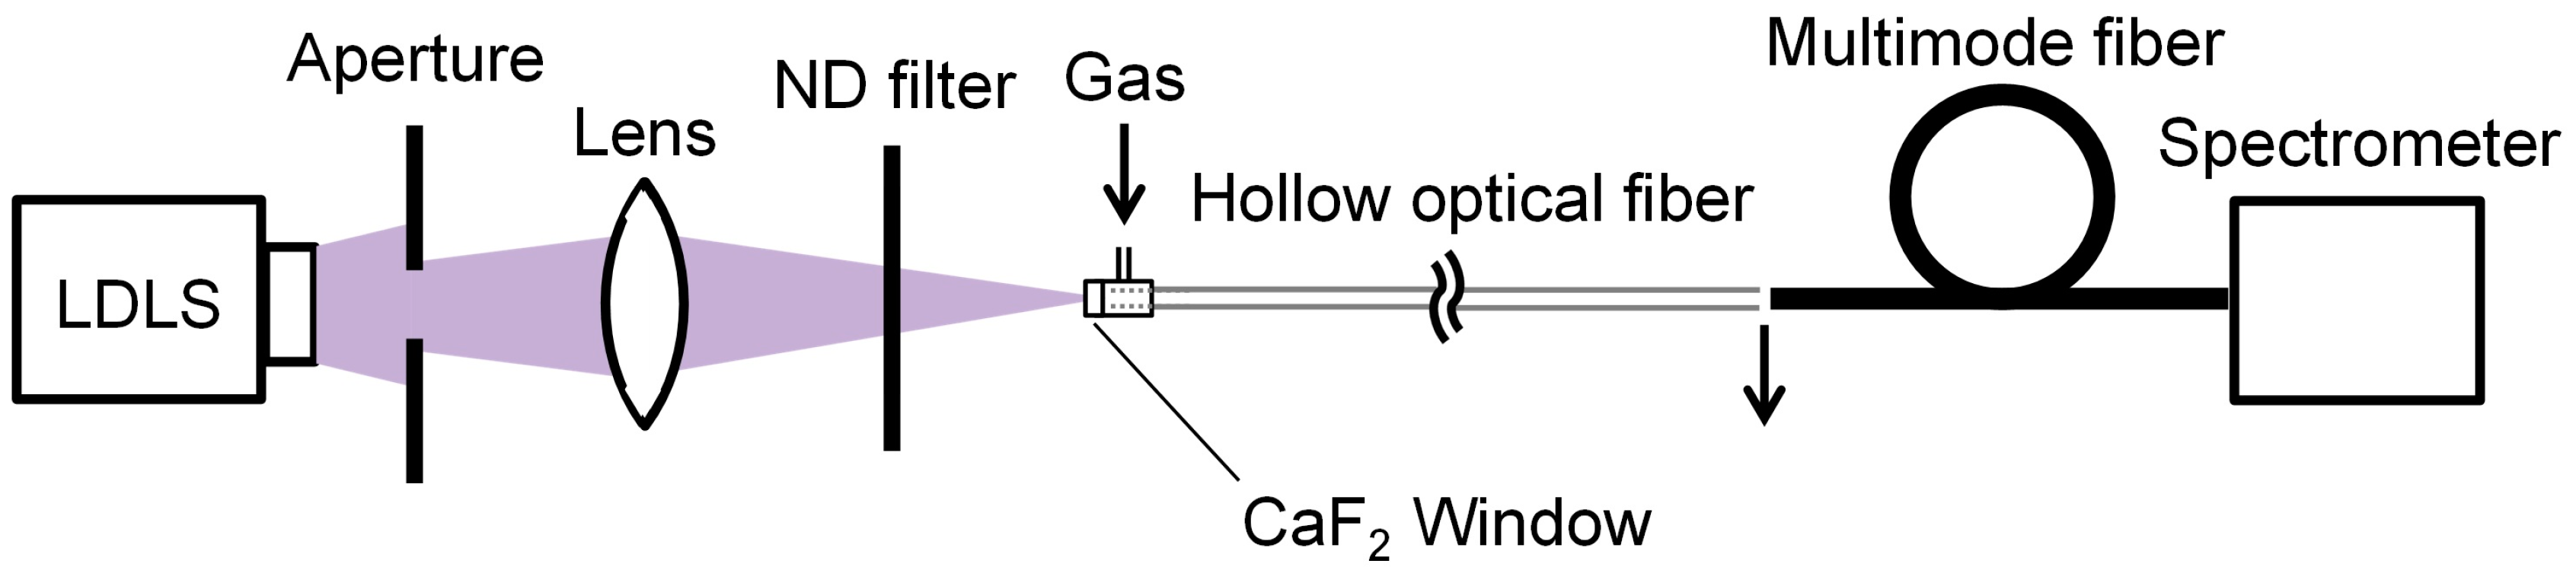
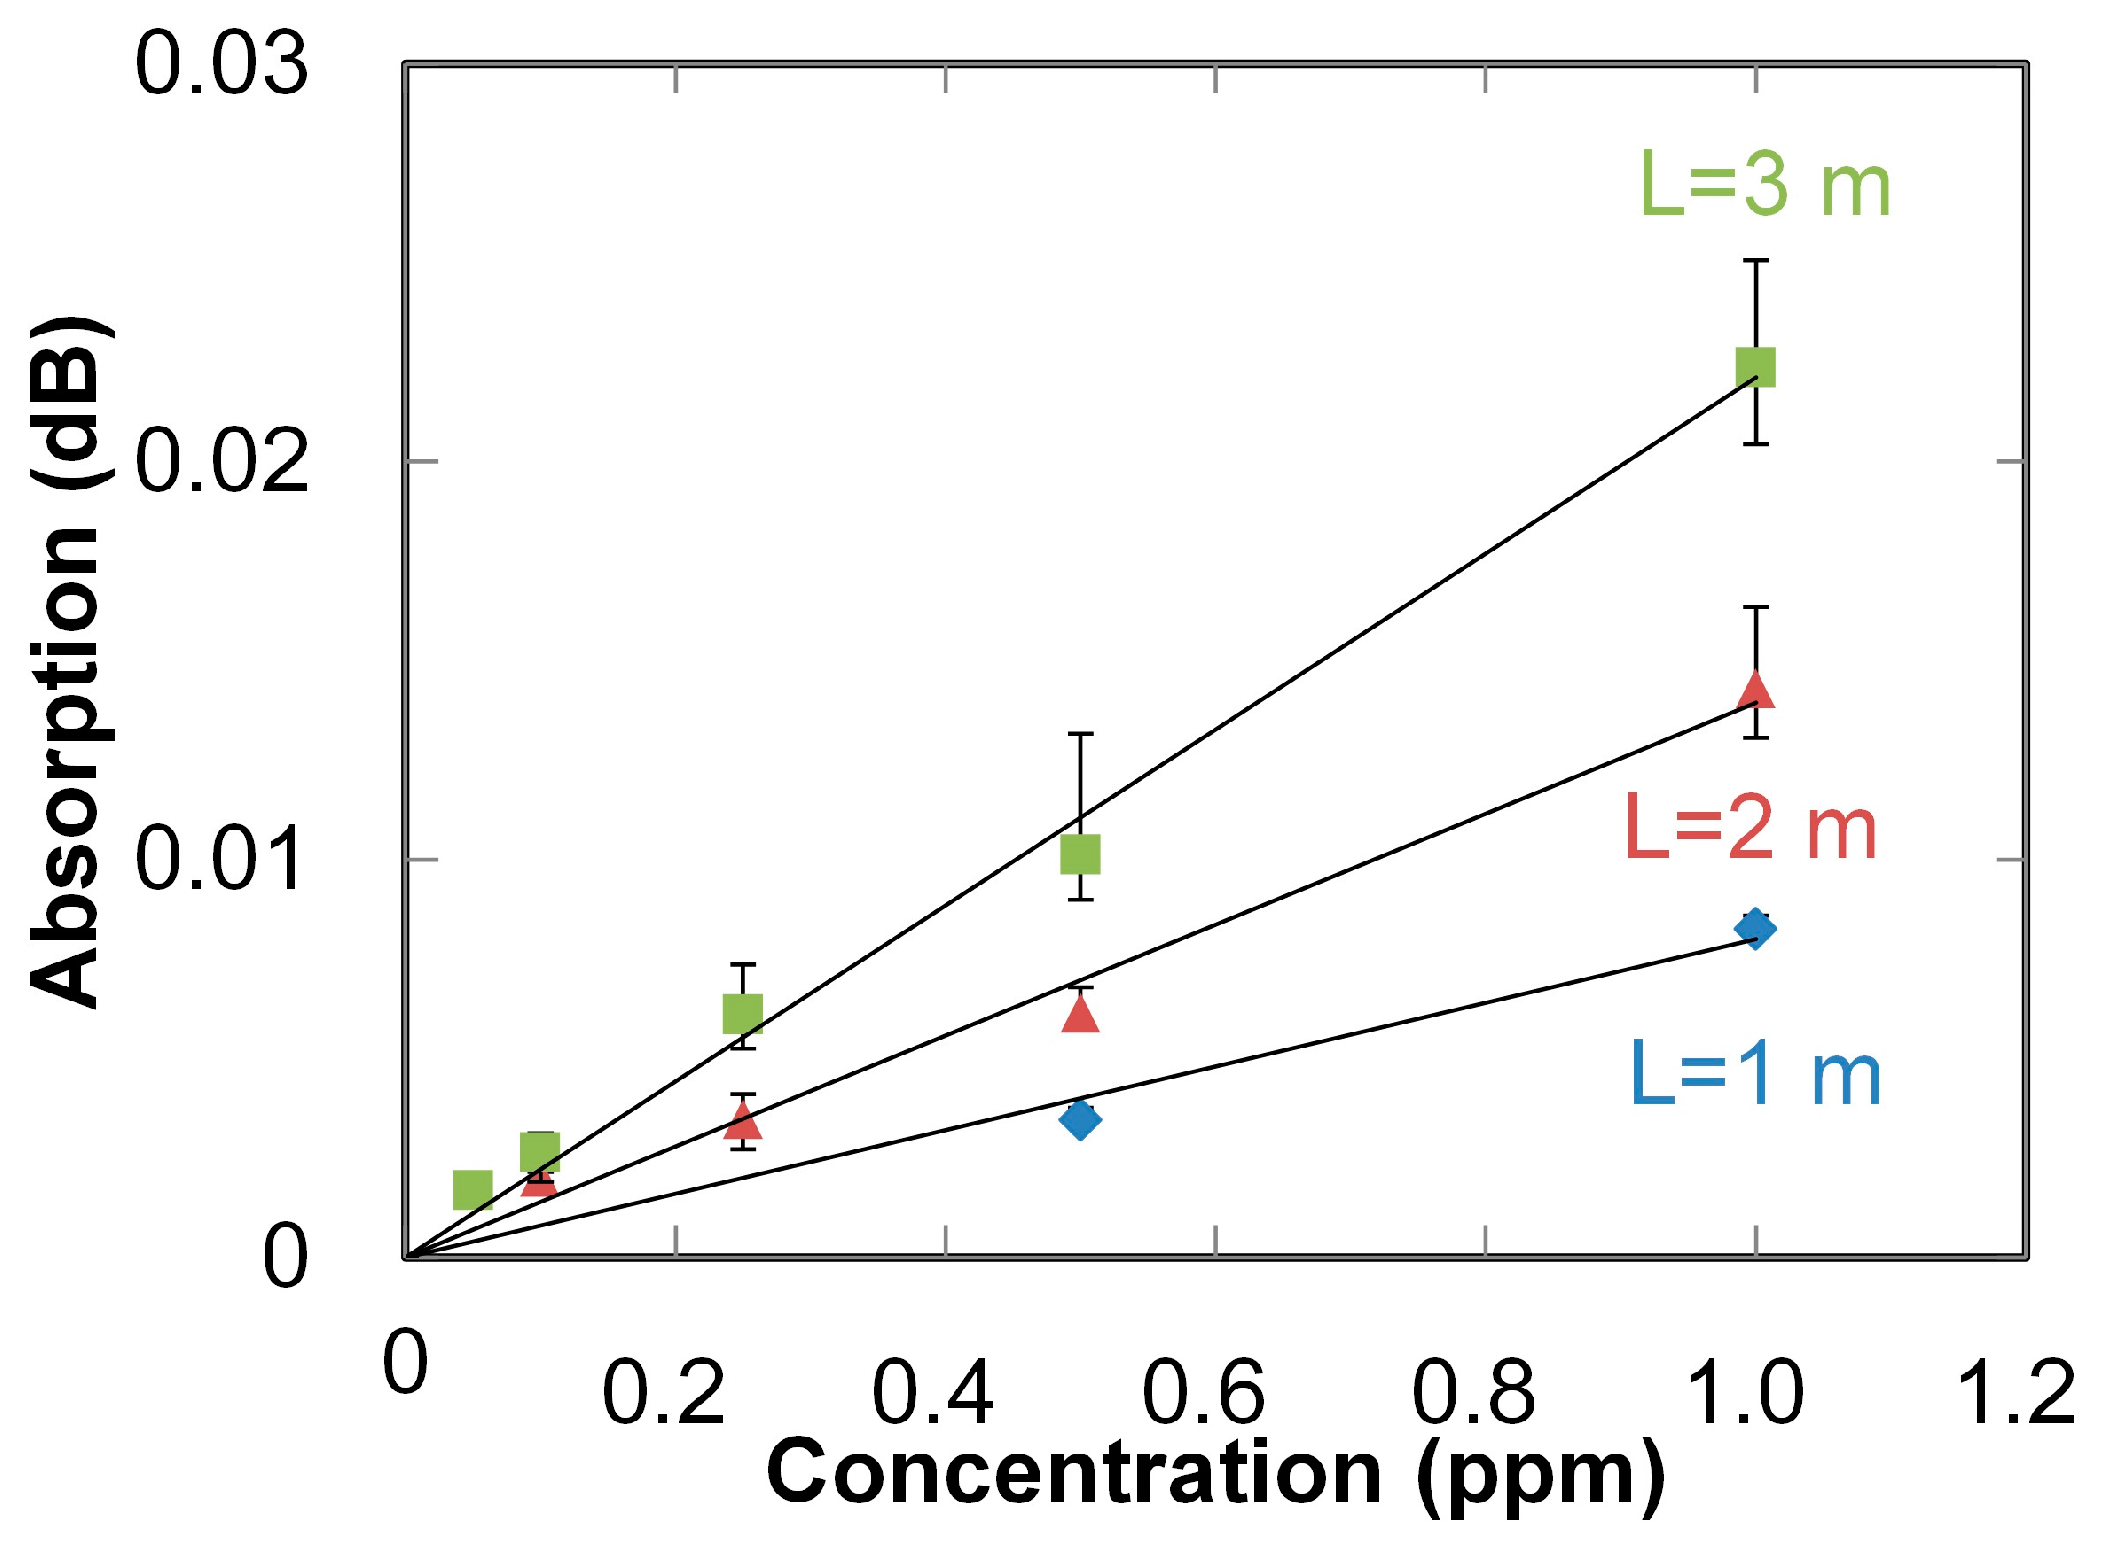
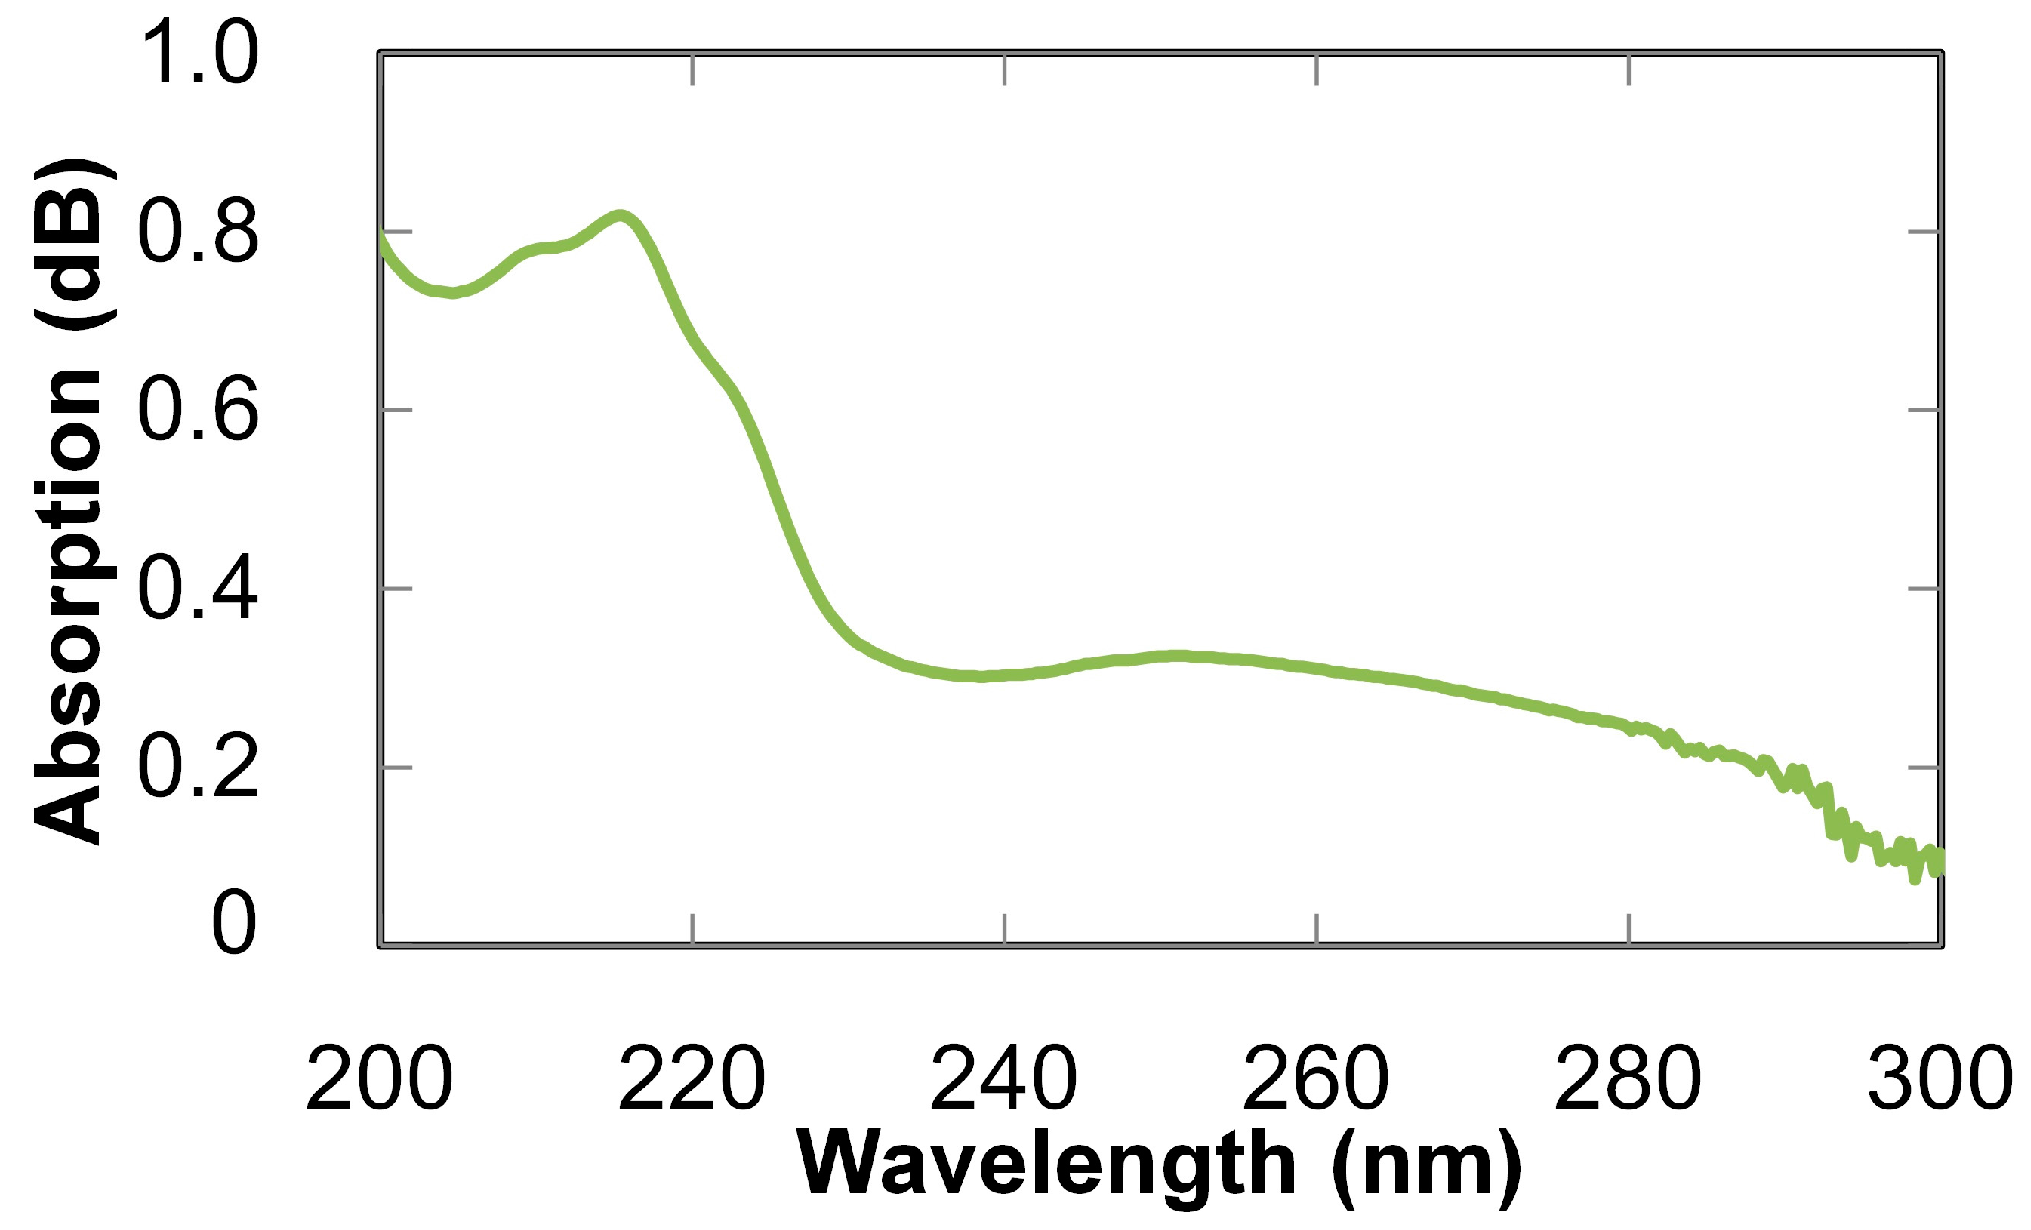
2. Ultraviolet-Absorption Spectroscopy
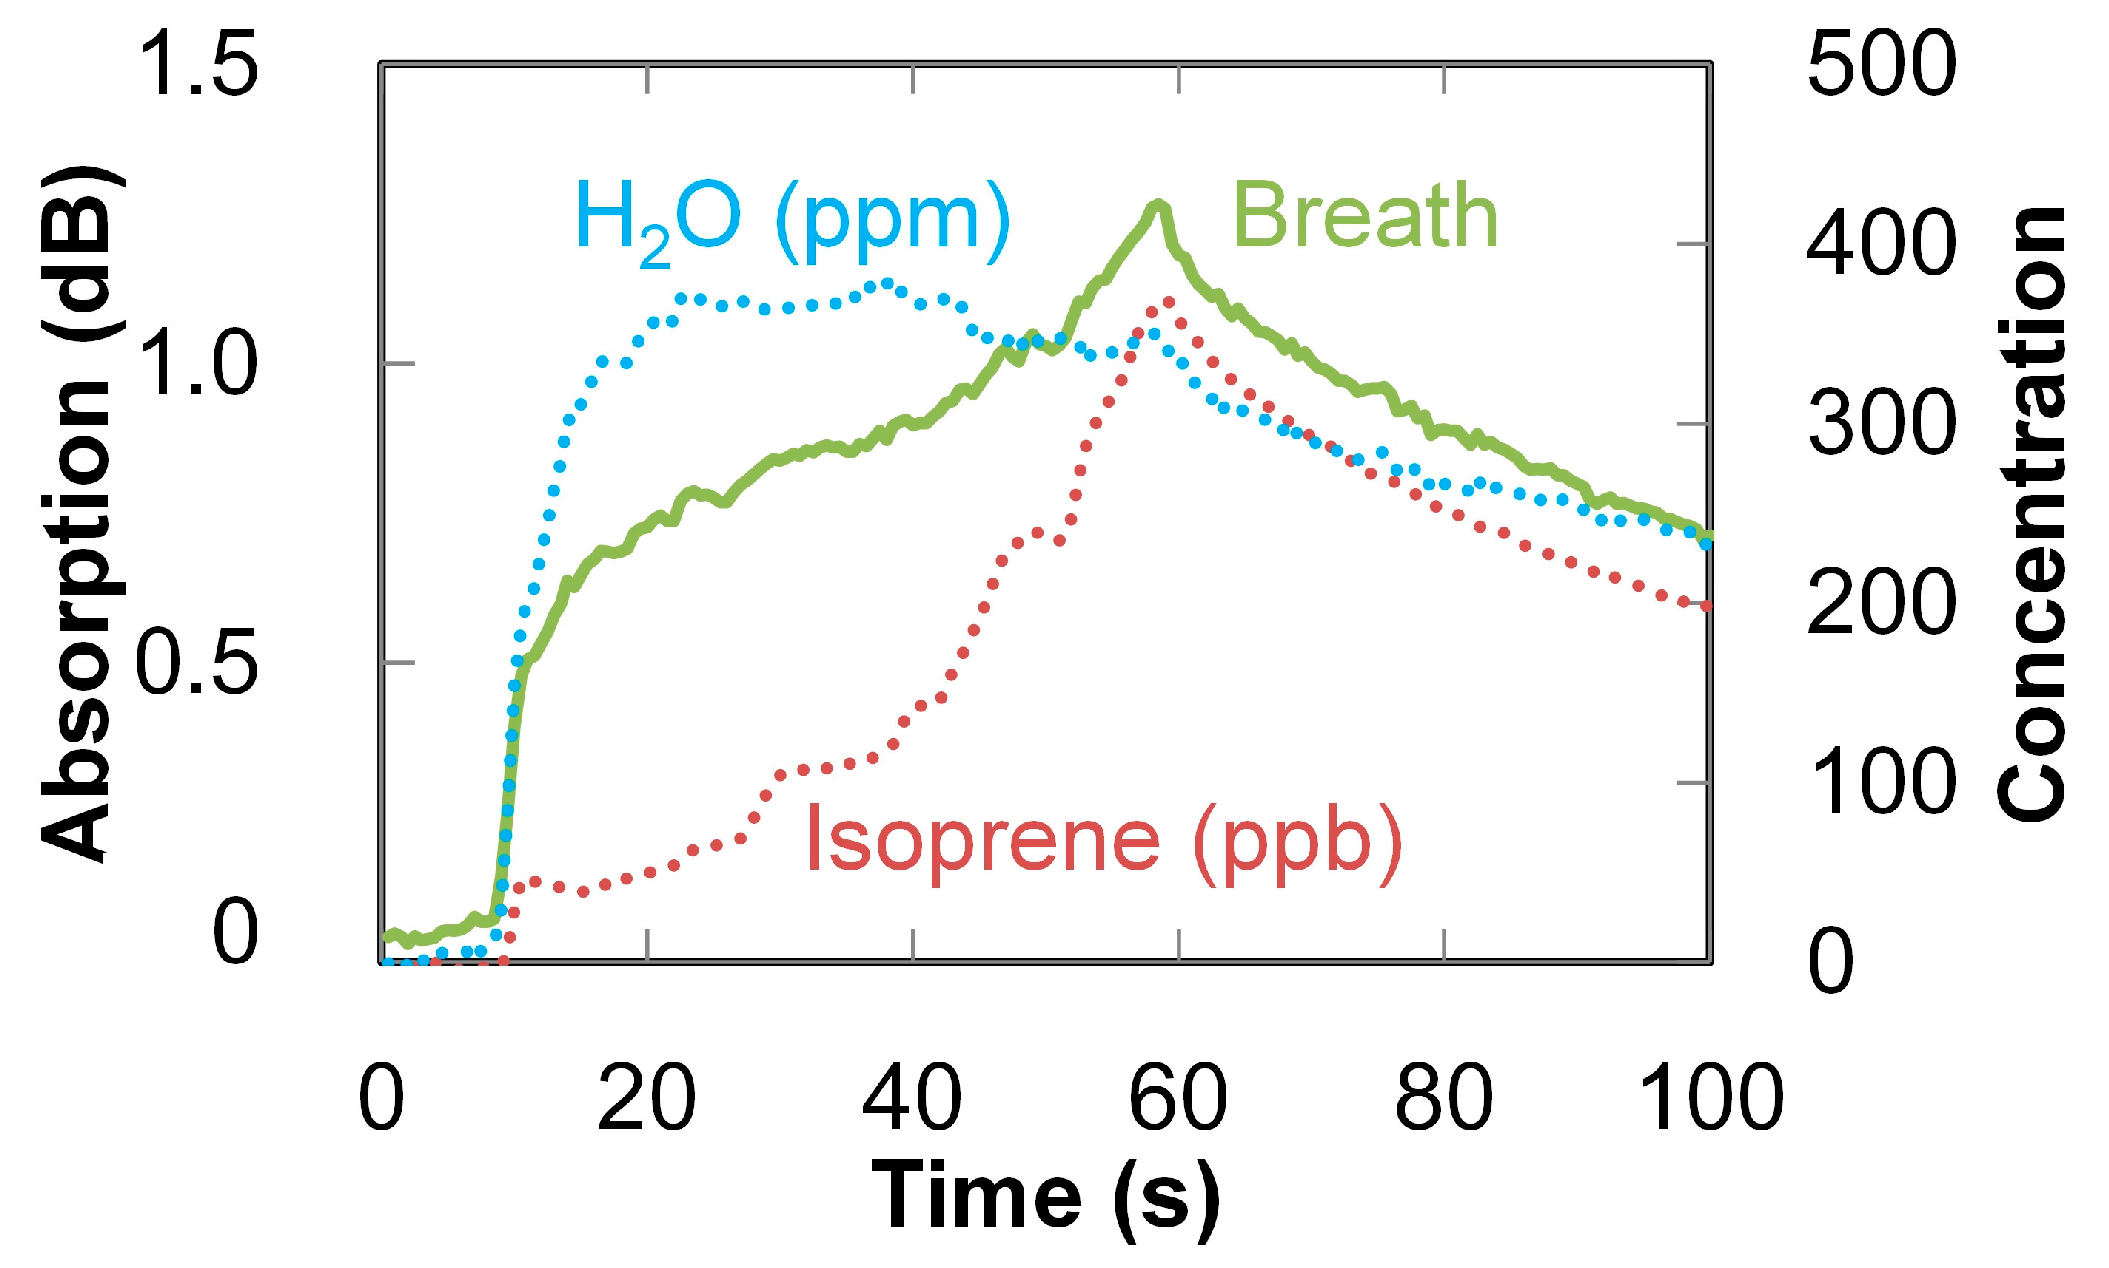
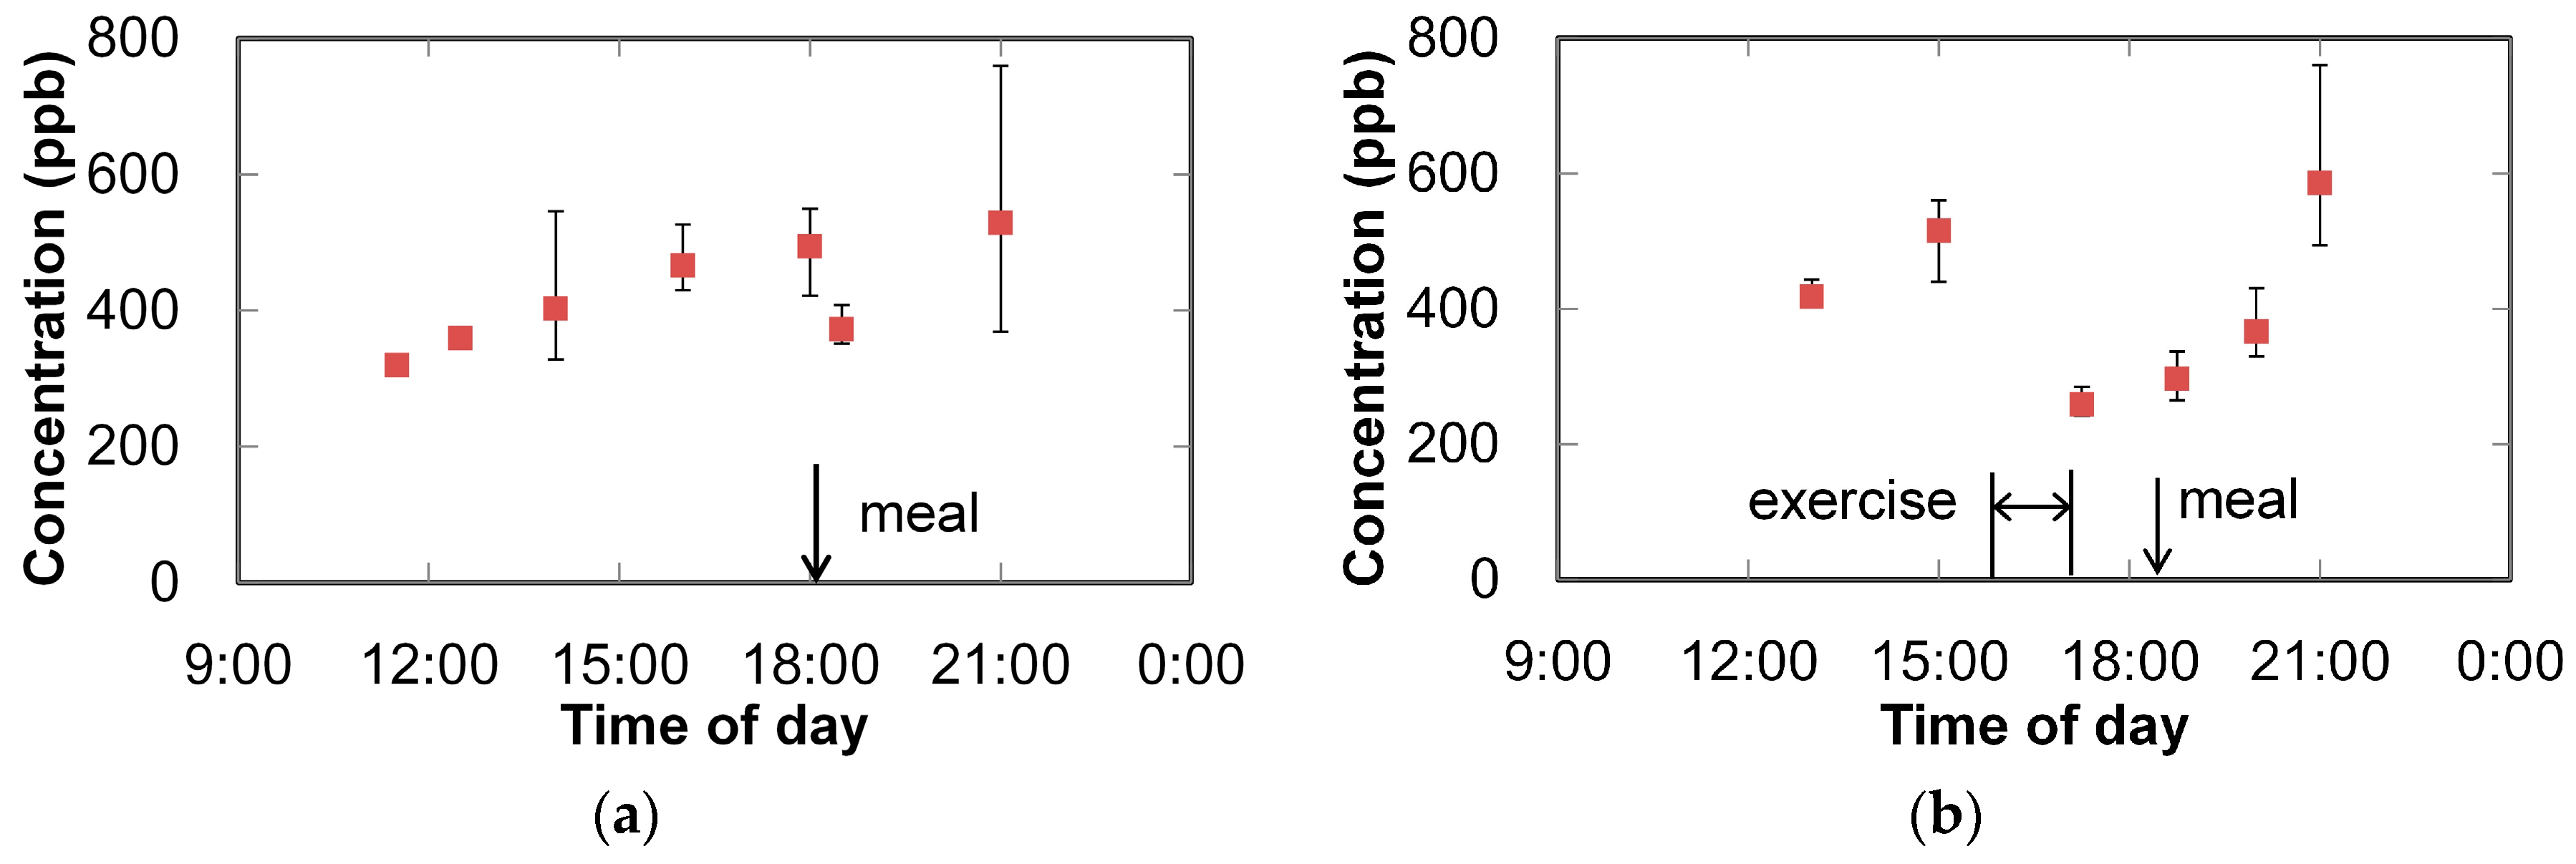
3. Breath Analysis
4. Conclusions
Author Contributions
Conflicts of Interest
References
- Marczin, N.; Yacoub, M. Disease Markers in Exhaled Breath: Basic Mechanisms and Clinical Applications; IOS Press: Washington, DC, USA, 2002. [Google Scholar]
- Kim, K.; Jahan, S.A.; Kabir, E. A review of breath analysis for diagnosis of human health. Trends Anal. Chem. 2012, 13, 1–8. [Google Scholar] [CrossRef]
- Gustafsson, L.E.; Leone, A.M.; Persson, M.G.; Wiklund, N.P.; Moncada, S. Endogenous nitric oxide is present in exhaled air of rabbits, guinea-pigs and humans. Biochem. Biophys. Res. Commun. 1991, 181, 852–857. [Google Scholar] [CrossRef]
- Chapman, J.T.; Choi, A.M. Exhaled monoxides as a pulmonary function test: Use of exhaled nitric oxide and carbon monoxide. Clin. Chest Med. 2001, 22, 817–836. [Google Scholar] [CrossRef]
- Miekisch, W.; Schubert, J.K.; Noeldge-Schomburg, G.F. Diagnostic potential of breath analysis—Focus on volatile organic compounds. Clin. Chim. Acta 2004, 347, 25–39. [Google Scholar] [CrossRef] [PubMed]
- Pauling, L.; Robinson, A.B.; Teranishi, R.; Cary, P. Quantitative analysis of urine vapor and breath by gas-liquid partition chromatography. Proc. Natl. Acad. Sci. USA 1971, 68, 2374–2384. [Google Scholar] [CrossRef] [PubMed]
- Jansson, B.O.; Larsson, B.T.J. Analysis of organic compounds in human breath by gas chromatography-mass spectrometry lab. Clin. Med. 1969, 74, 961–966. [Google Scholar]
- Lord, H.; Yu, Y.F.; Segal, A.; Pawliszyn, J. Breath analysis and monitoring by membrane extraction with sorbent interface. Anal. Chem. 2002, 74, 5650–5657. [Google Scholar] [CrossRef] [PubMed]
- Hodgkinson, J.; Tatam, R.P. Optical gas sensing: A review. Meas. Sci. Technol. 2013, 24, 1–59. [Google Scholar] [CrossRef]
- Wang, C.; Sahay, P. Breath analysis using laser spectroscopic techniques: Breath biomarkers, spectral fingerprints, and detection limits. Sensors 2009, 9, 8230–8262. [Google Scholar] [CrossRef] [PubMed]
- Neugebauer, U.; Rosch, P.; Popp, J. Raman spectroscopy towards clinical application: Drug monitoring and pathogen identification. Int. Antimicrob. Agents 2015, 46, 35–39. [Google Scholar] [CrossRef] [PubMed]
- Hanf, S.; Keiner, R.; Yan, D.; Popp, J.; Frosch, T. Fiber-enhanced Raman multigas spectroscopy: A versatile tool for environmental gas sensing and breath analysis. Anal. Chem. 2014, 86, 5278–5285. [Google Scholar] [CrossRef] [PubMed]
- Tuboly, E.; Szabo, A.; Eros, G.; Mohacsi, A.; Szabo, G.; Tengolics, R.; Rakhely, G.; Boros, M. Determination of endogenous methane formation by photoacoustic spectroscopy. J. Breath Res. 2013, 7, 1–9. [Google Scholar] [CrossRef] [PubMed]
- Dahnke, H.; Kleine, D.; Hering, P.; Murtz, M. Real-time monitoring of ethane in human breath using mid-infrared cavity leak-out spectroscopy. Appl. Phys. B 2011, 72, 971–975. [Google Scholar] [CrossRef]
- Wojtas, J.; Tittel, F.K.; Stacewicz, T.; Bielecki, Z.; Lewicki, R.; Mikolajczyk, J.; Nowakowski, M.; Szabra, D.; Stefanski, P.; Tarka, J. Cavity-enhanced absorption spectroscopy and photoacoustic spectroscopy for human breath analysis. Int. J. Thermophys. 2014, 35, 2215–2225. [Google Scholar] [CrossRef]
- Sahay, P.; Scherrer, S.T.; Wang, C. Measurements of the weak UV absorptions of isoprene and acetone at 261–275 nm using cavity ringdown spectroscopy for evaluation of a potential portable ringdown breath analyzer. Sensors 2013, 13, 8170–8187. [Google Scholar] [CrossRef] [PubMed]
- Sun, M.; Jiang, C.; Gong, Z.; Zhao, X.; Chen, Z.; Wang, Z.; Kang, M.; Li, Y.; Wang, C. A fully integrated standalone portable cavity ringdown breath acetone analyzer. Rev. Sci. Instrum. 2015, 86, 095003. [Google Scholar] [CrossRef] [PubMed]
- Baum, M.M.; Kumar, S.; Lappas, A.M.; Wagner, P.D. Measurement of acetylene in breath by ultraviolet absorption spectroscopy: Potential for noninvasive cardiac output monitoring. Rev. Sci. Instrum. 2003, 74, 3104–3110. [Google Scholar] [CrossRef]
- Takahashi, Y.; Kino, S.; Katagiri, T.; Matsuura, Y. Design and optimization of hollow-optical-fiber gas cell for infrared spectroscopy. Opt. Eng. 2013, 52, 013601. [Google Scholar] [CrossRef]
- Okita, Y.; Katagiri, T.; Matsuura, Y. Small-volume cavity cell using hollow optical fiber for Raman scattering-based gas detection. In Proceedings of the SPIE Conference on Optical Fibers and Sensors for Medical Diagnostics and Treatment Applications XI, San Francisco, CA, USA, 22–23 January 2011; SPIE: Bellingham, WA, USA, 2011; Volume 7894. [Google Scholar]
- Dessen, Y.; Katagiri, T.; Matsuura, Y. Ultraviolet gas-spectroscopy system using hollow optical fiber as micro-volume gas cell. In Proceedings of the Conference on Laser Surgery and Medicine 2013, Yokohama, Japan, 23–26 April 2013.
- Kotschau, R.; Eckhardt, H.S.; Klein, K.F.; Behler, K.; Hillrichs, G. Gas analysis in the UV region using a long-length hollow core waveguide. In Proceedings of the SPIE Conference on Optical Fibers and Sensors for Medical Applications III, San Jose, CA, USA, 25–26 January 2003; SPIE: Bellingham, WA, USA, 2003; Volume 4957, pp. 134–141. [Google Scholar]
- Matsuura, Y.; Miyagi, M. Flexible hollow waveguides for delivery of excimer-laser light. Opt. Lett. 1998, 23, 1226–1228. [Google Scholar] [CrossRef] [PubMed]
- Matsuura, Y.; Miyagi, M. Hollow optical fibers for ultraviolet and vacuum ultraviolet light. IEEE J. Sel. Top. Quantum Electron. 2004, 10, 1430–1434. [Google Scholar] [CrossRef]
- Dessen, Y.; Katagiri, T.; Matsuura, Y. Ultraviolet gas spectroscopy system for breath analysis based using hollow-optical fiber gas cell. Rev. Laser Eng. 2014, 42, 929–932. (In Japanese) [Google Scholar]
- Daumont, D.; Brion, J.; Malicet, J. Ozone UV spectroscopy I: Absorption cross-sections at room temperature. J. Atmos. Chem. 1992, 15, 145–155. [Google Scholar] [CrossRef]
- Campuzano-Jost, P.; Williams, M.B.; D’Ottone, L.; Hynes, A.J. Kinetics and mechanism of the reaction of the hydroxyl radical with h8-isoprene and d8-isoprene: Isoprene absorption cross sections, rate coefficients, and the mechanism of hydroperoxyl radical production. Phys. Chem. A 2004, 108, 1537–1551. [Google Scholar] [CrossRef]
- Kinoyama, M.; Nitta, H.; Watanabe, A.; Ueda, H. Acetone and isoprene concentrations in exhaled breath in healthy subjects. J. Health. Sci. 2008, 54, 471–477. [Google Scholar] [CrossRef]
- Taucher, J.; Hansel, A.; Jordan, A.; Fall, R.; Futrell, J.H.; Lindinger, W. Detection of isoprene in expired air from human subject using proton-transfer-reaction mass spectrometry. Rapid. Commun. Mass. Spectrom. 1997, 11, 1230–1234. [Google Scholar] [CrossRef]
- Jones, P.J.; Schoeller, D.A. Evidence for diurnal periodicity in human cholesterol synthesis. J. Lipid. Res. 1990, 31, 667–673. [Google Scholar] [PubMed]
- Karl, T.; Prazeller, P.; Mayr, D.; Jordan, J.; Rieder, R.F.; Lindinger, W. Human breath isoprene and its relation to blood cholesterol levels: New measurements and modeling. J. Appl. Physiol. 2001, 91, 762–770. [Google Scholar] [PubMed]


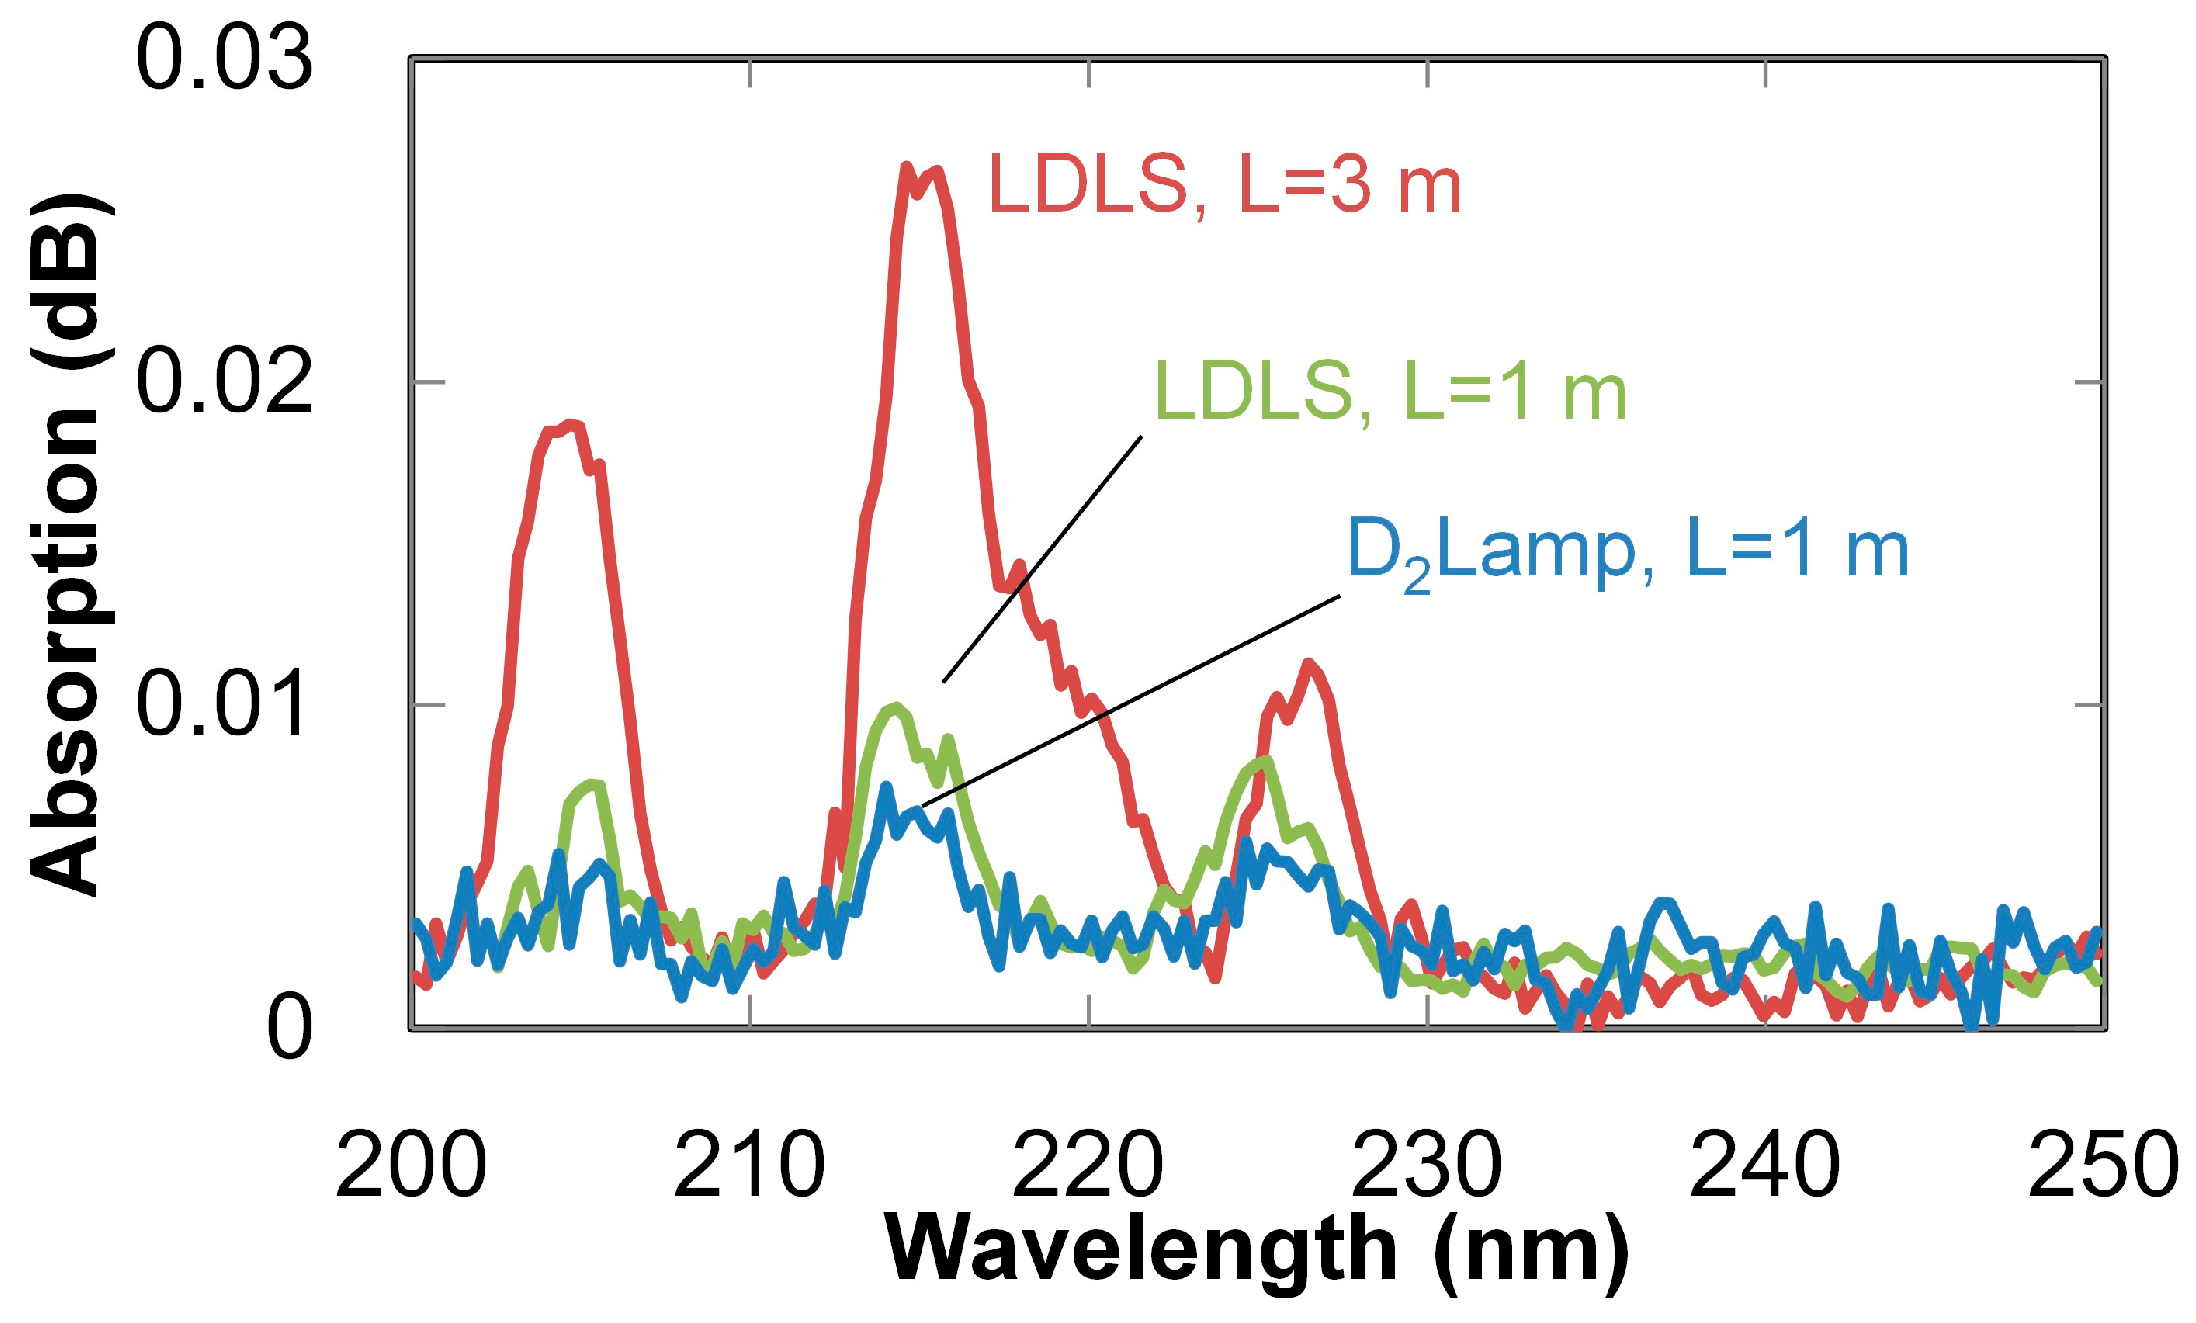
| Light Source, Fiber Length | SNR |
|---|---|
| LDLS, L = 3 m | 42.1 |
| LDLS, L = 1 m | 19.4 |
| D2 Lamp, L = 1 m | 4.60 |
© 2016 by the authors; licensee MDPI, Basel, Switzerland. This article is an open access article distributed under the terms and conditions of the Creative Commons Attribution (CC-BY) license (http://creativecommons.org/licenses/by/4.0/).
Share and Cite
Iwata, T.; Katagiri, T.; Matsuura, Y. Real-Time Analysis of Isoprene in Breath by Using Ultraviolet-Absorption Spectroscopy with a Hollow Optical Fiber Gas Cell. Sensors 2016, 16, 2058. https://doi.org/10.3390/s16122058
Iwata T, Katagiri T, Matsuura Y. Real-Time Analysis of Isoprene in Breath by Using Ultraviolet-Absorption Spectroscopy with a Hollow Optical Fiber Gas Cell. Sensors. 2016; 16(12):2058. https://doi.org/10.3390/s16122058
Chicago/Turabian StyleIwata, Takuro, Takashi Katagiri, and Yuji Matsuura. 2016. "Real-Time Analysis of Isoprene in Breath by Using Ultraviolet-Absorption Spectroscopy with a Hollow Optical Fiber Gas Cell" Sensors 16, no. 12: 2058. https://doi.org/10.3390/s16122058
APA StyleIwata, T., Katagiri, T., & Matsuura, Y. (2016). Real-Time Analysis of Isoprene in Breath by Using Ultraviolet-Absorption Spectroscopy with a Hollow Optical Fiber Gas Cell. Sensors, 16(12), 2058. https://doi.org/10.3390/s16122058