
A Novel Petri Nets-Based Modeling Method for the Interaction between the Sensor and the Geographic Environment in Emerging Sensor Networks

Abstract
:1. Introduction
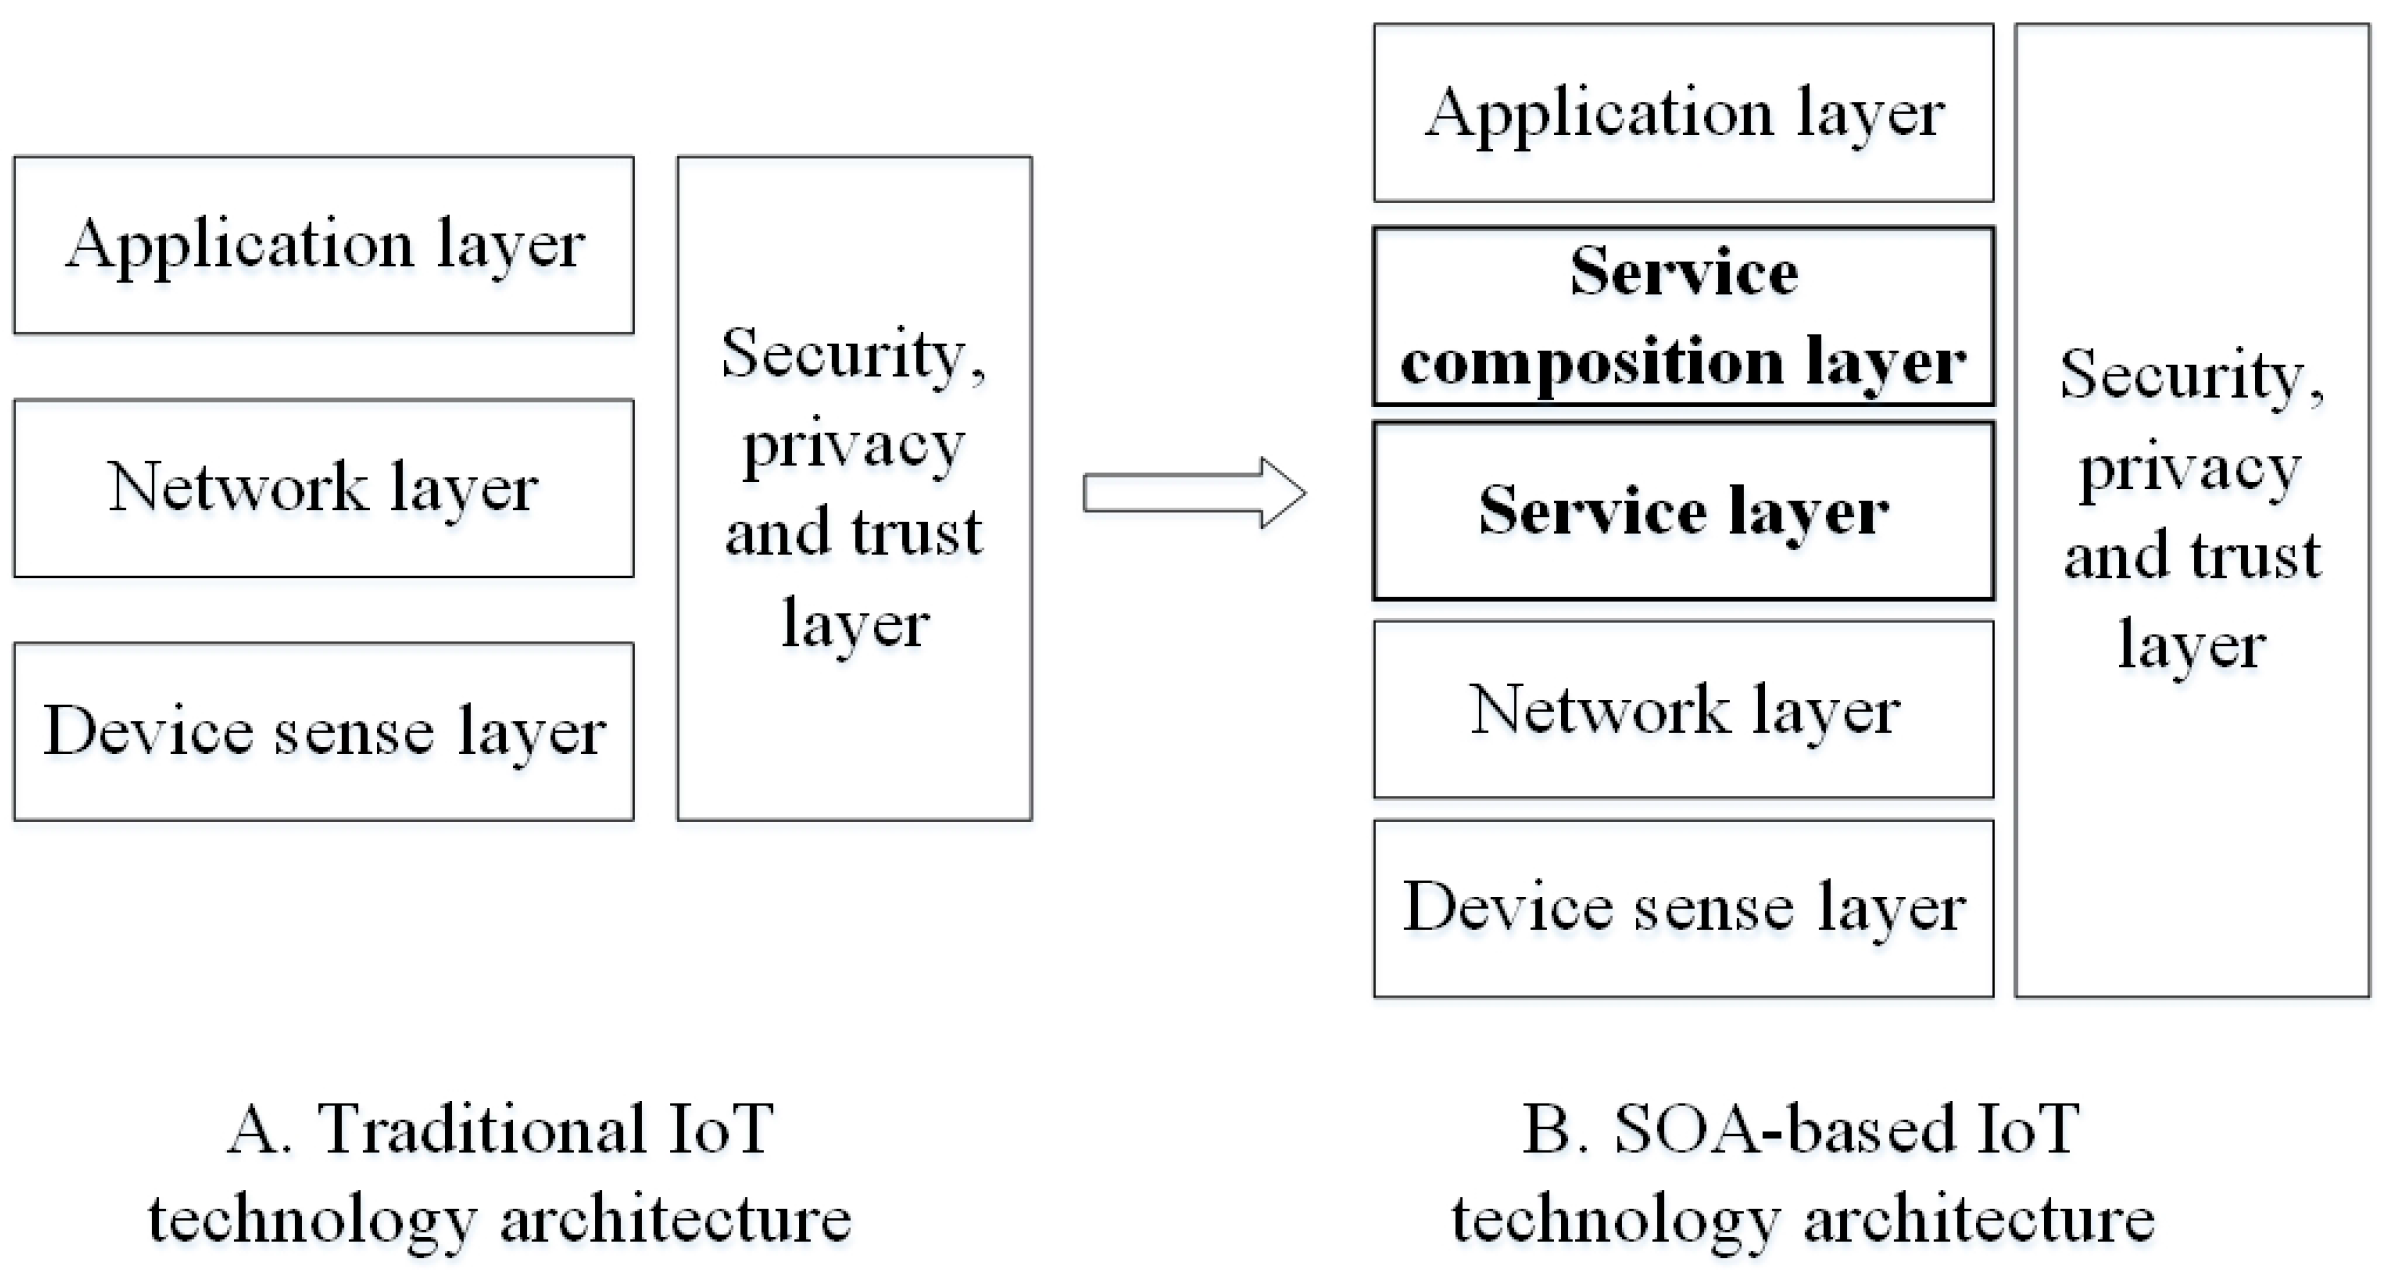
2. Related Work
2.1. IoT Service Modeling
2.2. Web Service Composition
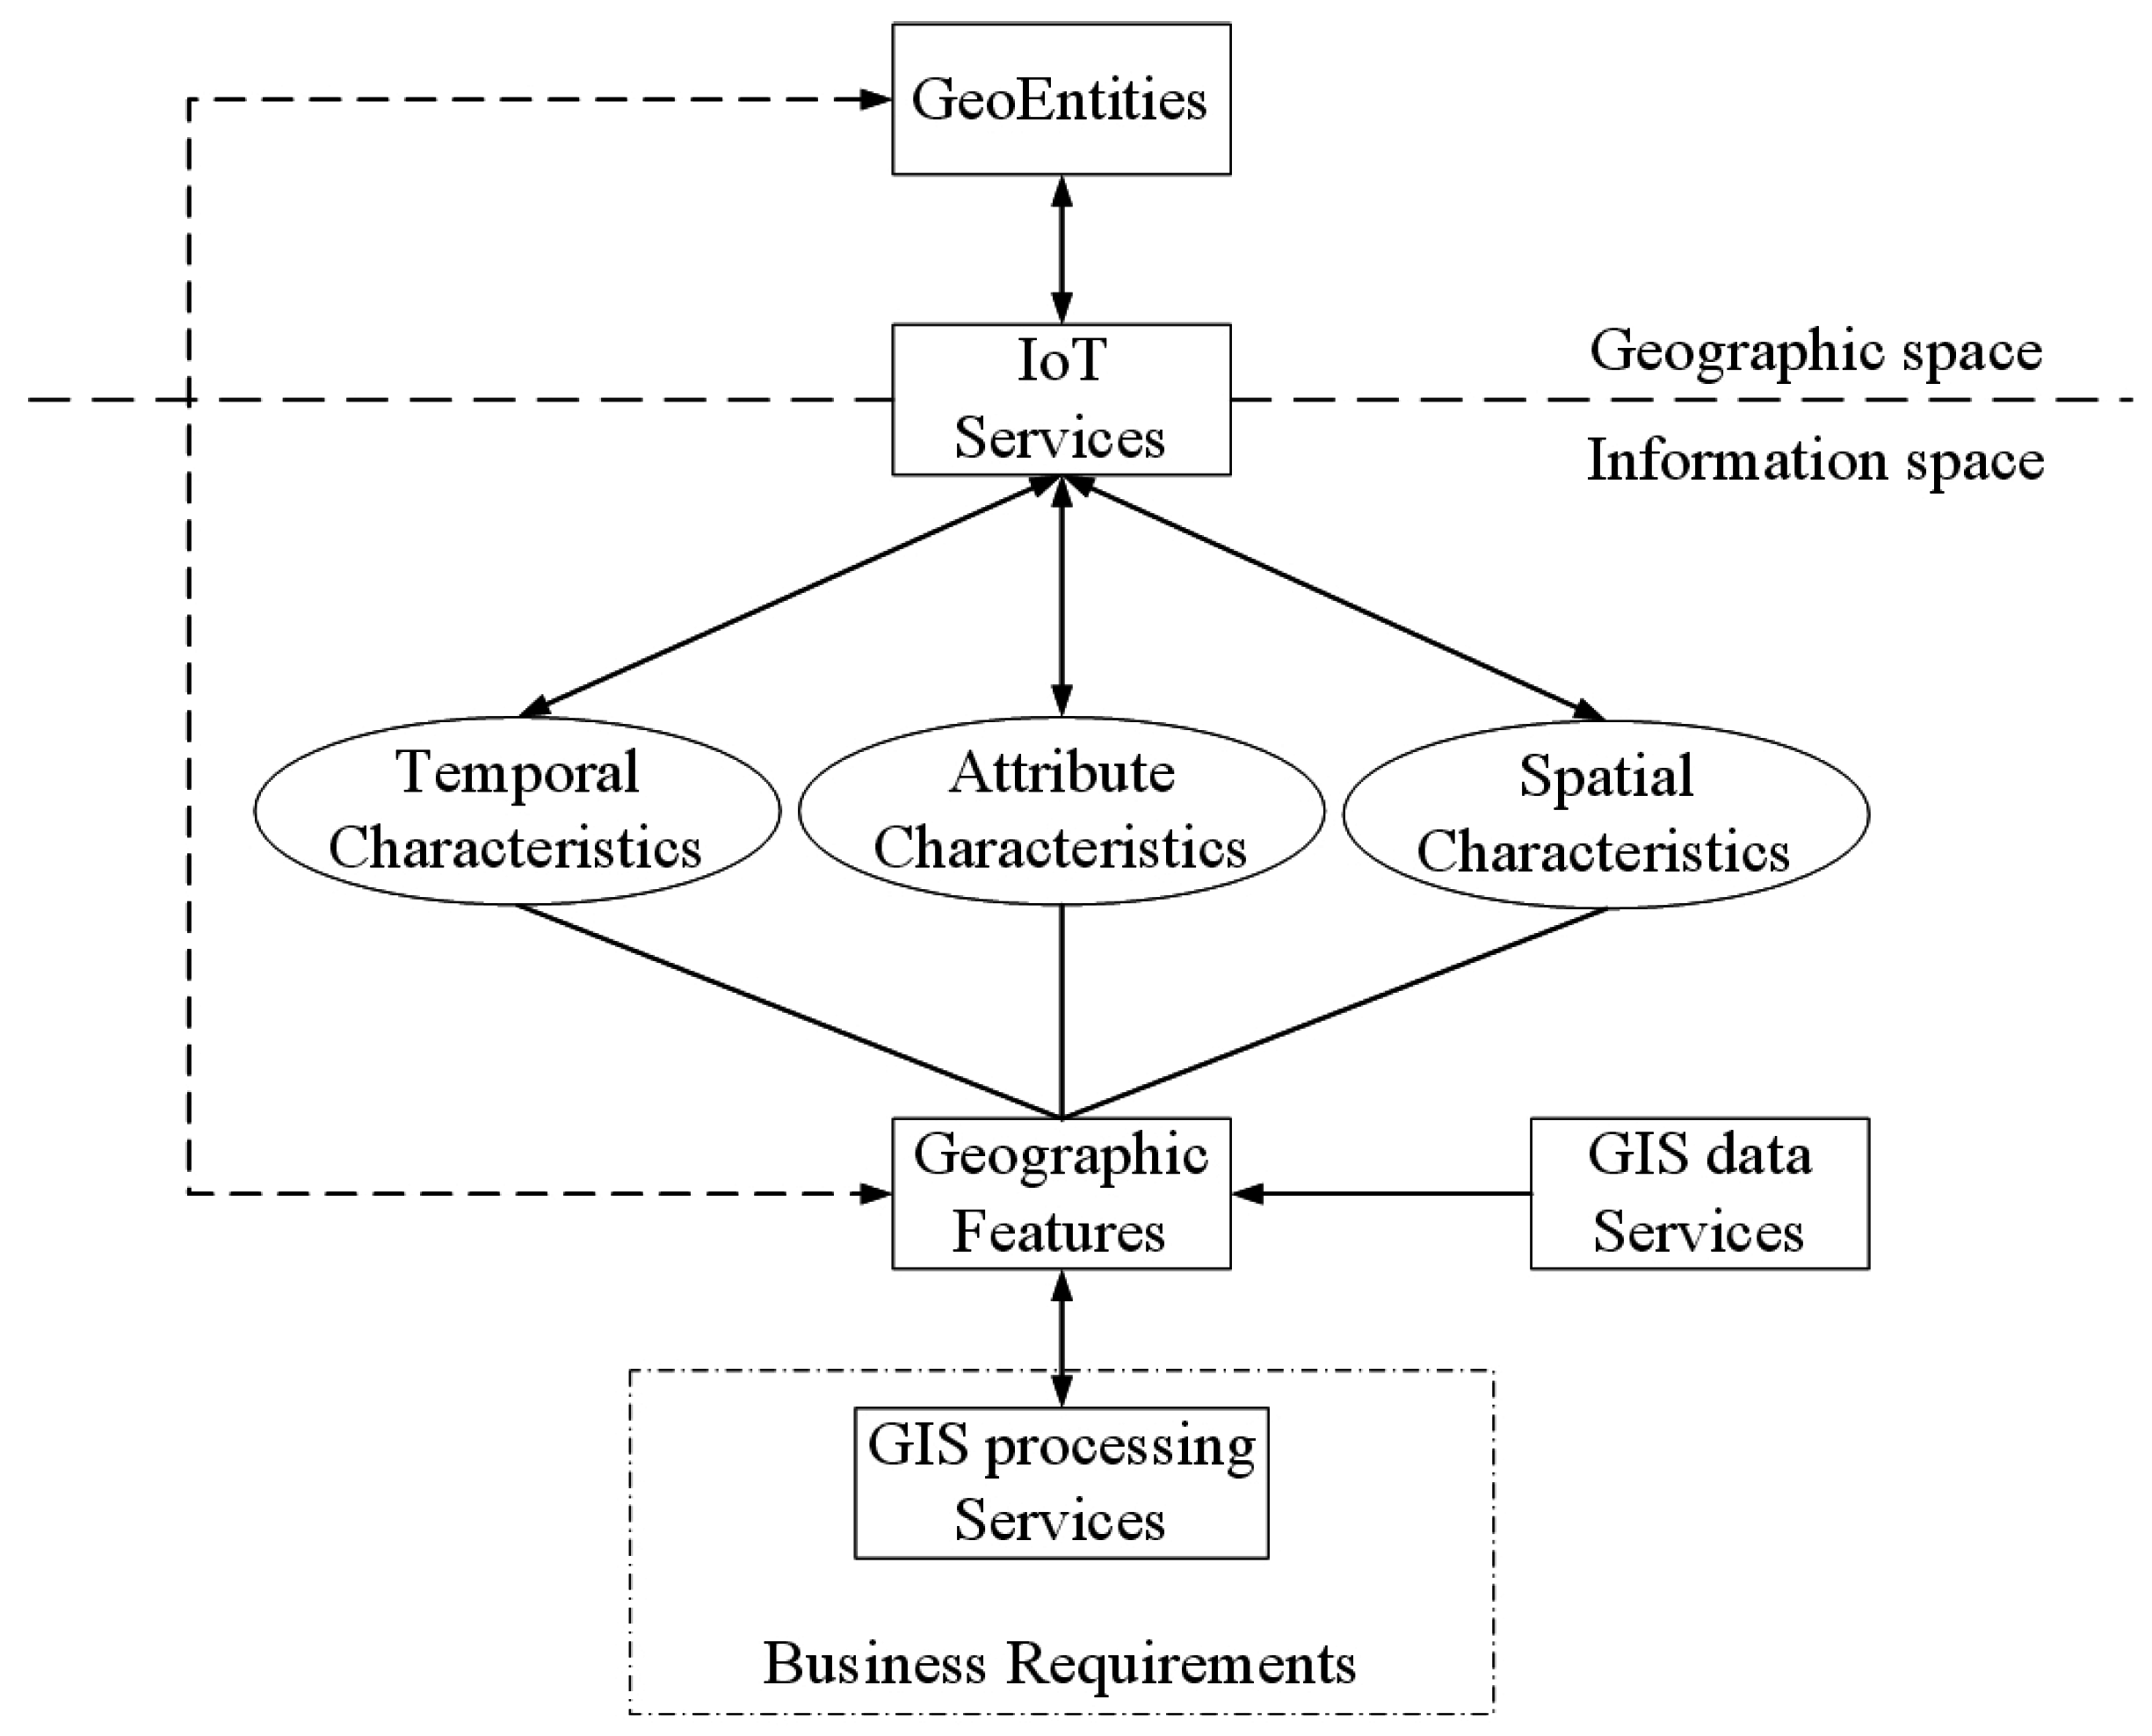
3. GIS-Oriented IoT Service
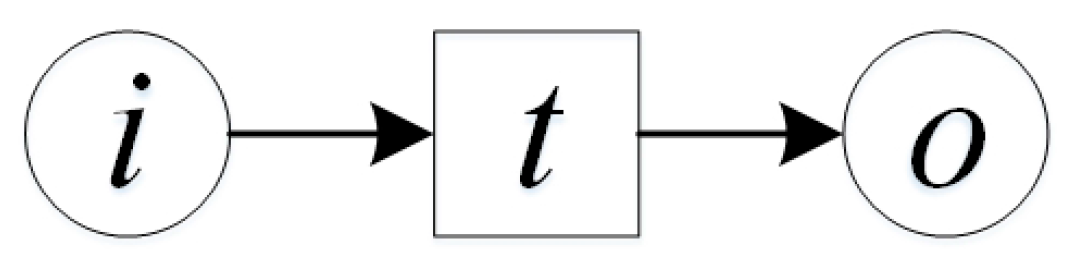
3.1. Petri Nets Introduction
- (1)
- Σ is a finite set of types, called color set.
- (2)
- P is a finite set of places.
- (3)
- T is a finite set of transitions.
- (4)
- F is a finite set of arcs such that:
- (5)
- C is a color function.
- (6)
- G is a guard function,
- (7)
- E is an arc expression function, , where p is the places connected to f.
- (8)
- I is an initialization function. creates the start mark for the color of every places, i.e., .
3.2. Geographic Entity
- Sensed geo-entity: The attributes of the sensed geo-entity can be sensed by sensors. For example, the direction, velocity and location of a self-driving car can be sensed by sensors; the pollution indicator of a lake can be sensed by the relevant sensor. At the same time, the geo-entity also has its own evolution behaviors of the state. For example, the pollution indicator of a lake change with time. The evolution behavior of the lake, such as the chemical reaction and the biological process, cause the attribute value(the pollution indicator) of the lake to change constantly. So it is needed to sense the geo-entity by the IoT sensing device constantly.
- Controlled geo-entity: For this type of geo-entity, not only its attributes can be sensed, but also its attributes can be changed by commands received from the sensor. So compared to the sensed geo-entity we need to have a better understanding of the behavior of the controlled geo-entity. The different attribute values of this kind of geo-entity are correspond to its different states. So the sensor could change the state of a geo-entity through changing its attribute values.
- (1)
- is the unique identifier of .
- (2)
- denotes the spatial characteristic set of , including location coordinate set, entity type, area, perimeter, spatial relationship with the other geo-features and so on. Location coordinate set can be obtained from IoT service. Area and perimeter can be obtained through the related GIS service. The spatial relationship such as inclusion, intersection can be obtained by the spatial analysis of GIS service.
- (3)
- denotes attribute characteristic set of , and denotes temporal characteristic set. They all can be obtained from the IoT service.
- (4)
- denotes the behavior and function of . can be inherited from the type of this geo-feature. For example, the geo-feature of a weather monitoring point can inherit the behavior and function from the point type feature of GIS. also can be defined according to the specific scenario.
- (5)
- is the allowed operation set of . . is the operation behavior, is the operation content. For example, denotes that the allowed operation of the geo-entity corresponding to is to switch on or to switch off. is defined according to the specific scenario.
- (6)
- is the semantic description of .
3.3. IoT Service
- Sensing Service. Through interaction with the geo-entity, this kind of service collects the information, senses the state (attribute values) changing of a geo-entity and shares the sensed information to other services or applications. In general, the sensing service periodically collects the information of the sensed geo-entity, but one sensing service only has the ability to sense one property of one geo-entity. For example, the GPS sensor inside the mobile phone can only sense the location of the phone, and a temperature sensor in a location can only sense the temperature information of this location.
- Controlling Service. This kind of service first receives the control information from other services, and then changes the attribute values (state) of the geo-entity directly or indirectly. The direct way is to convert the control information into the control commands which the controllable geo-entity can accept, and then send it to the corresponding controllable geo-entity to adjust its state directly. For example, if a self-driving car senses the route deviation, then the related sensor device would adjust it direction or speed directly. The indirect way is not to change the attribute values of a geo-entity directly, but take other ways to change the attribute values. For example, if the lake water pollution reaches to a certain degree, the related sensor devices would release some biologic to alter the water pollution indirectly.
- Real Time. The sensor must sense the state of a geo-entity in real time, and provide real-time IoT service. According to the sensed information the controlling IoT service must control the controlled geo-entity in real time. The sensed information and control demands of IoT services must be in real time. For example, a sensor monitors the carbon dioxide concentration in a region, or a GPS sensor tracks the location of a vehicle. All these scenarios have strict requirements for real time.
- Temporal and Spatial Distribution. The sensed or controlled object of GIS-oriented IoT are the geo-entity in geographical space, and the most obvious characteristics of geo-entity are its temporal and spatial distribution characteristics. The spatial distribution characteristic is characterized by its geographical location attribute, and it has a certain spatial relationship. The temporal distribution characteristic is characterized by its state changing with time. As a result, the information described by GIS-oriented IoT service has temporal and spatial distribution characteristics, and the behaviors of the IoT service need to be adjusted in time with the change of the geo-entity. For example, for a continuous moving self-driving car, its location is constantly changing, and its direction should be adjusted according to the changing location information. Here the location is a temporal and spatial distribution characteristic of the car. What the general Web service describes and interacts with is the business information in a business application. It is a kind of virtual entity, and generally does not have the temporal and spatial distribution characteristics.
- Strong Interactivity. The GIS-oriented IoT service interacts with the geo-entity in the environment through the IoT device. The IoT service senses the attribute of the geo-entity by the sensing device, thus it can monitor the state of the geo-entity in real time. IoT service share the sensed information (the state information of the geographical entity, such as the location of a car and so on) to GIS service for business analysis ( for example, the GIS spatial analysis service analyzes the spatial relationship between the car and the road to judge whether the route is correct), and adjust the state of the geo-entity by the controlling service to meet user expectations.
- Dynamic Service Quality. The device which provides the IoT service is often deployed in the complex geographical environment and uses the wireless self-organized way to interconnect. So there are many reasons that cause the IoT services to be dynamic and unstable. For example, because of the natural environment (such as the rainfall, wildlife damage, etc.), energy shortage of equipment or constrained resource [59], the service quality would decline or even disappear. However, the business applications require the IoT services to provide a reliable service.
3.4. GIS Service
3.4.1. GIS Data Service
- (1)
- is the unique identifier of .
- (2)
- is the invocation of the GIS Data service.
- (3)
- is the description of service of quality. Sometimes we should select the suitable service from several services, the is a good reference indicator. The first four including are consistent with the description of the general Web service [62]. The latter two including are special description for geospatial data service. The spatial data provided by GIS Data services could describe the realistic geographical phenomenon, and denotes the data integrity which is the completeness degree of this type of description. Any information of geo-entity should not be missed out. denotes data accuracy which is the proximity between the spatial data provided by GIS Data service and the realistic geographical phenomenon. Due to the spatial, attribute, temporal characteristics are three basic elements for the expression of spatial information, the of the data can be measured by (the proximity between the coordinate data and the real position), (the consistency of attribute value and the real value) and (the presentalism of the spatial data).
- (4)
- is the type of Data service, . If , then this data service can provide geo-feature set which contains the same type of geo-features in a certain geographical region. The type of geo-feature set includes point type, line type, polygon type in general.
- (5)
- is the type of the geographic feature, such as point, line, polygon and so on.
- (6)
- is the attribute characteristic set of geo-feature. Some attribute characteristics are corresponding to the information provided by sensing service.
- (7)
- is the semantic description.
3.4.2. GIS Processing Service
- (1)
- is the unique identifier of this processing service.
- (2)
- is the invocation of the GIS processing service.
- (3)
- is the description of the quality of service.
- (4)
- is the semantic description.
- (5)
- where:
- Σ is a color set, denotes the input and output geo-feature type and other information type. The definition of colors includes:Color : the geo-feature,Color : the other information, such as number, string.
- P is a finite place set, i is the input of processing service, i.e., geo-features or some other information. o is the output of processing service,
- T is a finite transition set, denotes the internal operations of the processing service, that is, the process of analyzing the input geo-features and other information and outputting the results. For example, the processing service of buffer query needs the input of the target geo-feature and the buffer distance, and outputs the polygon feature with position, area, perimeter and some other attributes after the buffer analysis.
- F is a finite arc set.
- E is the arc function set.
- C is the color function.
- G is the guard function which is defined according to the specific service. G can determine whether the processing service could be executed.
- I is the initialization function which can confirm the initial conditions, is the initial mark produced by the color value of every place.
3.4.3. Information Flow in GIS-Oriented IoT Service Application
- The IoT senses the geo-entity by the sensor and uses the sensing service to share the sensed state information of the geo-entity, such as spatial location, temperature and other information.
- The information from sensing services and related GIS data service (if needed) are integrated together to constitute a geo-feature. Then the geo-entity is mapped to geo-feature of information space, and the information provided by sensing services is mapped to the spatial characteristics, attribute characteristics or temporal characteristics of this geo-feature.
- The GIS processing service takes the geo-feature as the basic object of spatial analysis to process business requirements.
- After spatial analysis, GIS processing services find the geo-features to be controlled. The control command and new state are assigned to the related geo-feature. The state is expressed by the characteristics.
- The control command and new state of the geo-feature are mapped to the corresponding controlling services.
- These controlling services adjust the state of the corresponding geo-entity.
- Sensing Flow: The sensor device senses the information of geo-entity. The sensing service shares this information as the characteristic of the geo-feature to GIS processing service for further business analysis.
- Business Flow: GIS processing services receive the input information, use all kinds of spatial analysis methods to realize the business logic. A result is obtained after these processing. The result may contain a geo-feature with control commands.
- Control Flow: According to the control commands of the output geo-feature, the related controlling services adjust the states of the corresponding geo-entity.
4. GIS-Oriented IoT Service Application Modeling
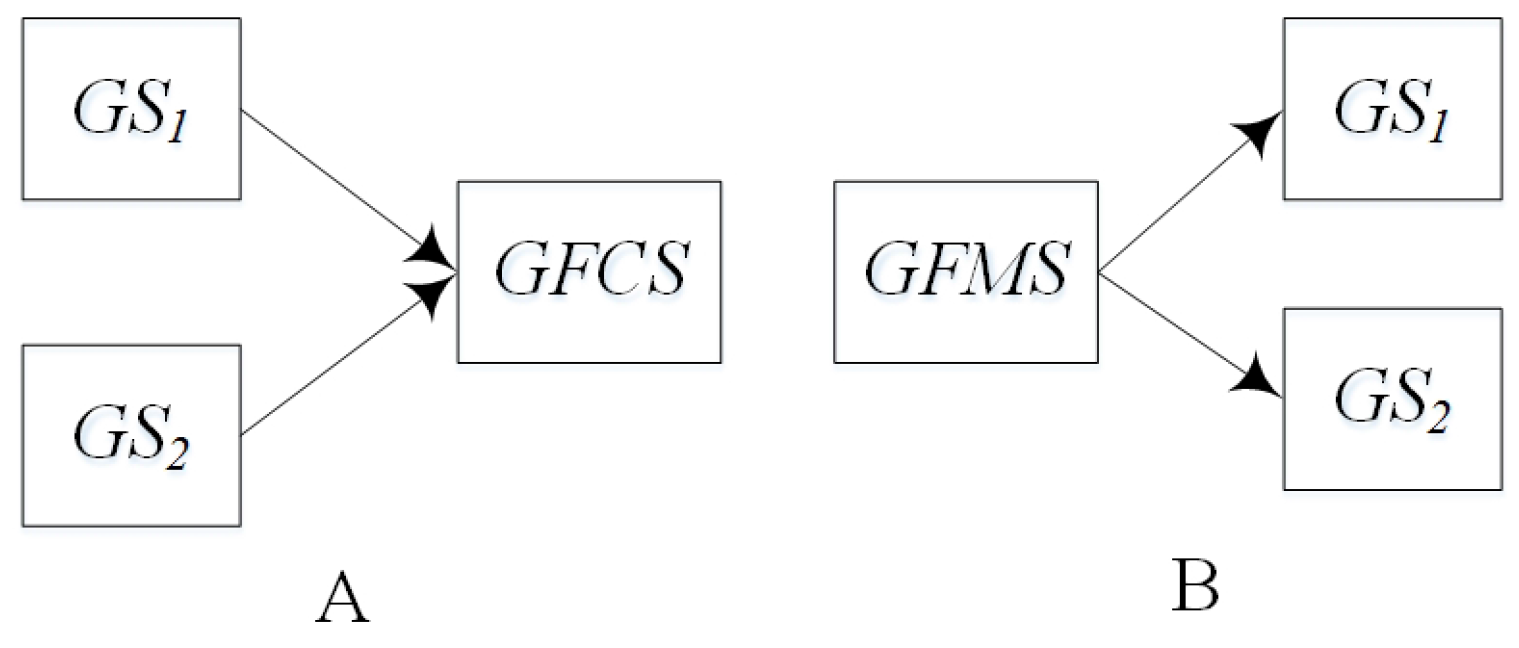
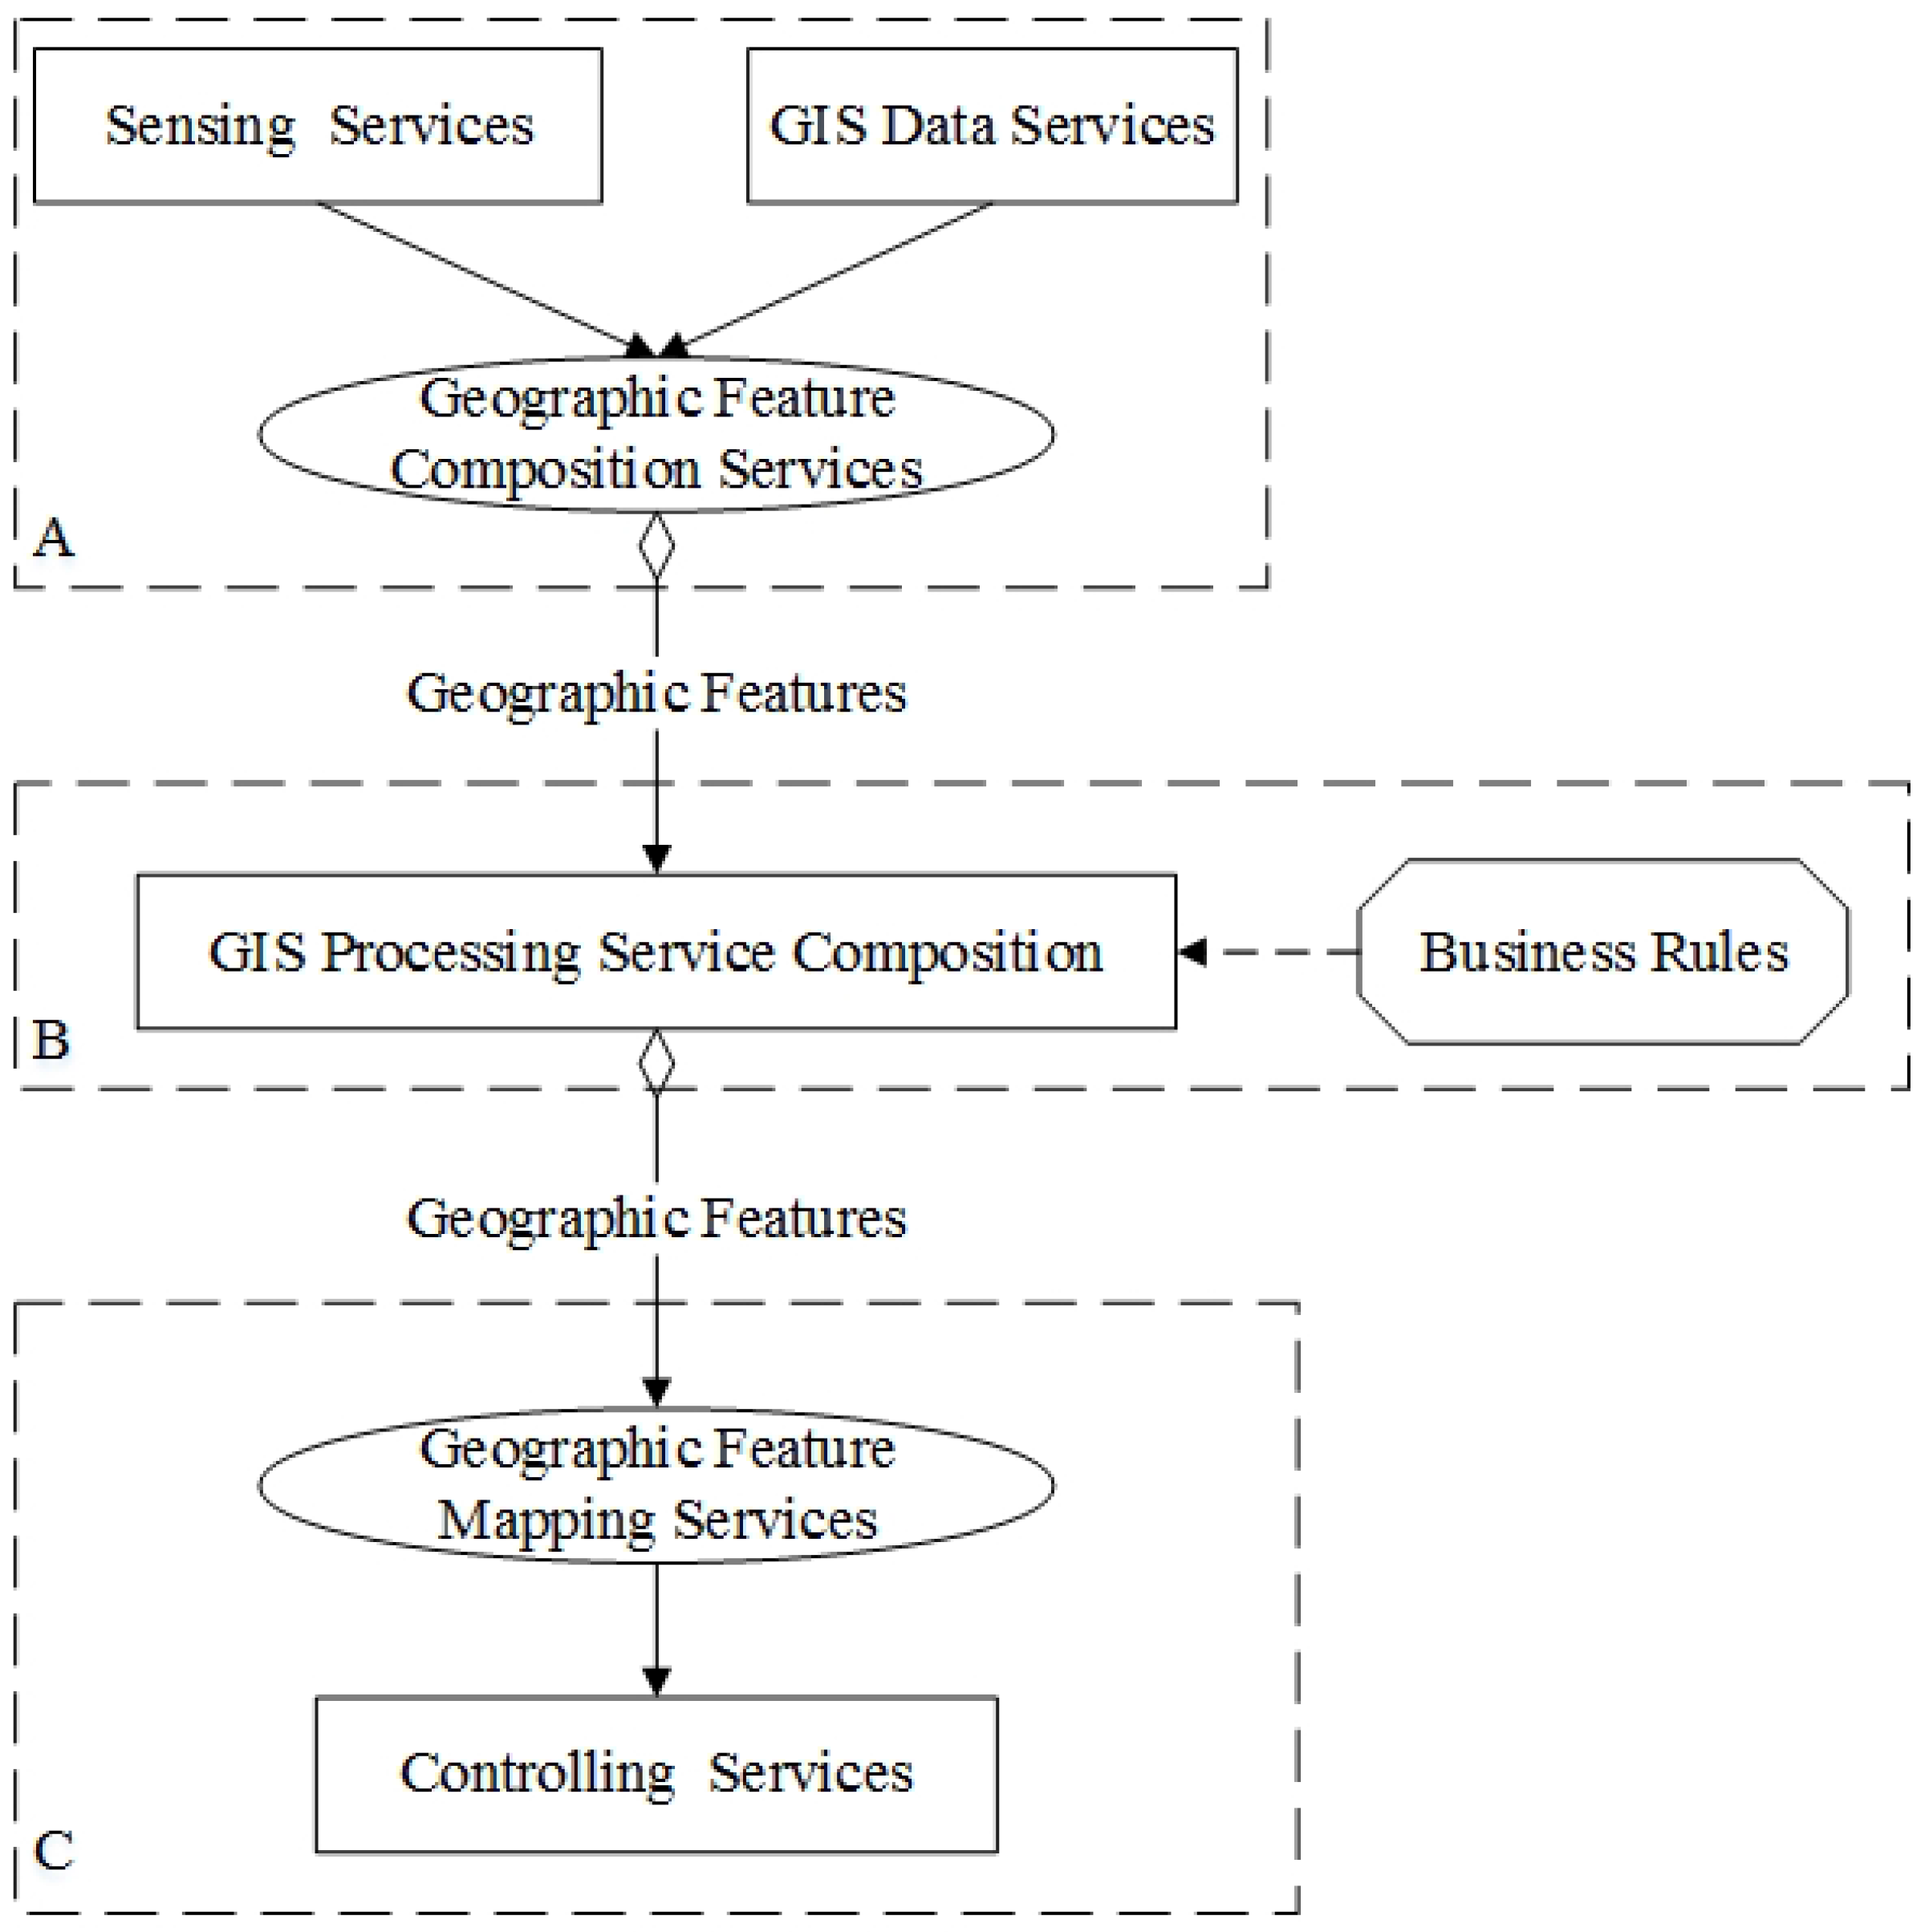
- Sensing Service Composition. The sensing service and the related GIS data service provide the input for Geo-feature composition service (GFCS). GFCS is an assisted service which can integrate the information from the sensing service and the GIS data service to a geo-feature. Here the sensing service and the GIS data service must be these services which describe the same geo-entity. After the data operation GFCS outputs the corresponding geo-feature.
- GIS Processing Service Composition. According to the business rule, the related GIS processing services are composed to process the input geo-feature, and then output business results including geo-feature with control commands.
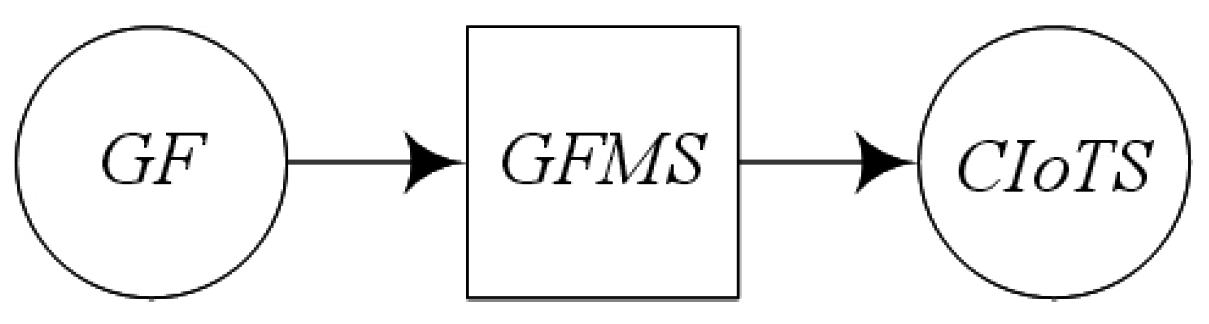
- Controlling Service Mapping. The geo-feature mapping service (GFMS) receives the input geo-feature from the GIS processing service and maps the control commands to the corresponding controlling services and triggers these services to control the corresponding geo-entity.
4.1. Service Algebra
- (1)
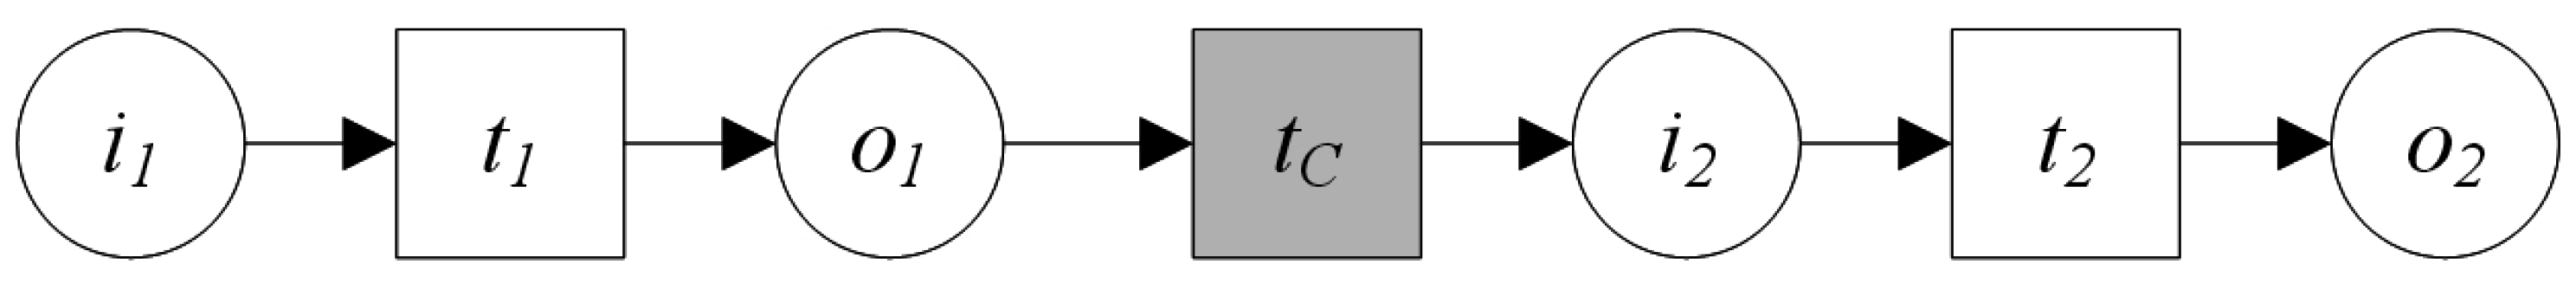
- denotes that and are executed sequentially, i.e., first , then . ⊙ denotes the sequential operator.
- (2)
- denotes that and are executed alternatively, that is, both and are not executed at the same time. ⊕ denotes the alternative operator.
- (3)
- denotes that and are executed parallel, ∥ denotes the parallel operator.
- (4)
- denotes the iterative operation, that is, is executed repeatedly. μ denotes the iterative operator.
- (5)
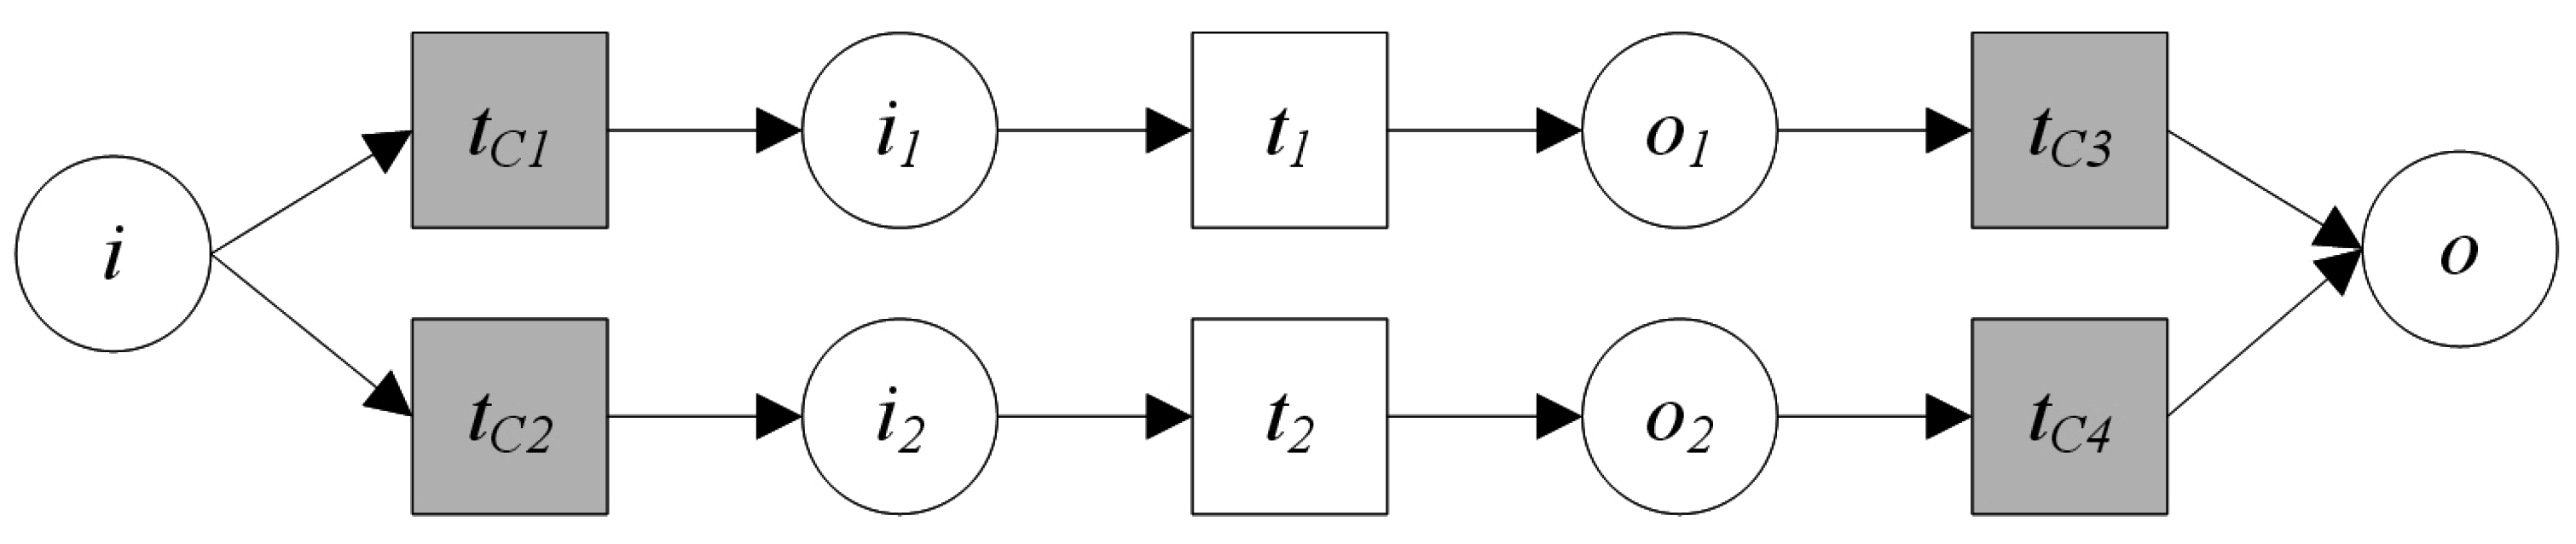
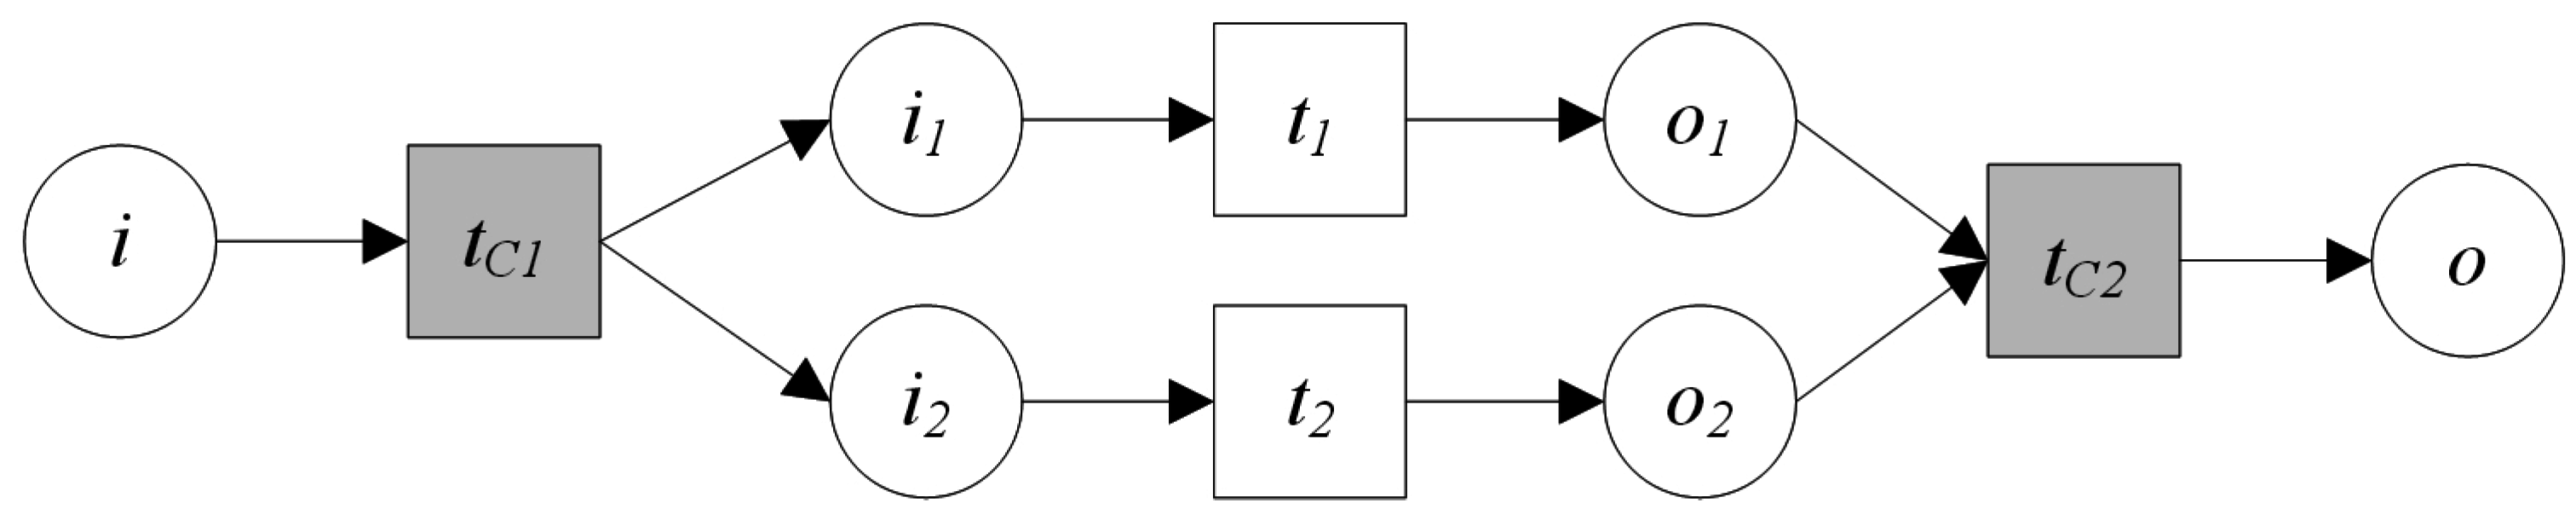
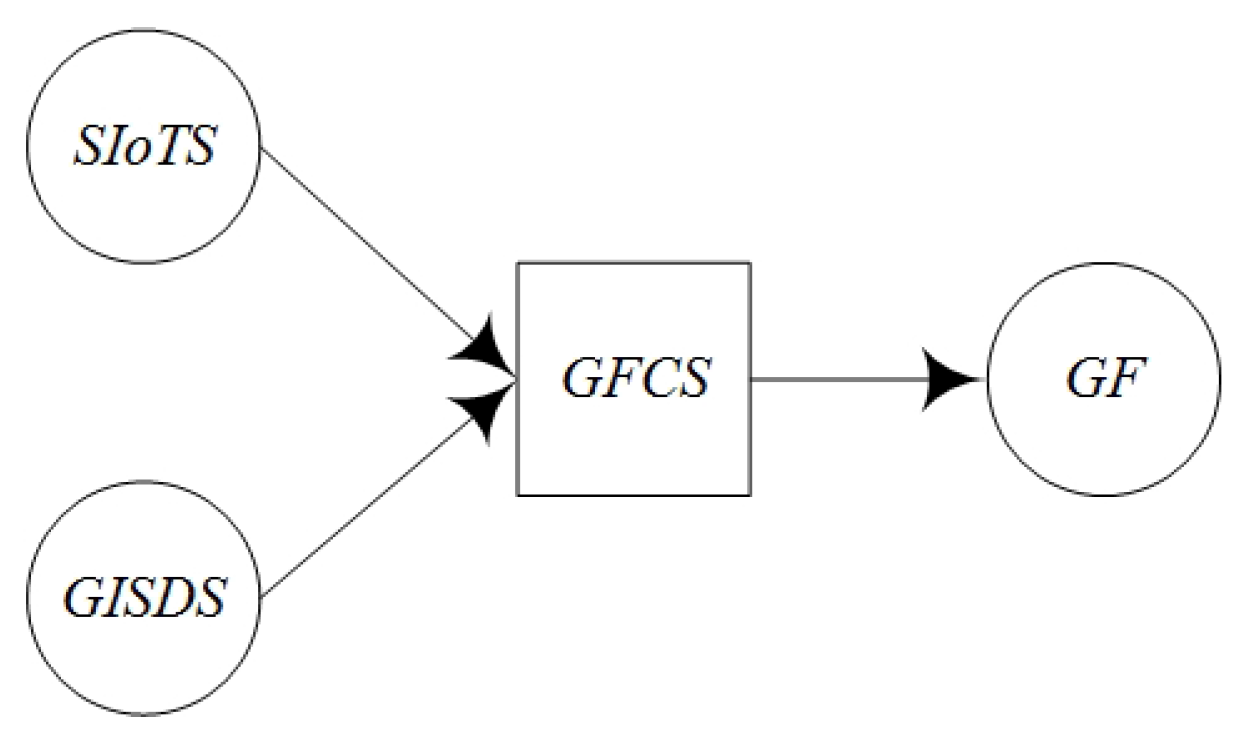
- and are specially designed for the GIS-oriented IoT service. IoT services consist of the sensing service and the controlling service. The sensing service can be regard as a kind of data service. When multi data services provide input for another service, operator ⊢ can be used. For example, in Figure 6A denotes that and provide input for geo-feature composition service , i.e., . Figure 6B denotes that through geo-feature mapping service , the control commands are mapped to the corresponding controlling services and , i.e., .
- (1)
- Services Commutative Law
- (2)
- Services Associative Law
- (3)
- Services Distributive Law
4.2. Sensing Service Composition
- (1)
- is the sensing service, is the GIS data service which is involved in the composition of geo-feature. is optional. is the service which compose and to geo-feature.
- (2)
- is the unique identifier of this composed service.
- (3)
- is the invocation of the composed service.
- (4)
- is a set of its component services including , , .
- (5)
- is the description of the quality of service.
- (6)
- is the semantic function description.
- (7)
- where:
- Σ is a color set. It denotes the geo-feature type, data service type and other information type. The definition of colors includes:Color : the input sensing service,Color : the input GIS data service,Color : the output geo-feature.
- P is a finite set of places. , i is the input place set, o is the output place set. Because there is no service calling the data service so . Because the goal of the sensing service composition is to provide the input for the next process, so
- T specially denotes the (geo-feature composition service) which composes multi sensing services to geo-feature. T consist of two actions including: (1) the composition action, which composes the information from the sensing service and the GIS data service to the geo-feature; (2) the action of completing data. The device service has instability. Some services may be suddenly failed and could not provide services. Then it is needed to complete the lost data. There are two ways to complete the lost data. One is to interpolate the information of the adjacent sensors in geographical space through spatial analysis. The other is to use the historical data of the service and the context.
- F is arc set,
- E is arc function set, .
- C is color function, .
- G is the guard function which is defined according to the specific application scenarios. G can determine whether the service could be executed.
- I is the initialization function which can confirm the initial conditions, is the initial mark produced by the color value of every place.
4.3. GIS Processing Service Composition
- (1)
- is the unique identifier of this new composed processing service.
- (2)
- is the invocation of the composed service.
- (3)
- is a set of its component services including , .
- (4)
- is the description of the quality of service.
- (5)
- is the semantic function description.
- (6)
- where:
- . Let i is the input set of the new service, o is the output set of the new service, then . The relations of and consist of four kinds including . denotes that is, the output of is the input of and can meet the requirements of . denotes , that is, the output of PS1 is more than the input of and can meet the requirements of . denotes , that is, the output of is less than the input of and cannot meet the requirements of ; need the input from other services. overlap denotes , that is, the output of is overlap with the input of , and cannot meet the requirements of ; need the input from other services.
- is the added control transition which is used to compose and to a new service.
- I is initialization function, and has the same definition with the I in Definition 6.
- (1)
- is the unique identifier of this new composed processing service.
- (2)
- is the invocation of the composed service.
- (3)
- is a set of its component services including , .
- (4)
- is the description of the quality of service.
- (5)
- is the semantic function description.
- (6)
- where:
- Let i is the input set of the new service, o is the output set of the new service, then or
- are the added control transitions which are used to compose to a new service.
- .
- I is initialization function, and has the same definition with the I in Definition 6.
- (1)
- is the unique identifier of this new composed processing service.
- (2)
- is the invocation of the composed service.
- (3)
- is a set of its component services including , .
- (4)
- is the description of the quality of service.
- (5)
- is the semantic function description.
- (6)
- where:
- .
- Let i is the input set of the new service, o is the output set of the new service, then
- are the added control transitions which are used to compose to a new service.
- .
- I is initialization function, and has the same definition with the I in Definition 6.
- (1)
- is the unique identifier of this new composed processing service.
- (2)
- is the invocation of the composed service.
- (3)
- is a set of its component services including several .
- (4)
- is the description of the quality of service.
- (5)
- is the semantic function description.
- (6)
- where:
- .
- Let i is the input set of the new service, o is the output set of the new service, then
- are the added control transitions which are used to execute repeatedly.
- .
- I is initialization function, and has the same definition with the I in Definition 6.
4.4. Controlling Service Mapping
- (1)
- is the service which maps the control commands from geo-feature to the corresponding controlling IoT services. is controlling service which can change the state of geo-entity.
- (2)
- is the unique identifier of this new composed mapping service.
- (3)
- is the invocation of the composed service.
- (4)
- is a set of its component services including .
- (5)
- is the description of the quality of service.
- (6)
- is the semantic function description.
- (7)
- where:
- Σ is a color set, It denotes the input geo-feature and the output controlling service. The definition of colors includes:Color : the output controlling service,Color : the input geo-feature.
- P is a finite set of places. i is the input place set, o is the output place set.
- T specially denotes the (geo-feature mapping service) which maps the control commands of the input geo-feature to the controlling services and trigger them. T consists of three actions including: (1) the action which maps the control commands to the controlling services; (2) the action which triggers these controlling services; (3) the action which solves the problem of failed service call caused by the instability of IoT services.
- F is arc set,
- C is color function,
- G is the guard function which is defined according to the specific application scenarios. G can determine whether the service could be executed.
- E is arc function set,
- I is initialization function, and has the same definition with the I in Definition 6.
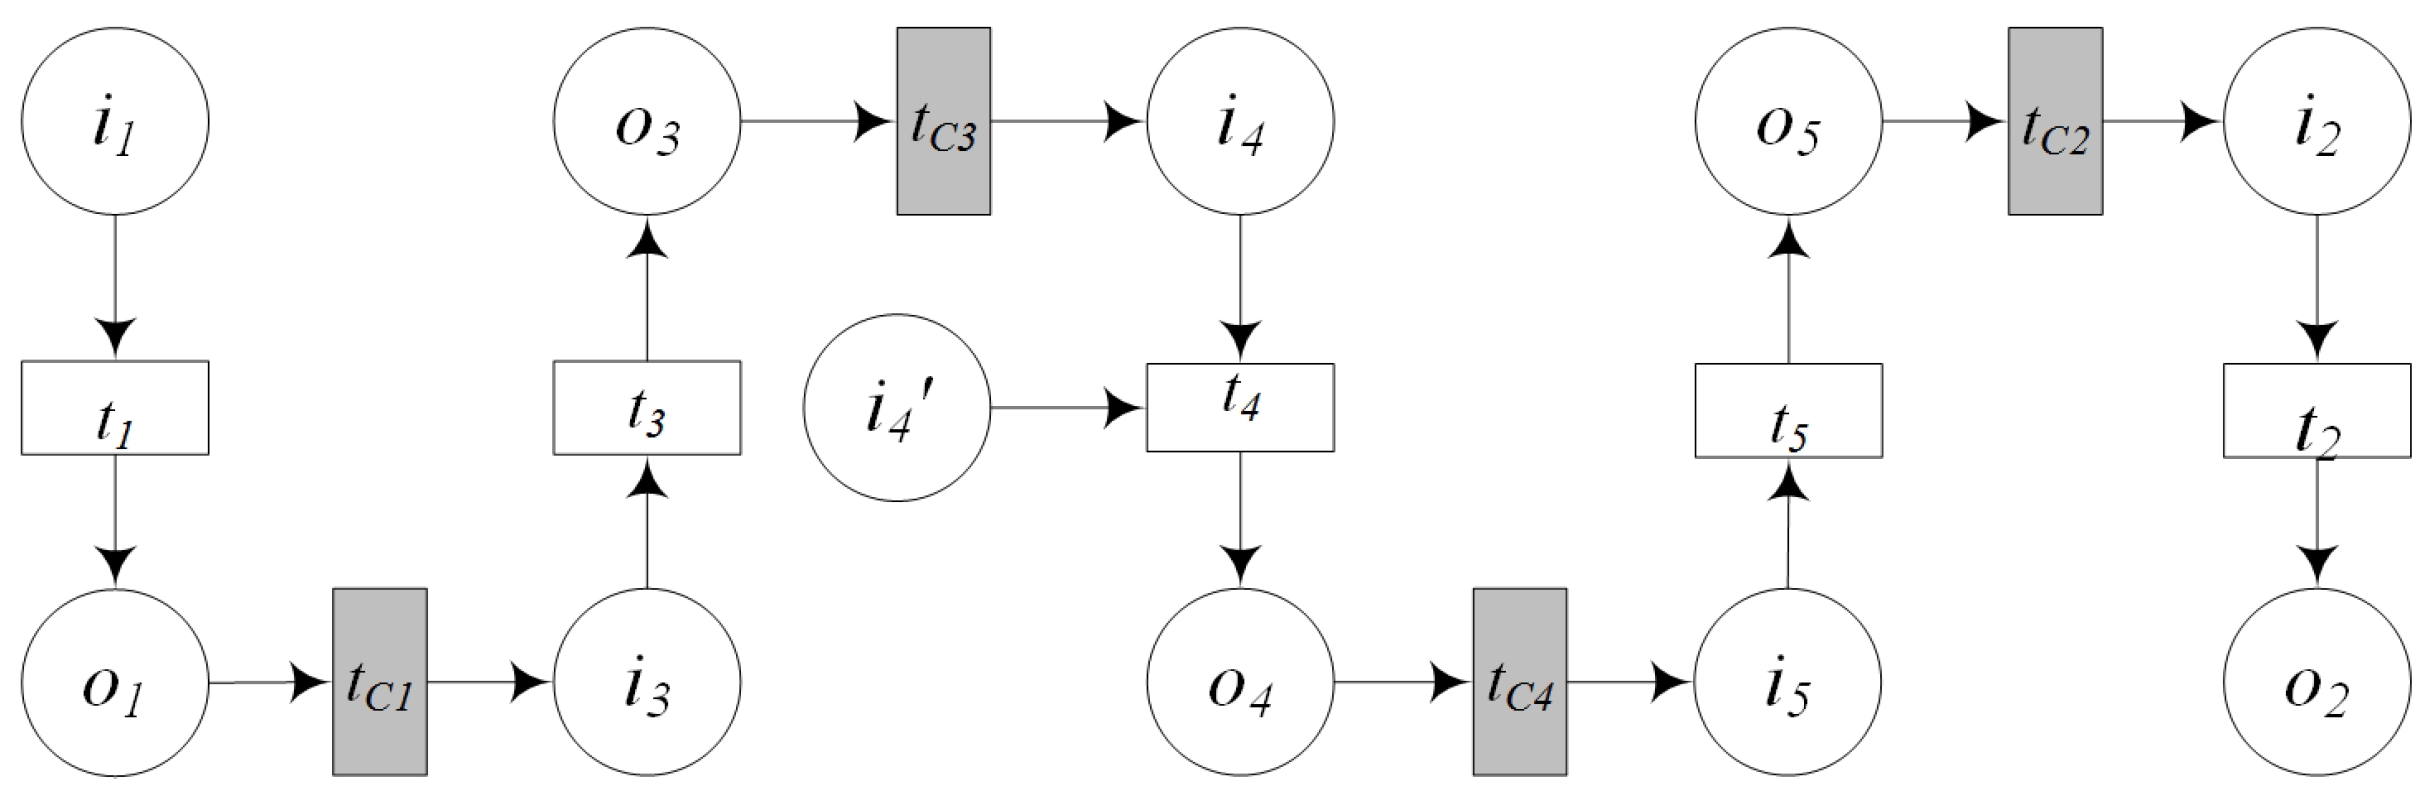
4.5. GIS-Oriented IoT Service Application Model
- (1)
- Σ is the color set in GIS-oriented IoT service application. The definition of colors includes:Color : the input sensing IoT service,Color : the output controlling IoT service,Color : the input GIS data services,Color : the output geo-feature,Color : the input and output other information types, such as number, string.
- (2)
- P is a finite set of places. Let i is the input places, o is the output places.
- (3)
- T is a finite set of transitions. There are two kinds of transitions in GIS-oriented IoT service application. One kind is the transition inside a service, which is called service transition . It is the operation inside a service. The other kind is control transition which is the composition operation between services and used for the connections between services. . In Figure 13,
- (4)
- F is a finite set of arc. In Figure 13,
- (5)
- C is a color function set, In Figure 13, .
- (6)
- G is a guard function set,
- (7)
- E is an arc function set, In Figure 13,
- (8)
- I is initialization function, and has the same definition with the I in Definition 6.
5. Modeling Example
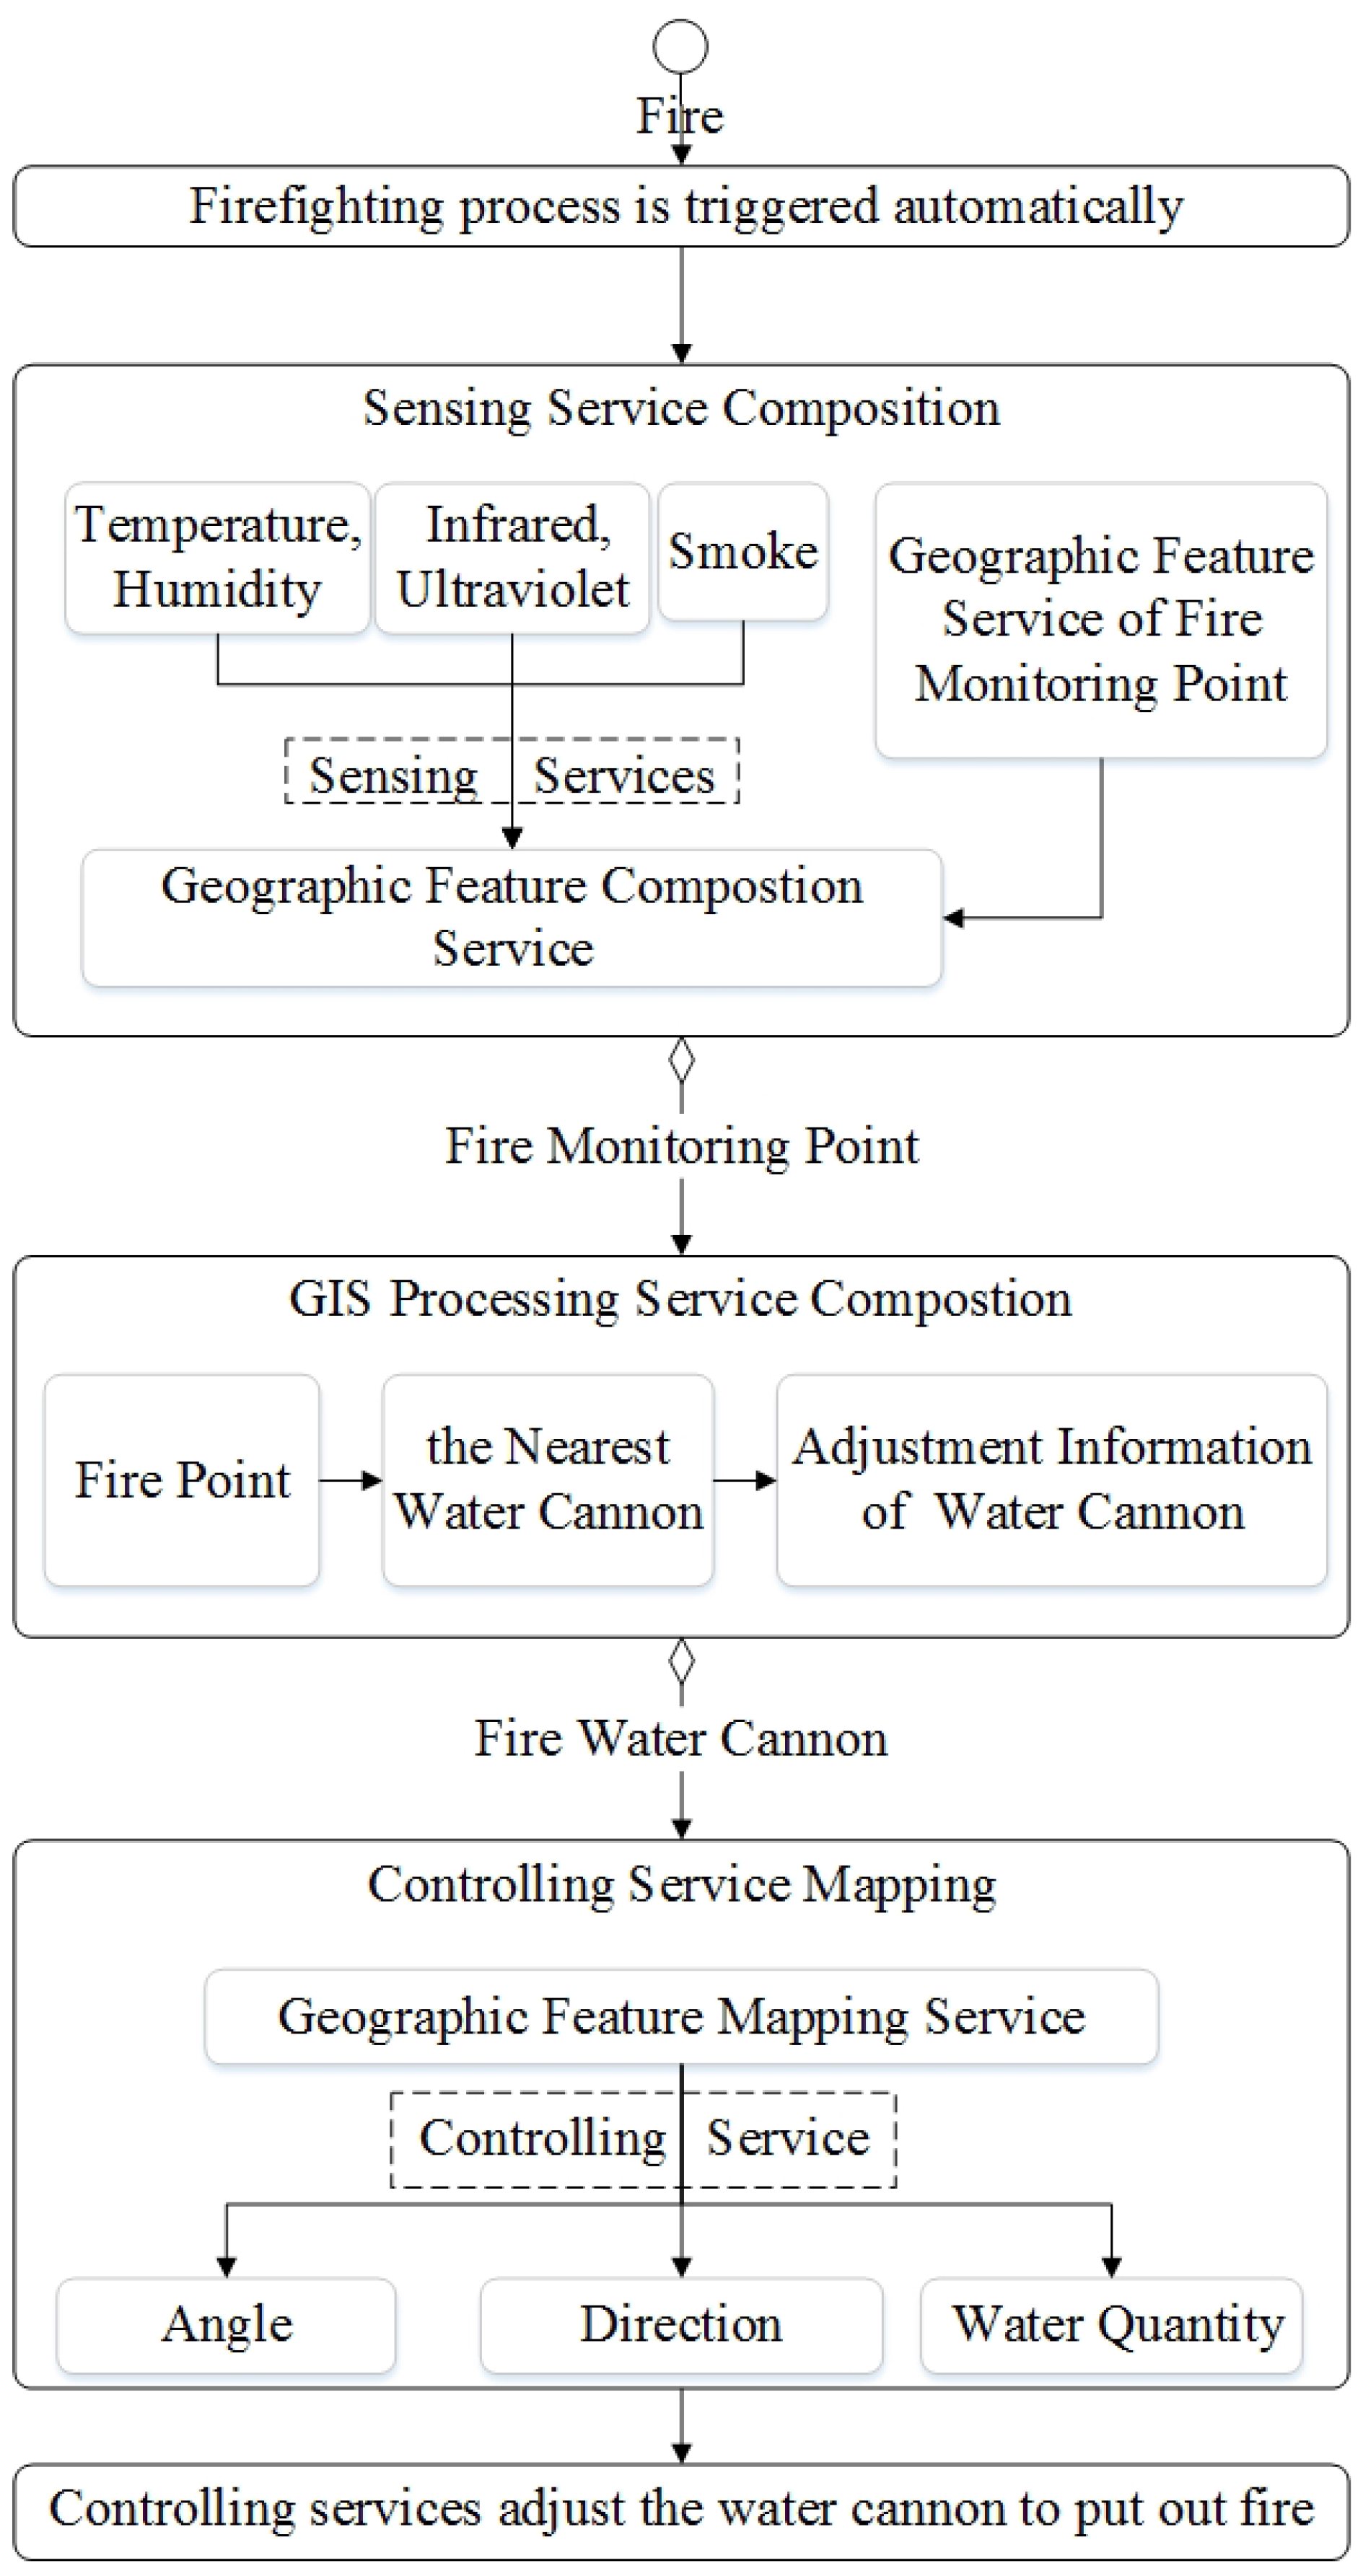
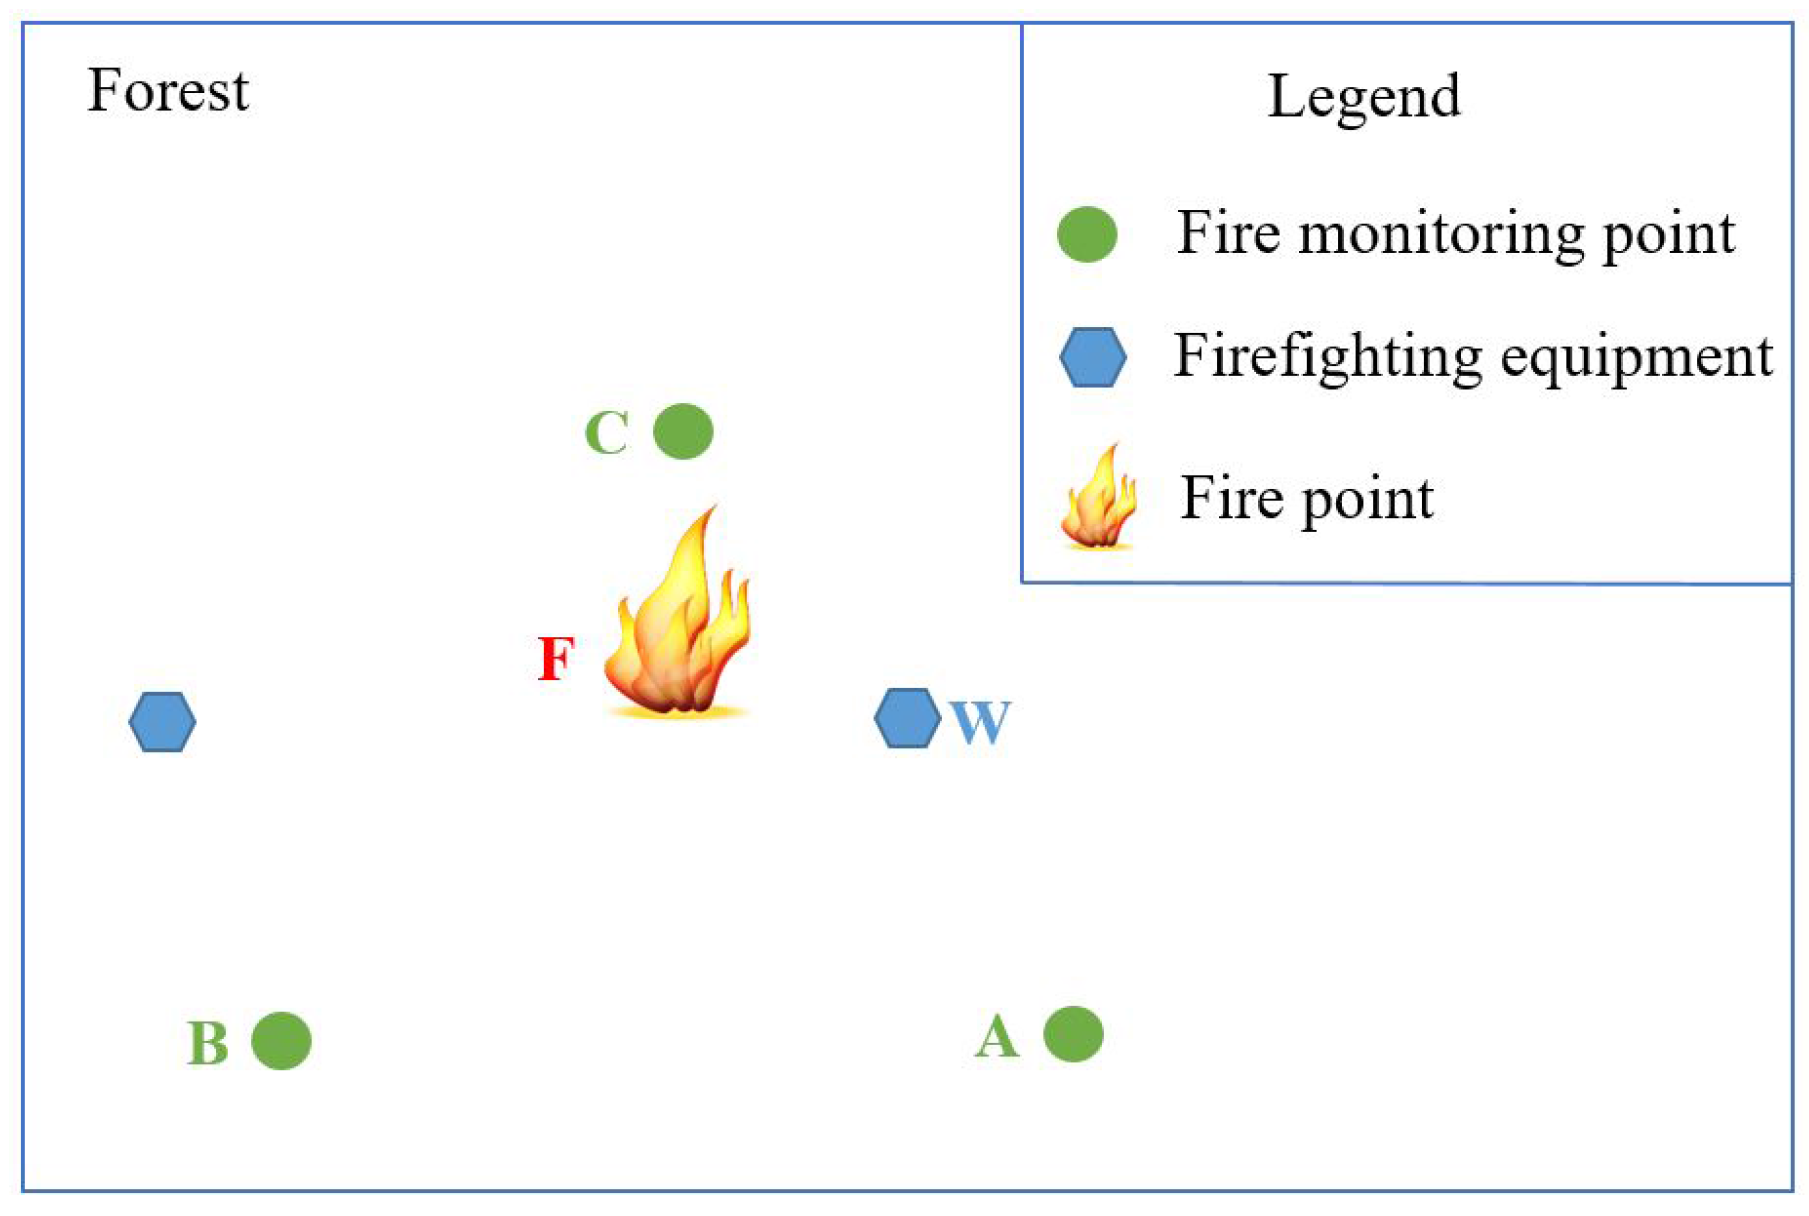
5.1. Description of Forest Fire Simulation Scenario
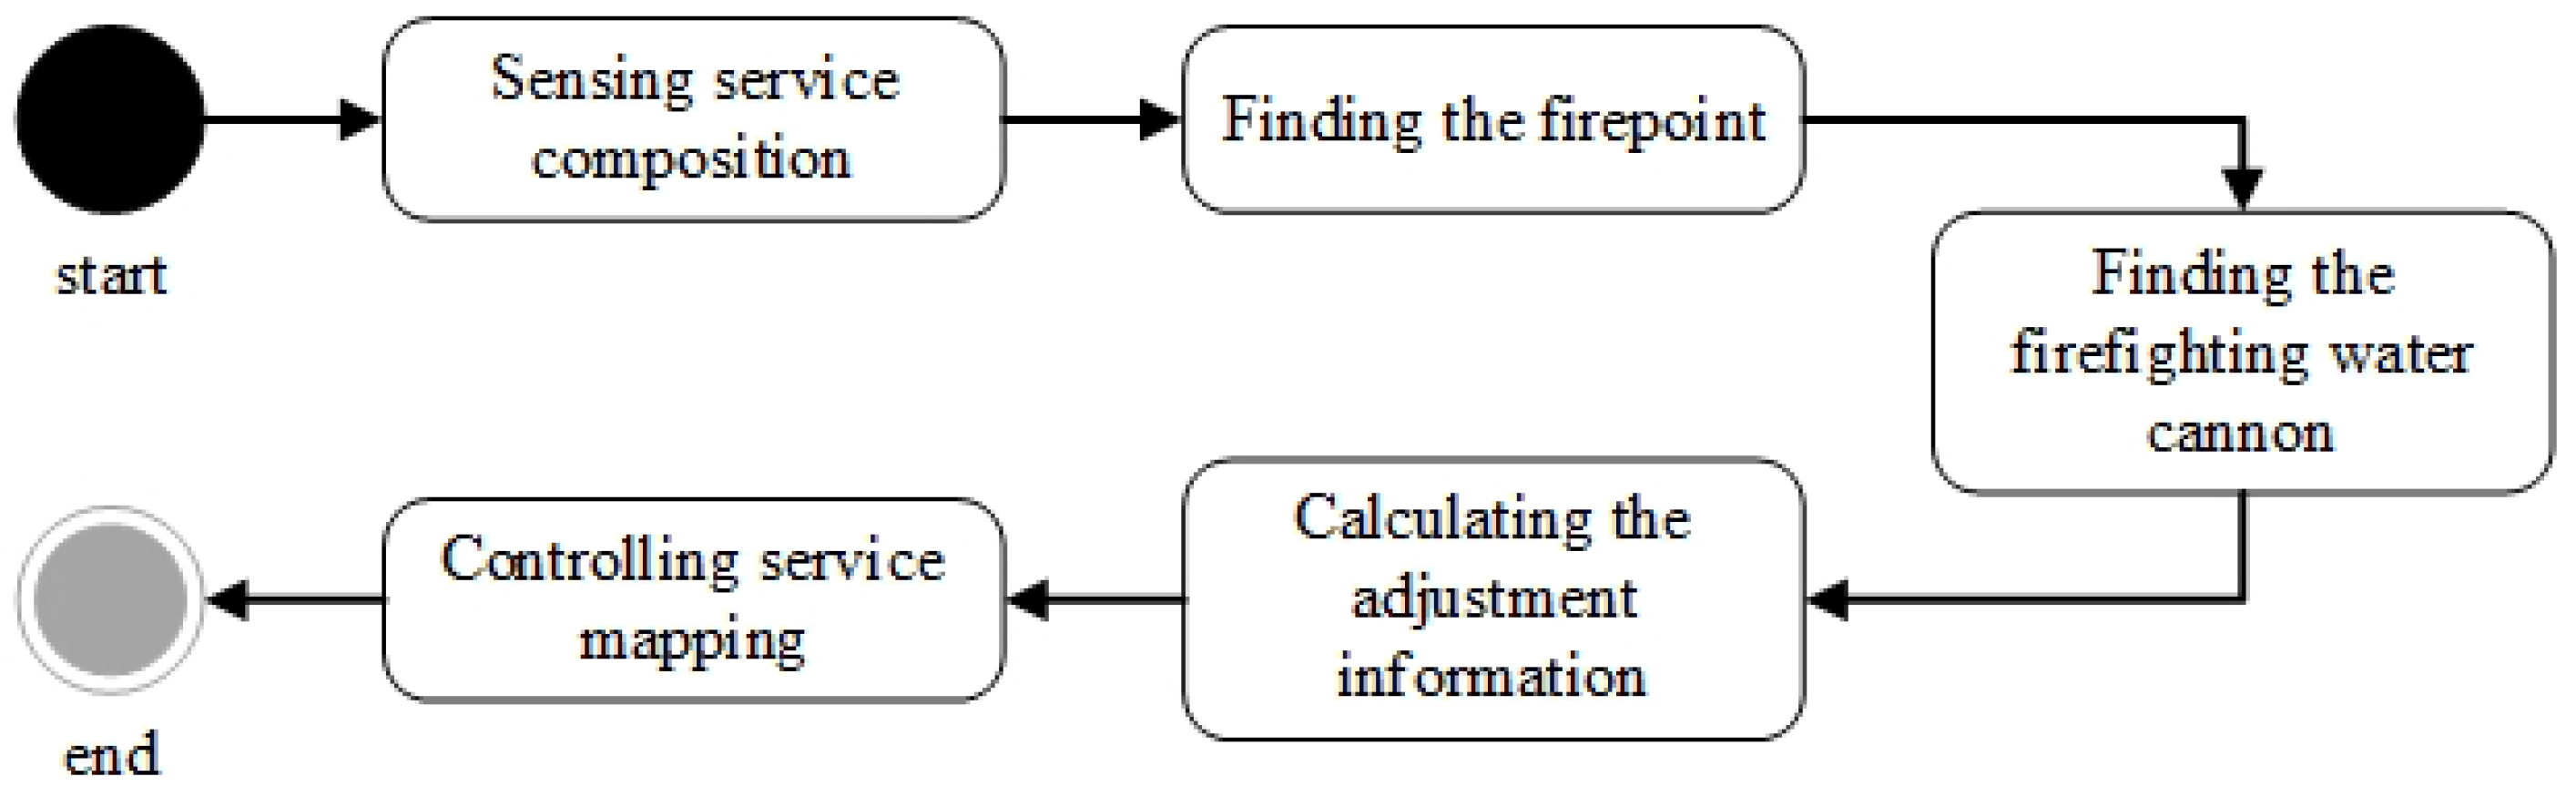
- (1)
- According to the location of three sensing sensor and the detected information of temperature, humidity, infrared, ultraviolet and smoke from and C, the fire point location F is found by spatial analysis.
- (2)
- According to the location of the fire point F, the nearest firefighting water cannon W is found by the buffer analysis and the nearest distance analysis.
- (3)
- By the spatial analysis of the temperature, humidity and other information of three monitoring points and the distance between the fire point F and the firefighting water cannon W, the adjustment information of water quantity, direction and angle of the firefighting water cannon is caculated.
- (4)
- The adjustment information is used to adjust the firefighting water cannon W. The firefighting water cannon W is instructed to adjust the water quantity, direction and angle to put out fire.
5.2. Modeling
5.2.1. Assumptions
- (1)
- Each of the fire monitoring point and the firefighting water cannon is regarded as a geo-entity. There are two GIS data services for these two kinds of equipment. However, the geo-feature set in the GIS data service of fire monitoring point only has some basic attributes such as location coordinate, ownership, installation date and so on. The attributes of temperature and humidity and other real-time information must be obtained from the related device service. The related GIS data services consist of the fire monitoring point service and the firefighting water cannon service .
- (2)
- Each fire monitoring point is equipped with temperature and humidity sensor, infrared and ultraviolet sensor, smoke sensor. These devices can provide temperature and humidity service (), infrared and ultraviolet service (, smoke service (). Then in the figure, the services from fire monitoring point include , , , , , , , ,
- (3)
- There are two assisted services: geo-feature composition service and geo-feature mapping service .
- (4)
- The firefighting water cannon can provide controlling services, that is, the controlling services can be called to control the state of this firefighting water cannon to put out fire automatically. The states including angle (), direction () and water quality () of this firefighting water cannon W are controlled by three controlling device services
- (5)
- The related GIS processing services consist of fire point information analysis service which is used to find the fire point, buffer analysis and nearest distance analysis service which is used to find the nearest firefighting water cannon, the state analysis service of firefighting water cannon , which is used to calculate the adjustment information of the firefighting water cannon.
5.2.2. Service Algebra Modeling
- (1)
- Sensing service composition. The sensing services (, , , , , , , , ), the related GIS data service about the same geo-entities and the geo-feature composition service are composed to output the geo-features of fire monitoring point. The expression of service algebra is:.
- (2)
- GIS processing service composition. These three spatial analysis including fire point information analysis service , buffer analysis service and the state analysis service of firefighting device are executed according to a certain order. The input of needs the output of and the GIS data service . The expression of service algebra is:.
- (3)
- Controlling service mapping. The geo-feature mapping service maps the control commands (the adjustment information of angle, direction and water quality) in the geo-feature (firefighting water cannon W) to the related controlling services . The expression of service algebra is:.
- (4)
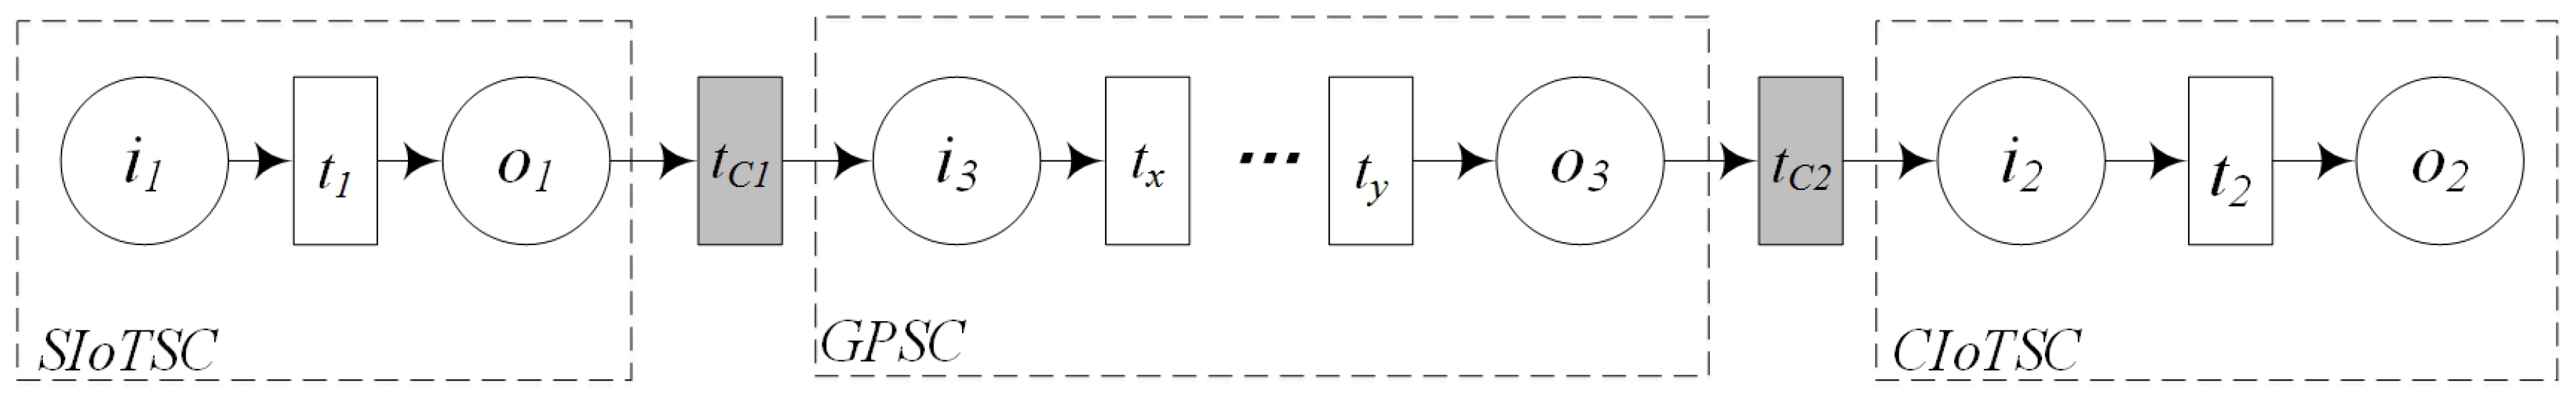
- GIS-oriented IoT service application model. The above three parts are integrated to a GIS-oriented IoT service application model. The expression of service algebra is:.
5.2.3. CPN Modeling
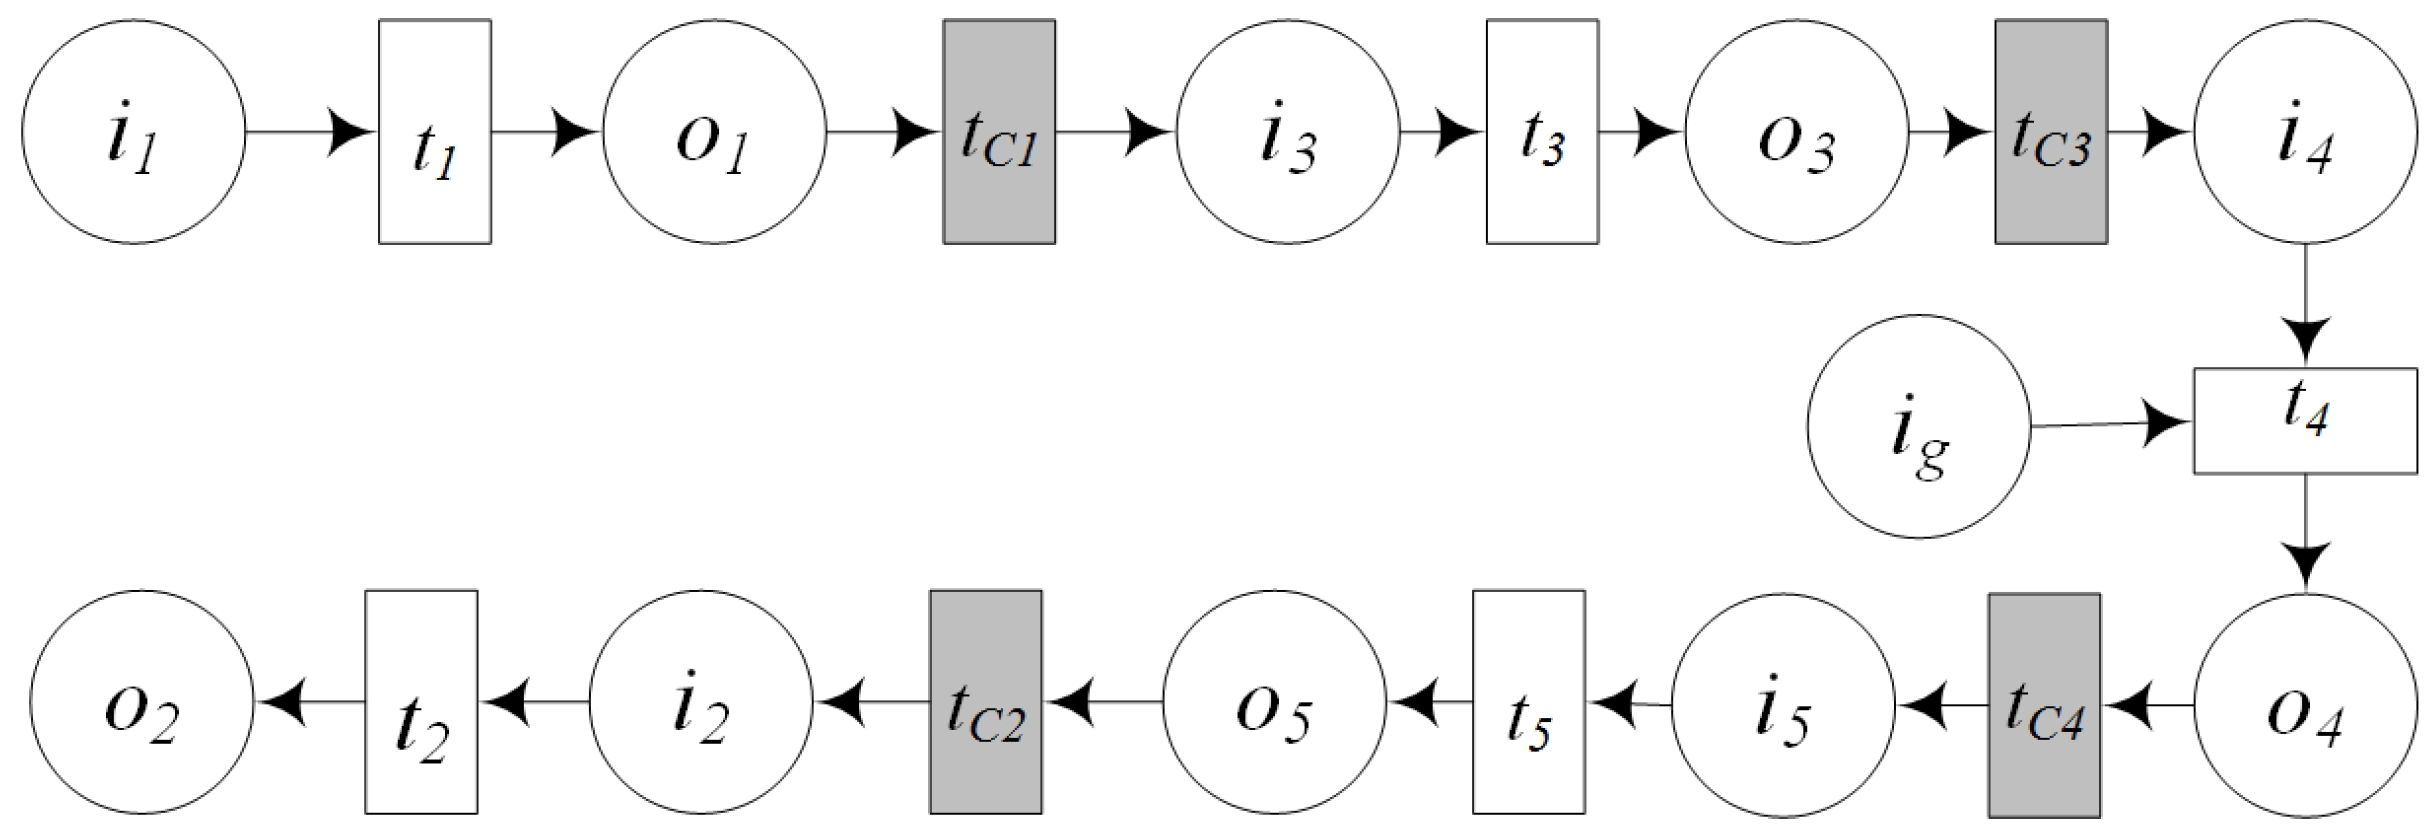
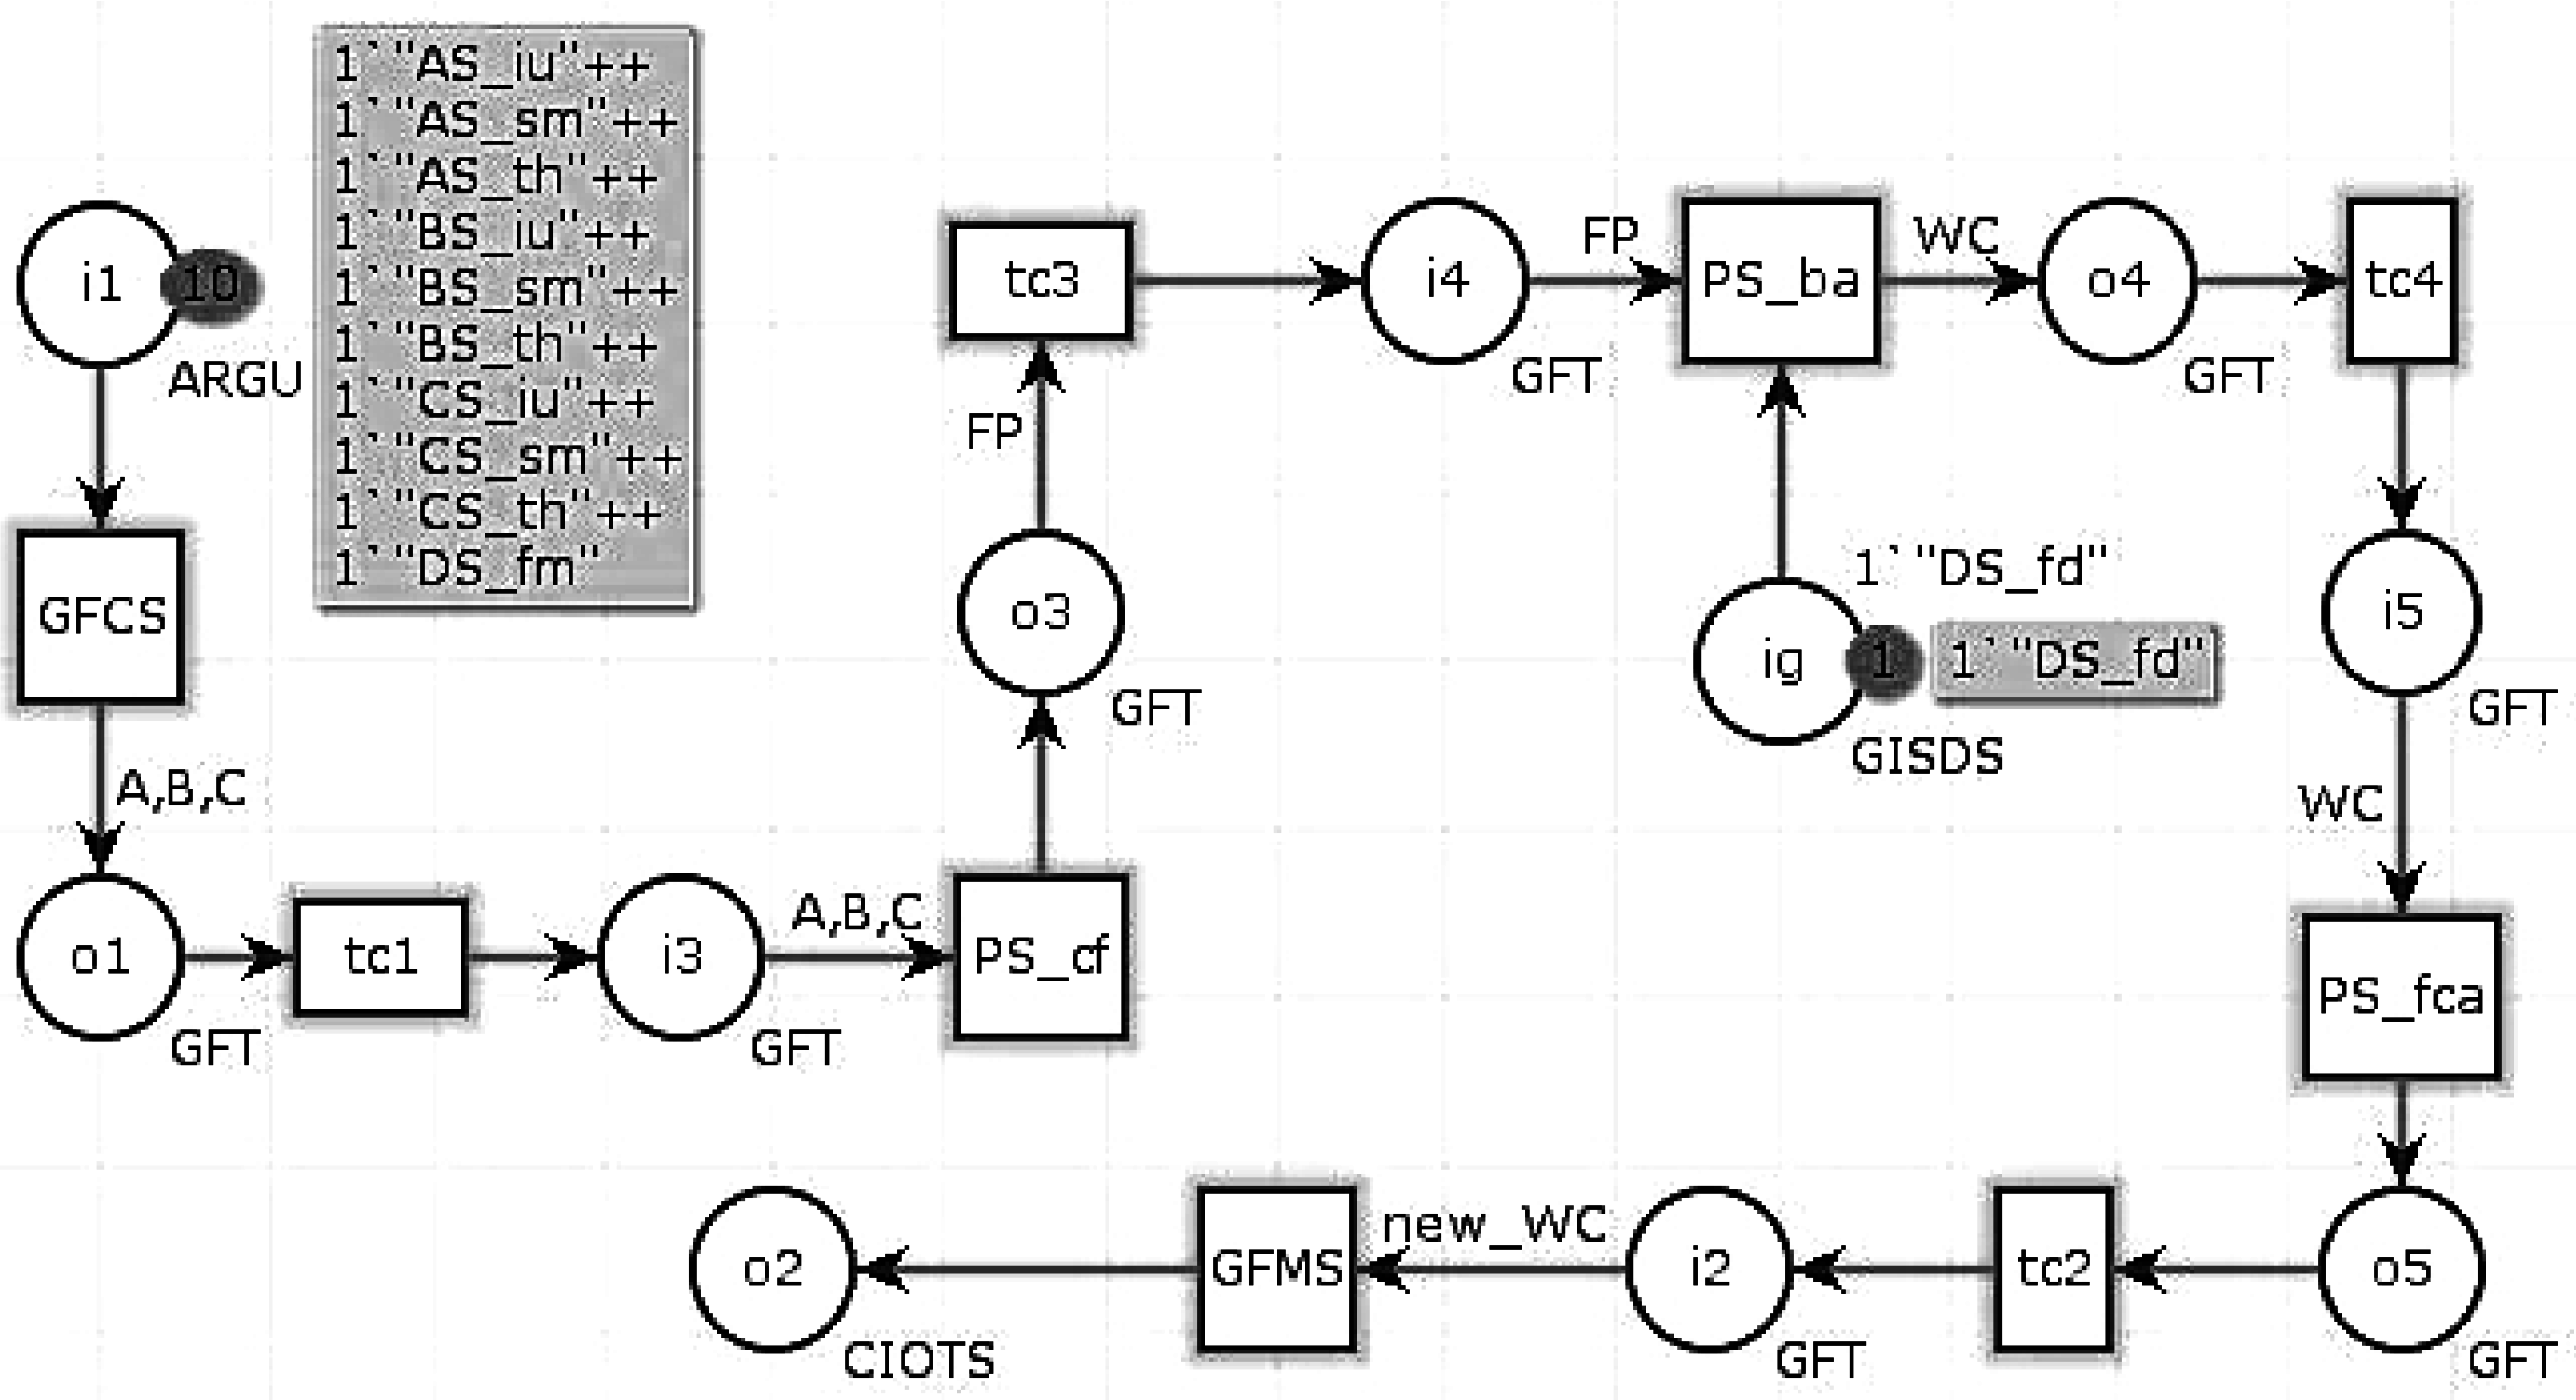
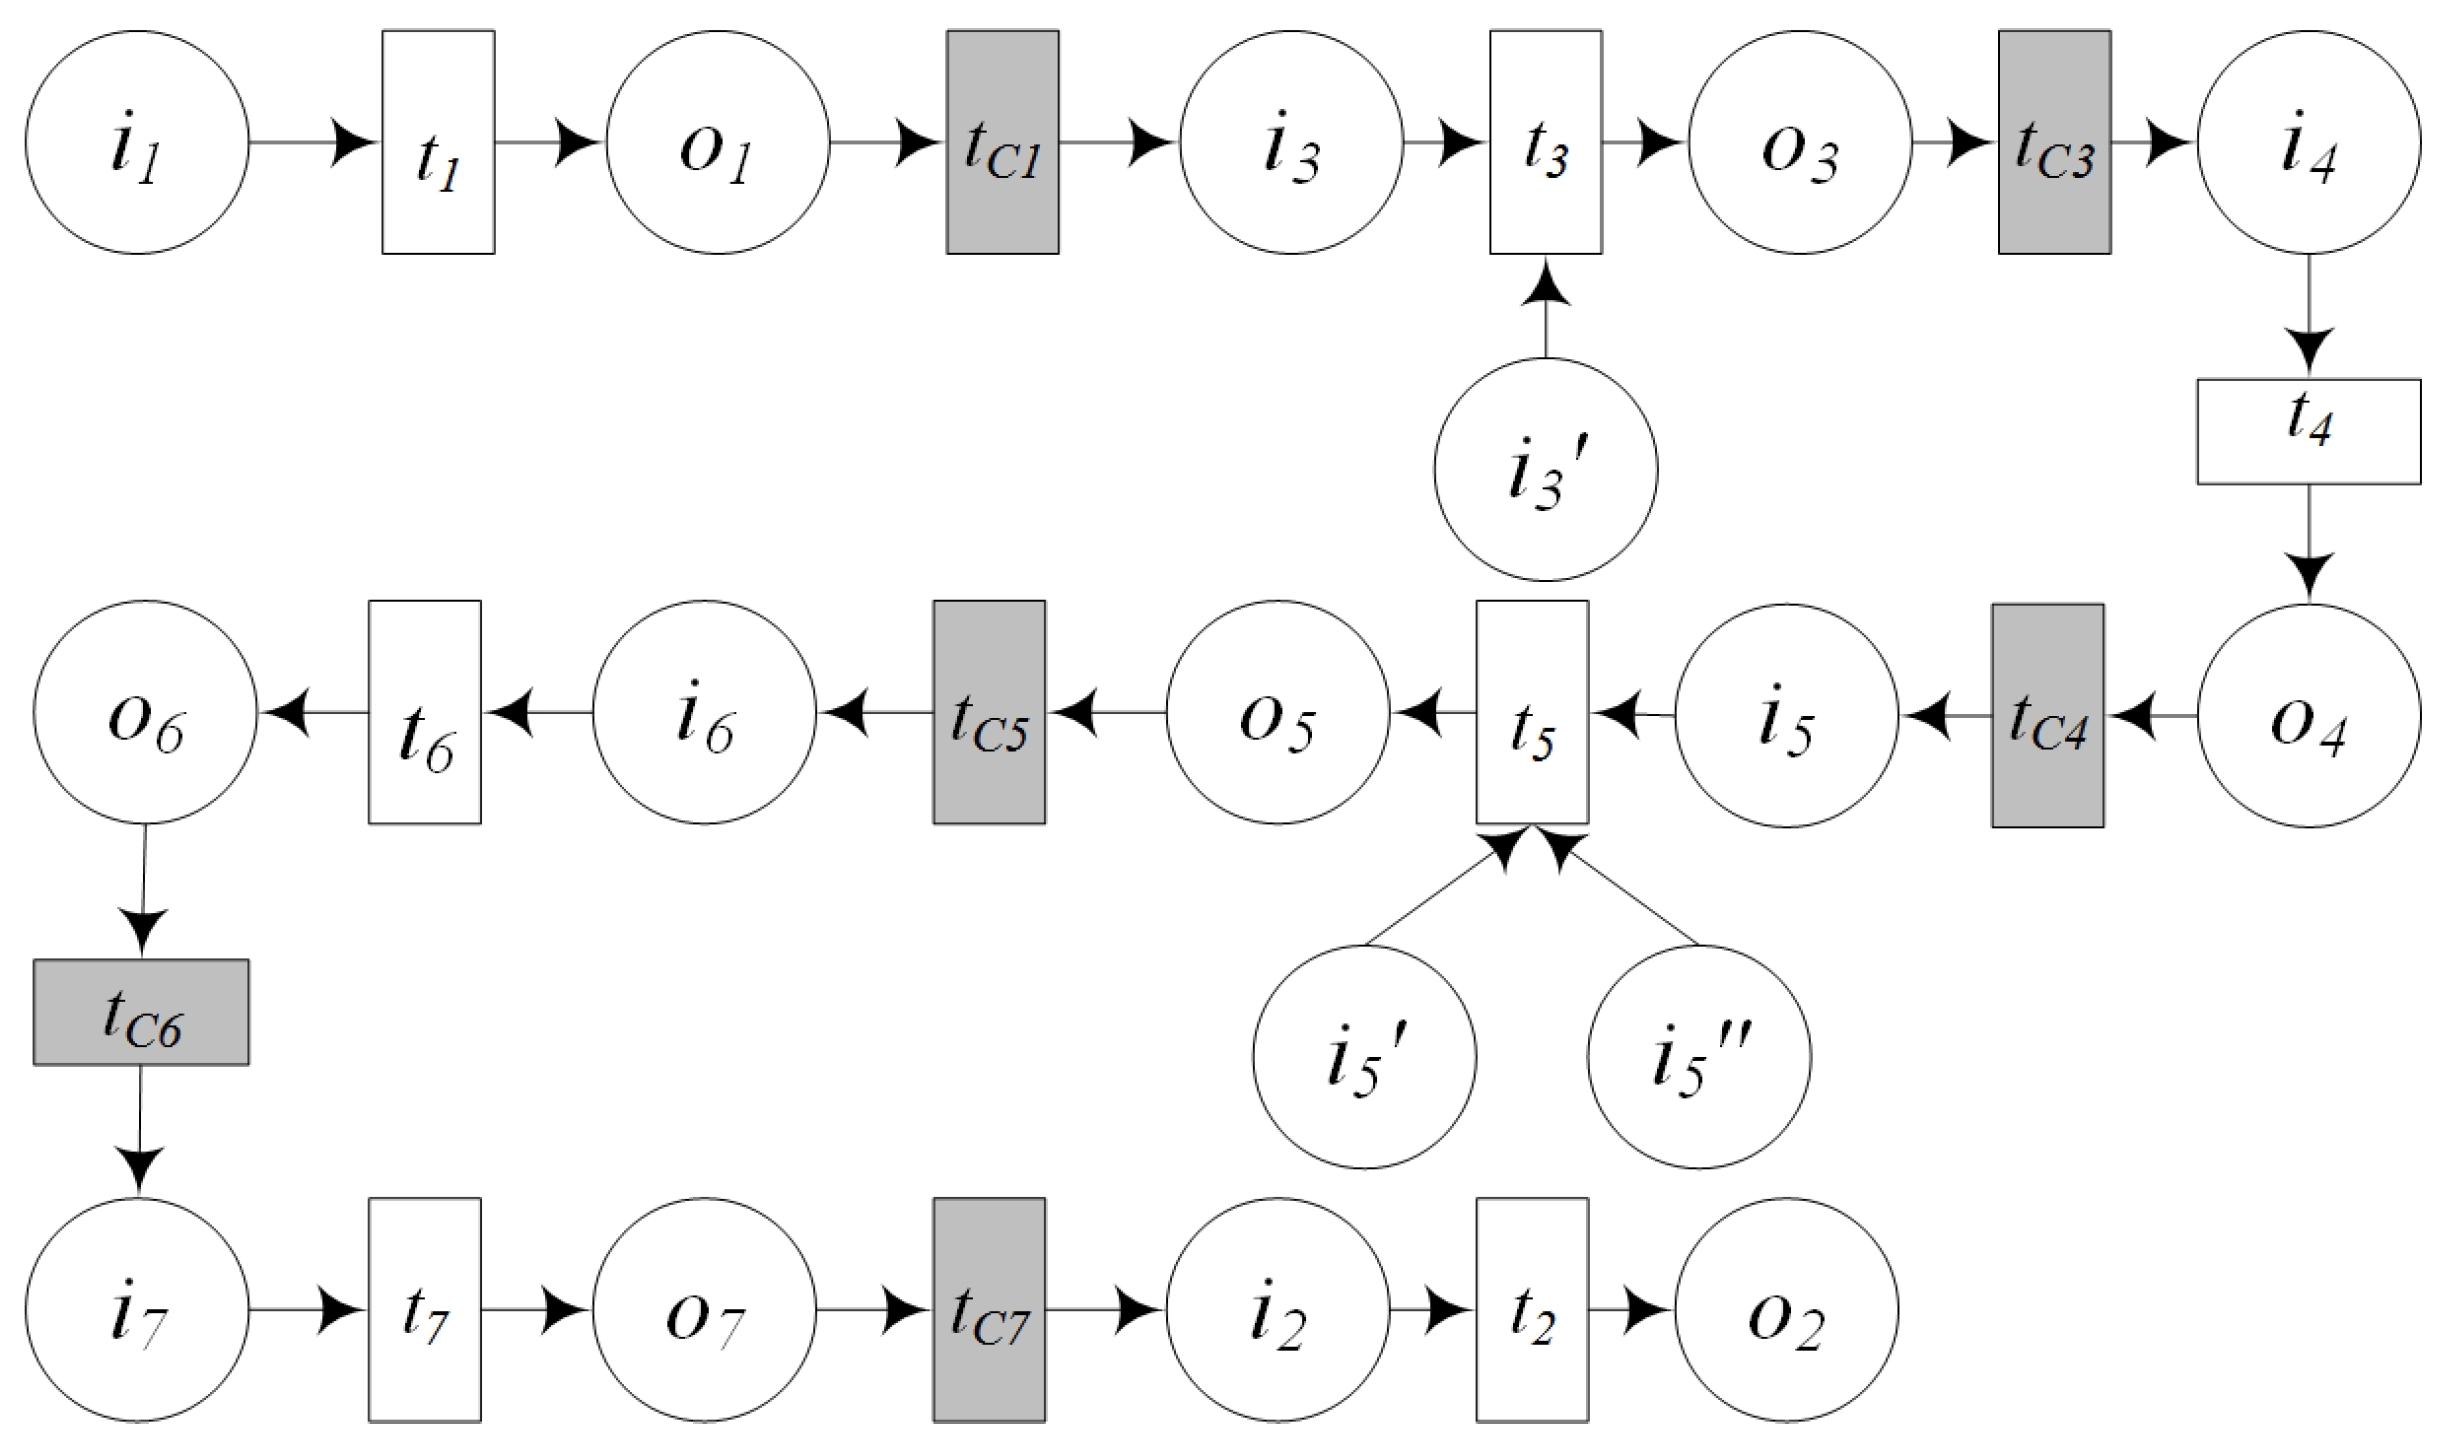
- (1)
- Sensing Service Composition. is the input of , is the output of . is the internal operations of . , , , , , , , , is the composed geo-feature set including fire monitoring points .
- (2)
- GIS Processing Service Composition.Finding the fire point. is the input of and is the geo-feature set of fire monitoring points ; is the output of and is the geo-feature of fire point F; is the internal operations of .Finding the nearest firefighting water cannon. is the input of and is the geo-feature of fire point F; is another input of and is GIS data service of firefighting water cannons; is the output of and is the geo-feature of the nearest firefighting water cannon W and fire point F; is the internal operations of .Calculating the adjustment information (control commands) of the water cannon. is the input of , and is the geo-feature of fire point F; is the output of and is the geo-feature of firefighting water cannon with control commands; is the internal operations of .
- (3)
- Controlling Service Mapping. is the input of , and is geo-features with control commands; is the mapped controlling services. is the internal operation of which mapping the control commands to the corresponding controlling device services. .
- (4)
- Other Interpretation. are control transitions, which are used to compose the adjacent services, then the former service can provide the input for the latter service.
5.2.4. Simulating by CPN Tools
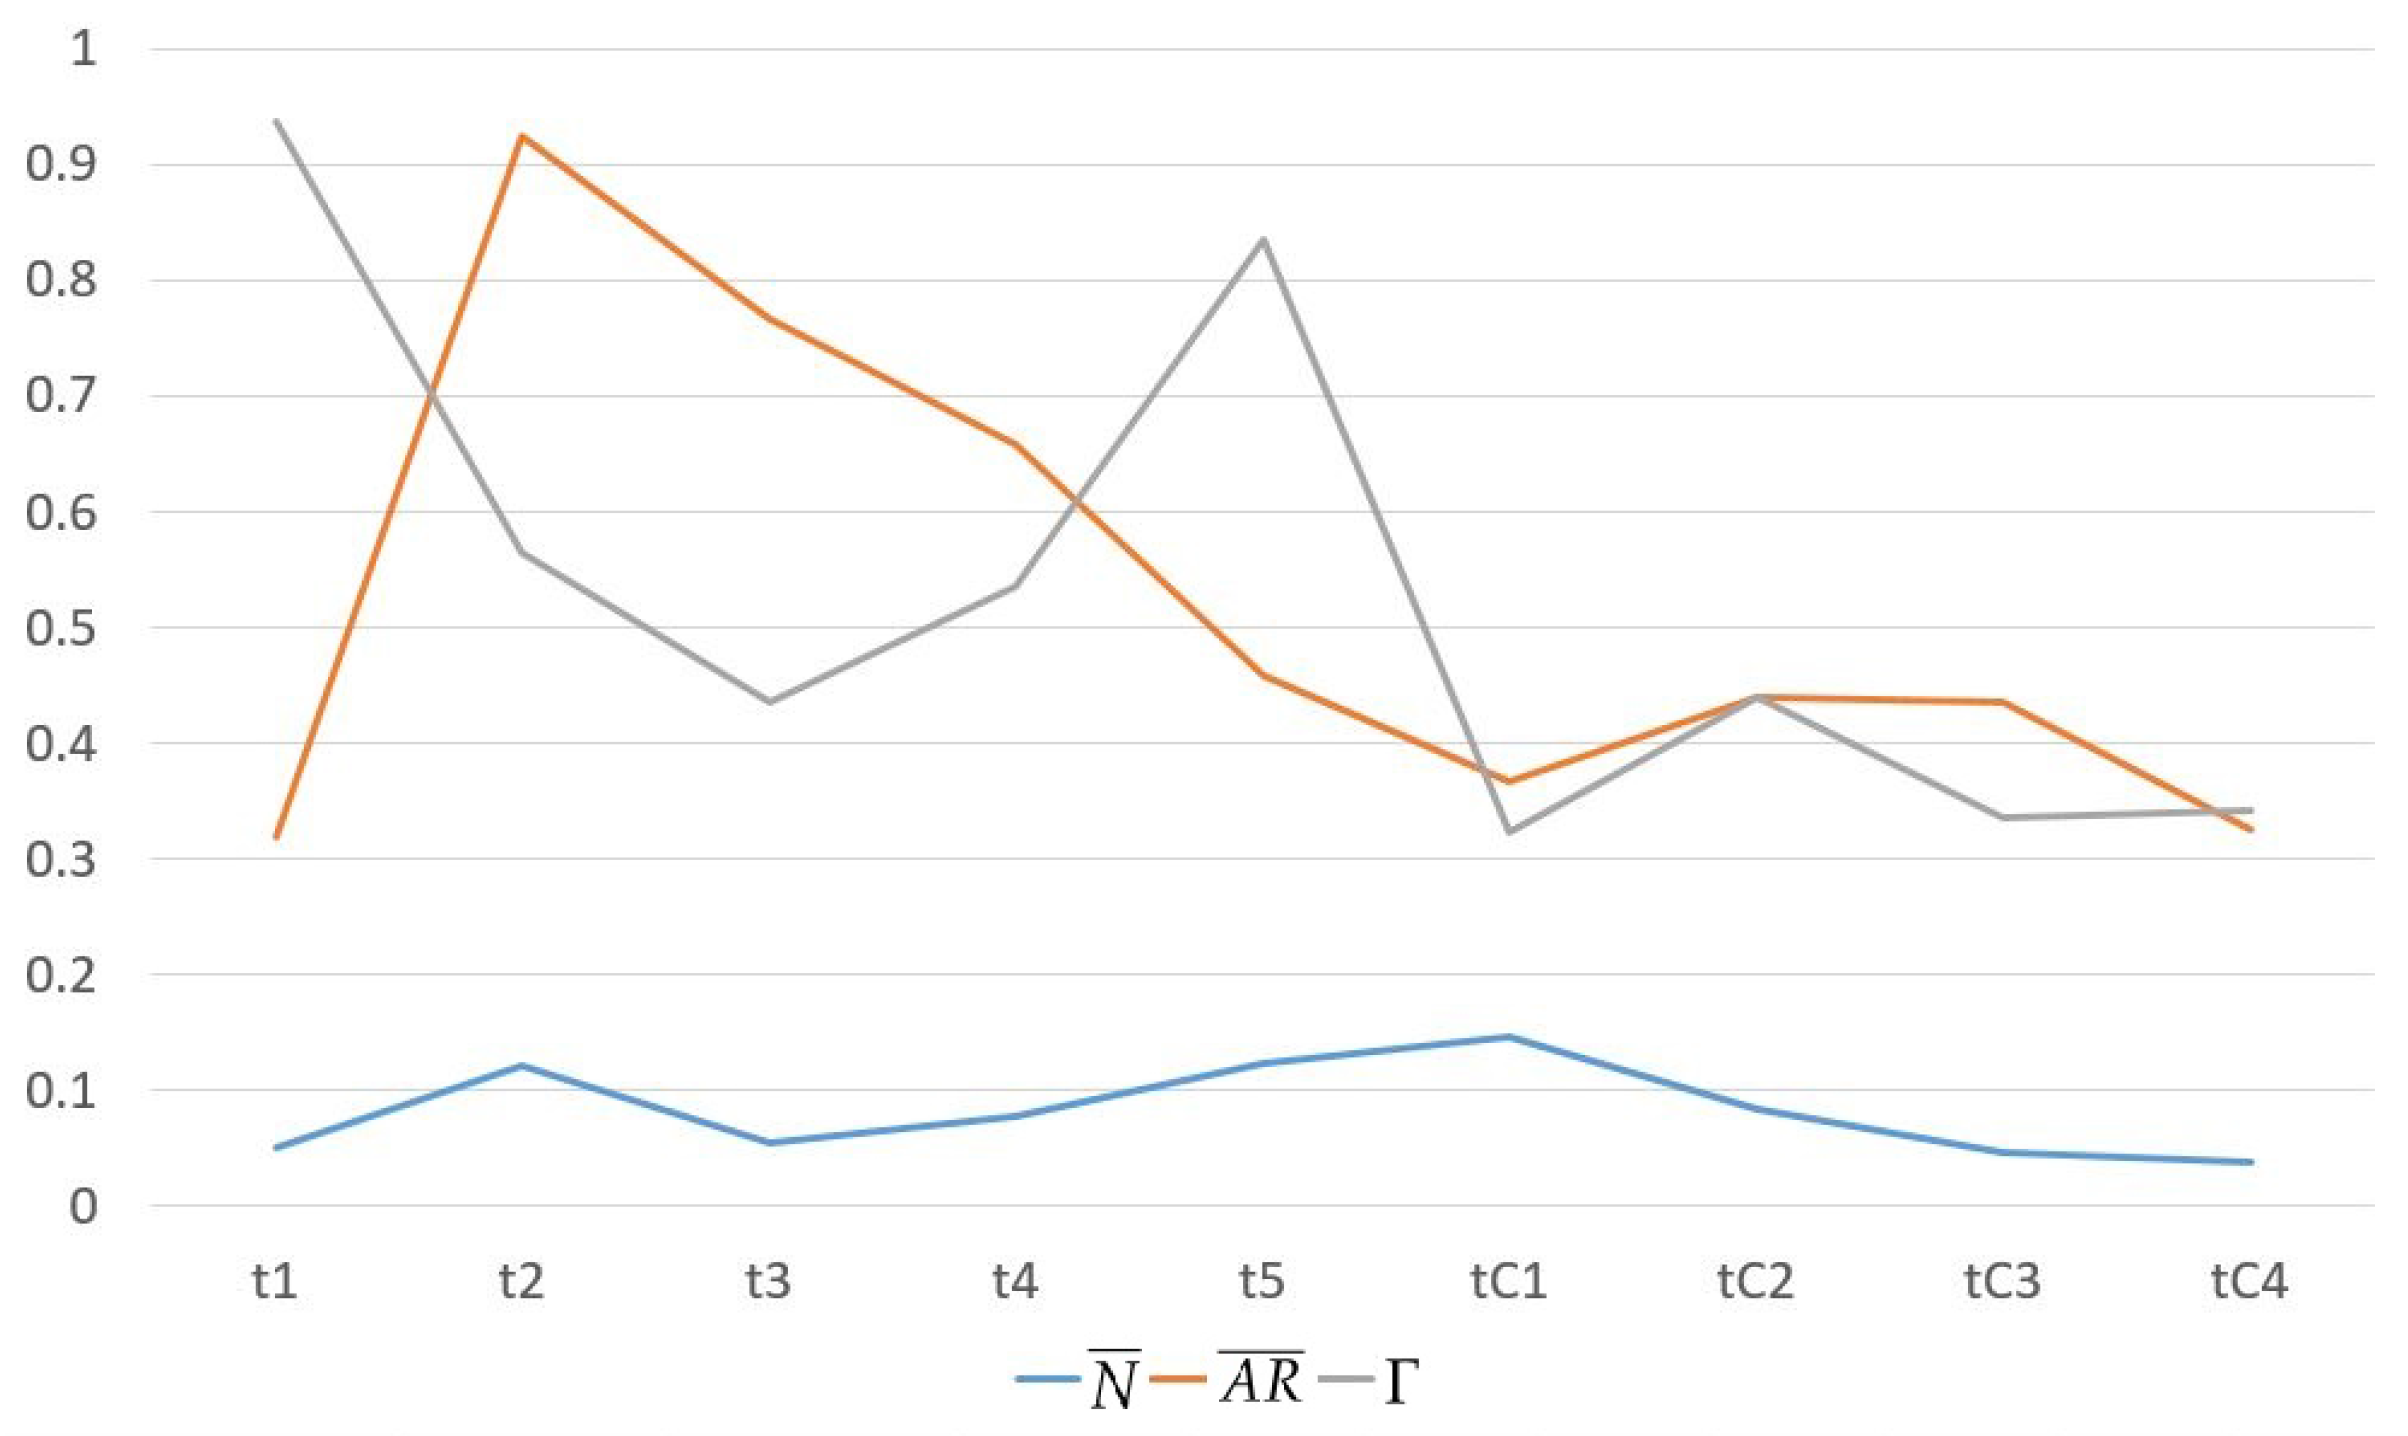
5.3. Performance of the Composition
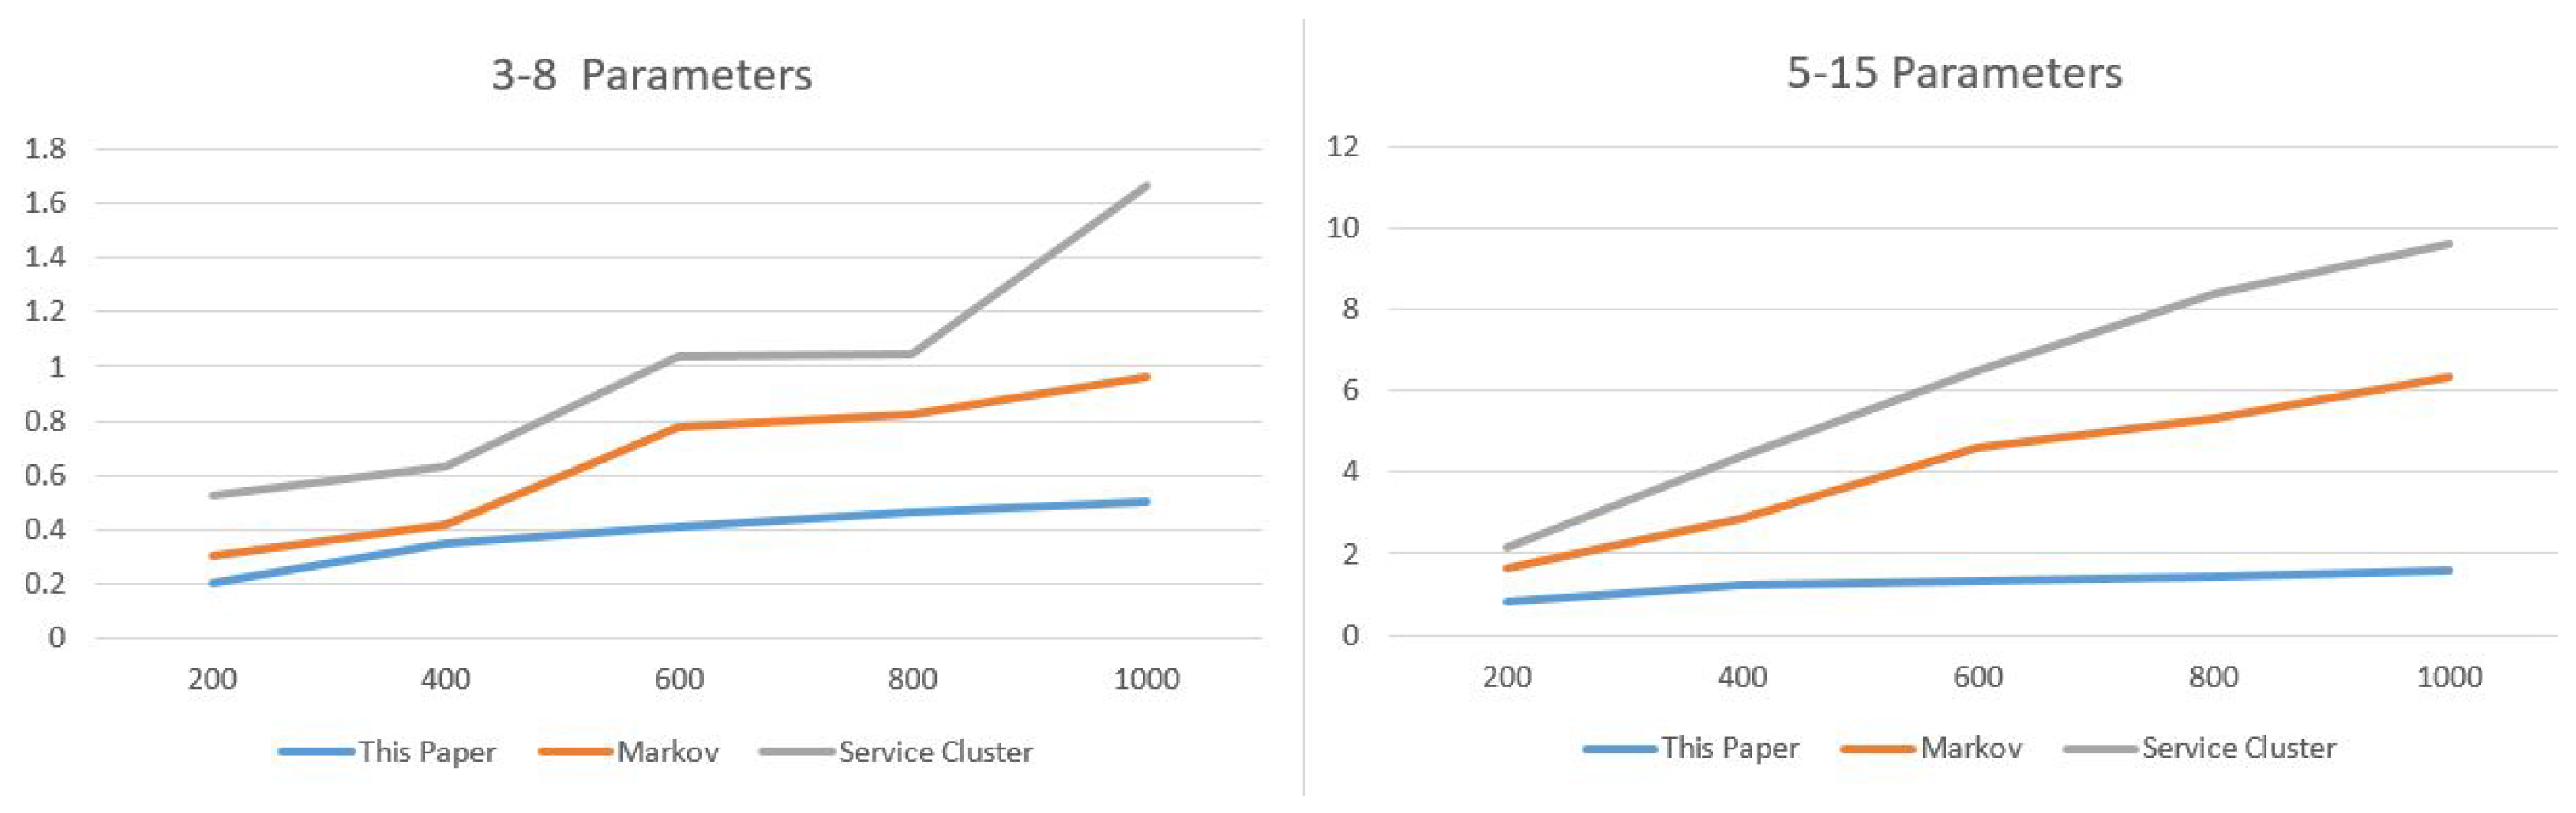
5.4. Compared with Activity Diagram Variants
5.5. Two Other Examples
5.5.1. Example of Large Parking Lot
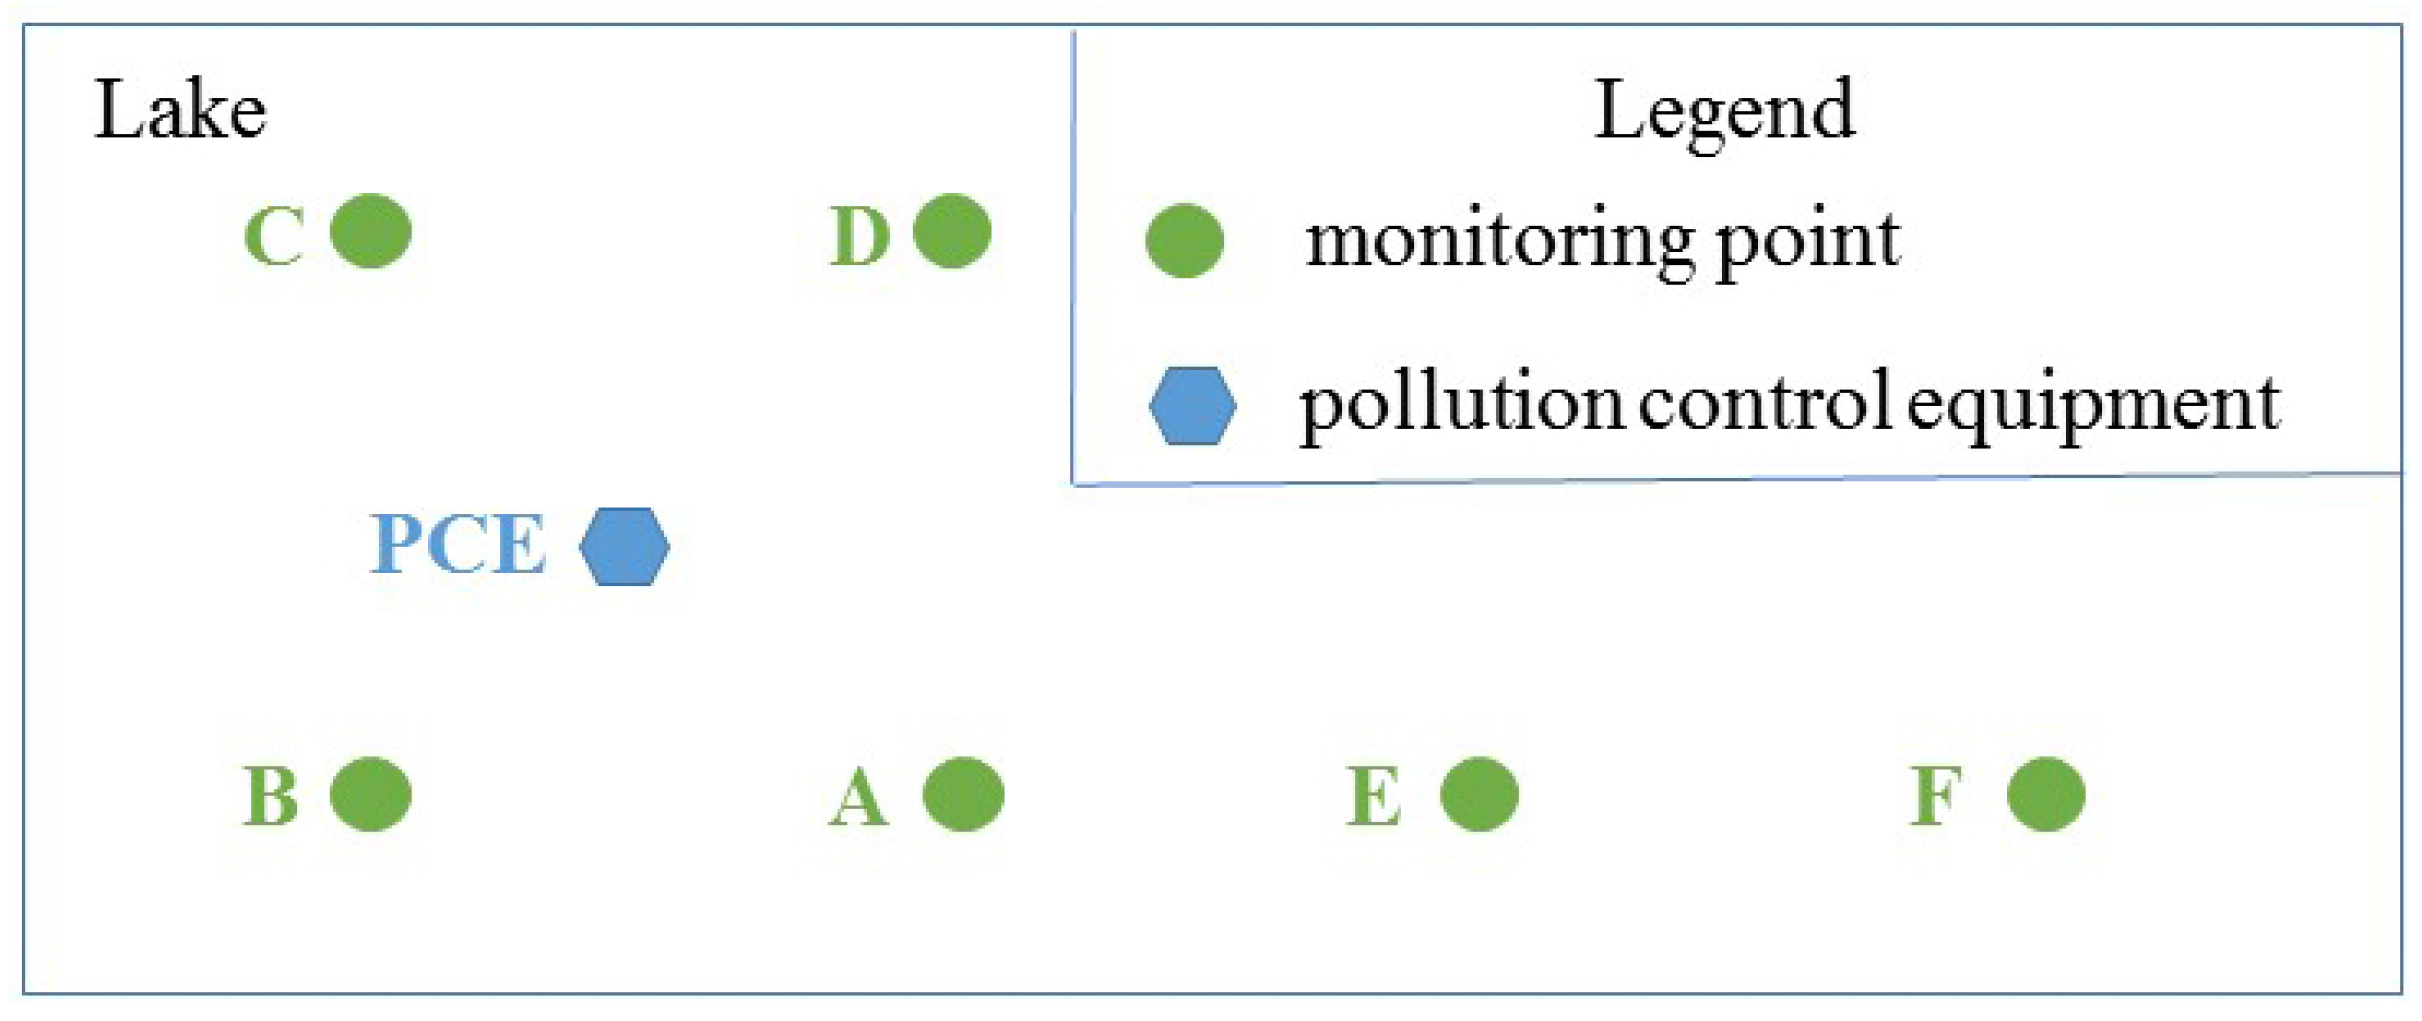
5.5.2. Example of Lake Water Pollution Control
5.6. Discussion
- (1)
- The modeling process and the established model are easy to understand and operate. The sensed object of GIS-oriented IoT service application is the geo-entity, and the basic unit of GIS spatial analysis and processing is the geo-feature. The modeling method in this paper maps the geo-entity in geographical space to the geo-feature in information space, and then maps the control commands to the geographical entity finally. In the whole business process, for both modeling staff and business application staff, the consideration is the object of geo-entity in the entire business process, and is no longer the discrete information of sensed number or string with fuzzy relations. All the sensed information related to a geo-entity is regarded as a whole object, which is more suitable for the object-oriented processing method of GIS. Therefore, this approach is very close to the business application process and is very easy to understand.
- (2)
- The model established by this modeling method is reusable. This method regards the modeling process as a service composition process. The atomic service can be composed to a complex service, and the complex service can be composed to a more complex service. So the model or parts of the model established in this paper can be used as a service for more complex business needs. This method uses service algebra operation for service composition, so that the service composition becomes like a mathematical calculation. Services can be added or deleted easily and the order of service composition can be adjusted according to business needs at anytime.
- (3)
- The model established by this modeling method is evaluable. CPN has been extensively studied and there has been many reliable modeling and analysis tools for CPN. CPN model can simulate all kinds of dynamic state, analyze the accessibility, fairness and boundedness properties, and is very conducive to the test and application of the model. The model established by this paper can be verified by CPN tools well.
6. Conclusions
- (1)
- The device which provides the IoT Service is resource-limited, i.e., the capacity of communication, computing, storage and so on is insufficient. In the case of insufficient resource, the quality of the service provided by the device will decline, or even become invalid.
- (2)
- A variety of mobile terminals, such as the mobile phone, the tablet and others, connect each other through wireless Internet. Various services are running on these mobile devices, and at the same time these services can be called by other devices. This condition causes service providers and service users to change dynamically.
- (3)
- The IoT device deployed in the field of natural environment is affected by the natural environment easily, such as the rainfall, wildlife damage, etc. The device may not be able to provide service regularly.
- (1)
- Establishing a service calculation language. The user can describe the relationship between the IoT service and the GIS service, and describe the function of these services which reflect the interaction of the sensor and the geographic environment. The application framework can automatically generate the CPN model of the composed services according the syntax.
- (2)
- Establishing a corresponding relationship between the service composition properties and the CPN model. The user can analyze the properties of the model. The framework can answer the user’s properties analysis request according the corresponding relationship. These properties contain completeness properties, boundedness properties, liveness properties and some others.
- (3)
- For the real application, this framework needs the semantic model, the service discovery, the service orchestration. Meanwhile this framework must effectively deal with the performance challenge of IoT service. The CPN model should be mapped to the Business Process Execution Language (BPEL) for further application. So it is needed to develop a converting tool to convert the CPN model to BPEL.
Acknowledgments
Author Contributions
Conflicts of Interest
References
- Qiao, X.; Zhang, Y.; Wu, B.; Cheng, B.; Zhao, S.; Ma, H.; Chen, J. An EDSOA-based services provisioning approach for Internet of Things. Sci. China Inf. Sci. 2013, 43, 1219–1243. [Google Scholar]
- ITU Internet Reports 2005: The Internet of Thing. Available online: http://www.itu.int/osg/spu/publications/internetofthings/ (accessed on 21 December 2015).
- Gustafsson, J.; Kyusakov, R.; Mkitaavola, H.; Delsing, J. Application of service oriented architecture for sensors and actuators in district heating substations. Sensors 2014, 14, 15553–15572. [Google Scholar] [CrossRef] [PubMed]
- Wei, Q.; Jin, Z.; Ge, L.I. Preliminary study of service discovery in Internet of Things: Feasibility and lim-itation of SOA. J. Front. Comput. Sci. Technol. 2013, 7, 97–113. [Google Scholar]
- Ma, H.D. Internet of Things: Objectives and scientific challenges. J. Comput. Sci. Technol. 2011, 26, 919–924. [Google Scholar] [CrossRef]
- International Organization for Standardization. ISO 19101: Geographic information—Reference model; Distributed through American National Standards Institute (ANSI): Washington, DC, USA, 2007. [Google Scholar]
- Sehgal, A.; Perelman, V.; Kuryla, S.; Schonwalder, J. Management of resource constrained devices in the internet of things. IEEE Commun. Mag. 2012, 50, 144–149. [Google Scholar] [CrossRef]
- D’Arienzo, M.; Iacono, M.; Marrone, S.; Nardone, R. Estimation of the energy consumption of mobile sensors in WSN environmental monitoring application. In Proceedings of the 2013 27th International Conference on Advanced Information Networking and Applications Workshops (WAINA), Barcelona, Spain, 25–28 March 2013; pp. 1588–1593.
- Miller, F.P.; Vandome, A.F.; Mcbrewster, J. Devices Profile for Web Services; Alphascript Publishing: Beau-Bassin, Mauritius, 2010. [Google Scholar]
- Deugd, S.D.; Carroll, R.; Kelly, K.; Millett, B.; Ricker, J. SODA: Service oriented device architecture. IEEE Perv. Comput. 2006, 5, 94–96. [Google Scholar] [CrossRef]
- Souza, L.M.S.D.; Spiess, P.; Guinard, D.; Köhler, M.; Karnouskos, S.; Savio, D. SOCRADES: A web service based shop floor integration infrastructure. In Proceedings of the International Conference on the Internet of Things, Zurich, Switzerland, 26–28 March 2008; pp. 50–67.
- Spiess, P.; Karnouskos, S.; Guinard, D.; Savio, D.; Baecker, O.; Souza, L.M.S.D.; Trifa, V. SOA-based integration of the Internet of Things in enterprise services. In Proceedings of the IEEE International Conference on Web Services, Los Angeles, CA, USA, 6–10 July 2009; pp. 968–975.
- Guinard, D.; Trifa, V.; Karnouskos, S.; Spiess, P.; Savio, D. Interacting with the SOA-based Internet of Things: Discovery, query, selection, and on-demand provisioning of web services. IEEE Trans. Serv. Comput. 2010, 3, 223–235. [Google Scholar] [CrossRef]
- Yimu, J.I.; Wang, R.; Jiang, L. IoT service modeling and description based on XML and Petri-Net. Adv. Inf. Sci. Serv. Sci. 2013, 5, 271–278. [Google Scholar]
- Buckl, C.; Sommer, S.; Scholz, A.; Knoll, A.; Kemper, A. Generating a tailored middleware for wireless sensor network applications. In Proceedings of the IEEE International Conference on Sensor Networks, Ubiquitous, and Trustworthy Computing, Taichung, Taiwan, 11–13 June 2008; pp. 162–169.
- Buckl, C.; Sommer, S.; Scholz, A.; Knoll, A.; Kemper, A.; Heuer, J.; Schmitt, A. Services to the field: An approach for resource constrained sensor/actor networks. In Proceedings of the IEEE International Conference on Advanced Information Networking and Applications Workshops, Bradford, UK, 26–29 May 2009; pp. 476–481.
- Li, L.; Jin, Z.; Li, G. Modeling and verifying services of Internet of Things based on timed automata. Chin. J. Comput. 2011, 24, 1356–1377. [Google Scholar] [CrossRef]
- Li, L.; Jin, Z.; Li, G. Modeling and analyzing the reliability and cost of service composition in the IoT: A probabilistic approach. In Proceedings of the IEEE International Conference on Web Services, Honolulu, HI, USA, 24–29 June 2012; pp. 584–591.
- Li, G.; Wei, Q.; Li, L.; Jin, Z.; Xu, Y.; Zheng, L.W. Environment based modeling approach for services in the Internet of Things. Sci. China Inf. Sci. 2013, 43, 1198–1218. [Google Scholar]
- Lin, Y.; Pu, T.; Peng, G.; Zhang, L. Modeling and verifying services of Internet of Things based on hybrid system methodology. J. Chin. Comput. Syst. 2013, 34, 2663–2668. [Google Scholar]
- Sommer, S.; Scholz, A.; Buckl, C.; Kemper, A.; Knoll, A.; Heuer, J.; Schmitt, A. Towards the Internet of Things: Integration of web services and field level devices. In Proceedings of the International Workshop on the Future Internet of Things and Services-Embedded Web Services for Pervasive Devices, Berlin, Germany, 1–3 September 2009.
- De, S.; Barnaghi, P.; Bauer, M.; Meissner, S. Service modeling for the Internet of Things. In Proceedings of the Federated Conference on Computer Science and Information Systems, Szczecin, Poland, 18–21 September 2011; pp. 949–955.
- Choi, H.S.; Rhee, W.S. IoT-based user-driven service modeling environment for a smart space management system. Sensors 2014, 14, 22039–22064. [Google Scholar] [CrossRef] [PubMed]
- Wei, Q.; Jin, Z.; Li, X.; Li, G. Lightweight semantic service modeling for IoT: An environment-based approach. Int. J. Embed. Syst. 2016, 8, 164–173. [Google Scholar] [CrossRef]
- Ko, I.Y.; Ko, H.G.; Molina, A.J.; Kwon, J.H. SoIoT: Toward A user-centric IoT-based service framework. ACM Trans. Int. Technol. 2016. [Google Scholar] [CrossRef]
- Alonso, G.; Casati, F.; Kuno, H.; Machiraju, V. Web services: Concepts, architectures and applications. Springer: New York, NY, USA, 2010. [Google Scholar]
- Marakhimov, A.; Yim, J.; Joo, J. Petri net based semantic web service composition. Int. J. Multimedia Ubiquitous Eng. 2014, 9, 281–290. [Google Scholar] [CrossRef]
- Charif, Y.; Sabouret, N. An overview of semantic web services composition approaches. Electron. Notes Theor. Comput. Sci. 2006, 146, 33–41. [Google Scholar] [CrossRef]
- Aggarwal, R.; Verma, K.; Miller, J.; Milnor, W. Dynamic driven web service composition in meteor-s. In Proceedings of the 2004 IEEE International Conference on Services Computing, Shanghai, China, 15–18 September 2004.
- Jaeger, M.C.; Rojec-Goldmann, G.; Muhl, G. QoS aggregation for web service composition using workflow patterns. In Proceedings of the 2004 8th IEEE International Enterprise Distributed Object Computing Conference, Monterey, CA, USA, 20– 24 September 2004; pp. 149–159.
- Hu, H.T.; Li, G.; Han, Y.B. An approach to business-user-oriented larger-granularity service composition. Chin. J. Comput. 2005, 28, 694–703. [Google Scholar]
- Chun, S.A.; Atluri, V.; Adam, N.R. Domain knowledge-based automatic workflow generation. In Proceedings of the 13th DEXA 2002 Aix-en-Provence International Conference, Aix-en-Provence, France, 2–6 September 2002; pp. 81–93.
- Fu, P.; Peng, Q.; Hu, X. A web service composition system based on semantic parsing. In Proceedings of the 2015 19th IEEE International Conference on Computer Supported Cooperative Work in Design (CSCWD), Calabria, Italy, 6–8 May 2015.
- Ramasamy, R.K.; Chua, F.F.; Haw, S.C. Web service composition using windows workflow for cloud-based mobile application. In Advanced Computer and Communication Engineering Technology; Springer International Publishing: Cham, Switzerland, 2015. [Google Scholar]
- Nau, D.; Au, T.C.; Ilghami, O.; Kuter, U.; Murdock, J.M.; Wu, D.; Yaman, F. SHOP2: An HTN planning system. J. Artif. Intell. Res. 2003, 20, 379–404. [Google Scholar]
- Sirin, E.; Parsia, B.; Wu, D.; Hendler, J.A.; Nau, D.S. HTN planning for Web service composition using SHOP2. Web Semant. Sci. Serv. Agents World Wide Web 2015, 1, 377–396. [Google Scholar] [CrossRef]
- Wu, D.; Parsia, B.; Sirin, E.; Hendler, J.A.; Nau, D.S. Automating DAML-S web services composition using SHOP2. In The Semantic Web-ISWC 2003; Springer: Heidelberg, Germany, 2003. [Google Scholar]
- Mcilraith, S.; Son, T.C. Adapting golog for composition of semantic web services. In Proceedings of the 8th International Conference on Principles of Knowledge Representation and Reasoning, Toulouse, France, 22–25 April 2002; pp. 482–493.
- Weise, T.; Bleul, S.; Comes, D.; Geihs, K. Different approaches to semantic web service composition. In Proceedings of the 3rd International Conference onInternational Conference on Internet and Web Applications and Services (ICIW ’08), Athens, Greece, 8–13 June 2008; pp. 90–96.
- Liu, J.; Fan, C.; Gu, N. Web services automatic composition with minimal execution price. In Proceedings of the 2005 IEEE International Conference on Web Services, Orlando, FL, USA, 11–15 July 2005; pp. 302–309.
- Liao, J.; Tan, H.; Liu, J.D. Describing and verifying web service using Pi-calculaus. Chin. J. Comput. 2005, 28, 635–643. [Google Scholar]
- Gu, X.; Lu, Z. A Pi-calculus based formal model for BPEL4WS web service composition. Chin. J. Comput. 2007, 34, 69–74. [Google Scholar]
- Jia, Z.; Xing, X. Compatibility verification of web service composition based on Pi-calculus. In Proceedings of the Joint International, Mechanical, Electronic and Information Technology Conference, Chongqing, China, 18–20 December 2015.
- Han, S.M.; Pang, U.C.; Choe, H.C.; Hwang, C.J. Using Pi-calculus to model dynamic web services composition based on the authority model. 2015. arXiv:1512.04653. Available online: http://arxiv.org/abs/1512.04653 (accessed on 9 September 2016).
- Reisig, W. Petri Nets: An Introduction; Springer: Heidelberg, Germany, 2015. [Google Scholar]
- Qiu, L.R.; Shi, Z.Z.; Lin, F.; Liang, A.C. Agent-based automatic composition of semantic web services. J. Comput. Res. Dev. 2007, 44, 643–650. [Google Scholar] [CrossRef]
- Wang, Y. Research on web service composition algorithm using description logic. Telk. Indones. J. Electr. Eng. 2014, 12, 852–858. [Google Scholar] [CrossRef]
- Narayanan, S.; Mcilraith, S.A. Simulation, verification and automated composition of Web services. In Proceedings of the 11th International Conference on World Wide Web, Honolulu, HI, USA, 7–11 May 2002; pp. 77–88.
- Hamadi, R.; Benatallah, B. A Petri net-based model for Web service composition. In Proceedings of the 14th Australasian Database Conference, Adelaide, Australia, 3–5 December 2003; pp. 191–200.
- Sun, J.; Jiang, C. Web service Composition Based on BPWS-Net Content Computing; Springer: Heidelberg, Germany, 2004. [Google Scholar]
- Zhang, J.; Km, S.W.; Chang, C.K.; Chung, J. WS-Net: A Petri-net based specification model for Web services. In Proceedings of the 2004 Web Services, San Diego, CA, USA, 6–9 June 2004; pp. 420–427.
- Tang, X.F.; Jiang, C.J.; Ding, Z.J.; Wang, C. A Petri Net-based semantic web service automatic composition method. J. Softw. 2007, 18, 2991–3000. [Google Scholar]
- Rodriguez-Valenzuela, S.; Holgado-Terriza, J.A.; Gutierrez-Guerrero, J.M.; Muros-Cobos, J.L. Distributed service-based approach for sensor data fusion in IoT environments. Sensors 2014, 14, 19200–19228. [Google Scholar] [CrossRef] [PubMed]
- Barbierato, E.; Iacono, M.; Marrone, S. PerfBPEL: A graph-based approach for the performance analysis of BPEL SOA applications. In Proceedings of the 2012 6th International Conference on Performance Evaluation Methodologies and Tools (VALUETOOLS), Cargese, France, 9–12 October 2012.
- Wu, X.C. Principles and Methods of Geographical Information System, 2nd ed.; Publishing House of Electronics Industry: Beijing, China, 2011. [Google Scholar]
- Jensen, K. Coloured Petri Nets: Basic Concepts, Analysis Methods and Practical Use; Springer: Heidelberg, Germany, 2015. [Google Scholar]
- Yu, H.N.; Zhang, H.L.; Fang, B.X.; Yu, X.Z. Research on search service for physical entities in the Internet of Things. Telecommun. Sci. 2012, 28, 111–119. [Google Scholar]
- Zhang, F.; Xu, Y.T. Geospatially constrained workflow modeling and implementation. Information 2016, 7, 30. [Google Scholar] [CrossRef]
- Li, G.; Sun, H.M.; Li, Z.; Yun, H.Y. Resource constrained web services. Chin. J. Comput. 2010, 33, 193–207. [Google Scholar] [CrossRef]
- Martin, D.L.; Burstein, M.H.; Hobbs, J.; Lassila, O.; Mcdermott, D.; Mcilraith, S.A.; Narayanan, S.; Paolucci, M.; Parsia, B.; Payne, T.R.; et al. OWL-S: Semantic markup for Web services. W3C Memb. Submiss. 2004, 22, 2007. [Google Scholar]
- Lieberman, J. OpenGIS Web Services Architecture. Open Geospatial Consortium, 2003. Available online: http://portal.opengeospatial.org/files/?artifact_id=13140 (accessed on 6 May 2016).
- Menasce, D.A. QoS issues in Web services. IEEE Internet Comput. 2002, 6, 72–75. [Google Scholar] [CrossRef]
- Wu, H.Y.; Du, Y.Y. A logical petri Net-based approach for web service cluster composition. Chin. J. Comput. 2015, 38, 204–218. [Google Scholar]
- Chen, Y.P.; Li, Z.Z.; Tang, Y.Z.; Guo, Z.S. A method satisfying markov process of Web service composition under incomplete constrains. Chin. J. Comput. 2006, 29, 1076–1083. [Google Scholar]
- He, Y.X.; Shen, H. A stochastic Petri Net-based performance bottleneck location strategy for web services composition. Chin. J. Comput. 2013, 36, 1953–1966. [Google Scholar] [CrossRef]
- UML Revision Taskforce. OMG UML Specification v. 2.5. Object Management Group, 2015. Available online: http://www.omg.org (accessed on 15 March 2016).
- Eshuis, R.; Wieringa, R. Comparing Petri net and activity diagram variants for workflow modelling—A quest for reactive Petri nets. In Petri Net Technology for Communication-Based Systems; Springer: Heidelberg, Germany, 2002. [Google Scholar]


| InitialMark | Transition | Execution Rate |
|---|---|---|
| (1,0,0,0,0,0,0,0,0,0) | t1 | 7 |
| 8 | ||
| 5 | ||
| 7 | ||
| 6 | ||
| 3 | ||
| 2 | ||
| 4 | ||
| 5 |
| Transition | Γ | ||
|---|---|---|---|
| 0.05055863 | 0.31923732 | 0.9376223 | |
| 0.12033518 | 0.92383003 | 0.56388432 | |
| 0.05382902 | 0.76548293 | 0.43567223 | |
| 0.07836251 | 0.657384723 | 0.53523673 | |
| 0.123847364 | 0.45783829 | 0.83462718 | |
| 0.14537282 | 0.367382392 | 0.3234521 | |
| 0.083326745 | 0.439489283 | 0.43927655 | |
| 0.045736838 | 0.43647282 | 0.33654381 | |
| 0.037464836 | 0.32455664 | 0.34265467 |
| Type | Name | Function |
|---|---|---|
| IoT Sensing Service | Sensing the license plate number by equipment A | |
| Sensing the license plate number by equipment B | ||
| IoT Controlling Service | Sending navigation commands by equipment B | |
| GIS Data Service | Providing the entrance data of the parking lot. | |
| Providing the parking space data | ||
| Providing the parking road data of the parking lot. | ||
| Providing the navigating equipments data of the parking lot. | ||
| GIS Processing Service | calculating the nearest parking space | |
| Calculating the shortest road | ||
| Calculating the navigating commands | ||
| Updating the parking space data | ||
| Assistant Service | Sensing service composition | |
| Controlling service mapping |
| Services Name | Attached Equipments |
|---|---|
| The monitor points | |
| The pollution control equipments | |
| GIS server | |
| GIS server | |
| GIS server |
| Type | Name | Function |
|---|---|---|
| IoT Sensing Service | Sensing the pH value | |
| Sensing the dissolved oxygen value | ||
| Sensing the water turbidity value | ||
| IoT Controlling Service | Controlling the biological agents for the pH value | |
| Controlling the biological agents for the dissolved oxygen value | ||
| Controlling the biological agents for the water turbidity value | ||
| GIS Data Service | Providing the monitor points data in the lake. | |
| Providing the pollution control equipments data in the lake | ||
| GIS Processing Service | calculating the pollution area | |
| Calculating the needed pollution control equipments | ||
| Calculating the needed biological agents and its concentration | ||
| Assistant Service | Sensing service composition | |
| Controlling service mapping |
| Services Name | Attached Equipments |
|---|---|
| The license plate number identification equipment A at the entrance | |
| , | The parking space navigation equipment B including many |
| , , , | GIS server |
| , , , | GIS server |
| GIS server |
© 2016 by the authors; licensee MDPI, Basel, Switzerland. This article is an open access article distributed under the terms and conditions of the Creative Commons Attribution (CC-BY) license (http://creativecommons.org/licenses/by/4.0/).
Share and Cite
Zhang, F.; Xu, Y.; Chou, J. A Novel Petri Nets-Based Modeling Method for the Interaction between the Sensor and the Geographic Environment in Emerging Sensor Networks. Sensors 2016, 16, 1571. https://doi.org/10.3390/s16101571
Zhang F, Xu Y, Chou J. A Novel Petri Nets-Based Modeling Method for the Interaction between the Sensor and the Geographic Environment in Emerging Sensor Networks. Sensors. 2016; 16(10):1571. https://doi.org/10.3390/s16101571
Chicago/Turabian StyleZhang, Feng, Yuetong Xu, and Jarong Chou. 2016. "A Novel Petri Nets-Based Modeling Method for the Interaction between the Sensor and the Geographic Environment in Emerging Sensor Networks" Sensors 16, no. 10: 1571. https://doi.org/10.3390/s16101571
APA StyleZhang, F., Xu, Y., & Chou, J. (2016). A Novel Petri Nets-Based Modeling Method for the Interaction between the Sensor and the Geographic Environment in Emerging Sensor Networks. Sensors, 16(10), 1571. https://doi.org/10.3390/s16101571