
An Electrochemical Impedance Spectroscopy-Based Technique to Identify and Quantify Fermentable Sugars in Pineapple Waste Valorization for Bioethanol Production

 ,
, 
 ,
, 
Abstract
:1. Introduction
2. Experimental Section
2.1. Raw Material and Sample Preparation
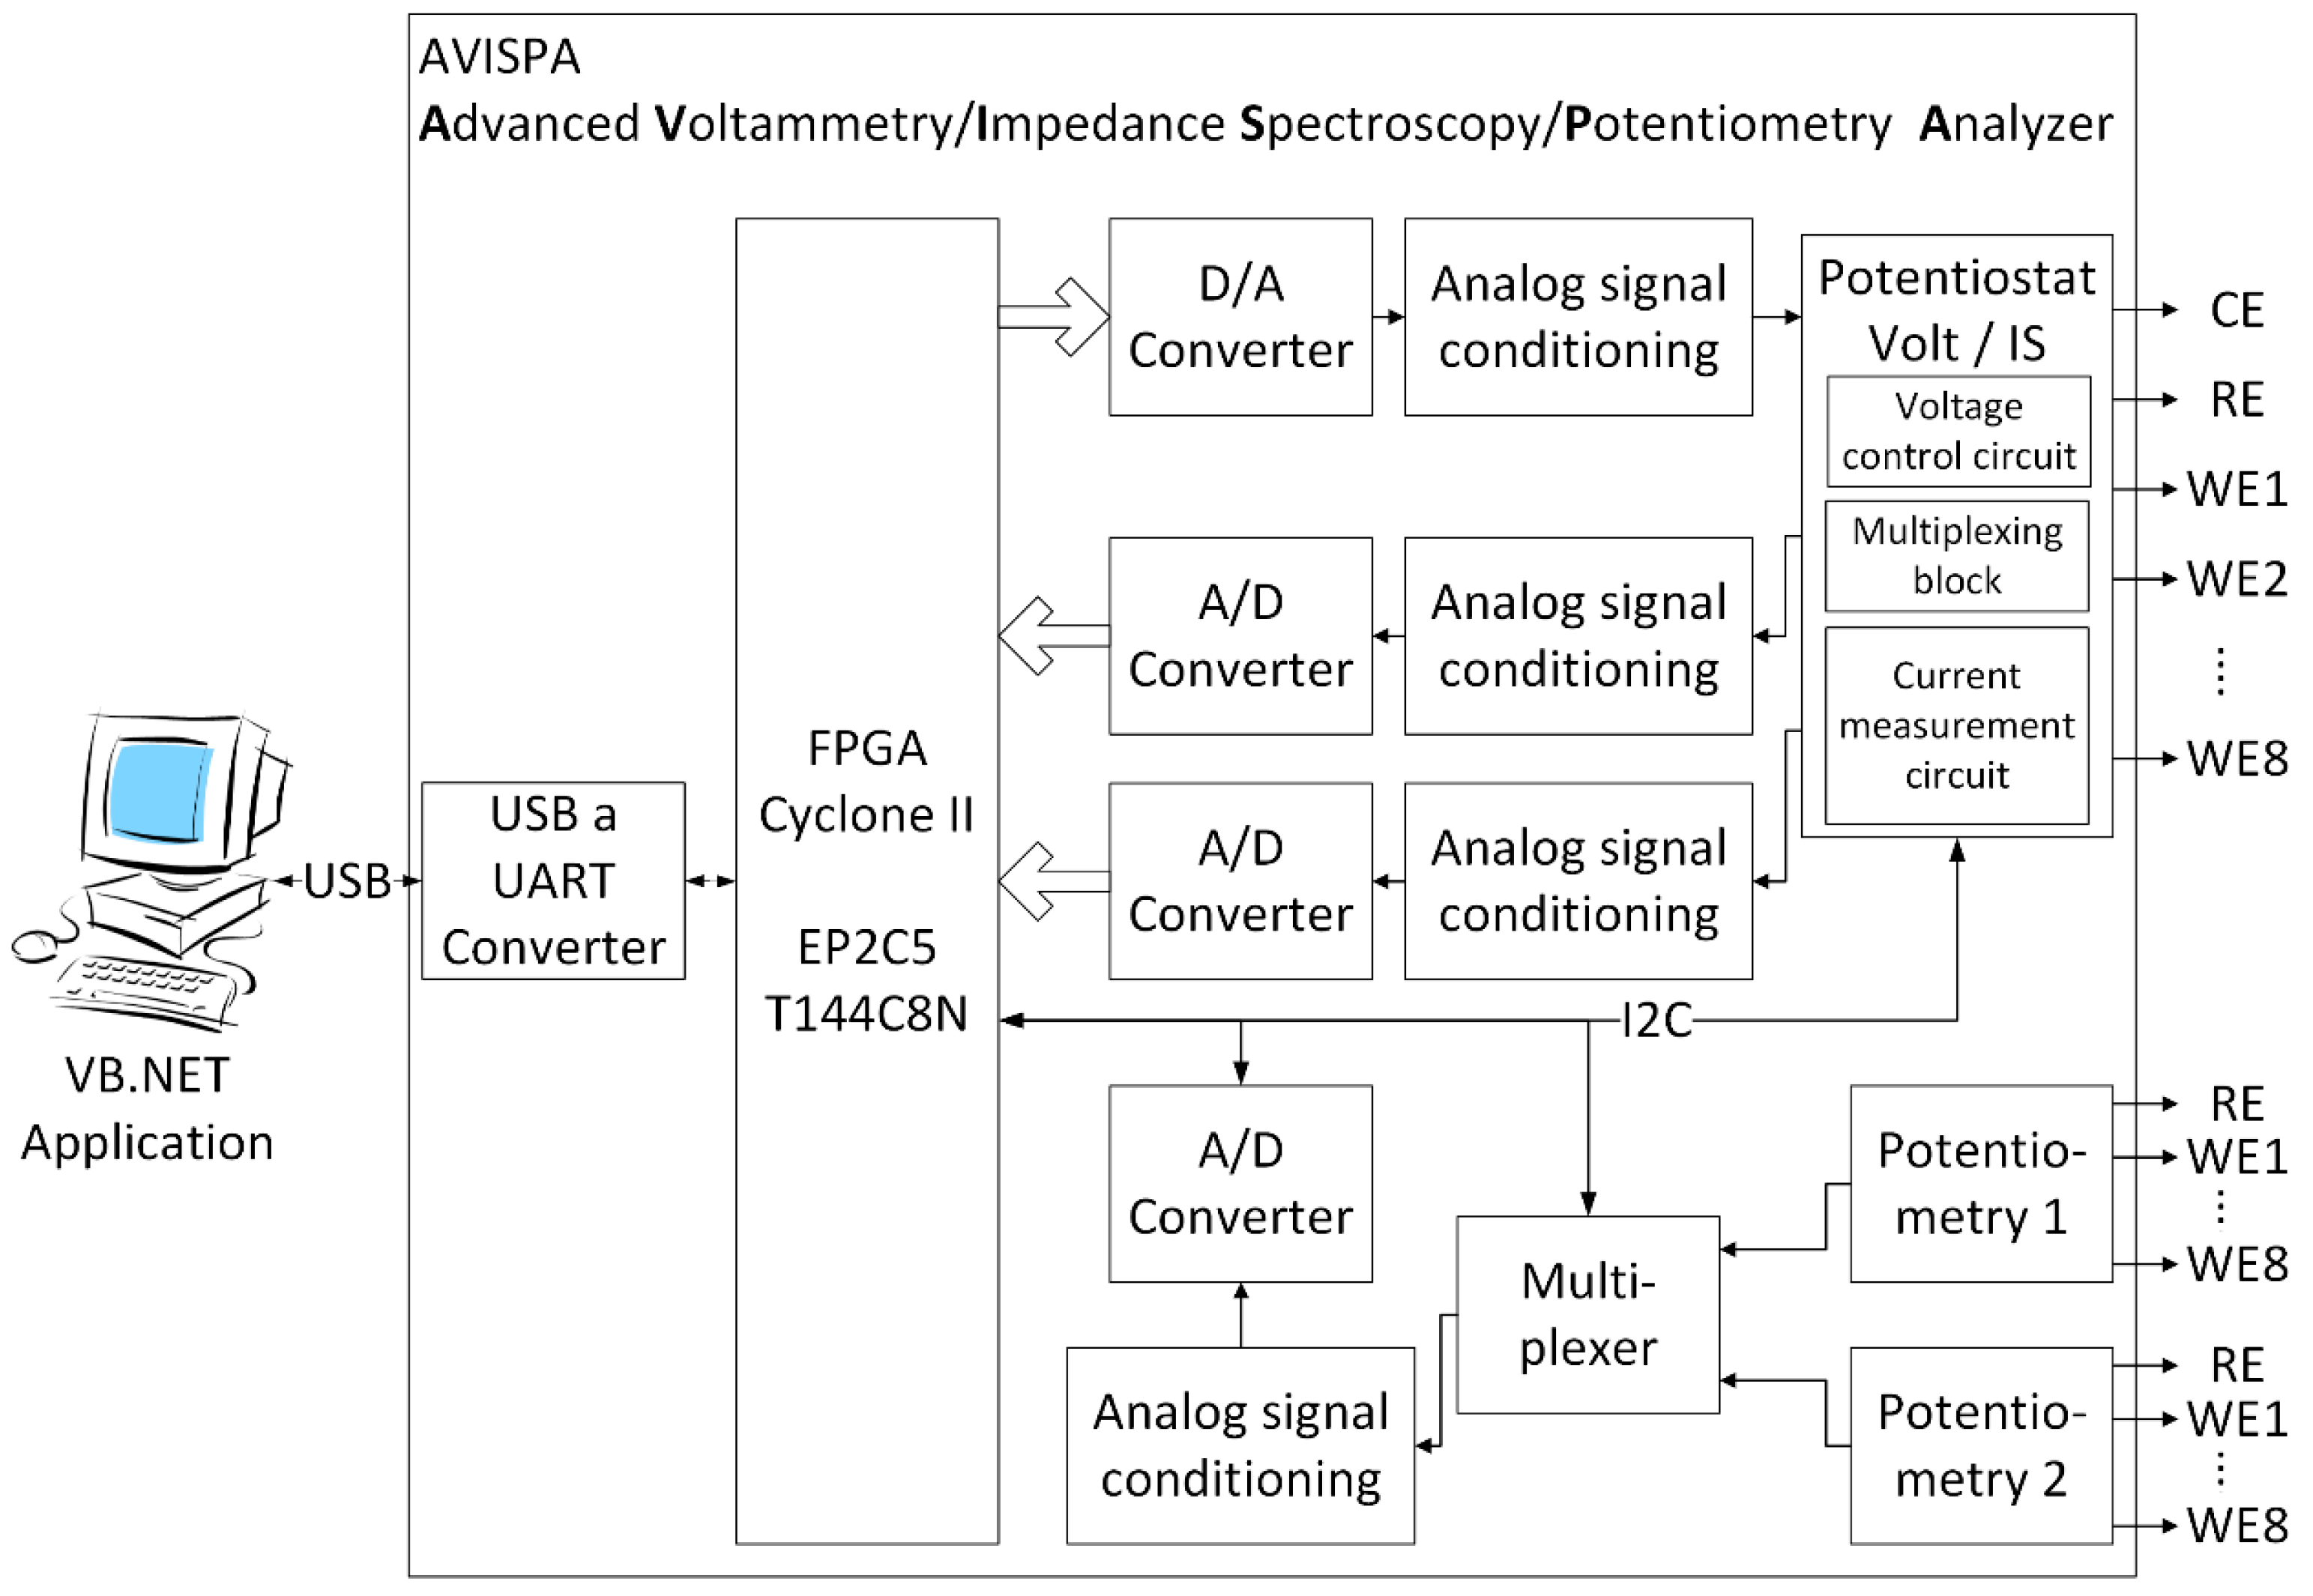
2.2. Electrochemical Impedance Spectroscopy Equipment

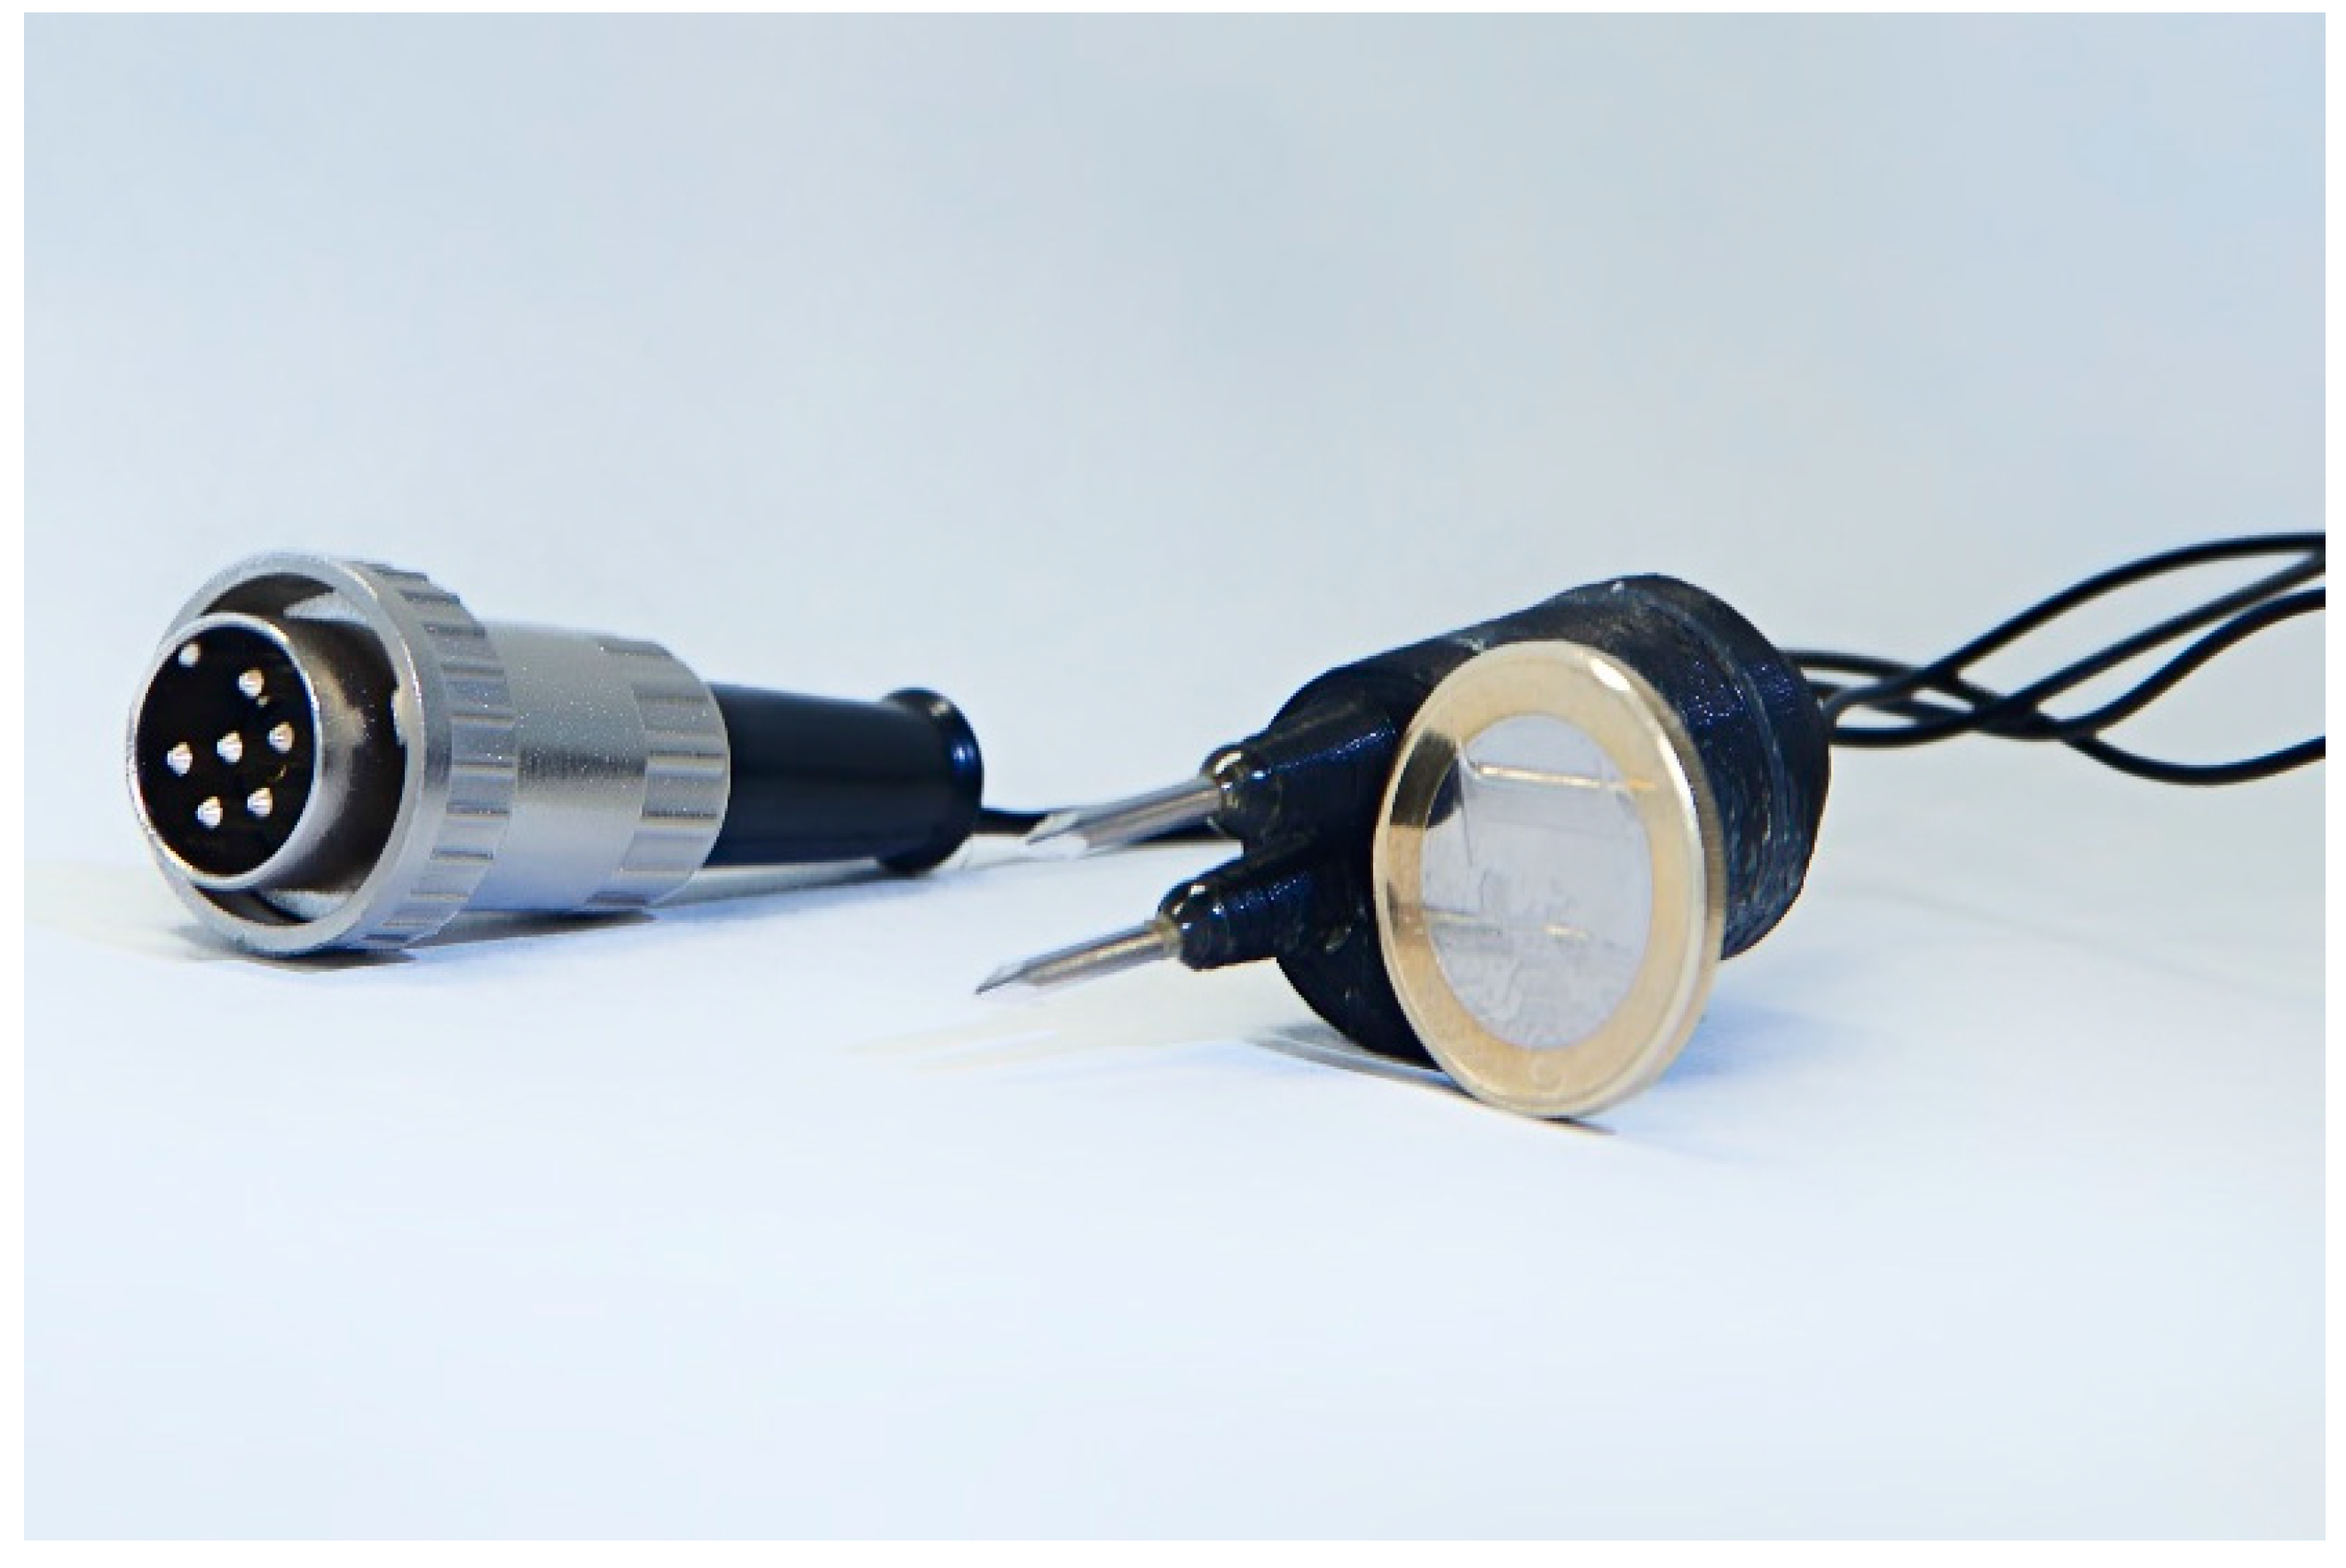
2.3. Electrochemical Impedance Spectroscopy Sensor

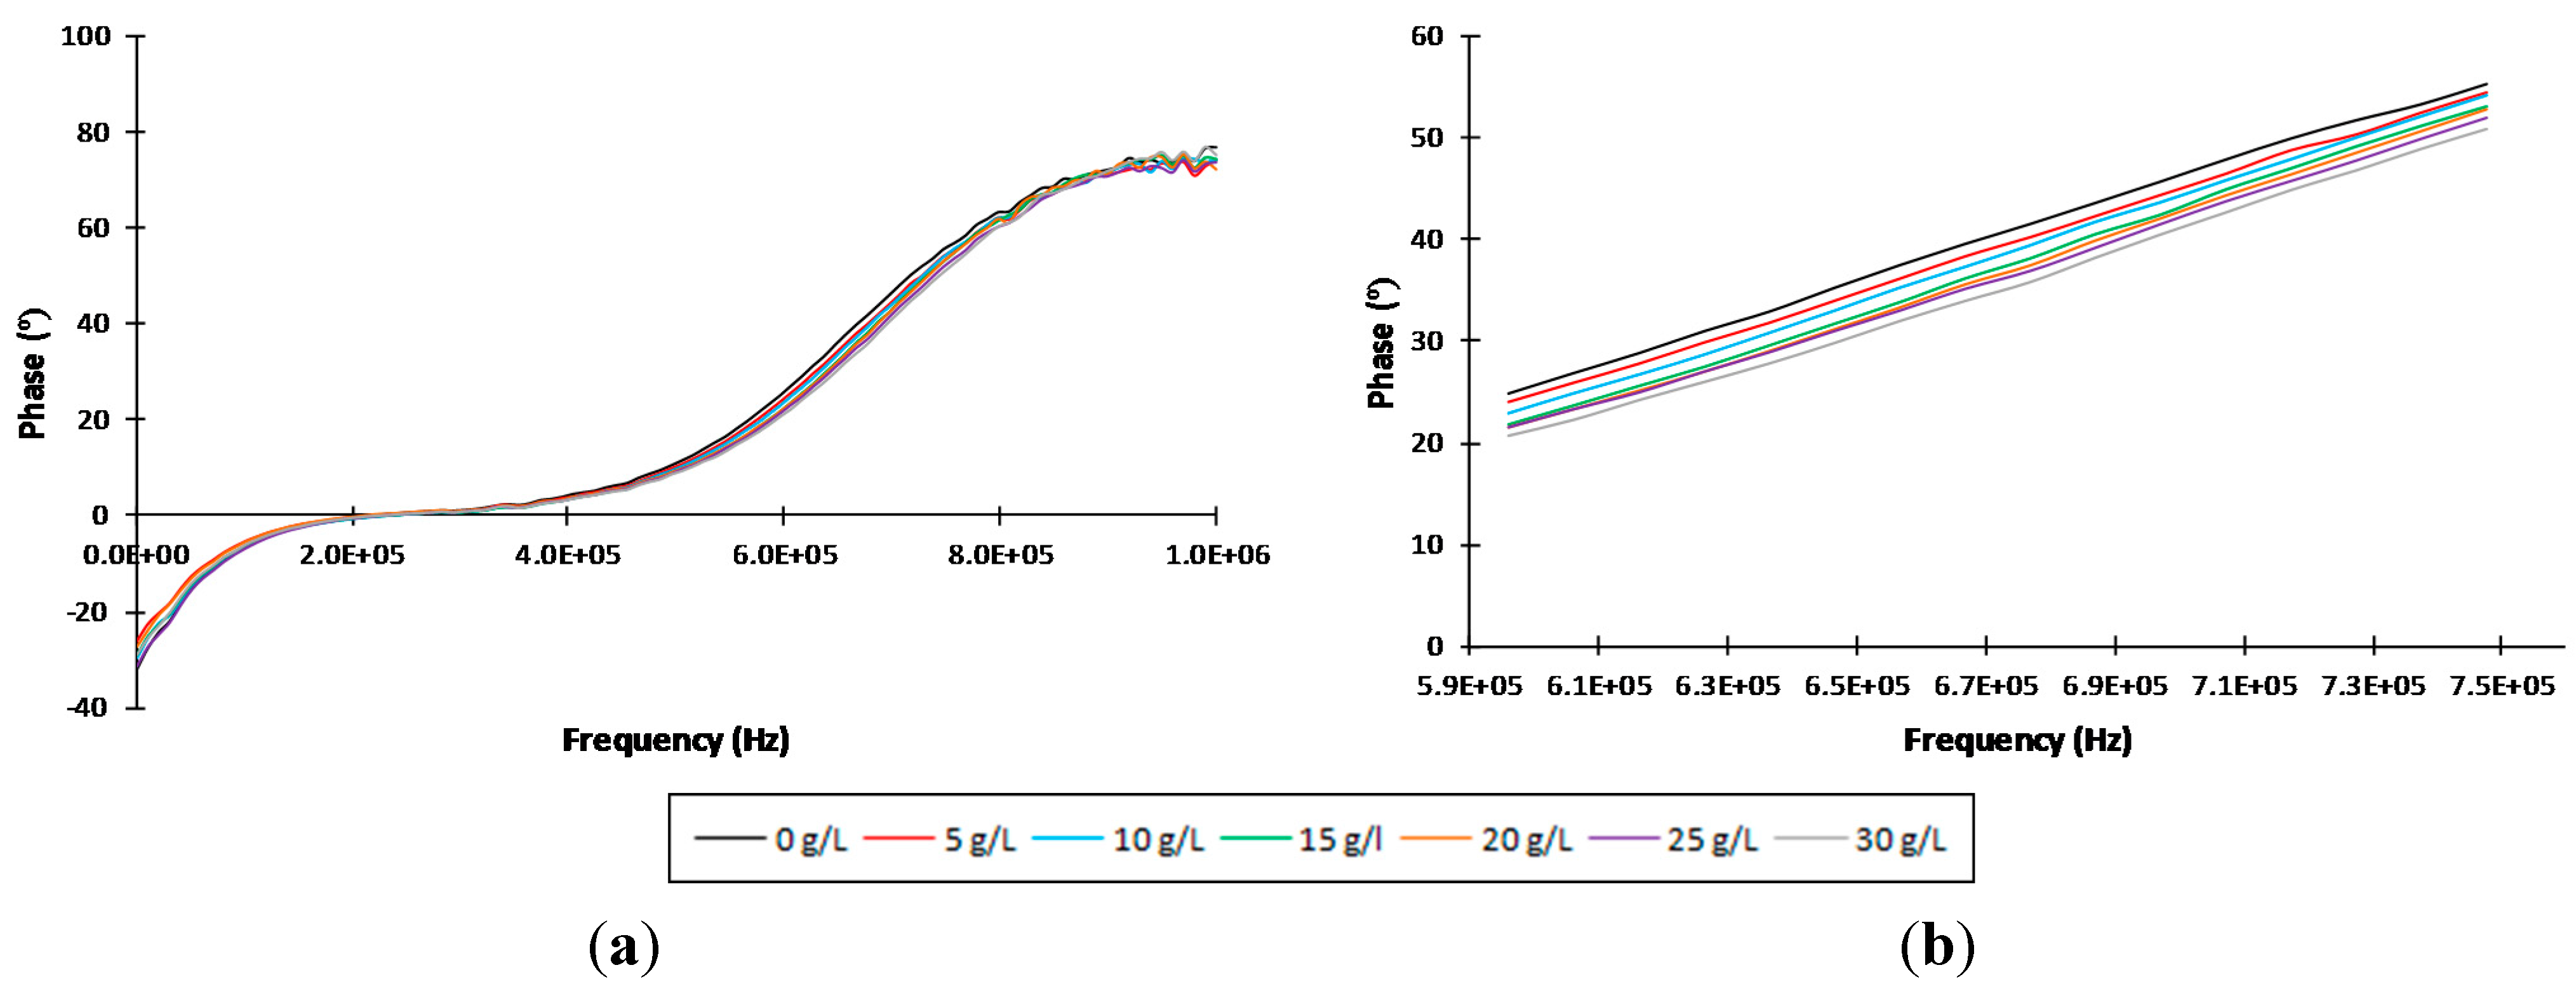
2.4. Electrochemical Impedance Spectroscopy Measurements
2.5. Statistical Analysis
3. Results and Discussion
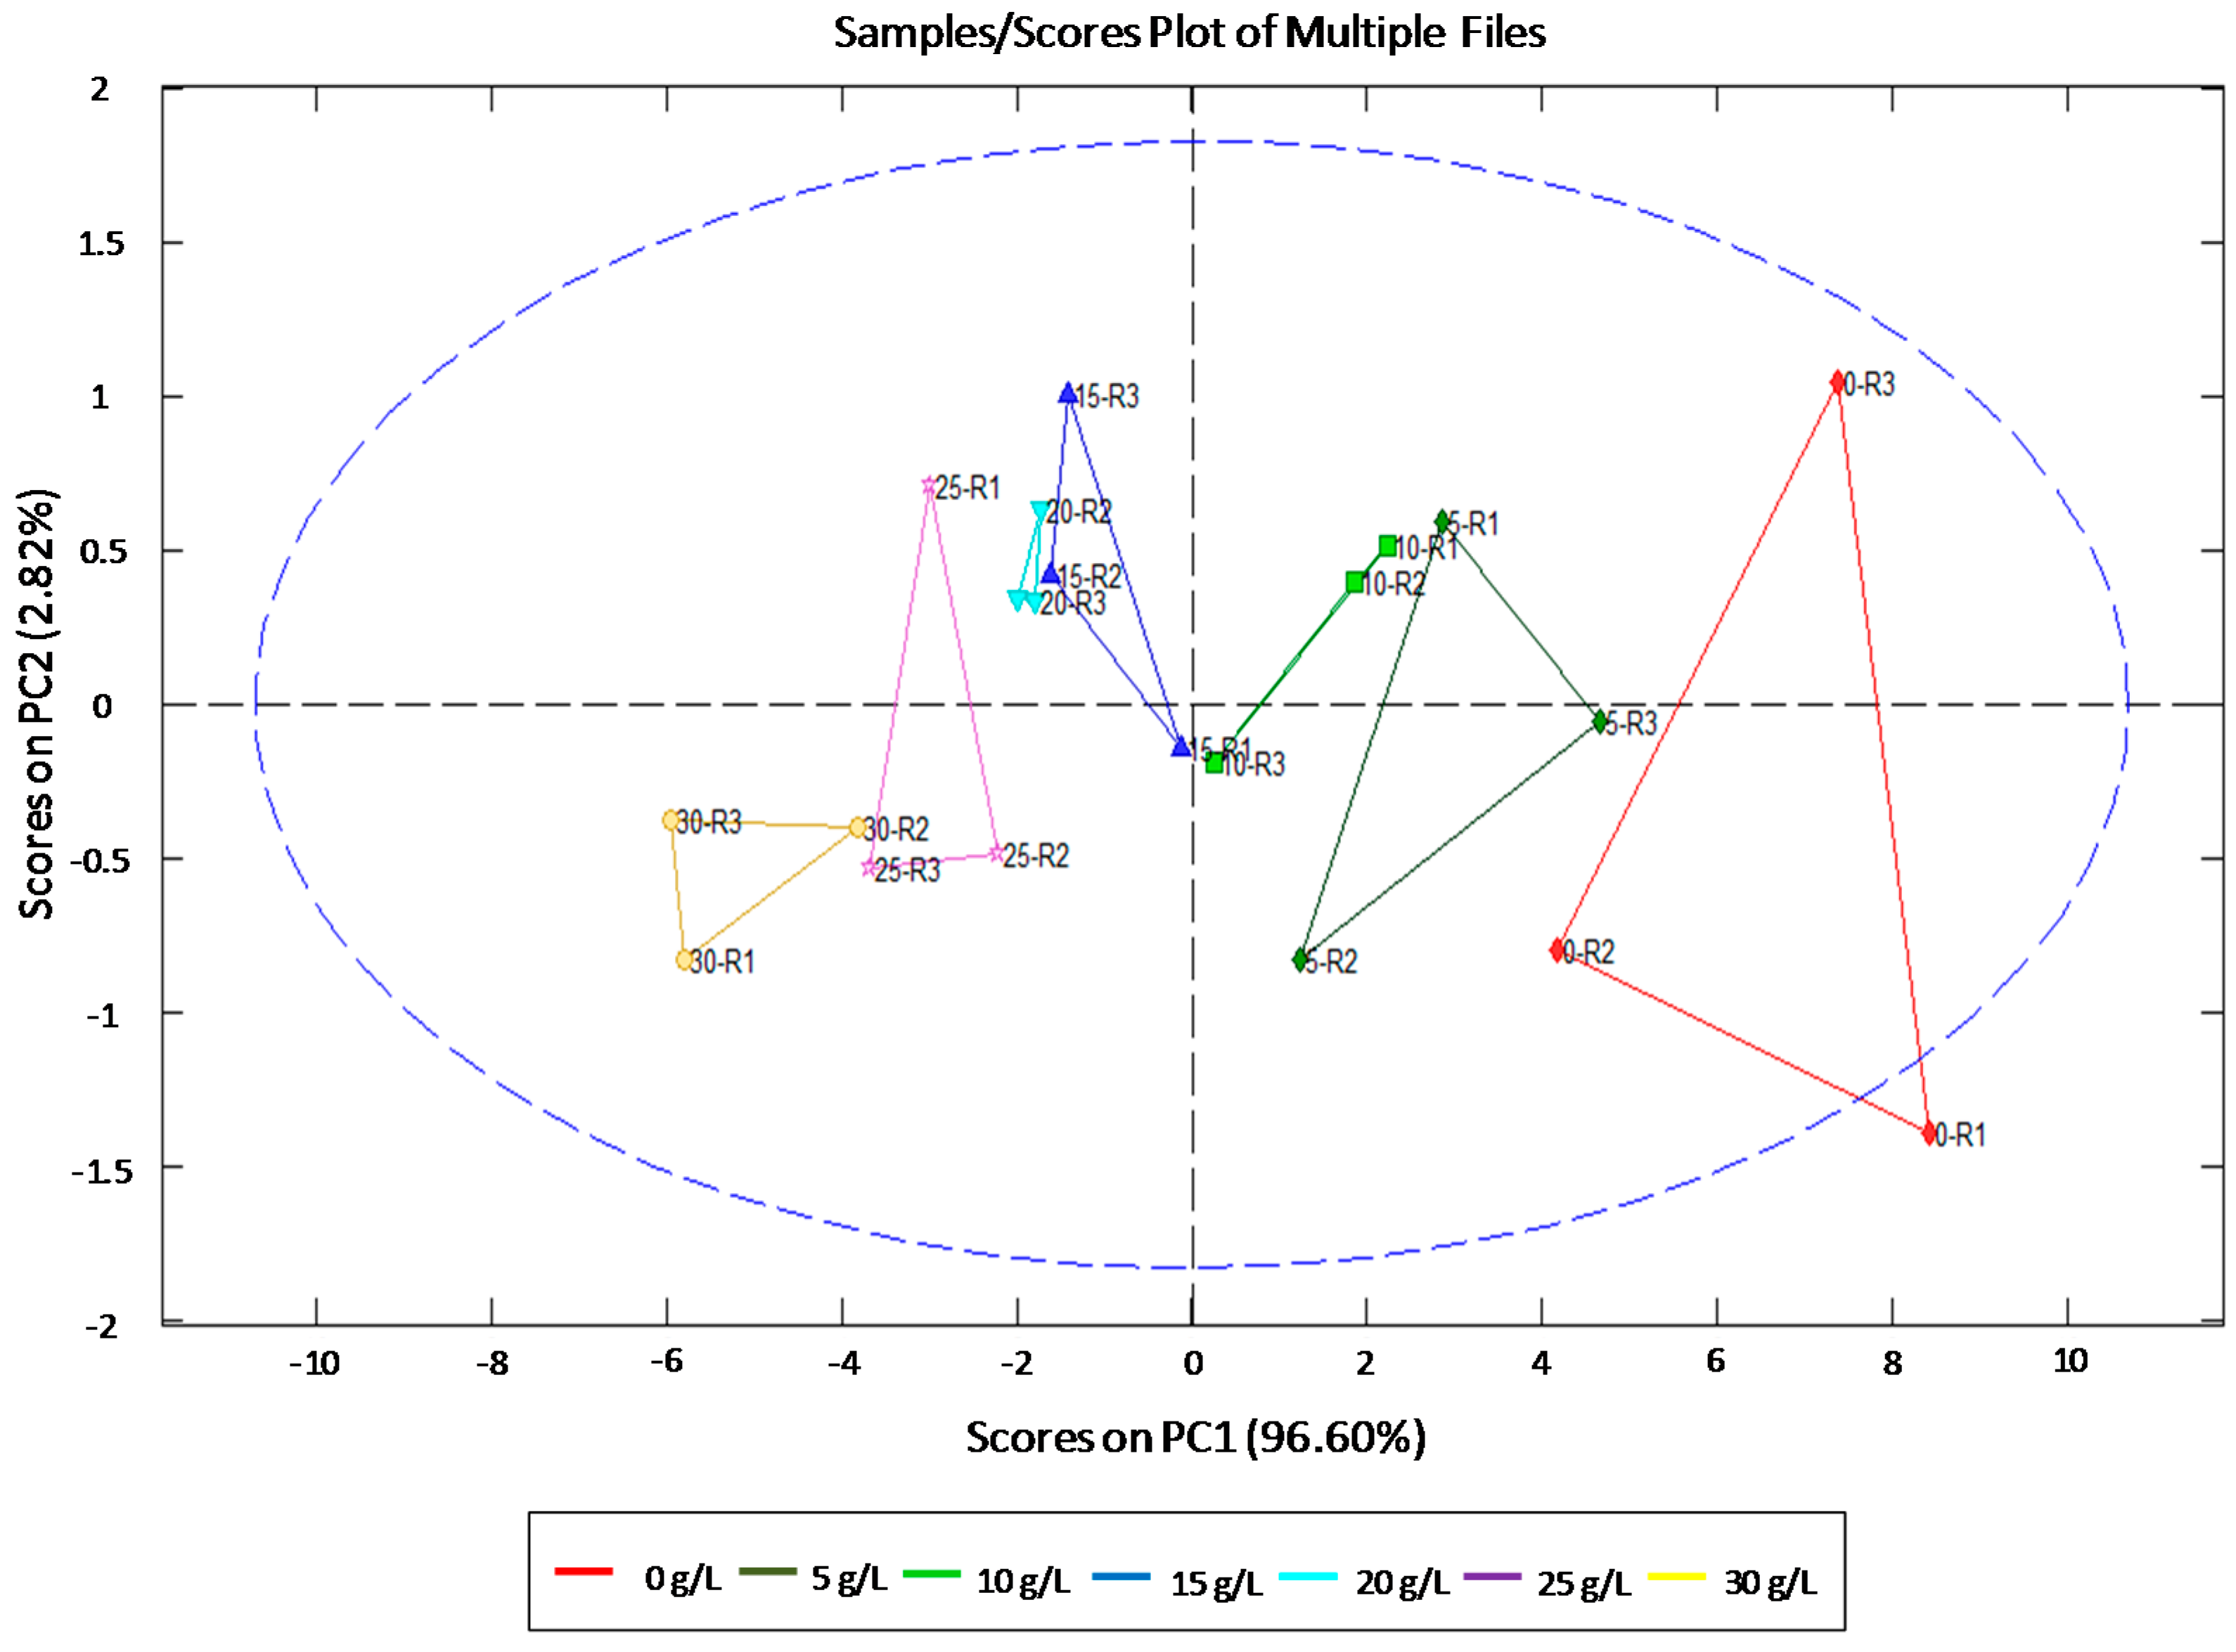
3.1. Individual Identification and Quantification of Sugars


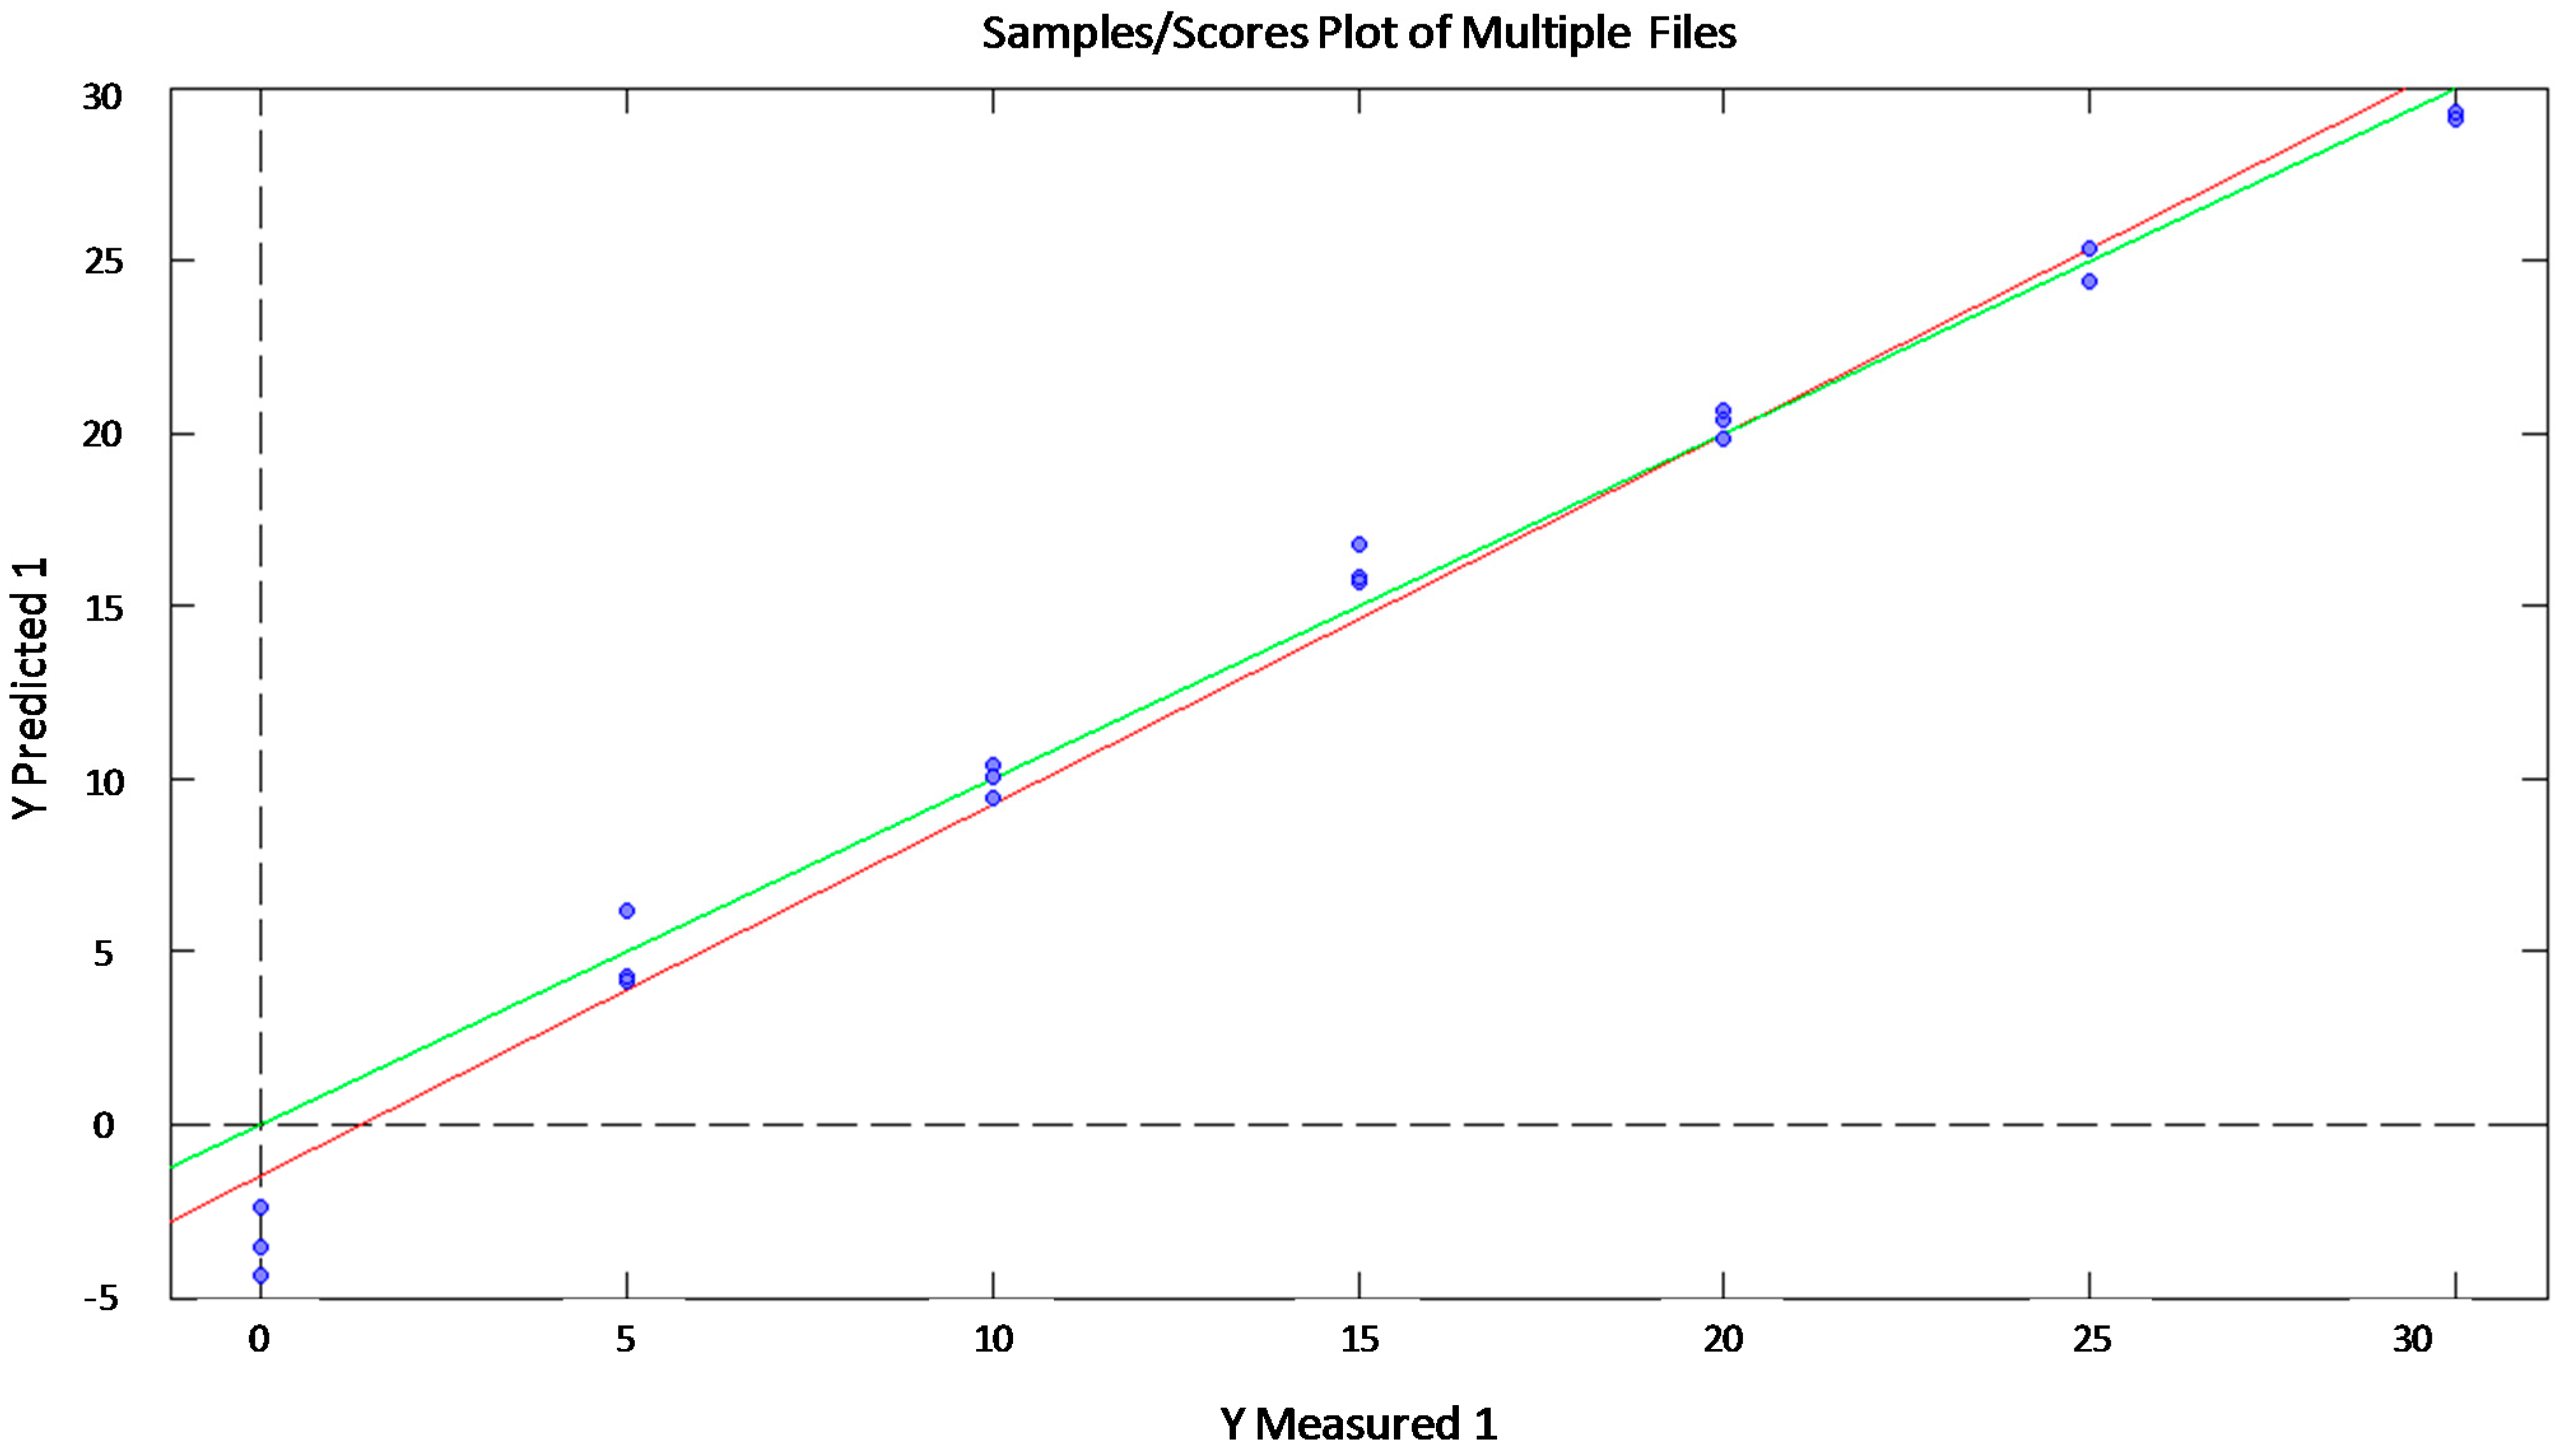
| Sugars | Statistics | ||
|---|---|---|---|
| R2 | RMSEP | LV | |
| Glucose | 0.979 | 2.272 | 3 |
| Fructose | 0.958 | 2.103 | 2 |
| Sucrose | 0.983 | 1.576 | 1 |
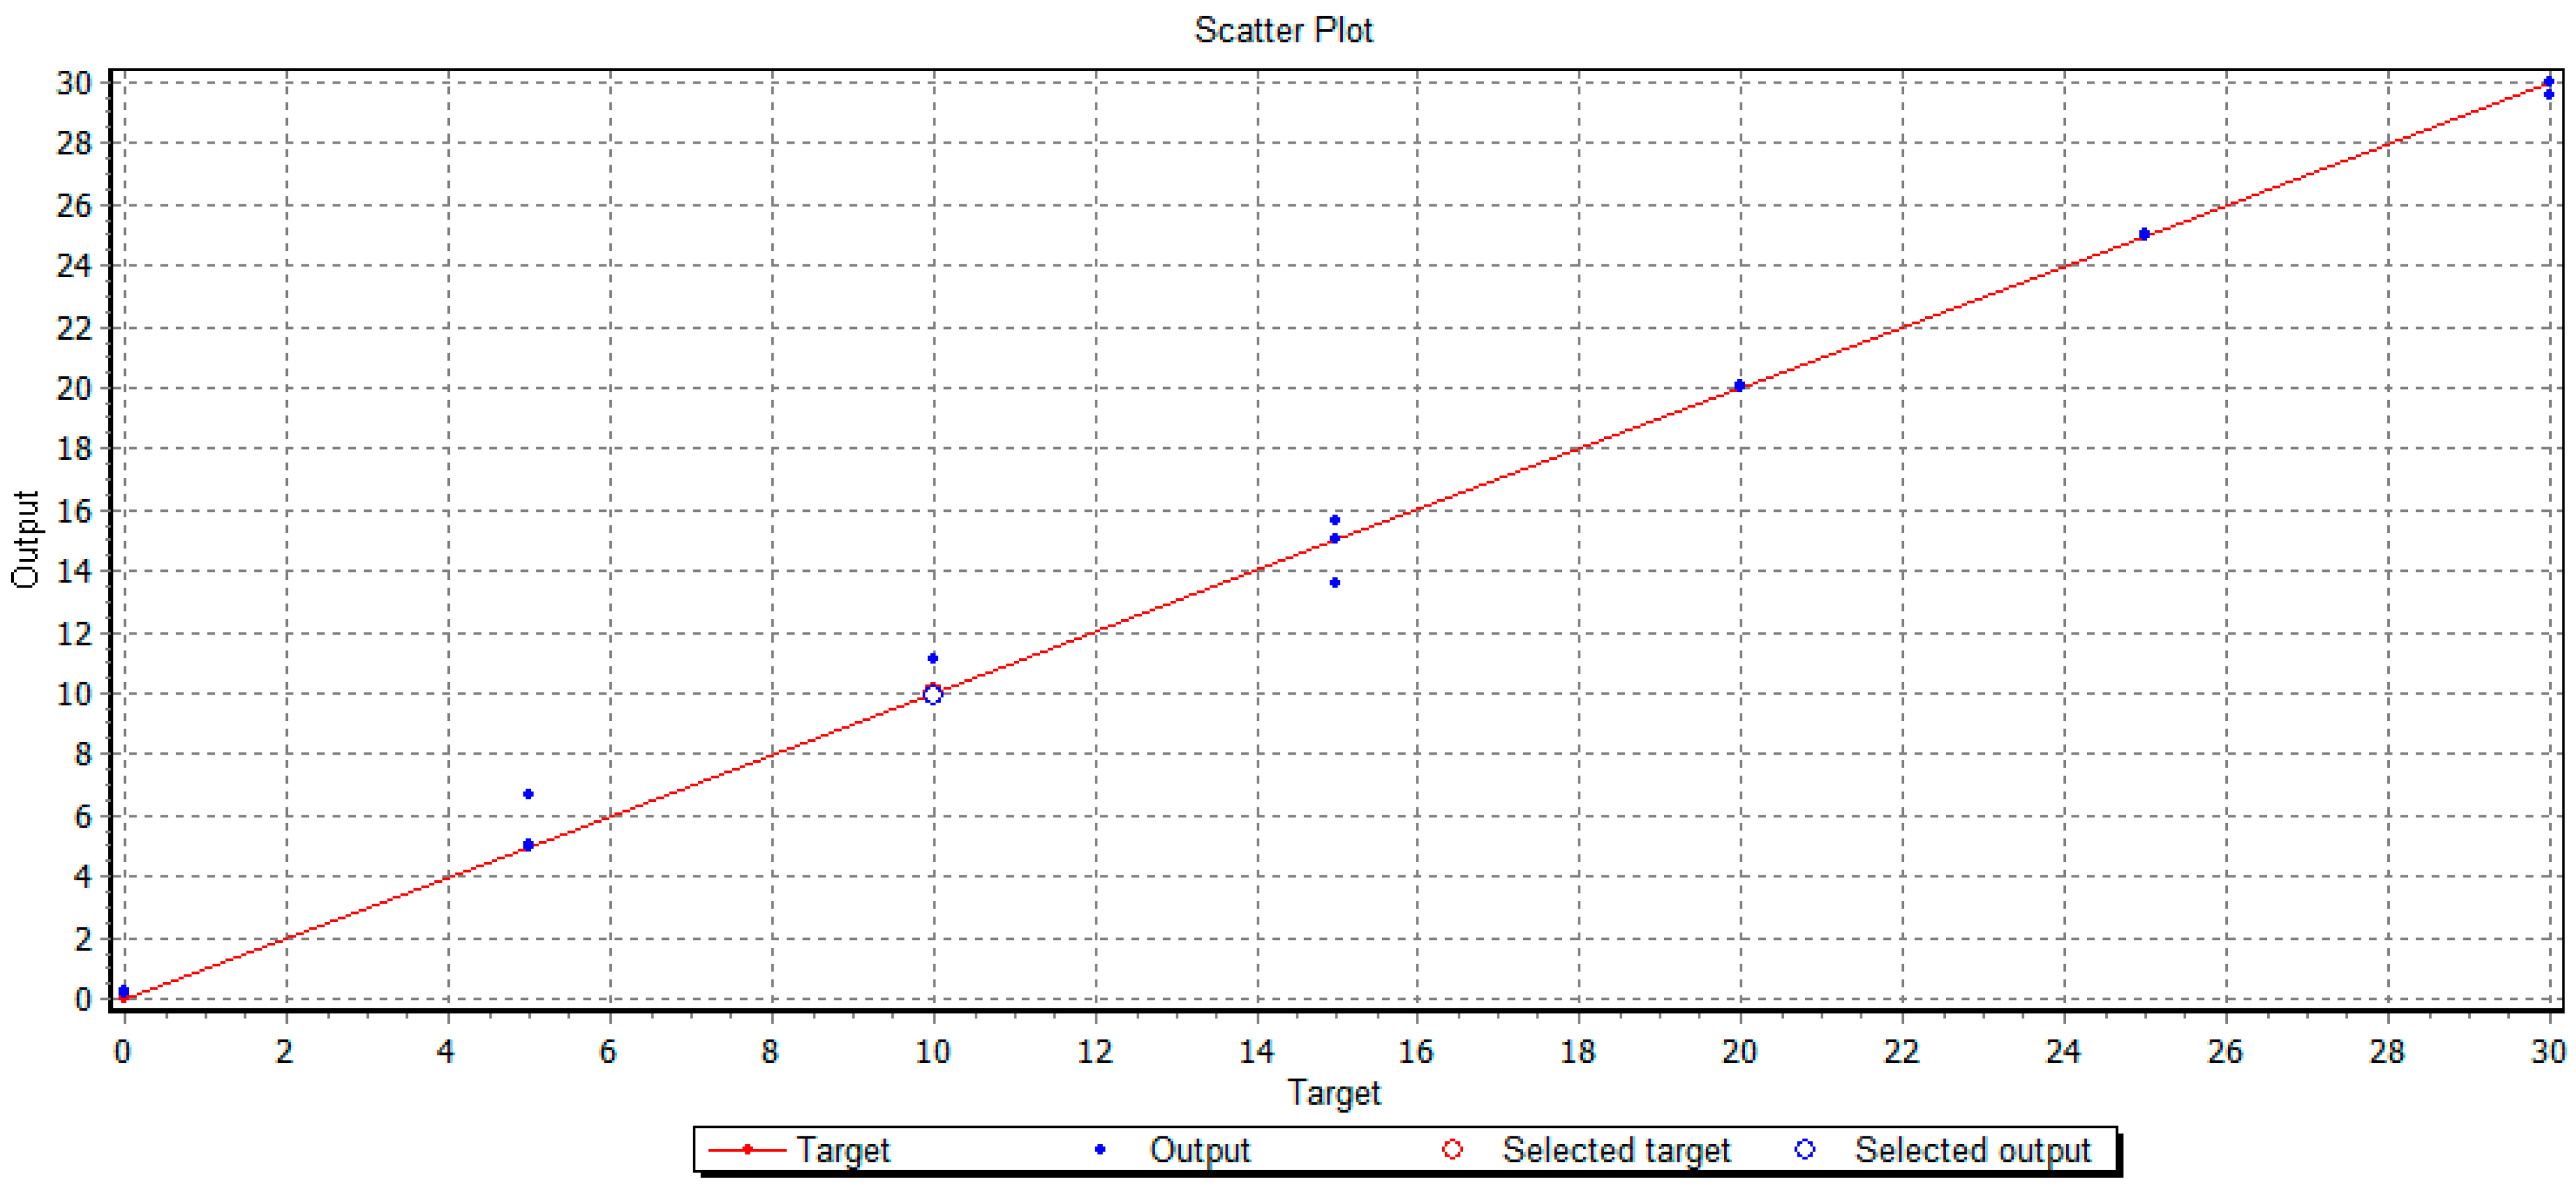
| R2 | RMSE | ||
|---|---|---|---|
| Glucose | Training | 0.99 | 1.41 |
| Validation | 0.88 | 3.39 | |
| Test | 0.95 | 3.96 | |
| Fructose | Training | 0.96 | 1.39 |
| Validation | 0.99 | 0.27 | |
| Test | 0.95 | 1.63 | |
| Sucrose | Training | 0.99 | 0.09 |
| Validation | 0.88 | 1.26 | |
| Test | 0.99 | 0.40 |


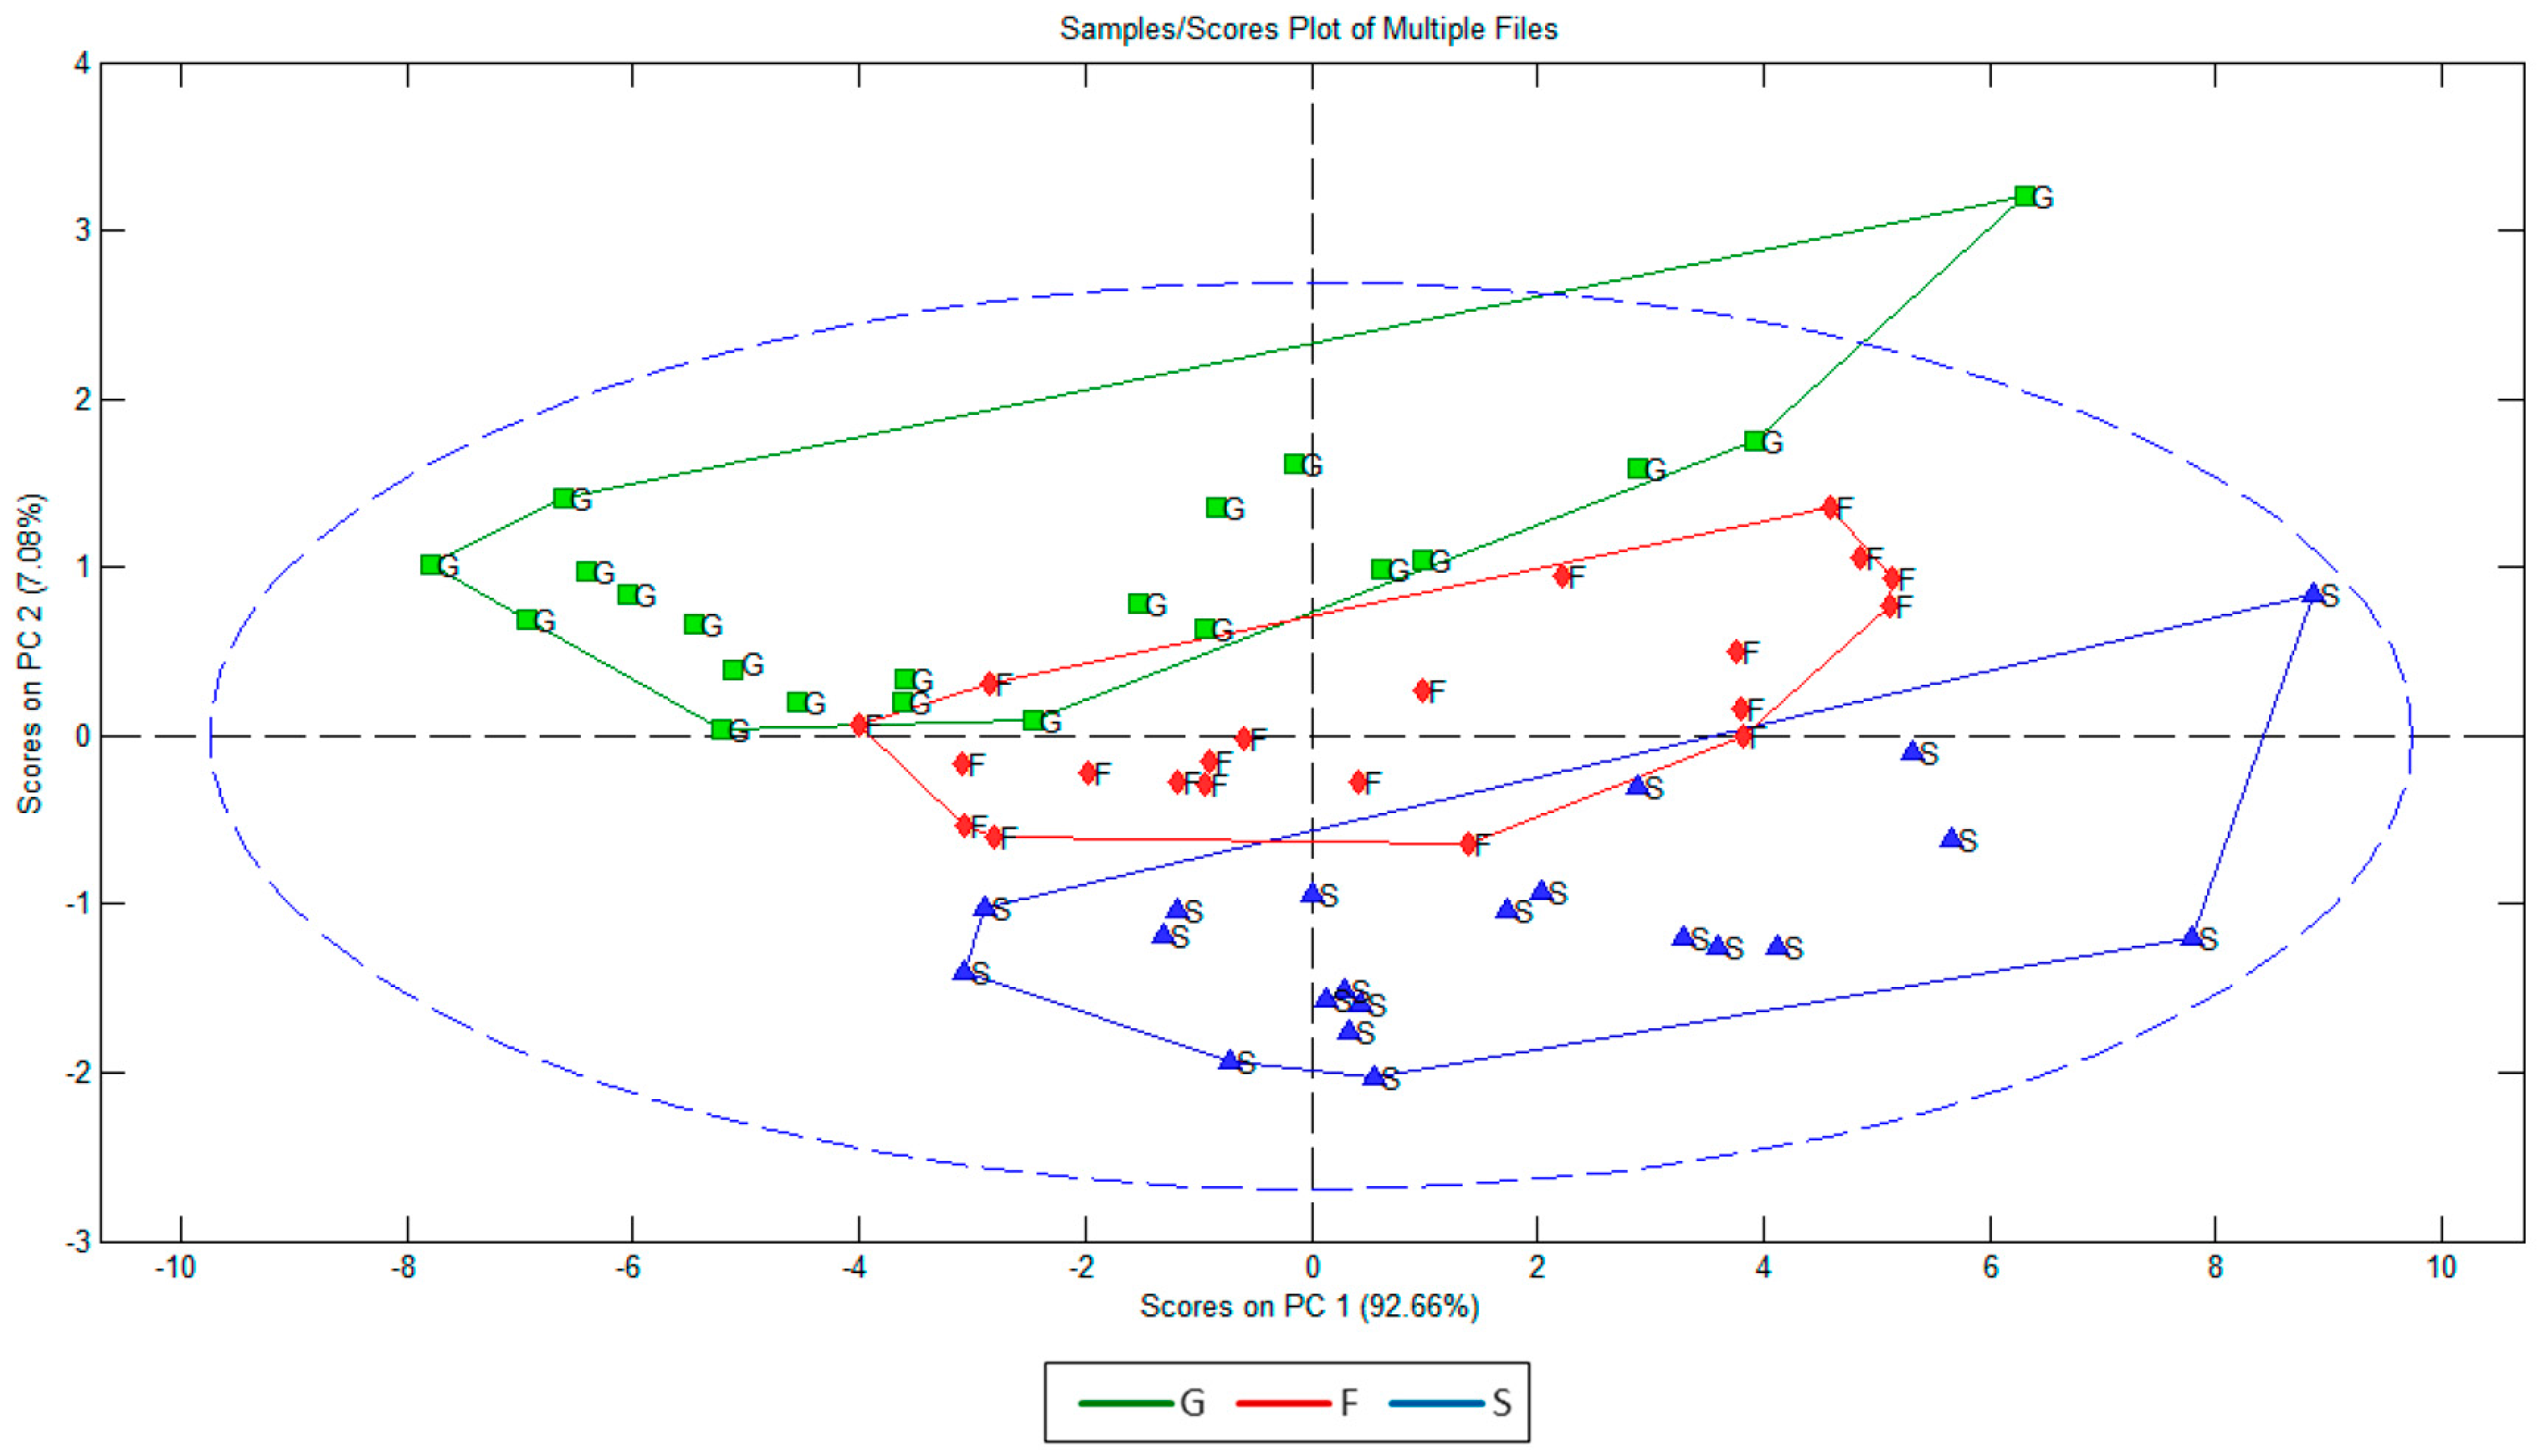
3.2. Combined Identification and Quantification of Glucose, Sucrose and Fructose
| Glucose: Mean CCR% = 93.443% | |||
| Training | Validation | Test | Overall |
 |  |  |  |
| Fructose: Mean CCR% = 96.721% | |||
| Training | Validation | Test | Overall |
 |  |  |  |
| Sucrose: Mean CCR% = 100% | |||
| Training | Validation | Test | Overall |
 |  |  |  |
4. Conclusions
Acknowledgments
Author Contributions
Conflicts of Interest
References
- FAOSTAT—Food and Agriculture Organization of the United Nations. Statistics Division. Available online: http://faostat.fao.org (accessed on 1 March 2015).
- Reinhardt, A.; Rodriguez, L.V. Industrial processing of pineapple—Trends and perspectives. Acta Hortic. 2009, 822, 323–328. [Google Scholar]
- Ketnawa, S.; Chaiwut, P.; Rawdkuen, S. Pineapple wastes: A potential source for bromelain extraction. Food Bioprod. Process. 2012, 90, 385–391. [Google Scholar] [CrossRef]
- Nigam, J.N. Continuous ethanol production from pineapple cannery waste. J. Biotechnol. 1999, 72, 197–202. [Google Scholar] [CrossRef]
- Tanaka, K.; Hilary, Z.D.; Ishizaki, A. Investigation of the utility of pineapple juice and pineapple waste material as low-cost substrate for ethanol fermentation by Zymomonas mobilis. J. Biosci. Bioeng. 1999, 87, 642–646. [Google Scholar] [CrossRef]
- Ruangviriyachai, C.; Niwaswong, C.; Kosaikanon, N.; Chanthai, S.; Chaimart, P. Pineapple Peel Waste for Bioethanol Production. J. Biotechnol. 2010, 150, 10. [Google Scholar] [CrossRef]
- Scheller, H.V.; Ulvskov, P. Hemicelluloses. Annu. Rev. Plant Biol. 2010, 61, 263–289. [Google Scholar] [CrossRef] [PubMed]
- Yang, B.; Dai, Z.; Ding, S.Y.; Wyman, C.E. Enzymatic Hydrolysis of Cellulosic Biomass. Biofuels 2011, 2, 421–450. [Google Scholar] [CrossRef]
- Sánchez-Mata, M.C.; Cámara-Hurtado, M.; Díez-Maqués, C. Identification and quantification of soluble sugars in green beans by HPLC. Eur. Food Res. Technol. 2002, 214, 254–258. [Google Scholar] [CrossRef]
- Karkacier, M.; Erbas, M.; Uslu, M.K.; Asku, M. Comparison of Different Extraction and Detection Methods for Sugars Using Amino-Bonded Phase HPLC. J. Chromatogr. Sci. 2003, 4, 1331–333. [Google Scholar] [CrossRef]
- Bard, A.J.; Faulkner, L.R. Electrochemical Methods: Fundamentals and Applications, 2nd ed.; John Wiley & Sons Inc.: New York, NY, USA, 2001; p. 833. [Google Scholar]
- Barsoukov, E.; Macdonald, J.R. Impedance Spectroscopy: Theory, Experiment and Applications, 2nd ed.; John Wiley & Sons Inc.: Hoboken, NJ, USA, 2005; p. 595. [Google Scholar]
- McRae, D.A.; Esrick, M.A. The dielectric parameters of excised EMT-6 tumors and their change during hyperthermia. Phys. Med. Biol. 1992, 37, 2045–2058. [Google Scholar] [CrossRef] [PubMed]
- Piccoli, A.; Pillon, L.; Dumler, F. Impedance vector distribution by sex, race, body mass index, and age in the United States: Standard reference intervals as bivariate Z scores. Nutrition 2002, 18, 153–167. [Google Scholar] [CrossRef]
- Nescolarde, L.; Piccoli, A.; Román, A.; Núñez, A.; Morales, R.; Tamayo, J.; Doñate, T.; Rosell, J. Bioelectrical impedance vector analysis in hemodialysis patients. Relation between oedema and mortality. Physiol. Meas. 2004, 25, 1271–1280. [Google Scholar] [CrossRef] [PubMed]
- Pan, L.K.; Huang, H.T.; Sun, C.Q. Dielectric relaxation and transition of porous silicon. J. Appl. Phys. 2003, 94, 2695–2700. [Google Scholar] [CrossRef]
- Prabakar, K.; Mallikarjun, S.P. Complex impedance spectroscopy studies on fatigued soft and hard PZT ceramics. J. Alloy. Compd. 2007, 437, 302–310. [Google Scholar] [CrossRef]
- Cen, J.; Vukas, M.; Barton, G.; Kavanagh, J.; Coster, H.G.L. Real time fouling monitoring with Electrical Impedance Spectroscopy. J. Membr. Sci. 2015, 484, 133–139. [Google Scholar] [CrossRef]
- Houssin, T.; Follet, J.; Follet, A.; Dei-Cas, E.; Senez, V. Label-free analysis of water-polluting parasite by electrochemical impedance spectroscopy. Biosens. Bioelectron. 2010, 25, 1122–1129. [Google Scholar] [CrossRef] [PubMed]
- Rosborg, B.; Pan, J. An electrochemical impedance spectroscopy study of copper in a bentonite/saline groundwater environment. Electrochimica Acta 2008, 53, 7556–7564. [Google Scholar] [CrossRef]
- García-Breijo, E.; Barat, J.M.; Torres, O.L.; Grau, R.; Gil, L.; Ibáñez, J.; Alcañiz, M.; Masot, R.; Fraile, R. Development of a puncture electronic device for electrical conductivity measurements throughout meat salting. Sens. Actuators A Phys. 2008, 148, 63–67. [Google Scholar] [CrossRef]
- Masot, R.; Alcañiz, M.; Fuentes, A.; Schmidt, F.C.; Barat, J.M.; Gil, L.; Baigts, D.; Martínez-Máñez, R.; Soto, J. Design of a low-cost non-destructive system for punctual measurements of salt levels in food products using impedance spectroscopy. Sens. Actuators A Phys. 2010, 158, 217–223. [Google Scholar] [CrossRef]
- Karásková, P.; Fuentes, A.; Fernández-Segovia, I.; Alcañiz, M.; Masot, R.; Barat, J.M. Development of a low-cost non-destructive system for measuring moisture and salt content in smoked fish products. Procedia Food Sci. 2011, 1, 1195–1201. [Google Scholar] [CrossRef]
- Alcañiz, M.; Vivancos, J.L.; Masot, R.; Ibañez, J.; Raga, M.; Soto, J.; Martínez Máñez, R. Design of an electronic system and its application to electronic tongues using variable amplitude pulse voltammetry and impedance spectroscopy. J. Food Eng. 2012, 111, 122–128. [Google Scholar] [CrossRef]
- Fernández-Segovia, I.; Fuentes, A.; Aliño, M.; Masot, R.; Alcañiz, M.; Barat, J.M. Detection of frozen-thawed salmon (Salmo salar) by a rapid low-cost method. J. Food Eng. 2012, 113, 210–216. [Google Scholar] [CrossRef]
- Fuentes, A.; Masot, R.; Fernández-Segovia, I.; Ruiz-Rico, M.; Alcañiz, M.; Barat, J.M. Differentiation between fresh and frozen-thawed sea bream (Spaurus aurata) using impedance spectroscopy techniques. Innov. Food Sci. Emerg. 2013, 19, 210–217. [Google Scholar] [CrossRef]
- Pérez-Esteve, E.; Fuentes, A.; Grau, R.; Fernández-Segovia, I.; Masot, R.; Alcañiz, M.; Barat, J.M. Use of impedance spectroscopy for predicting freshness of sea bream (Sparus aurata). Food Control 2014, 35, 360–365. [Google Scholar] [CrossRef]
- Labrador, R.H.; Masot, R.; Alcañiz, M.; Baigts, D.; Soto, J.; Martinez-Mañez, R.; García-Breijo, E.; Gil, L.; Barat, J.R. Prediction of NaCl, nitrate and nitrite contents in minced meat by using a voltammetric electronic tongue and an impedimetric sensor. Food Chem. 2010, 122, 865–870. [Google Scholar] [CrossRef]
- De Jesús, C.; Hernández-Coronado, G.; Girón, J.; Barat, J.M.; Pagan, M.J.; Alcañiz, M.; Masot, R.; Grau, R. Classification of unaltered and altered dry-cured ham by impedance spectroscopy: A preliminary study. Meat Sci. 2014, 98, 695–700. [Google Scholar] [CrossRef] [PubMed]
- Rizo, A.; Fuentes, A.; Fernández-Segovia, I.; Masot, R.; Alcañiz, M.; Barat, J.M. Development of a new salmon salting-smoking method and process monitoring by impedance spectroscopy. LWT-Food Sci. Technol. 2013, 51, 218–224. [Google Scholar] [CrossRef]
- Wu, L.; Ogawa, Y.; Tagawa, A. Electrical impedance spectroscopy analysis of eggplant pulp and effects of drying and freezing–thawing treatments on its impedance characteristics. J. Food Eng. 2008, 87, 274–280. [Google Scholar] [CrossRef]
- Bishop, C.M. Neural Networks for Pattern Recognition; Oxford University Press: New York, NY, USA, 1995; p. 504. [Google Scholar]
- Grossberg, S. Adaptive pattern classification and universal recoding. II. Feedback, expectation, olfaction, illusions. Biol. Cybern. 1973, 23, 187–202. [Google Scholar]
- Llobet, E.; Hines, E.L.; Gardner, J.W.; Bartlett, P.N.; Mottram, T.T. Fuzzy ARTMAP based electronic nose data analysis. Sens. Actuators B Chem. 1999, 61, 183–190. [Google Scholar] [CrossRef]
- Brezmes, J.; Cabre, P.; Rojo, S.; Llobet, E.; Xilanova, X.; Correig, X. Discrimination between different samples of olive oil using variable selection techniques and modified fuzzy artmap neural networks. IEEE Sens. J. 2005, 5, 463–470. [Google Scholar] [CrossRef]
- Moreno-Barón, L.; Cartas, R.; Merkoçi, A.; Alegret, S.; del Valle, M.; Leija, L.; Hernandez, P.R.; Muñoz, R. Application of the wavelet transform coupled with artificial neural networks for quantification purposes in a voltammetric electronic tongue. Sens. Actuators B Chem. 2006, 113, 487–499. [Google Scholar] [CrossRef]
- Gil, L.; Barat, J.M.; Baigts, D.; Martínez-Máñez, R.; Soto, J.; Garcia-Breijo, E.; Aristoy, M.C.; Toldrá, F.; Llobet, E. Monitoring of physical-chemical and microbiological changes in fresh pork meat under cold storage by means of a potentiometric electronic tongue. Food Chem. 2011, 126, 1261–1268. [Google Scholar] [CrossRef]
- Ibáñez Civera, J.; Garcia Breijo, E.; Laguarda Miró, N.; Gil Sánchez, L.; Garrigues Baixauli, J.; Romero Gil, I.; Masot Peris, R.; Alcañiz Fillol, M. Artificial neural network onto eight bit microcontroller for Secchi depth calculation. Sensor Actuat B Chem. 2011, 156, 132–139. [Google Scholar] [CrossRef]
- García-Breijo, E.; Garrigues, J.; Gil, L.; Laguarda-Miró, N. An Embedded Simplified Fuzzy ARTMAP Implemented on a Microcontroller for Food Classification. Sensors 2013, 13, 10418–10429. [Google Scholar] [CrossRef] [PubMed]
- Laguarda-Miró, N.; Werner Ferreira, F.; García-Breijo, E.; Ibañez-Civera, J.; Gil-Sánchez, L.; Garrigues-Baixauli, J. Glyphosate detection by voltammetric techniques. A comparison between statistical methods and an artificial neural network. Sens. Actuators B Chem. 2012, 171–172, 528–536. [Google Scholar] [CrossRef]
- Martínez Gil, P.; Laguarda-Miró, N.; Soto Camino, J.; Masot Peris, R. Glyphosate detection with ammonium nitrate and humic acids as potential interfering substances by pulsed voltammetry technique. Talanta 2013, 115, 702–705. [Google Scholar] [CrossRef] [PubMed]
- Sierra, E.V.; Méndez, M.A.; Sarria, V.M.; Cortés, M.T. Electrooxidation of glyphosate on nickel and copper electrodes. Quim. Nova 2008, 31, 220–226. [Google Scholar] [CrossRef]
- Conesa, C.; Bernat-Senent, I.; Seguí, L.; Fito, P. Pretratamiento con microondas para la obtención de bioetanol a partir de los residuos industriales de piña: Una propuesta de mejora de la hidrólisis enzimática. In Libro de Resúmenes, Proceedings of IX Congreso Iberoamericano de Ingeniería de Alimentos, Valencia, Spain, 13–16 January 2014. (In Spanish)
- Hastie, T.; Tibshirani, R.T.; Friedman, J. The Elements of Statistical Learning, 2nd ed.; Springer: Stanford, CA, USA, 2009; p. 764. [Google Scholar]
- Del Brío, B.M.; Molina, A.S. Redes Neuronales y Sistemas Borrosos, 2nd ed.; Ra-Ma: Madrid, Spain, 2001; p. 399. (In Spanish) [Google Scholar]
© 2015 by the authors; licensee MDPI, Basel, Switzerland. This article is an open access article distributed under the terms and conditions of the Creative Commons Attribution license (http://creativecommons.org/licenses/by/4.0/).
Share and Cite
Conesa, C.; García-Breijo, E.; Loeff, E.; Seguí, L.; Fito, P.; Laguarda-Miró, N. An Electrochemical Impedance Spectroscopy-Based Technique to Identify and Quantify Fermentable Sugars in Pineapple Waste Valorization for Bioethanol Production. Sensors 2015, 15, 22941-22955. https://doi.org/10.3390/s150922941
Conesa C, García-Breijo E, Loeff E, Seguí L, Fito P, Laguarda-Miró N. An Electrochemical Impedance Spectroscopy-Based Technique to Identify and Quantify Fermentable Sugars in Pineapple Waste Valorization for Bioethanol Production. Sensors. 2015; 15(9):22941-22955. https://doi.org/10.3390/s150922941
Chicago/Turabian StyleConesa, Claudia, Eduardo García-Breijo, Edwin Loeff, Lucía Seguí, Pedro Fito, and Nicolás Laguarda-Miró. 2015. "An Electrochemical Impedance Spectroscopy-Based Technique to Identify and Quantify Fermentable Sugars in Pineapple Waste Valorization for Bioethanol Production" Sensors 15, no. 9: 22941-22955. https://doi.org/10.3390/s150922941
APA StyleConesa, C., García-Breijo, E., Loeff, E., Seguí, L., Fito, P., & Laguarda-Miró, N. (2015). An Electrochemical Impedance Spectroscopy-Based Technique to Identify and Quantify Fermentable Sugars in Pineapple Waste Valorization for Bioethanol Production. Sensors, 15(9), 22941-22955. https://doi.org/10.3390/s150922941