
A Charrelation Matrix-Based Blind Adaptive Detector for DS-CDMA Systems


Abstract
:1. Introduction
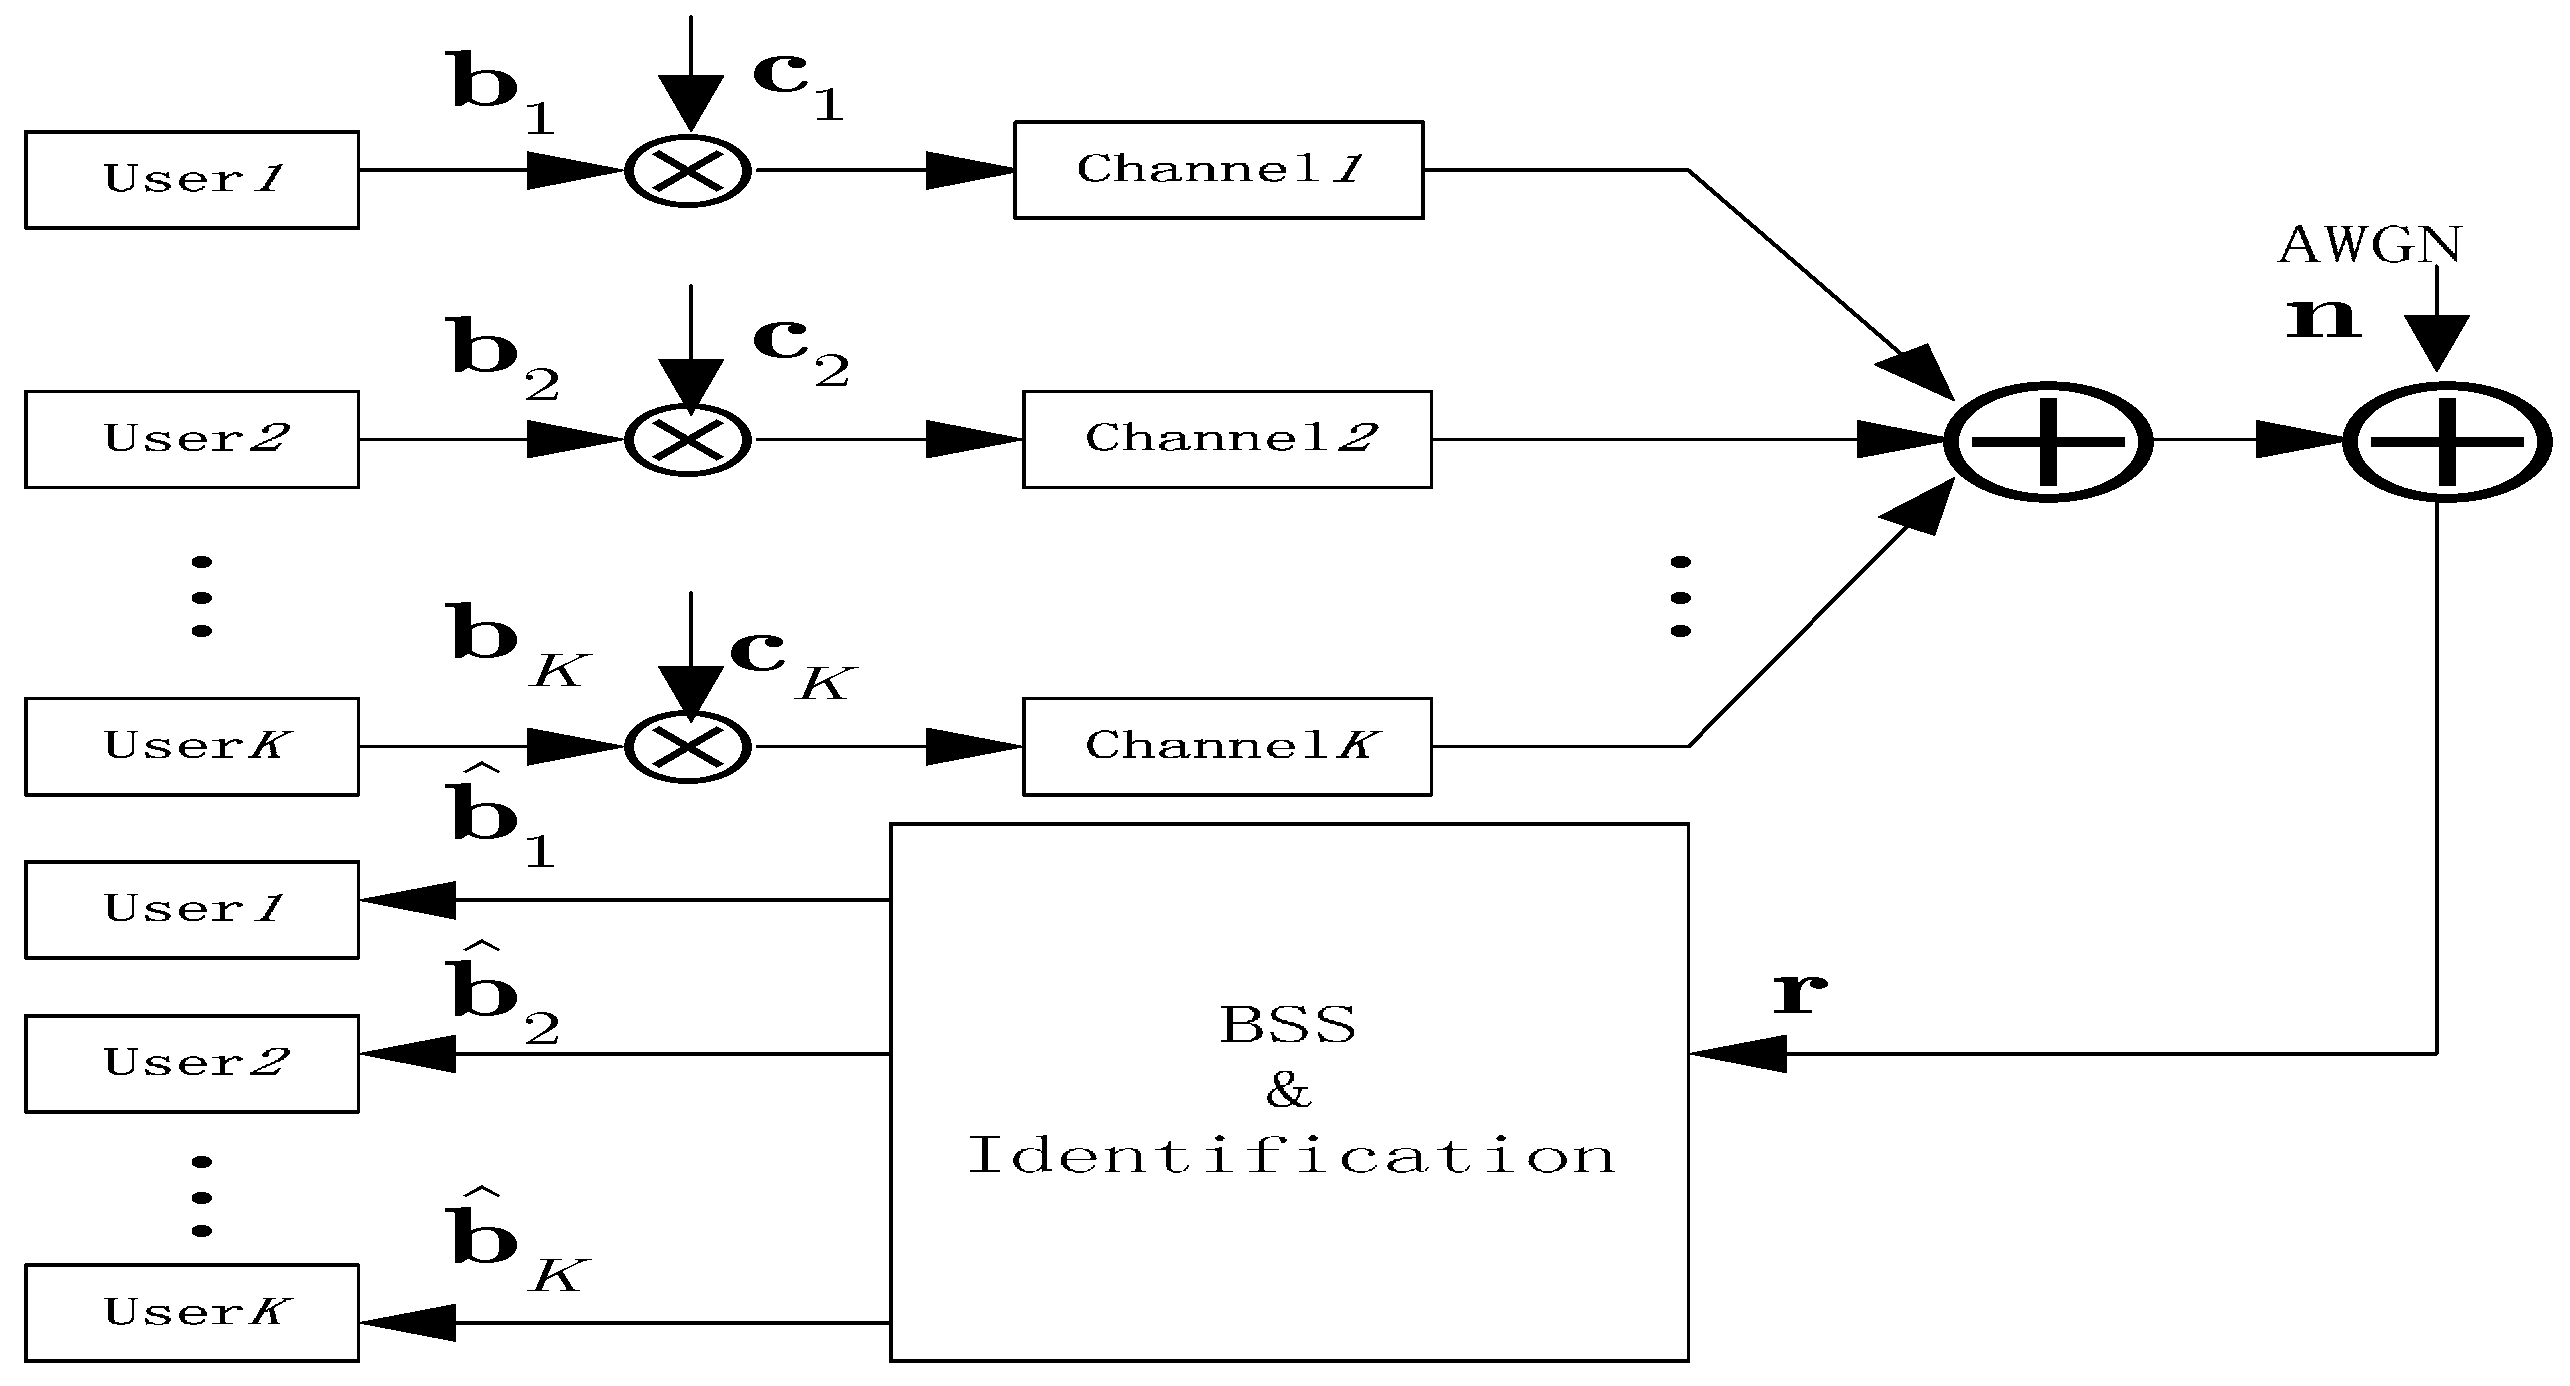
2. System Model
3. Charrelation Matrix Based Blind Detector for DS-CDMA System

3.1. Charrelation Matrix Based Blind Source Separation
3.2. Estimation Charrelation Matrix
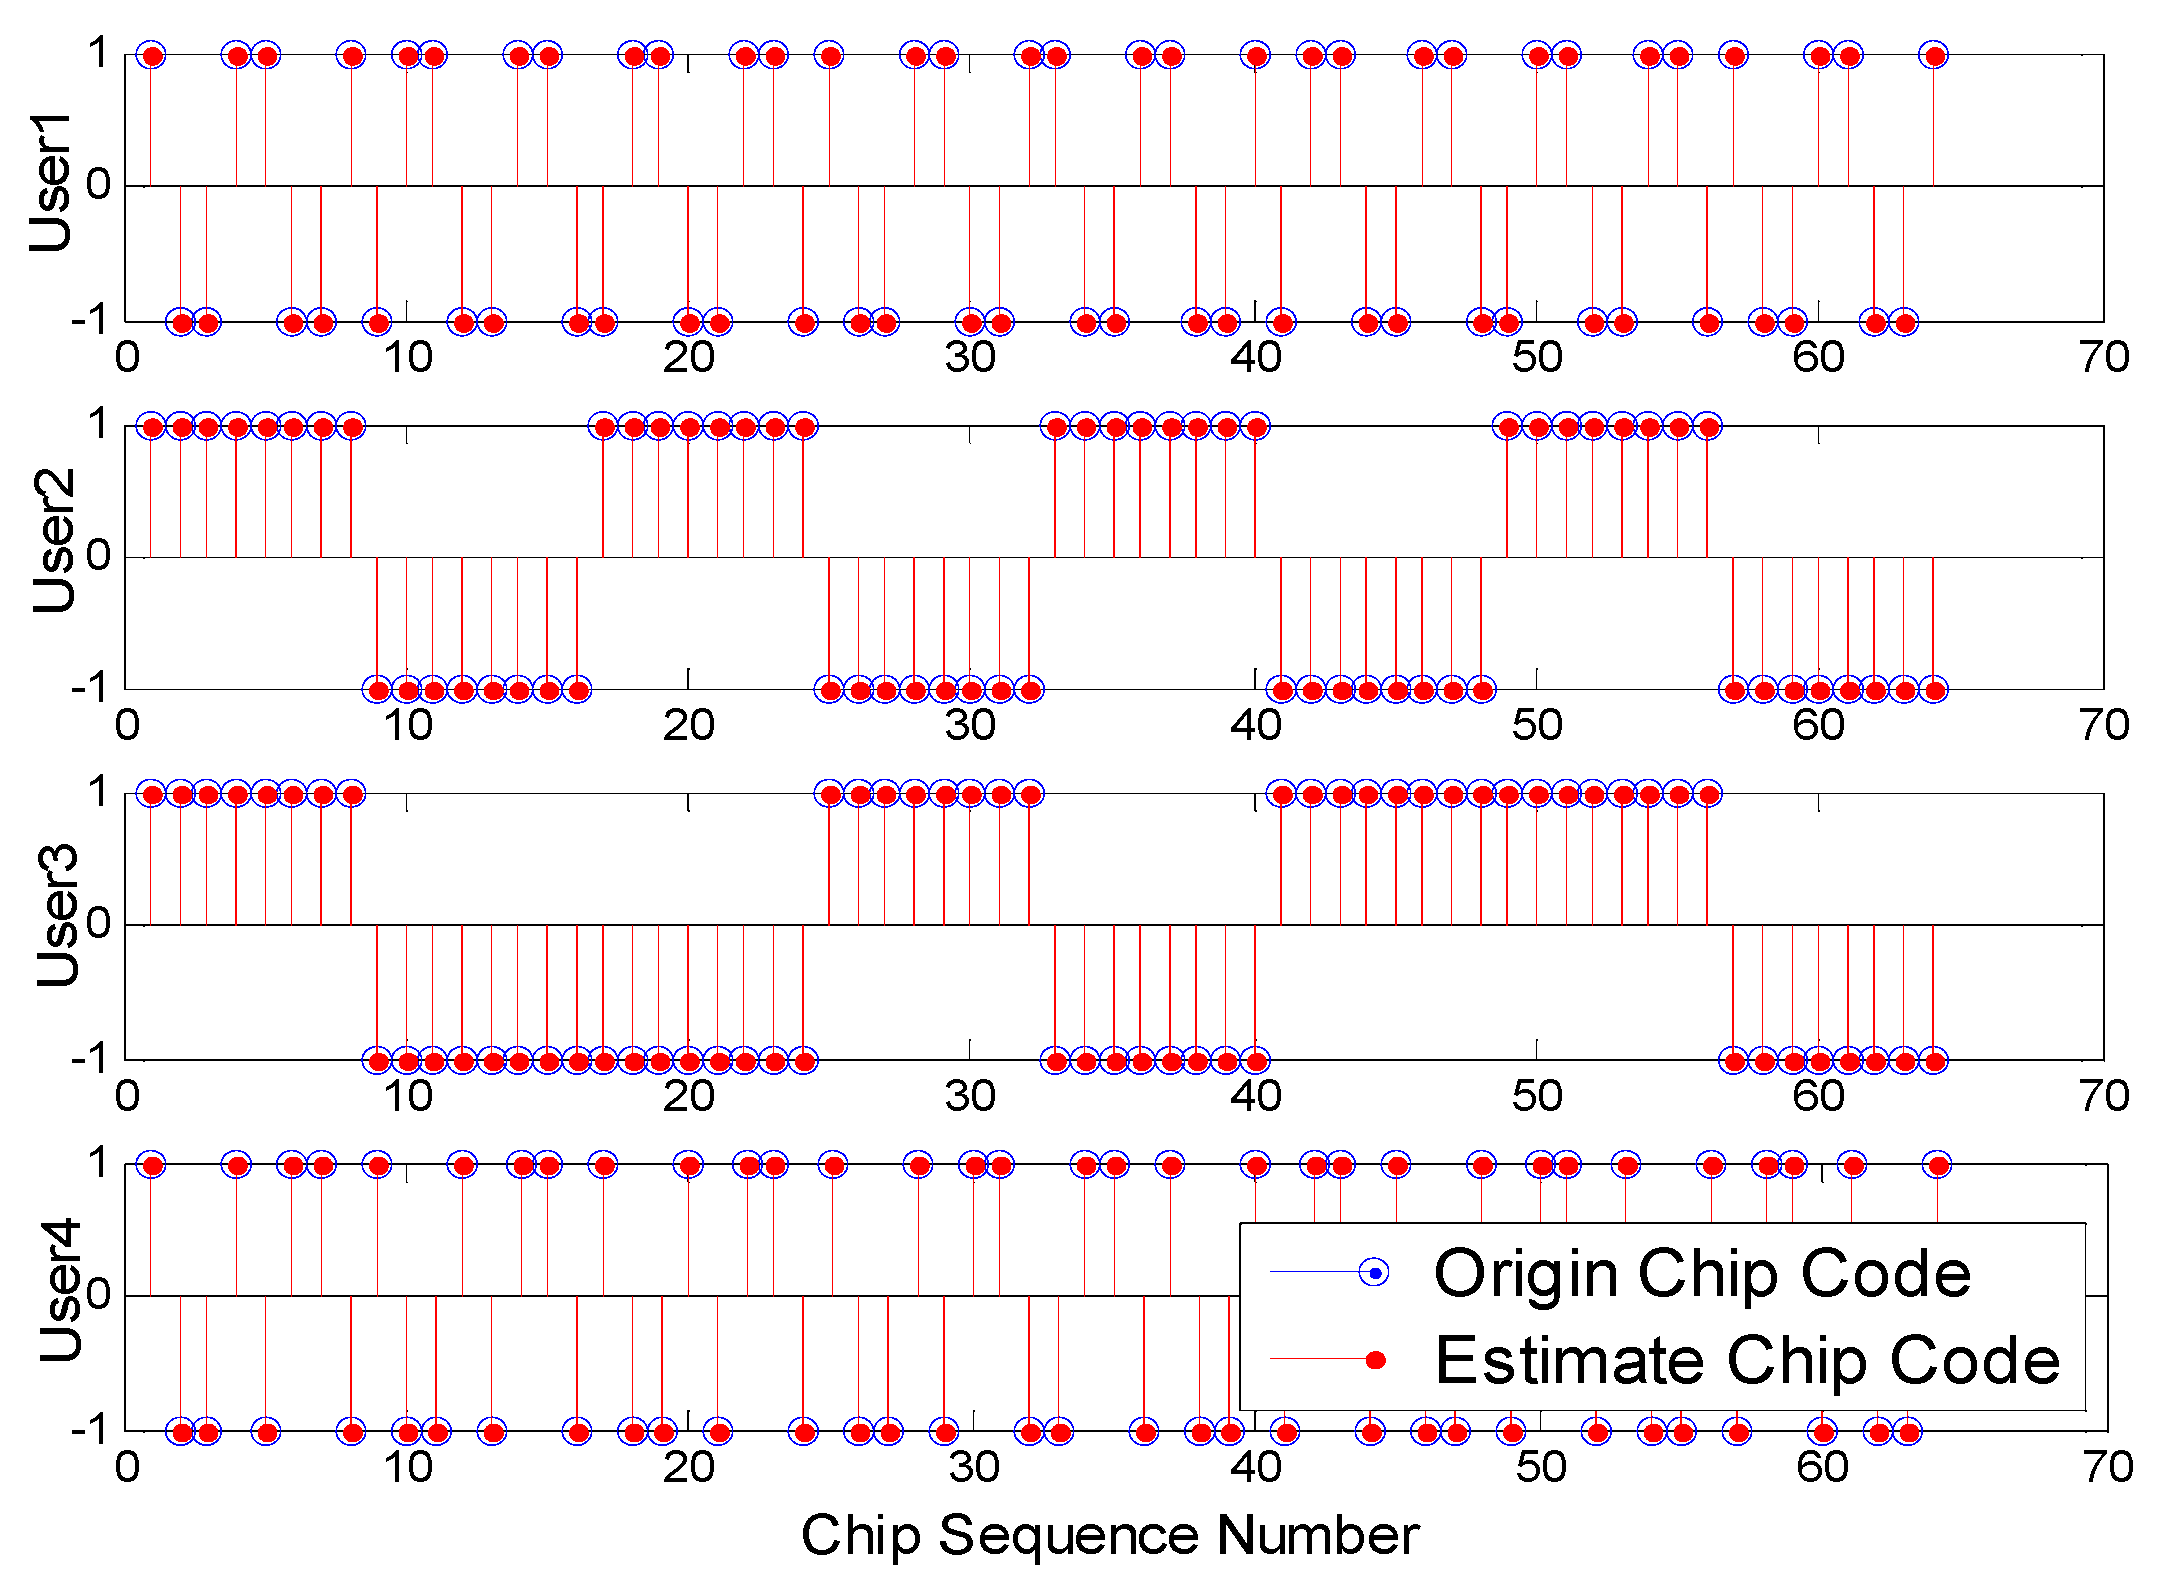
3.3. Blind User Separation and Blind Spreading/Chip Sequence Estimation

|
|
3.4. Performance Analysis
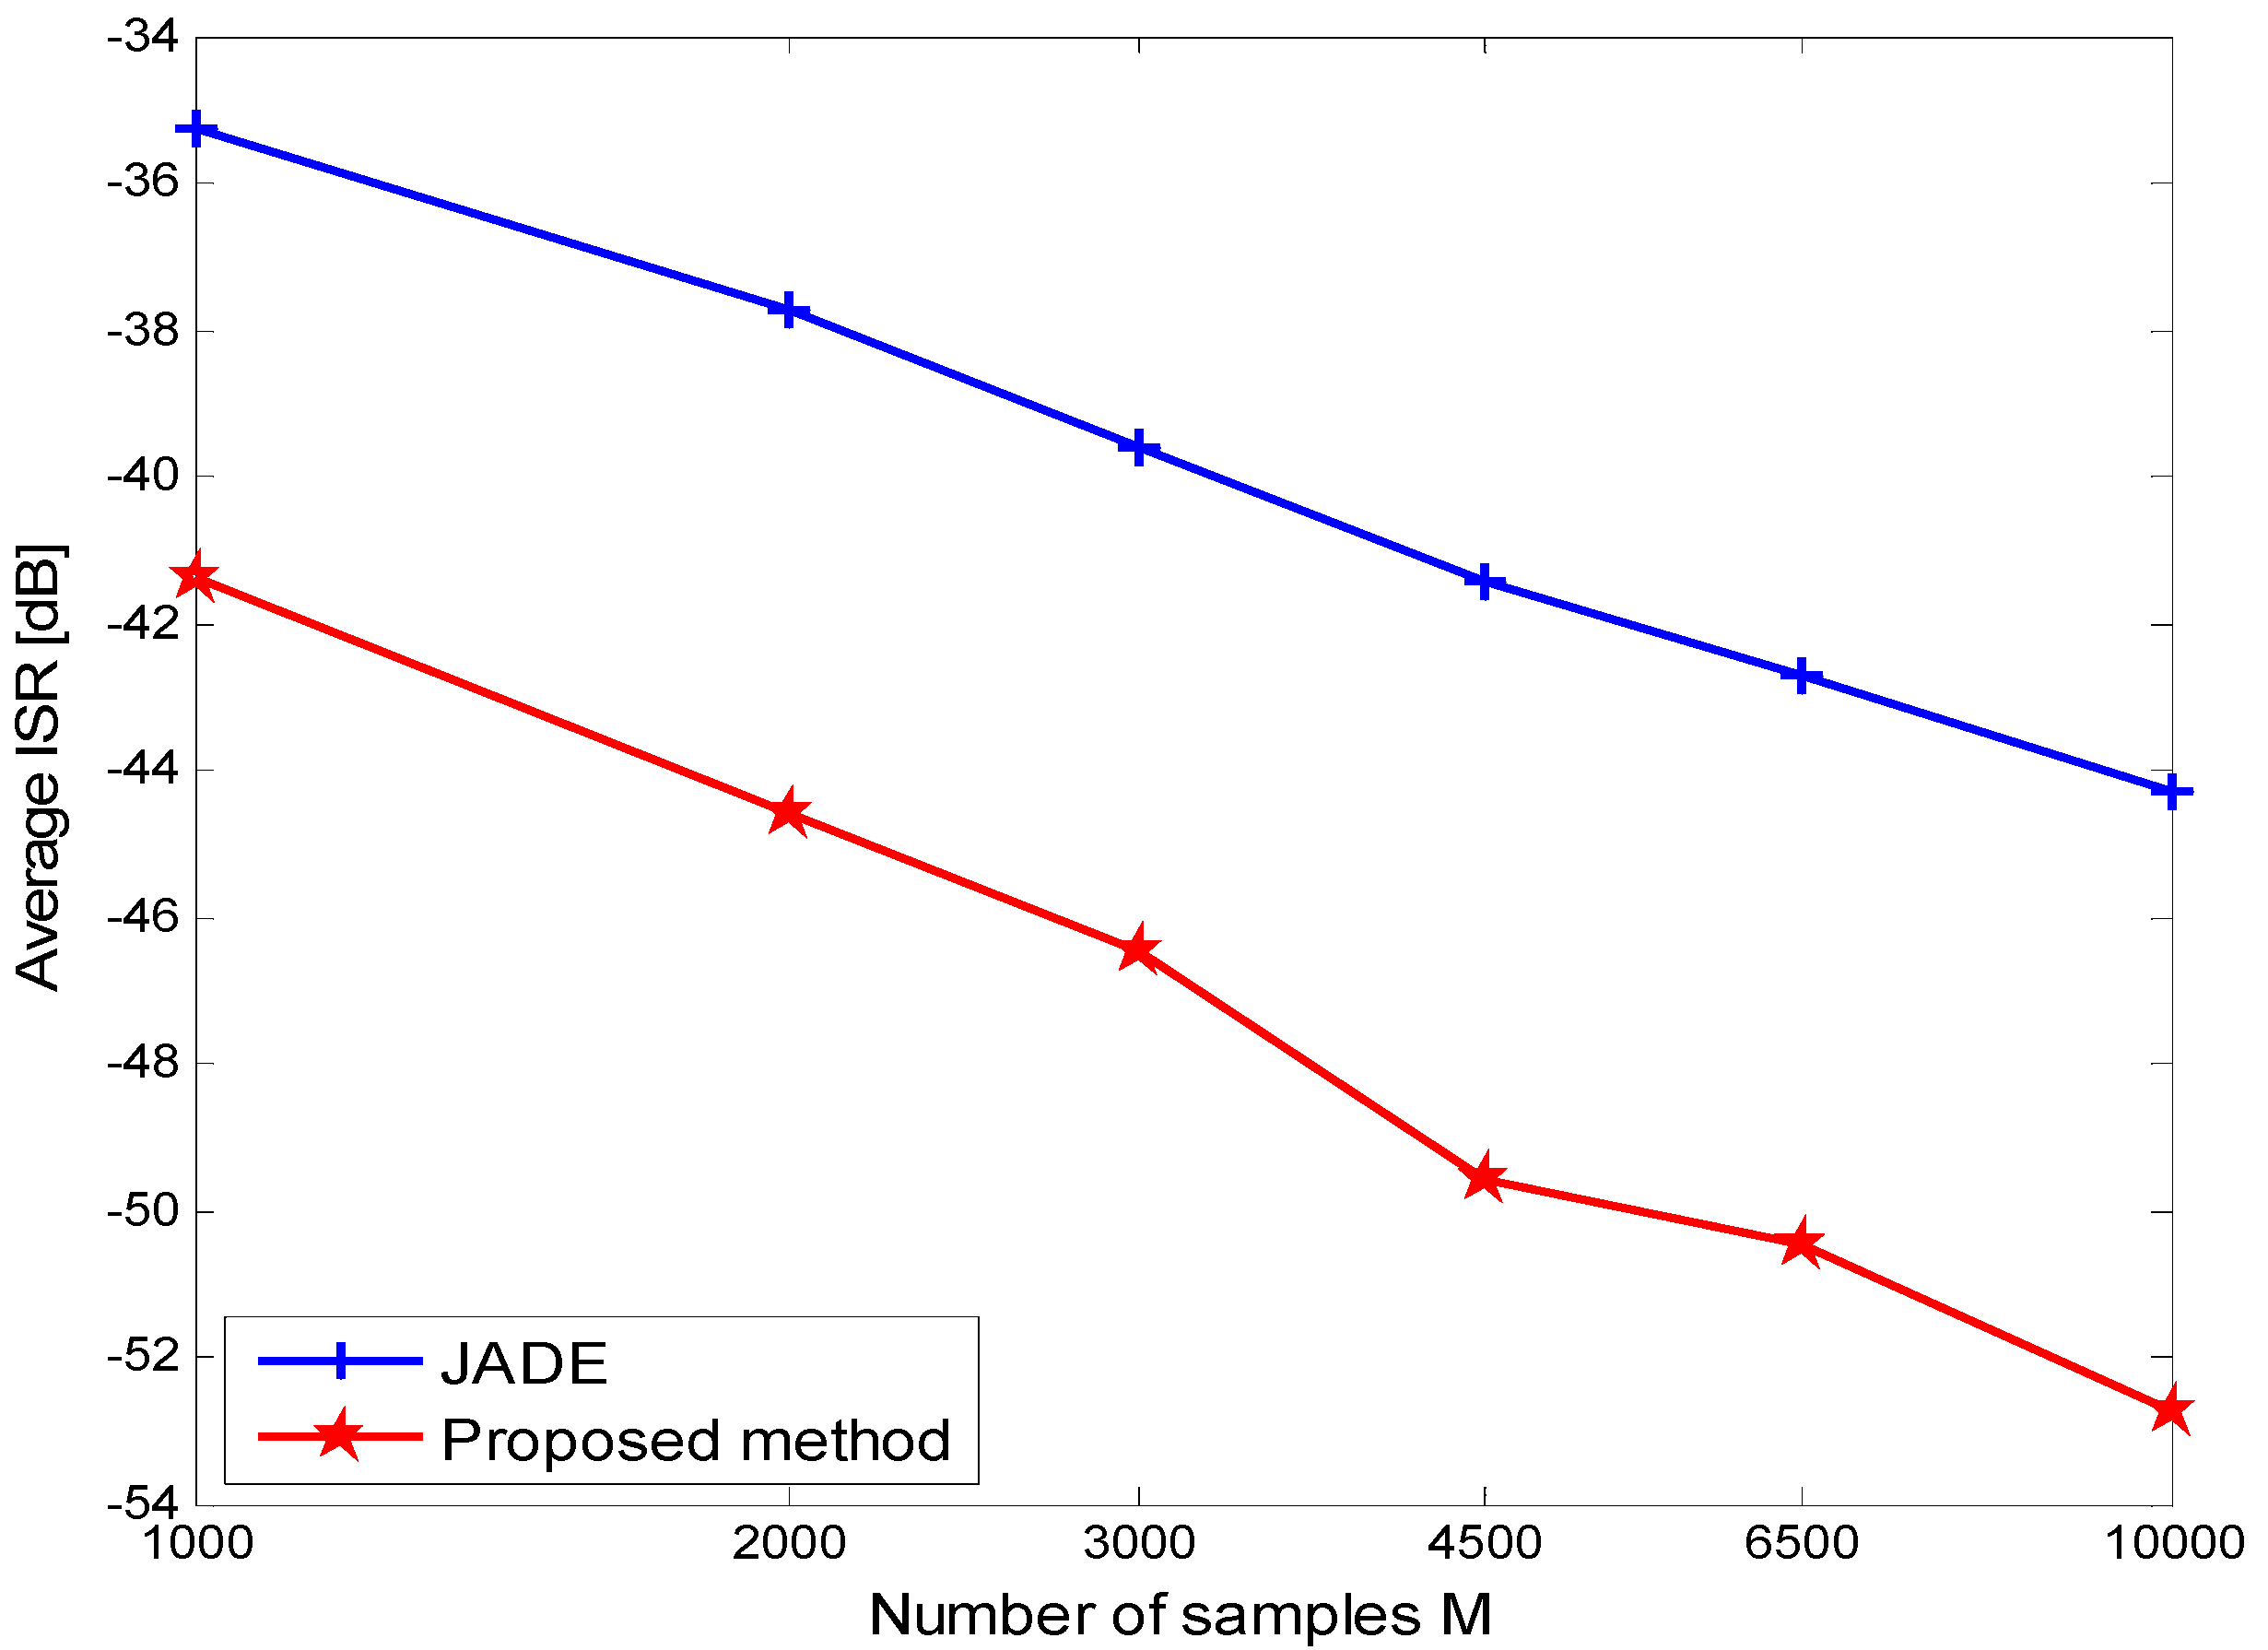
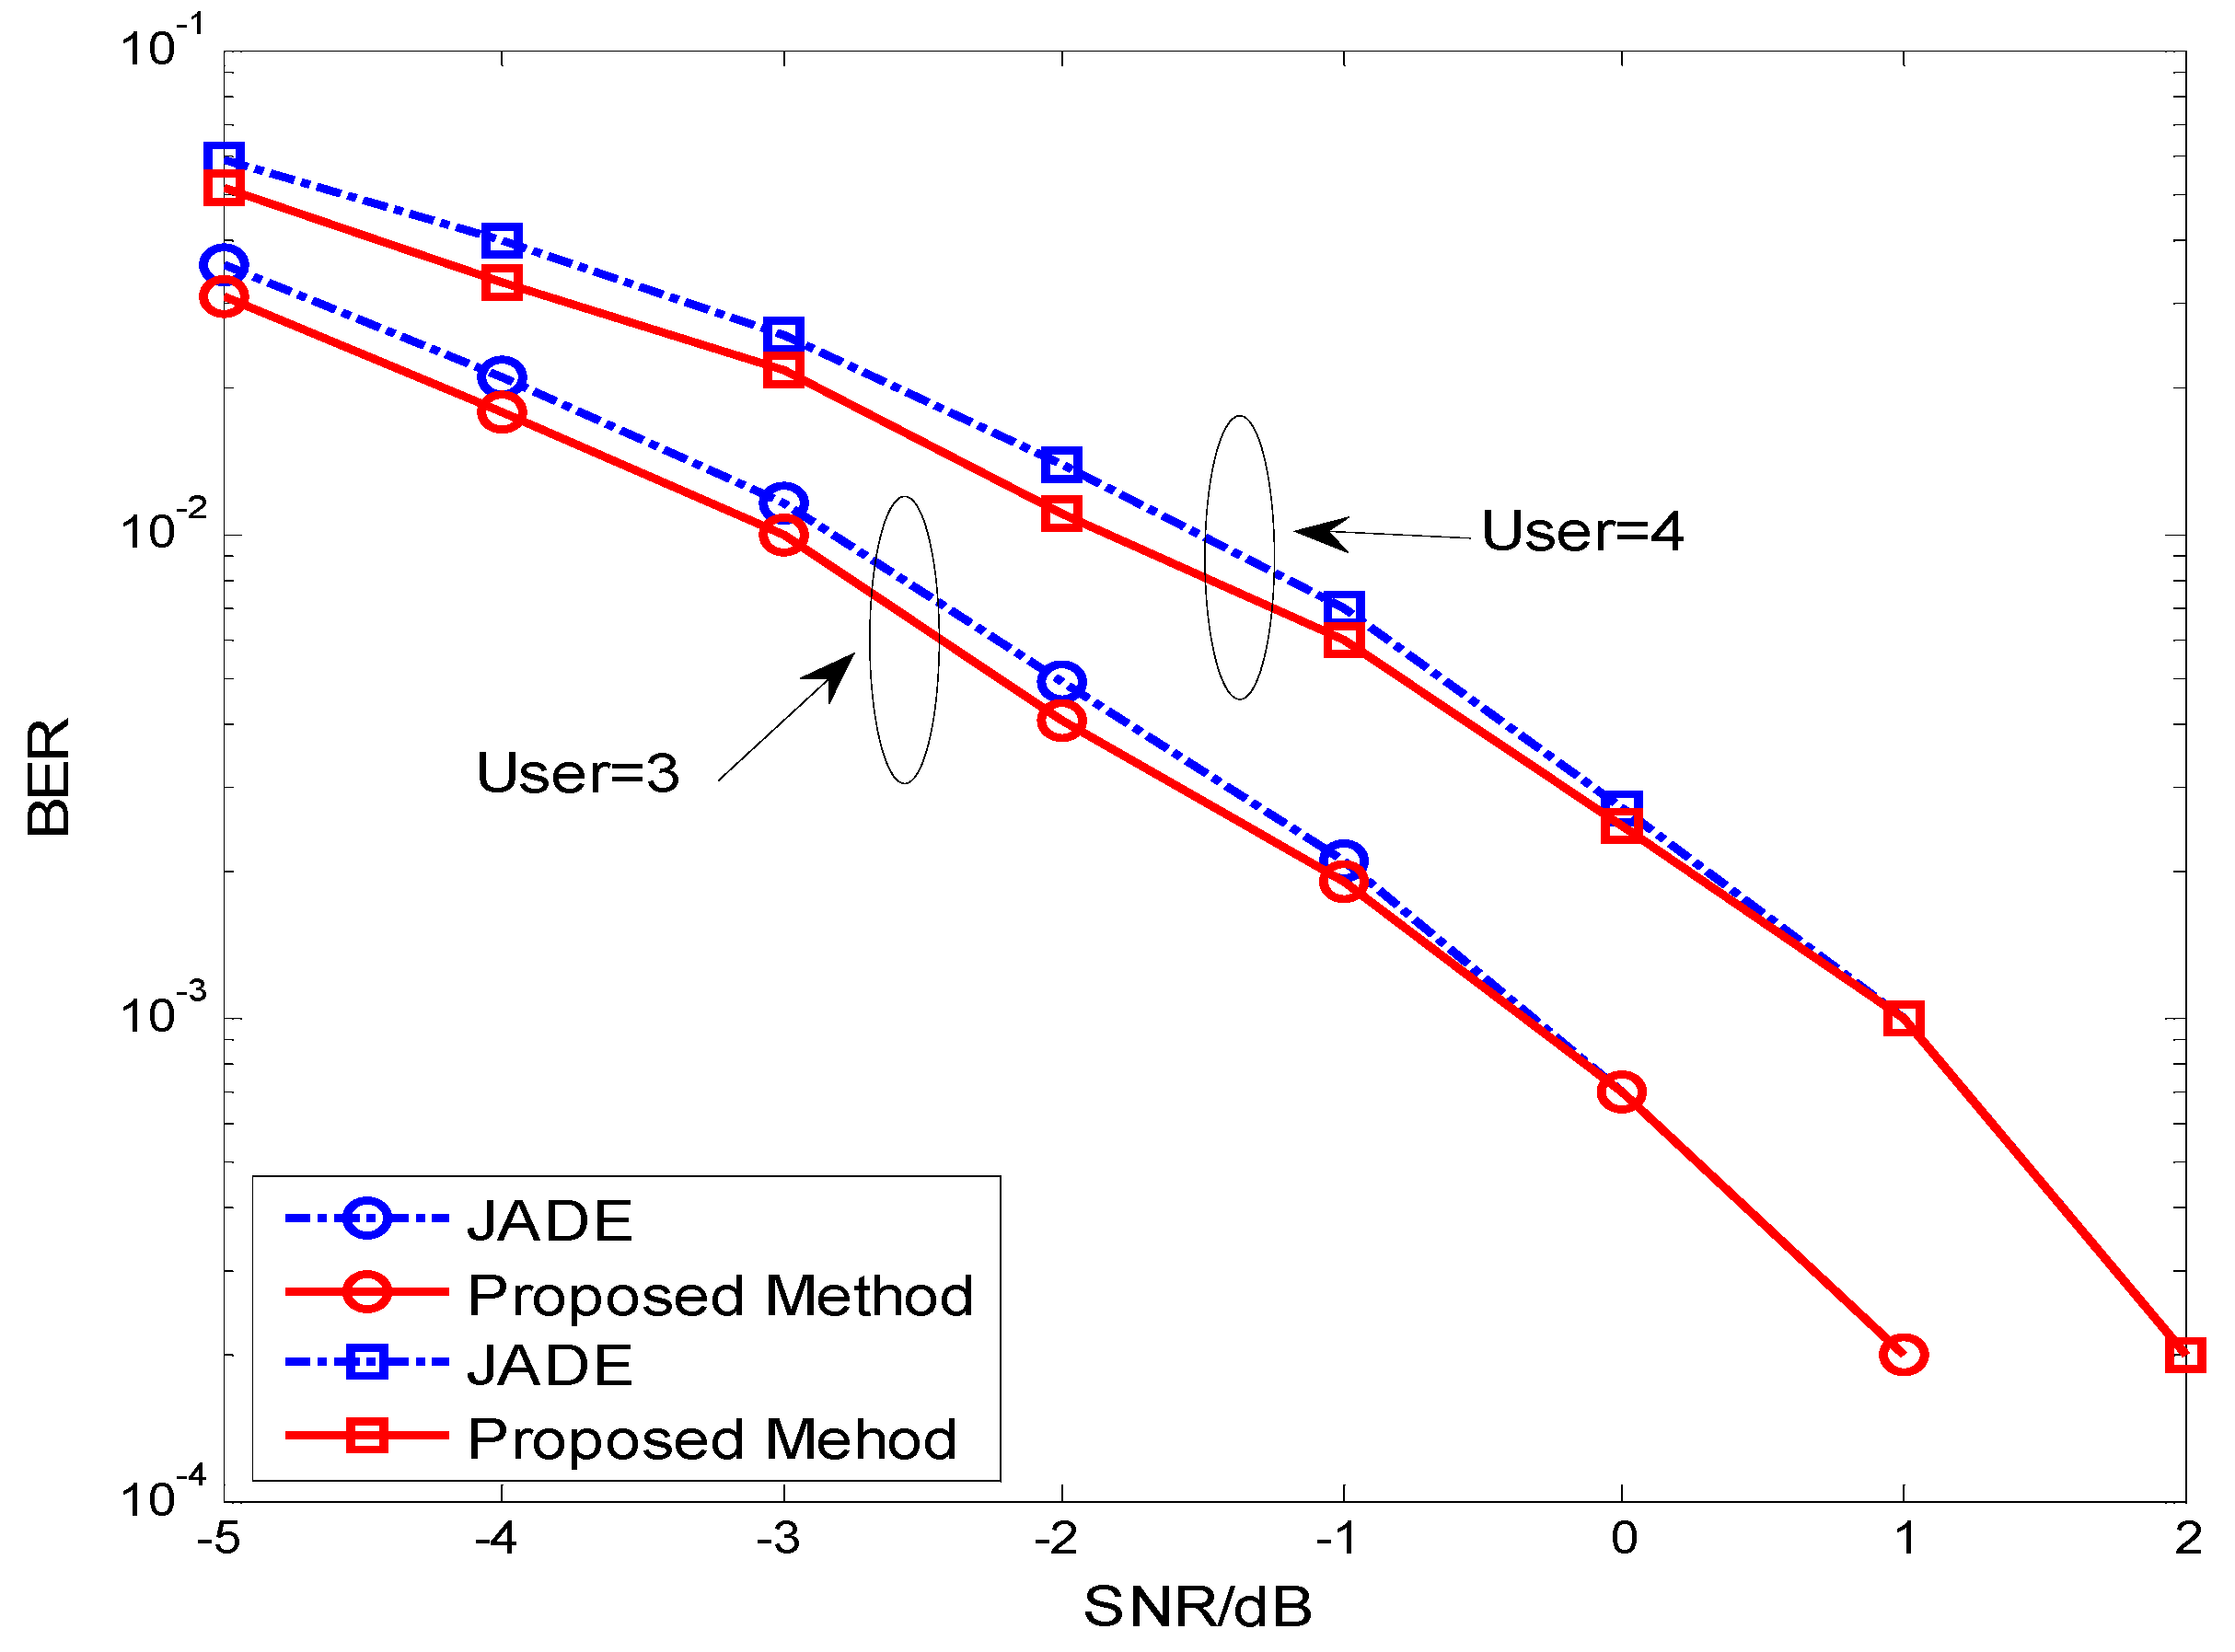
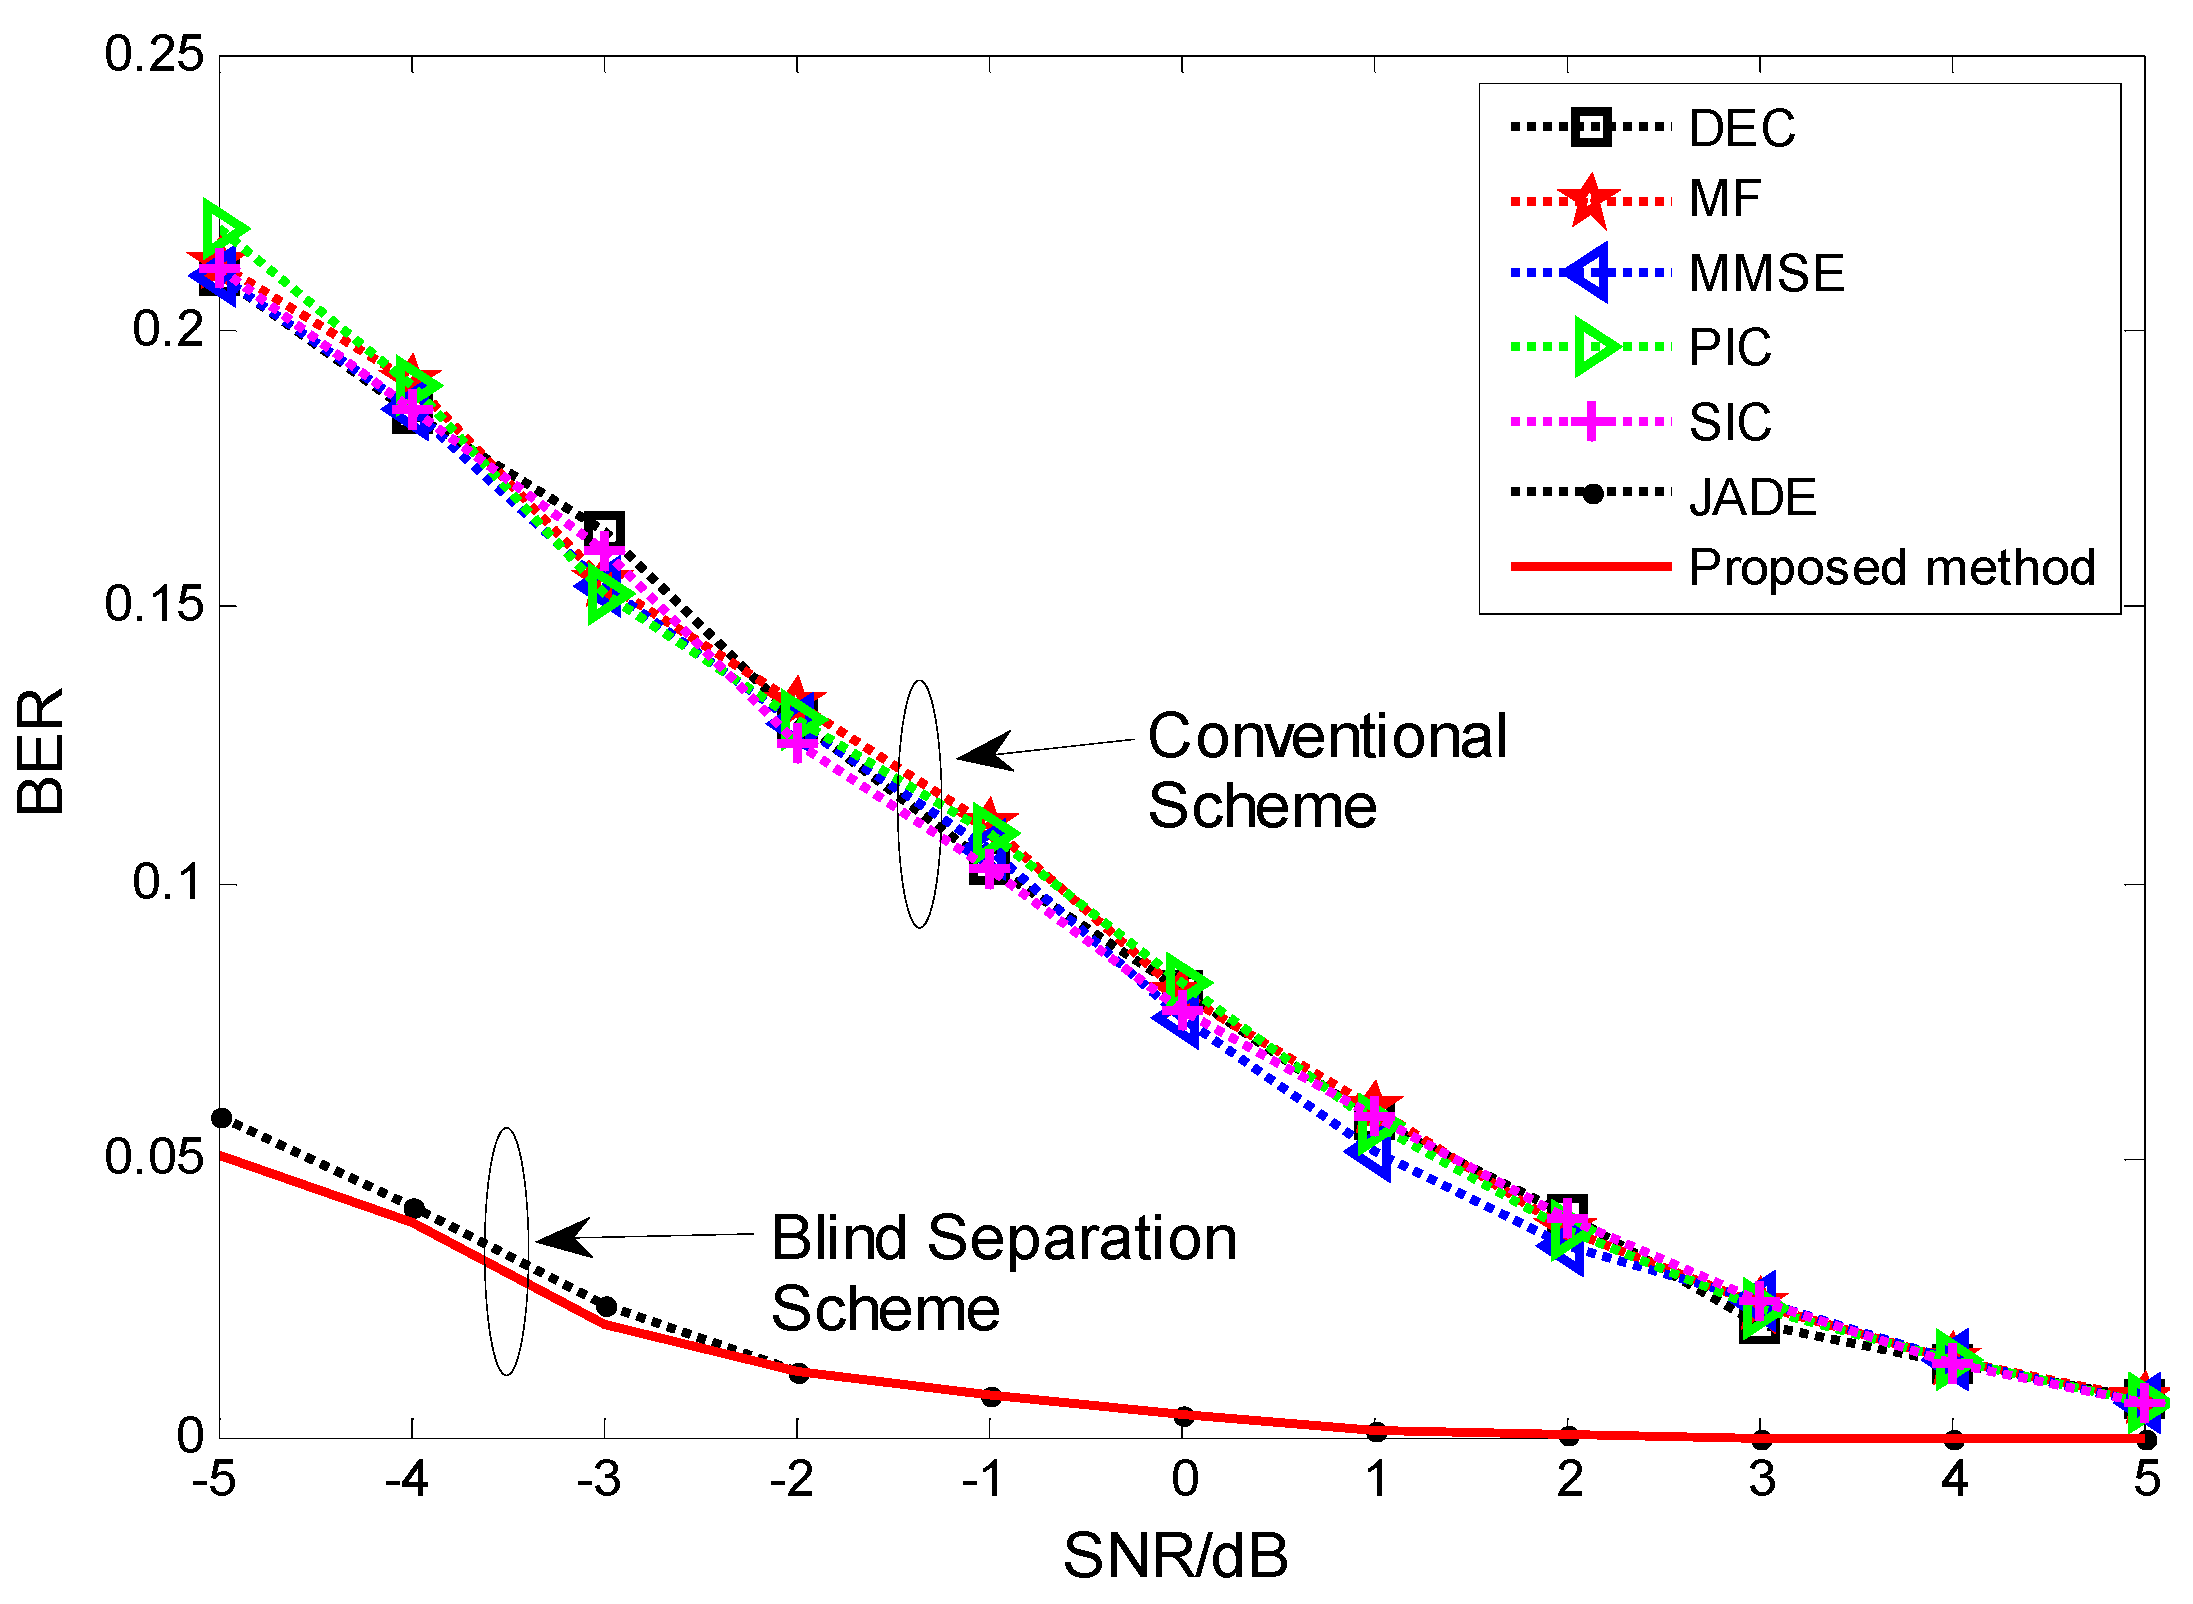
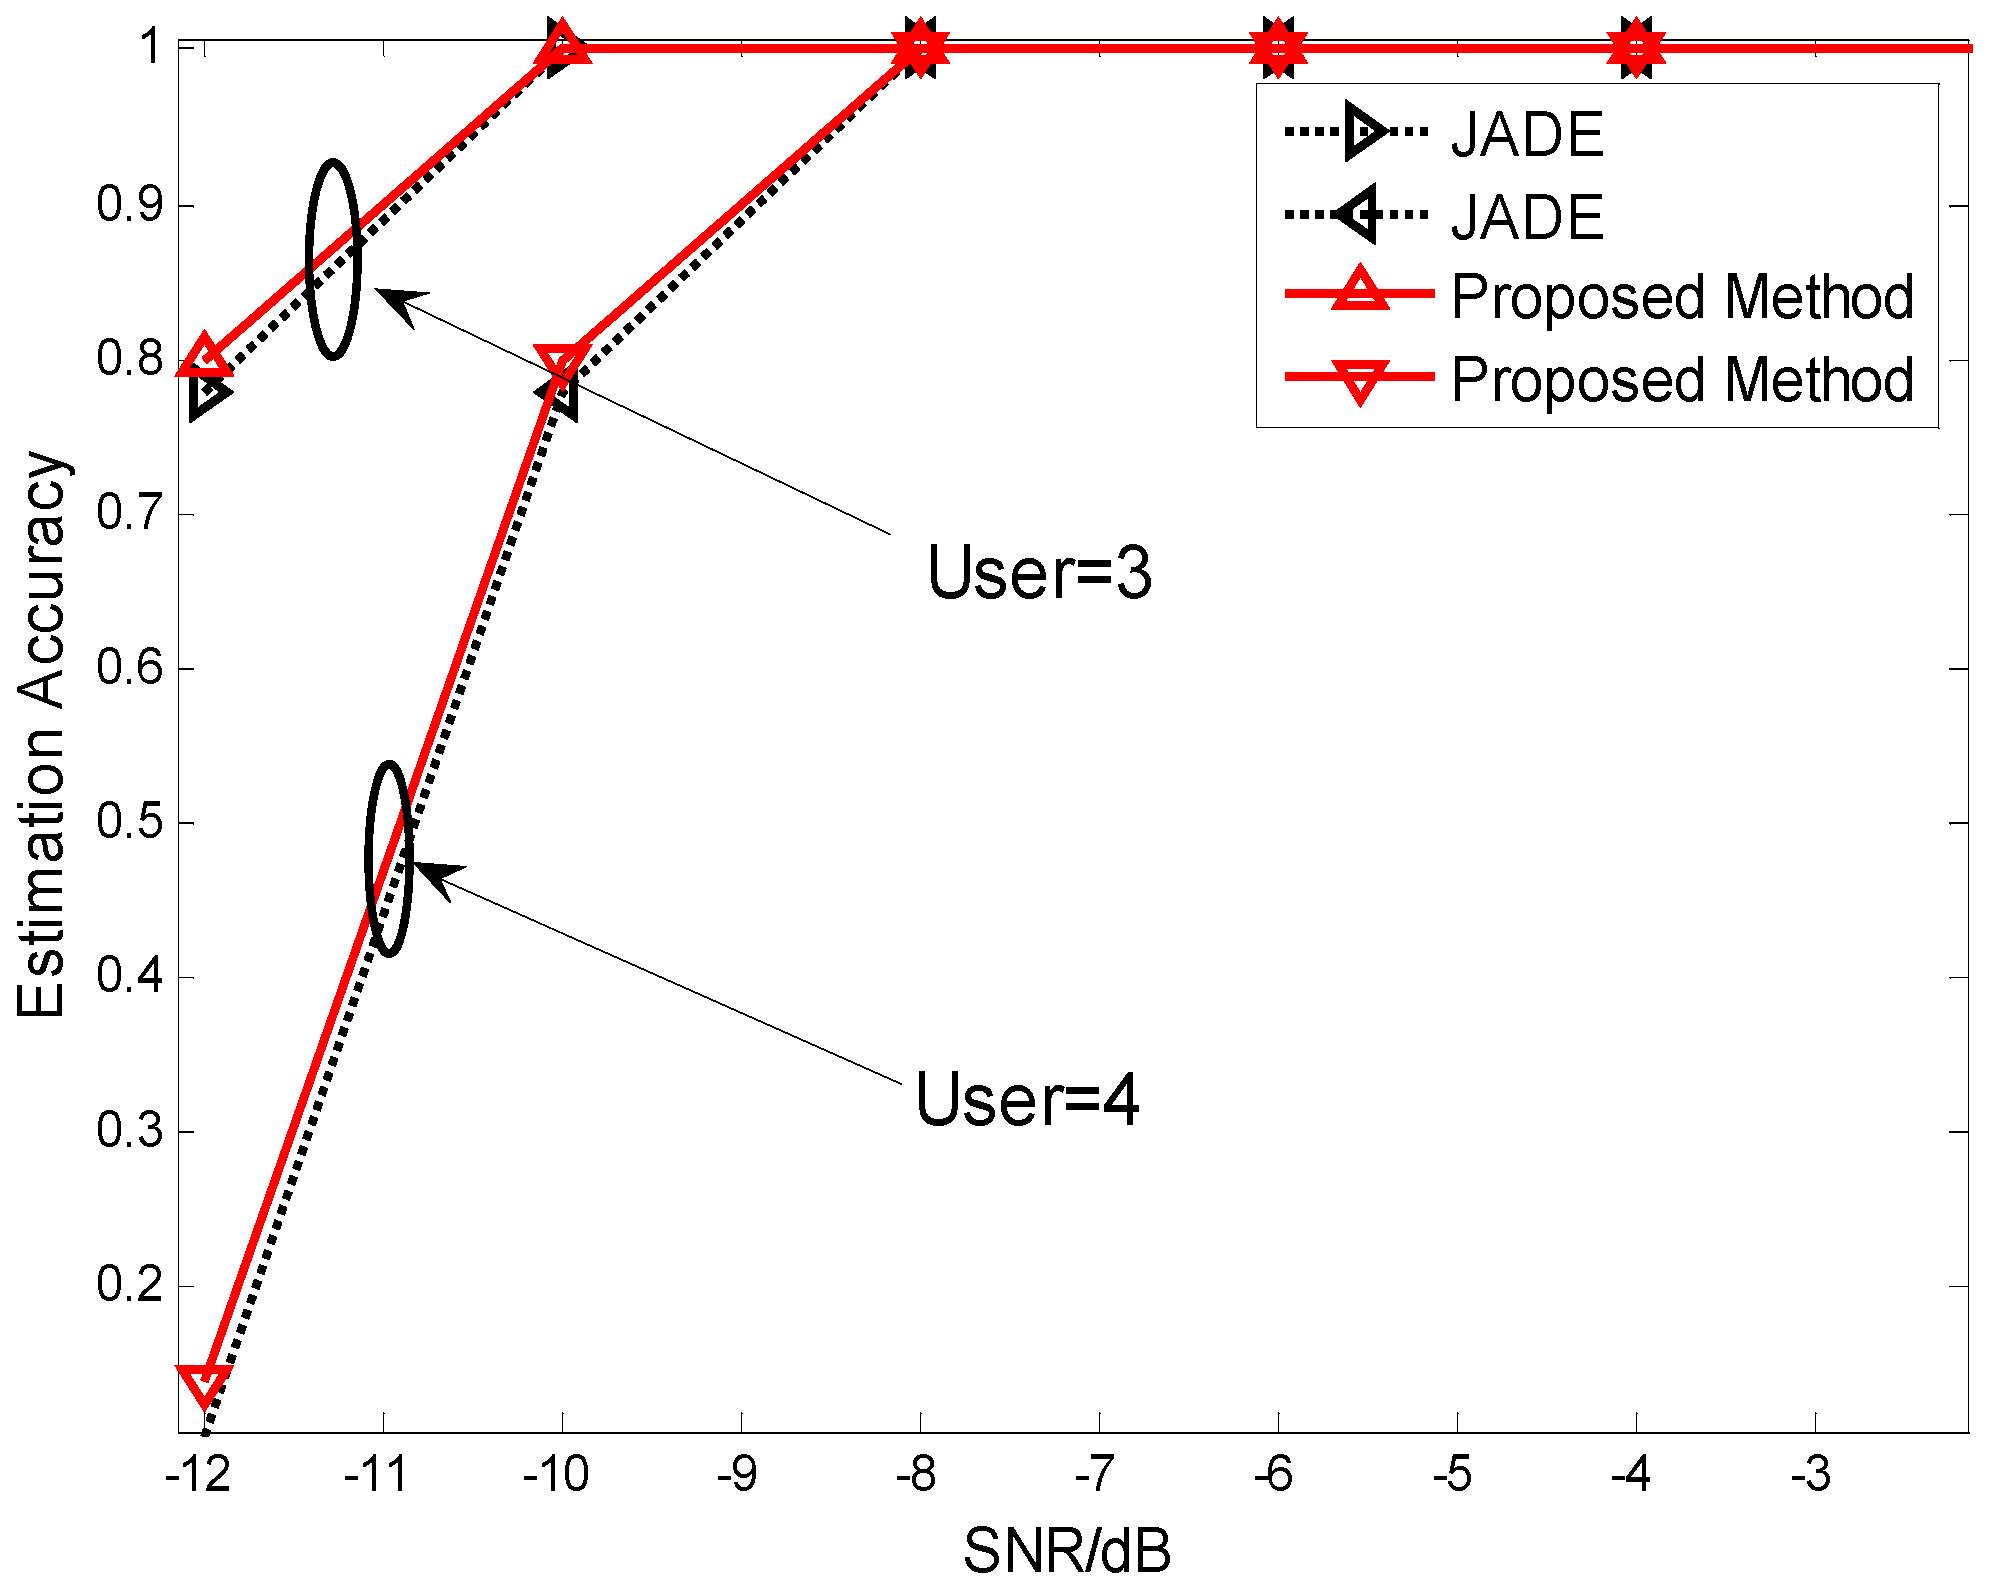
4. Simulations and Discussions

5. Conclusions
Acknowledgments
Author Contributions
Conflicts of Interest
Appendix
A. Charrelation Matrix Derivation
B. Diagonalization Verification
References
- Yu, X.; Hu, D.; Xu, J. Blind Source Separation: Theory and Applications; John Wiley & Sons, Singapore Pte. Ltd.: Singapore, 2014. [Google Scholar]
- Ristaniemi, T.; Joutsensalo, J. Advanced ICA-based receivers for block fading DS-CDMA channels. Signal Process. 2002, 82, 417–431. [Google Scholar] [CrossRef]
- Albataineh, Z.; Salem, F. Blind multiuser detection DS-CDMA algorithm on the fast relative Newton algorithm. In Proceedings of IEEE Wireless telecommunication symposium, Washington DC, USA, 9–10 April 2014; pp. 1–5.
- Huovinen, T.; Ristaniemi, T. Independent component analysis using successive interference cancellation for oversaturated data. Eur. Trans. Telecommun. 2006, 17, 577–589. [Google Scholar] [CrossRef]
- Albataineh, Z.; Salem, F. Robust Blind Multiuser Detection Algorithm Using Fourth-Order Cumulant Matrices. Circuits Syst. Signal Process. 2015, 34, 2577–2595. [Google Scholar] [CrossRef]
- Luo, Z.Q.; Zhu, L.D.; Li, C.J. Exploiting Charrelation Matrix to Improve Blind Separation Performance in DS-CDMA Systems. In Proceedings of the 9th International Conference on Communications and Networking in China, Maoming, China, 14–16 August 2014; pp. 369–372.
- Lu, F.B.; Huang, Z.T.; Jiang, W.L. Blind estimation of spreading sequence of CDMA signals based on FastICA and performance analysis. J. Commun. 2011, 32, 136–142. [Google Scholar]
- Qiu, P.; Huang, Z.; Jiang, W.; Zhang, C. Blind multiuser spreading sequences estimation algorithm for the direct-sequence code division multiple access signals. IET Signal Process. 2010, 4, 465–478. [Google Scholar] [CrossRef]
- Belouchrani, A.; Amin, M.G. Jammer mitigation in spread spectrum communications using blind source separation. Signal Process. 2000, 80, 723–729. [Google Scholar] [CrossRef]
- Ristaniemi, T.; Raju, K.; Karhunen, J. Jammer Mitigation in DS-CDMA Array System Using Independent Component Analysis. In Proceedings of the IEEE International Conference on Communications (ICC), New York, NY, USA, 28 April–2 May 2002; pp. 232–236.
- Raju, K.; Ristaniemi, T.; Karhunen, J.; Oja, E. Jammer Suppression in DS-CDMA Arrays Using Independent Component Analysis. IEEE Trans. Wirel. Commun. 2006, 5, 77–82. [Google Scholar] [CrossRef]
- Zhang, J.; Zhang, H.; Cui, Z.; Guo, J. Blind Joint Jamming Cancellation and Multi-user Detection for Asynchronous DS-CDMA Systems. J. Signal Process. 2013, 29, 668–675. [Google Scholar]
- Huovinen, T.; Shahed, A.; Valkama, M. Blind diversity reception and interference cancellation using ICA. In Proceedings of the 2007 IEEE International Conference on Acoustics, Speech and Signal Processing (ICASSP’07), Honolulu, HI, USA, 15–20 April 2007; pp. 685–688.
- Huovinen, T. Independent Component Analysis in DS-CDMA Multiuser Detection and Interference Cancellation. Ph.D. Thesis, Tampere University of Technology, Tampere, Finland, 2008. [Google Scholar]
- Zhang, J.; Zhang, H.; Cui, Z.F. Dual-antenna-based blind joint hostile jamming cancellation and multi-user detection for uplink of asynchronous direct-sequence code-division multiple access systems. IET Commun. 2013, 7, 911–921. [Google Scholar] [CrossRef]
- Sriyananda, M.G.S.; Joutsensalo, J.; Hämäläinen, T. Interference Cancellation Schemes for Spread Spectrum Systems with Blind Principles. In Proceedings of the 27th International Conference on Advanced Information Networking and Applications, Barcelona, Spain, 25–28 March 2013; pp. 1078–1082.
- Sriyananda, M.G.S.; Joutsensalo, J.; Hämäläinen, T. Blind source separation based interference suppression schemes for OFDM and DS-CDMA. Telecommun Syst. 2015, 4, 1–10. [Google Scholar] [CrossRef]
- Chi-Wei, J.; Shuh-Jye, J. Blind ICA detection based on second-order cone programming for MC-CDMA systems. EURASIP J. Adv. Signal Process. 2014, 151, 1–14. [Google Scholar]
- Solé-Casals, J.; Vialatte, F.-B. Towards Semi-Automatic Artifact Rejection for the Improvement of Alzheimer’s Disease Screening from EEG Signals. Sensors 2015, 15, 17963–17976. [Google Scholar] [CrossRef] [PubMed]
- Wang, X.; Huang, Z.; Zhou, Y. Semi-Blind Signal Extraction for Communication Signals by Combining Independent Component Analysis and Spatial Contraints. Sensors 2012, 12, 9024–9045. [Google Scholar] [CrossRef] [PubMed]
- Luo, Z.Q.; Zhu, L.D.; Li, C.J. Employing ICA for Inter-Carrier Interference Cancellation and Symbol Recovery in OFDM Systems. In Proceedings of the IEEE Global Communications Conference, Austin, TX, USA, 8–12 December 2014; pp. 550–554.
- Jiménez-Hernández, H. Background Subtraction Approach Based on Independent Component Analysis. Sensors 2010, 10, 6092–6114. [Google Scholar] [CrossRef] [PubMed]
- Qin, S.; Guo, J.; Zhu, C. Sparse Component Analysis Using Time-Frequency Representations for Operational Modal Analysis. Sensors 2015, 15, 6497–6519. [Google Scholar] [CrossRef] [PubMed]
- Yeredor, A. Blind channel estimation using first and second derivatives of the Characteristic Function. IEEE Signal Process. Lett. 2002, 9, 100–103. [Google Scholar] [CrossRef]
- Slapak, A.; Yeredor, A. Charrelation and Charm: Generic Statistics Incorporating Higher-Order Information. IEEE Trans. Signal Process. 2012, 60, 5089–5106. [Google Scholar] [CrossRef]
- Tichavský, P.; Yeredor, A. Fast Approximate Joint Digonalization Incorporating Weight Matrices. IEEE Trans. Signal Process. 2009, 57, 878–891. [Google Scholar] [CrossRef]
- Gong, X.; Wang, X.; Lin, Q. Generalized Non-Orthogonal Joint Diagonalization with LU Decomposition and Successive Rotations. IEEE Trans. Signal Processing 2015, 63, 1322–1334. [Google Scholar] [CrossRef]
- Smekhov, A. Asymptotically Optimized Blind Source Separation Based on Fourth- and Second-Order Statistics. Master’s Thesis, Tel-Aviv University, Tel-Aviv, Israel, 2004. [Google Scholar]
© 2015 by the authors; licensee MDPI, Basel, Switzerland. This article is an open access article distributed under the terms and conditions of the Creative Commons Attribution license (http://creativecommons.org/licenses/by/4.0/).
Share and Cite
Luo, Z.; Zhu, L. A Charrelation Matrix-Based Blind Adaptive Detector for DS-CDMA Systems. Sensors 2015, 15, 20152-20168. https://doi.org/10.3390/s150820152
Luo Z, Zhu L. A Charrelation Matrix-Based Blind Adaptive Detector for DS-CDMA Systems. Sensors. 2015; 15(8):20152-20168. https://doi.org/10.3390/s150820152
Chicago/Turabian StyleLuo, Zhongqiang, and Lidong Zhu. 2015. "A Charrelation Matrix-Based Blind Adaptive Detector for DS-CDMA Systems" Sensors 15, no. 8: 20152-20168. https://doi.org/10.3390/s150820152
APA StyleLuo, Z., & Zhu, L. (2015). A Charrelation Matrix-Based Blind Adaptive Detector for DS-CDMA Systems. Sensors, 15(8), 20152-20168. https://doi.org/10.3390/s150820152