
A Decentralized Wireless Solution to Monitor and Diagnose PV Solar Module Performance Based on Symmetrized-Shifted Gompertz Functions

 ,
,  ,
, 

Abstract
:
1. Introduction
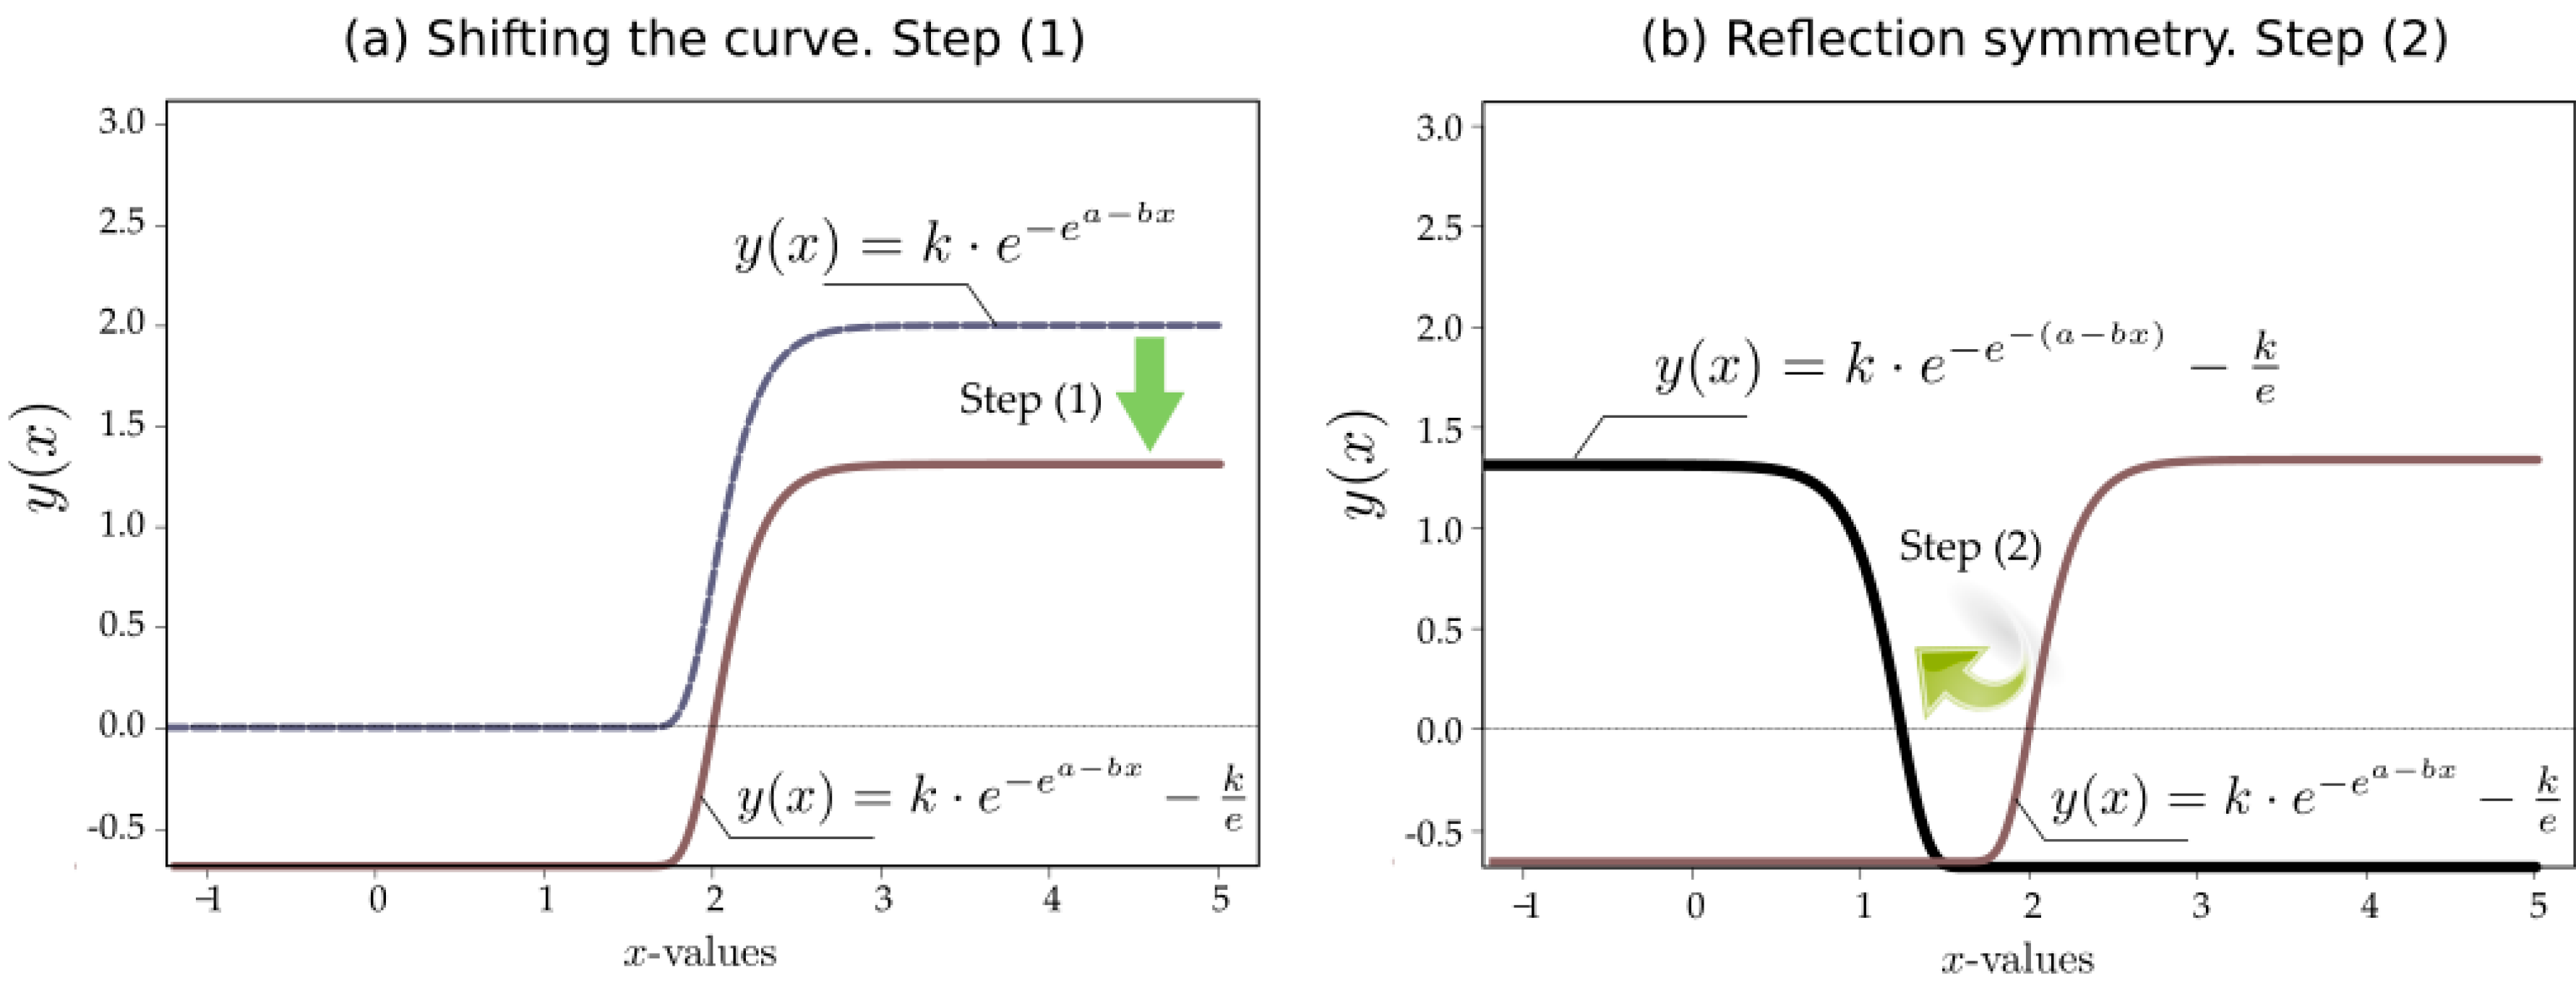
2. PV Module Modeling: Symmetrized Shifted Gompertz Functions
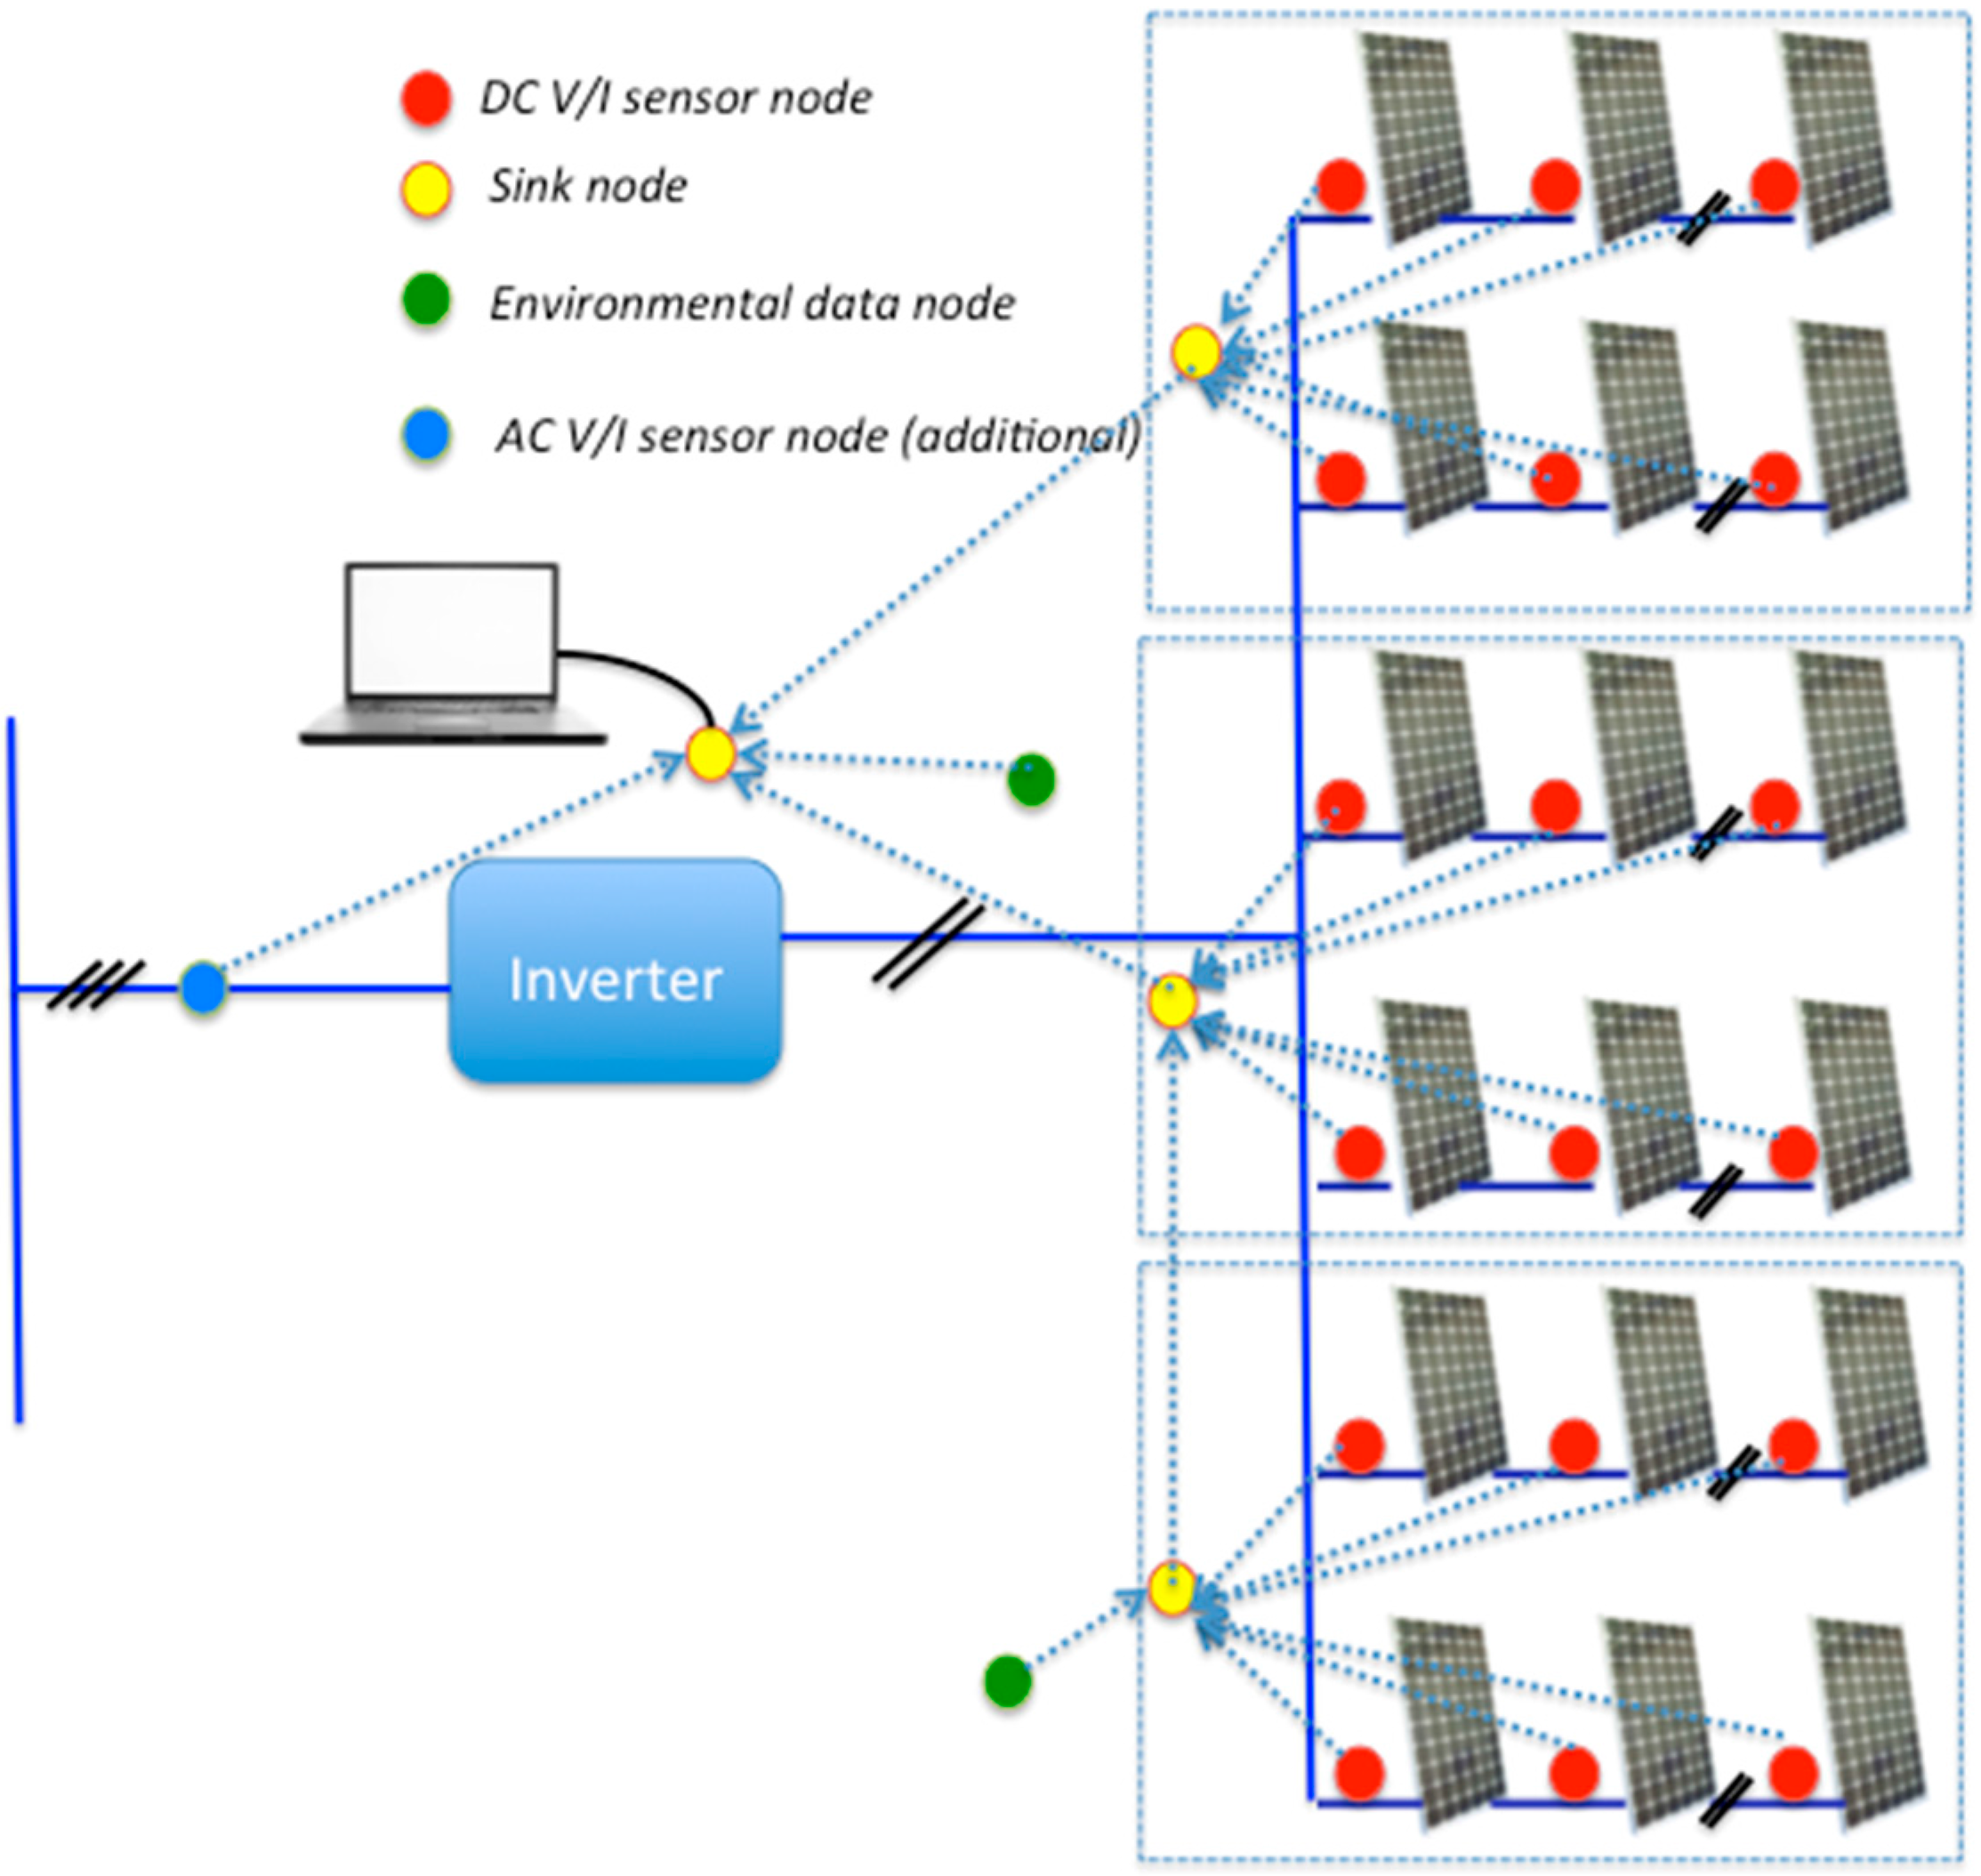
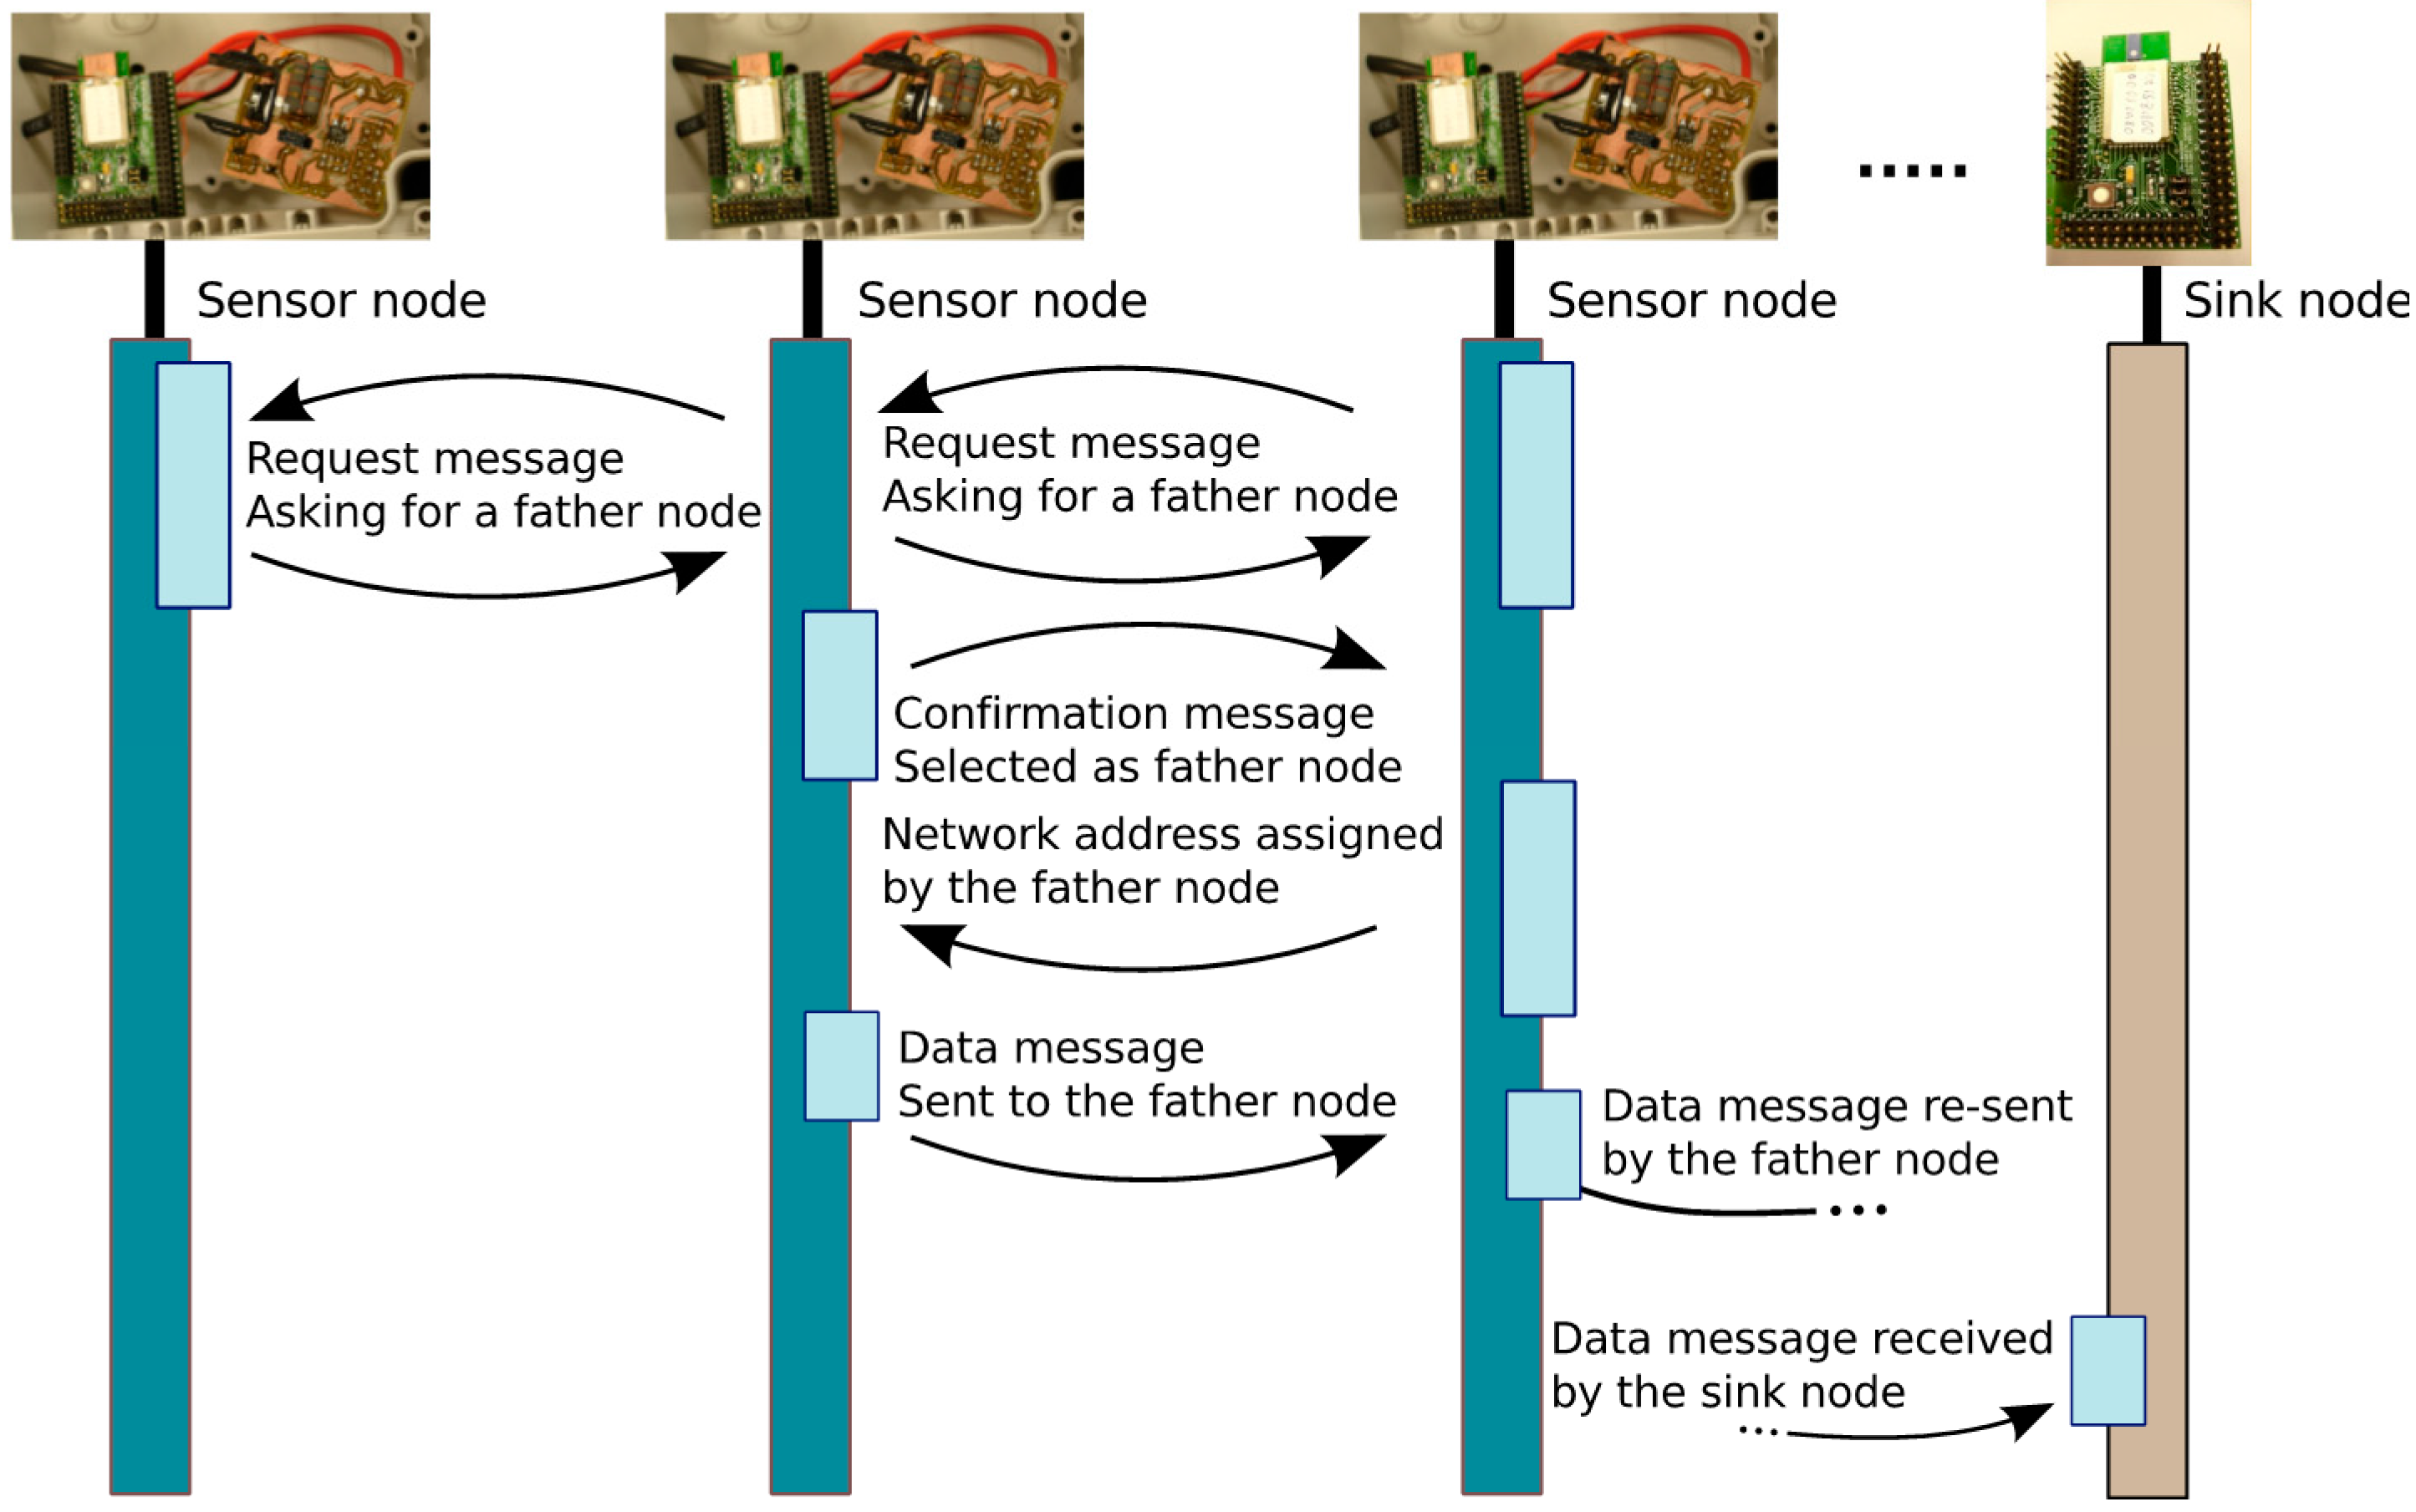
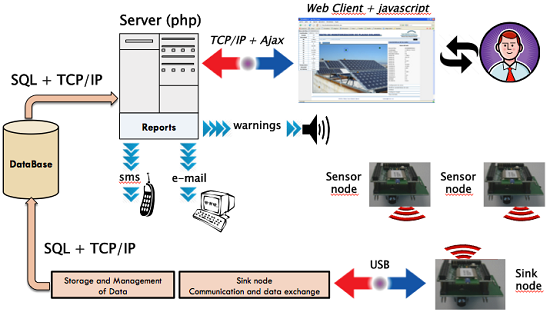
3. The Proposed Wireless Solution: General Overview
4. Hardware Description
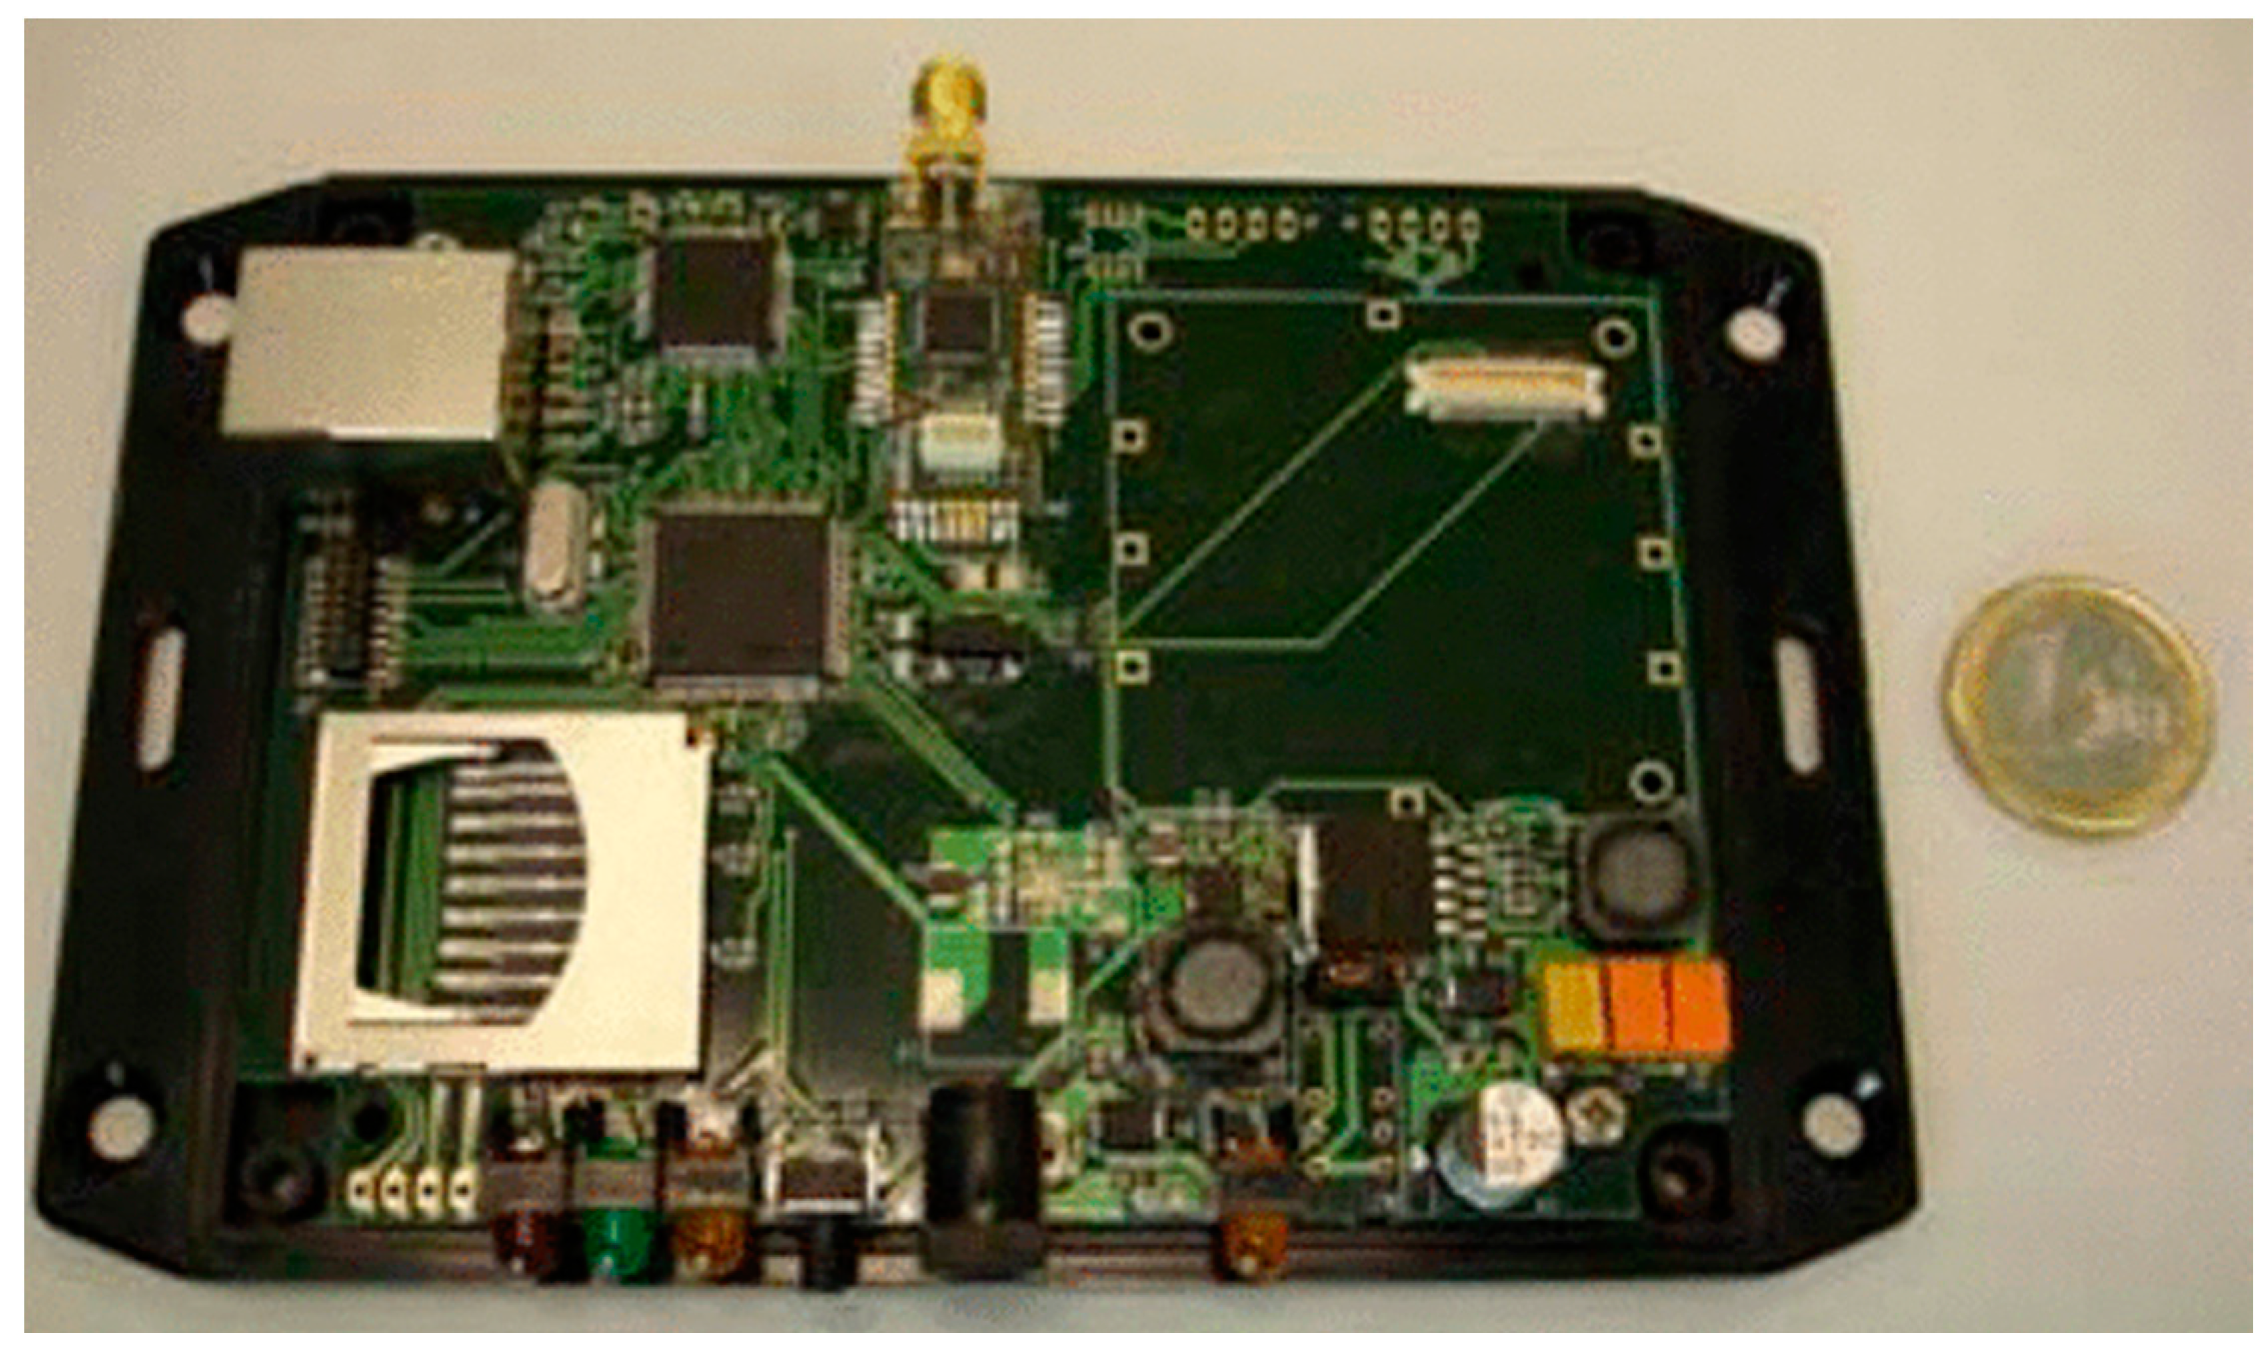
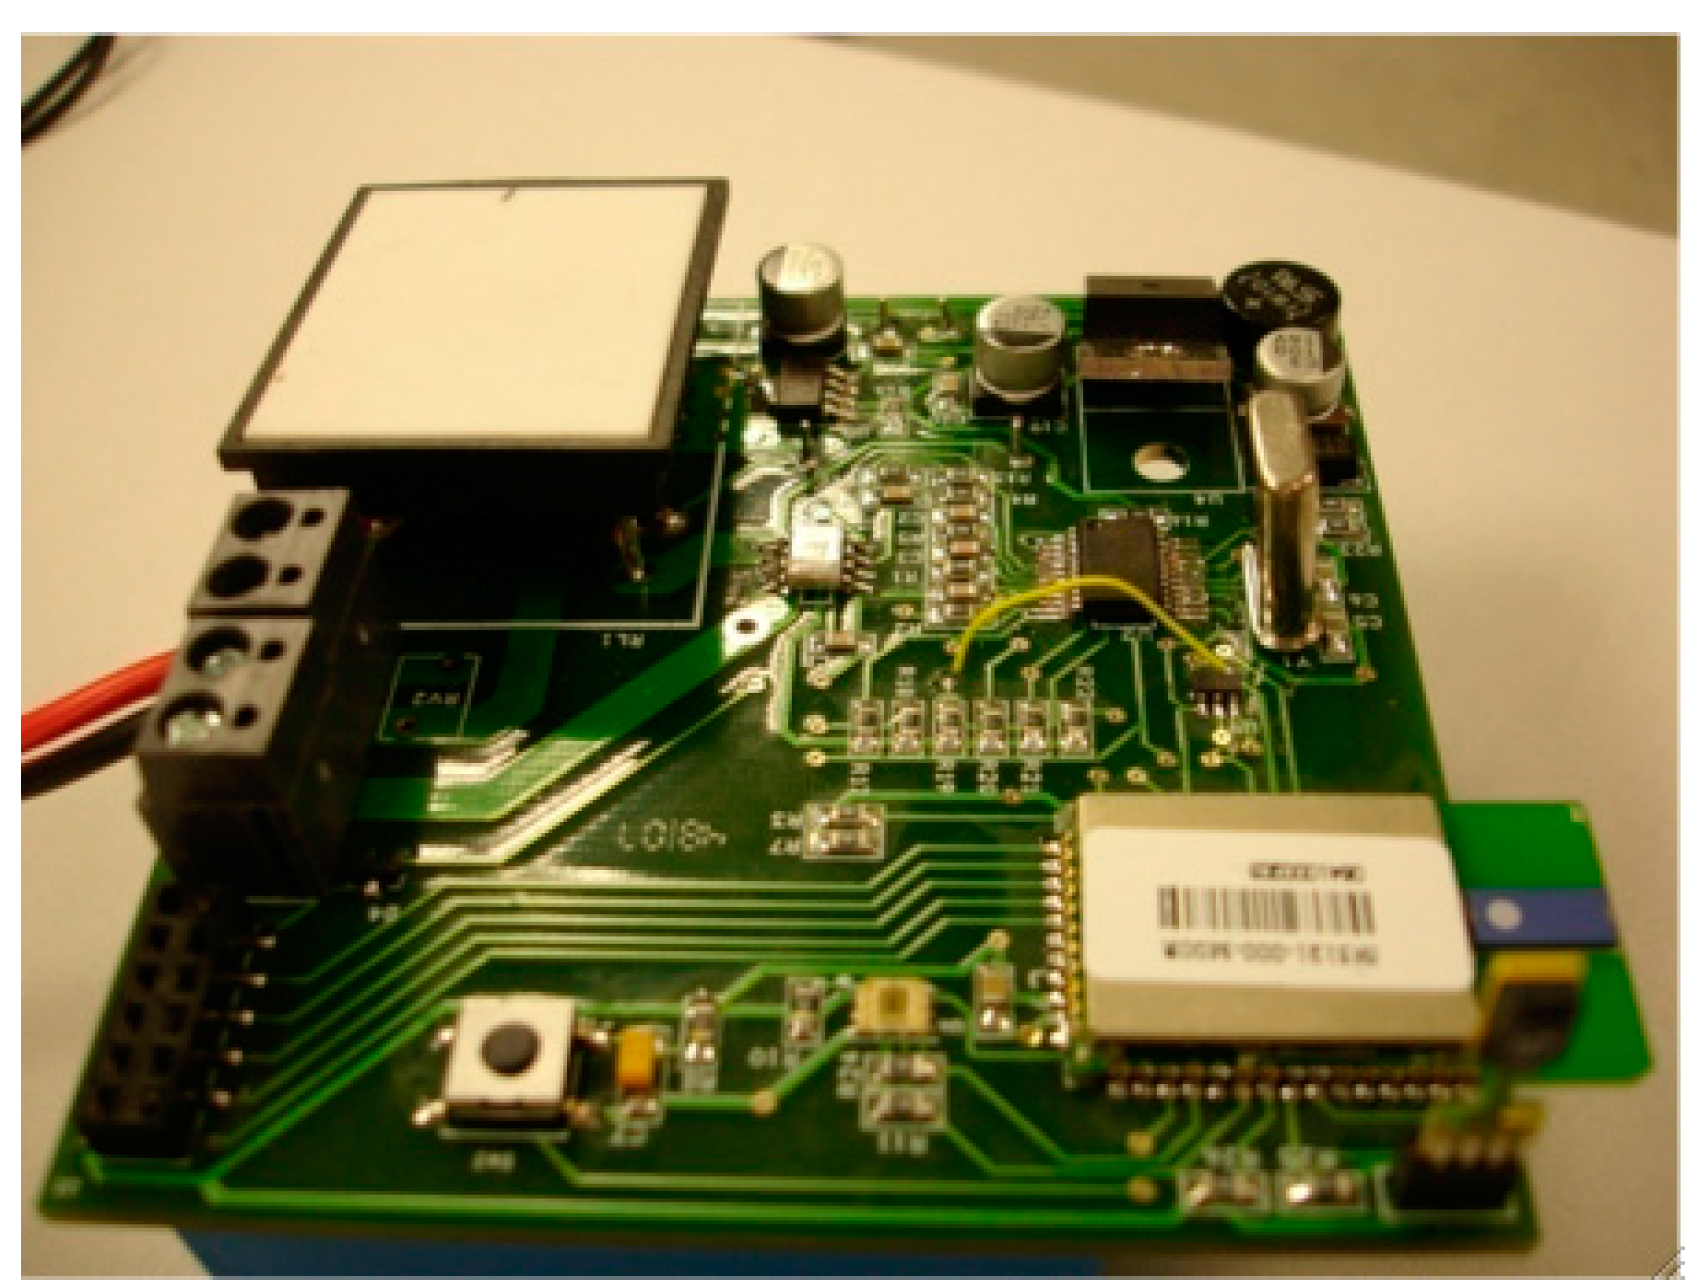
4.1. Sink Node
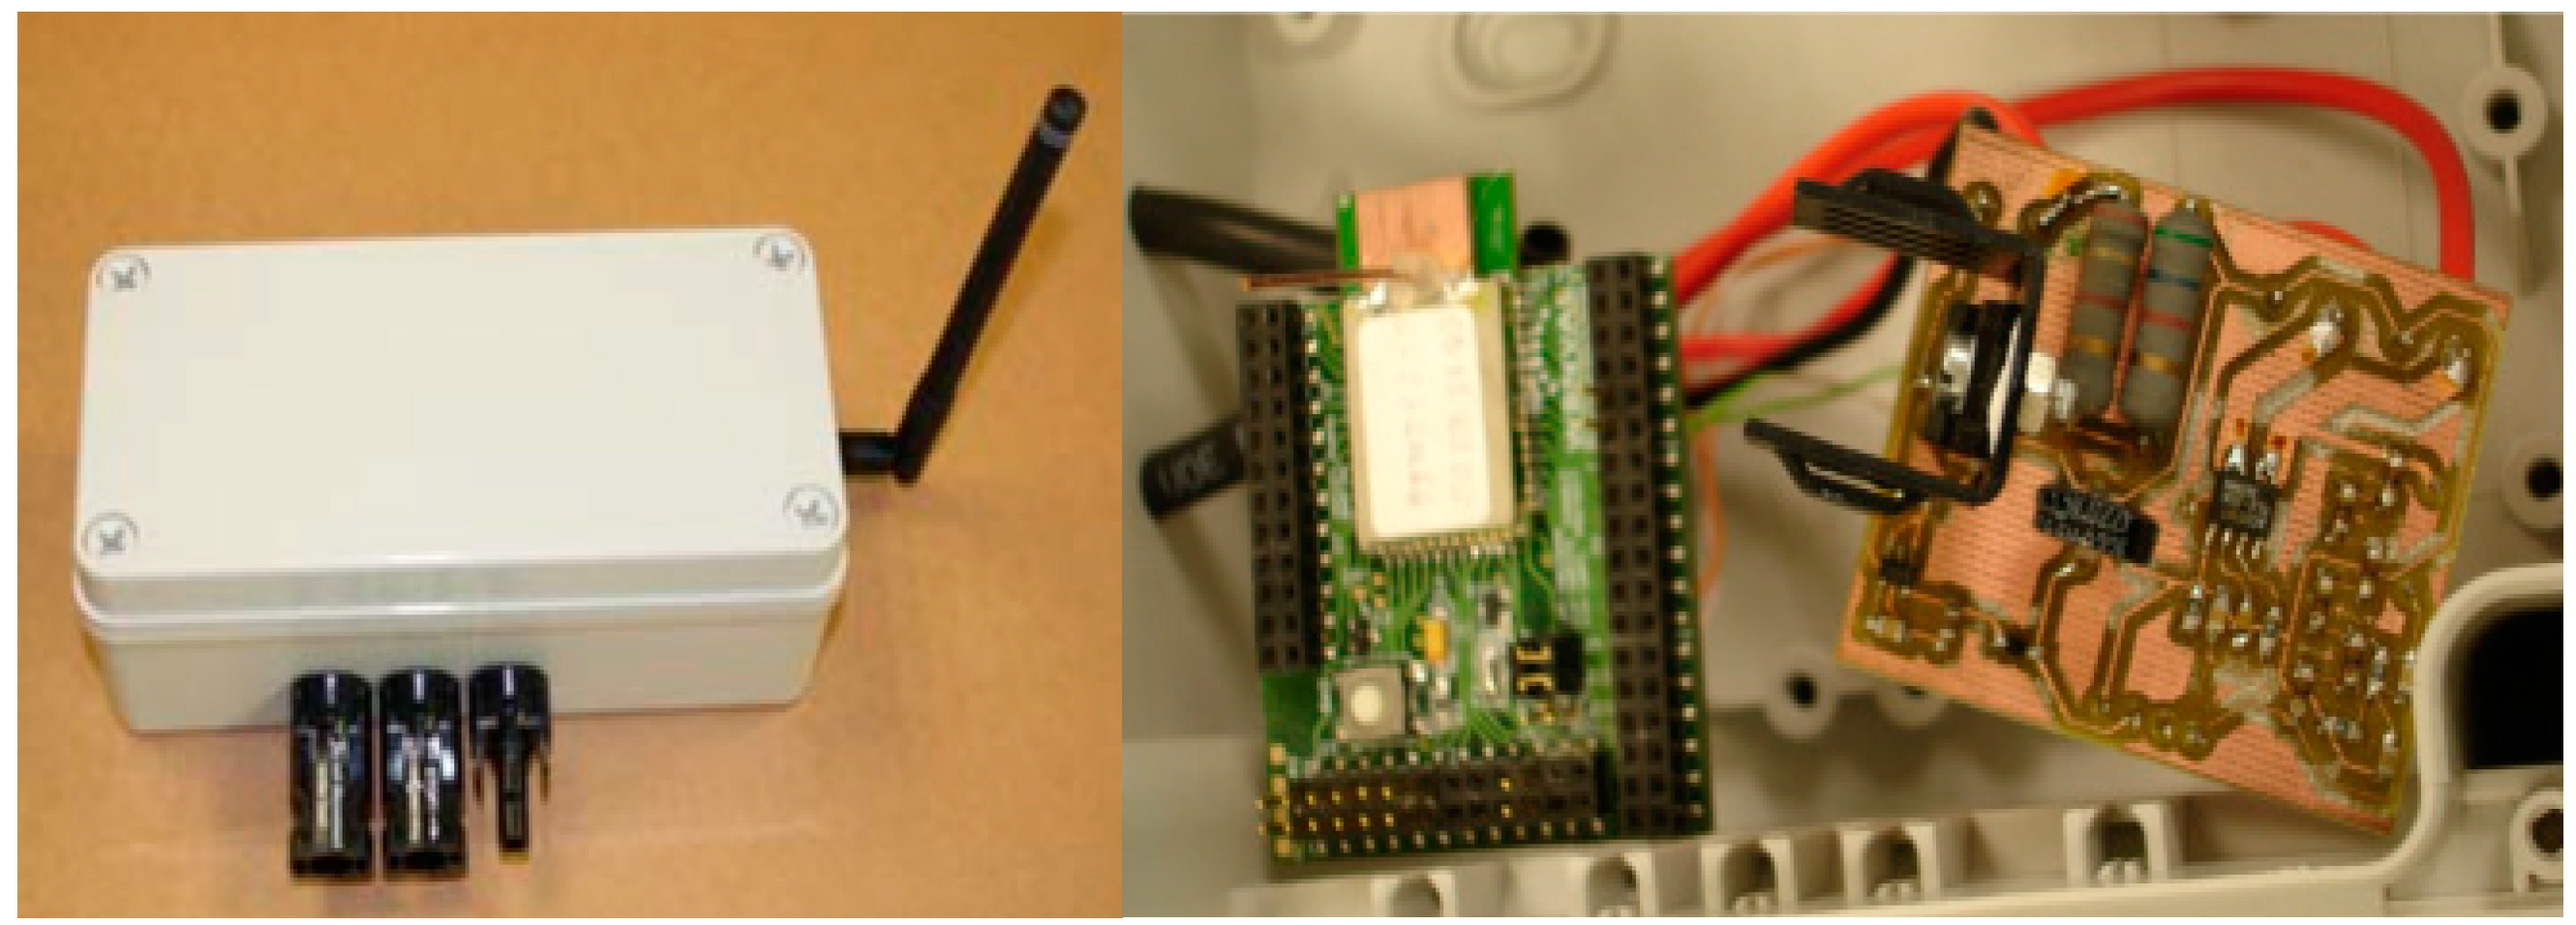
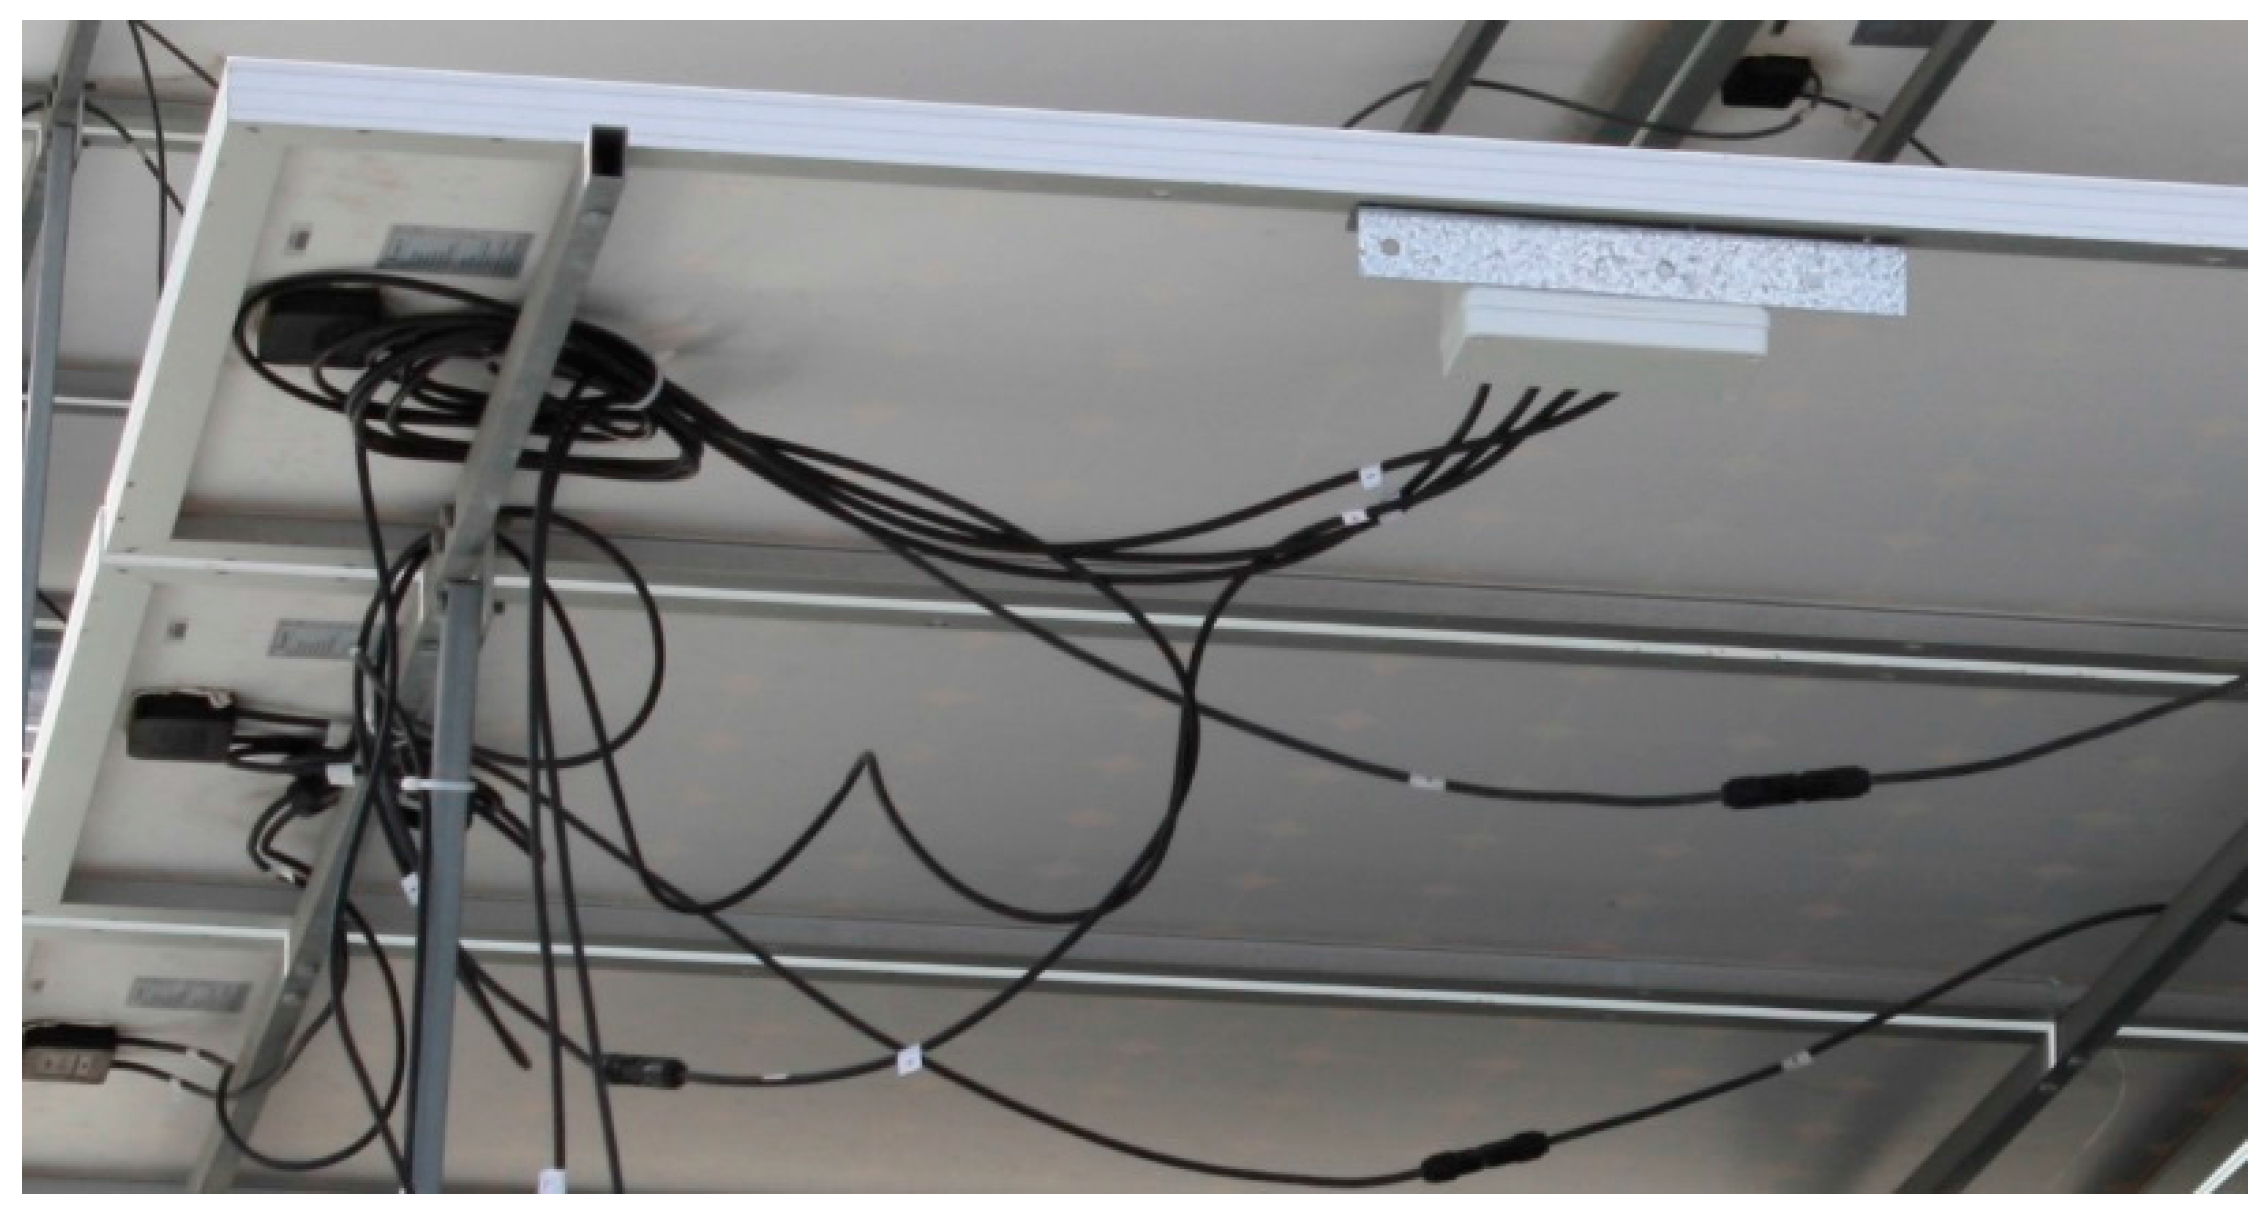
4.2. Sensor Node
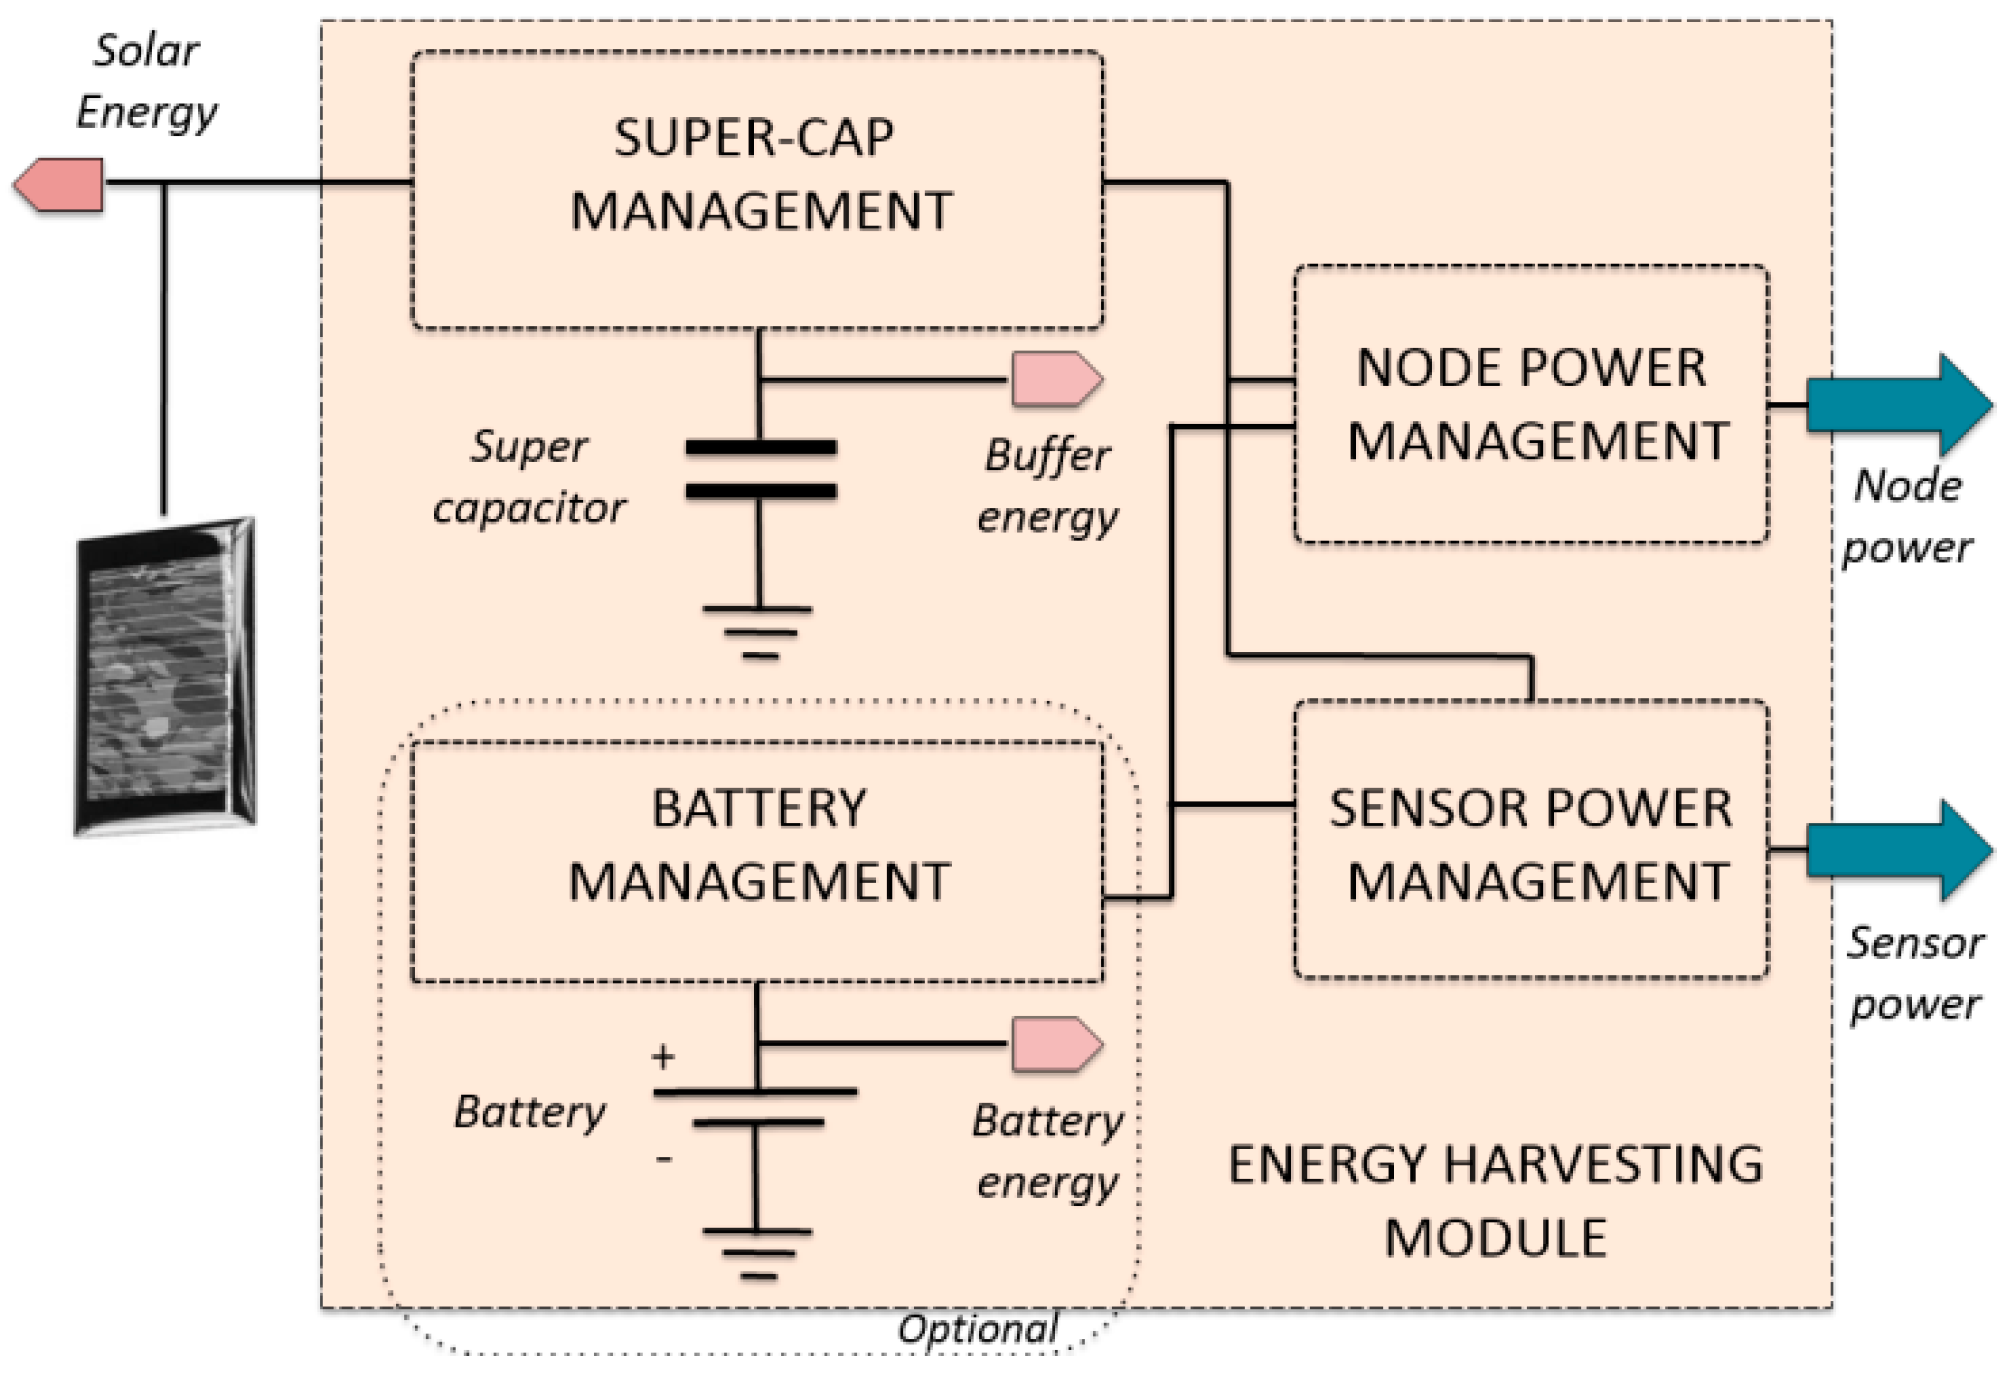
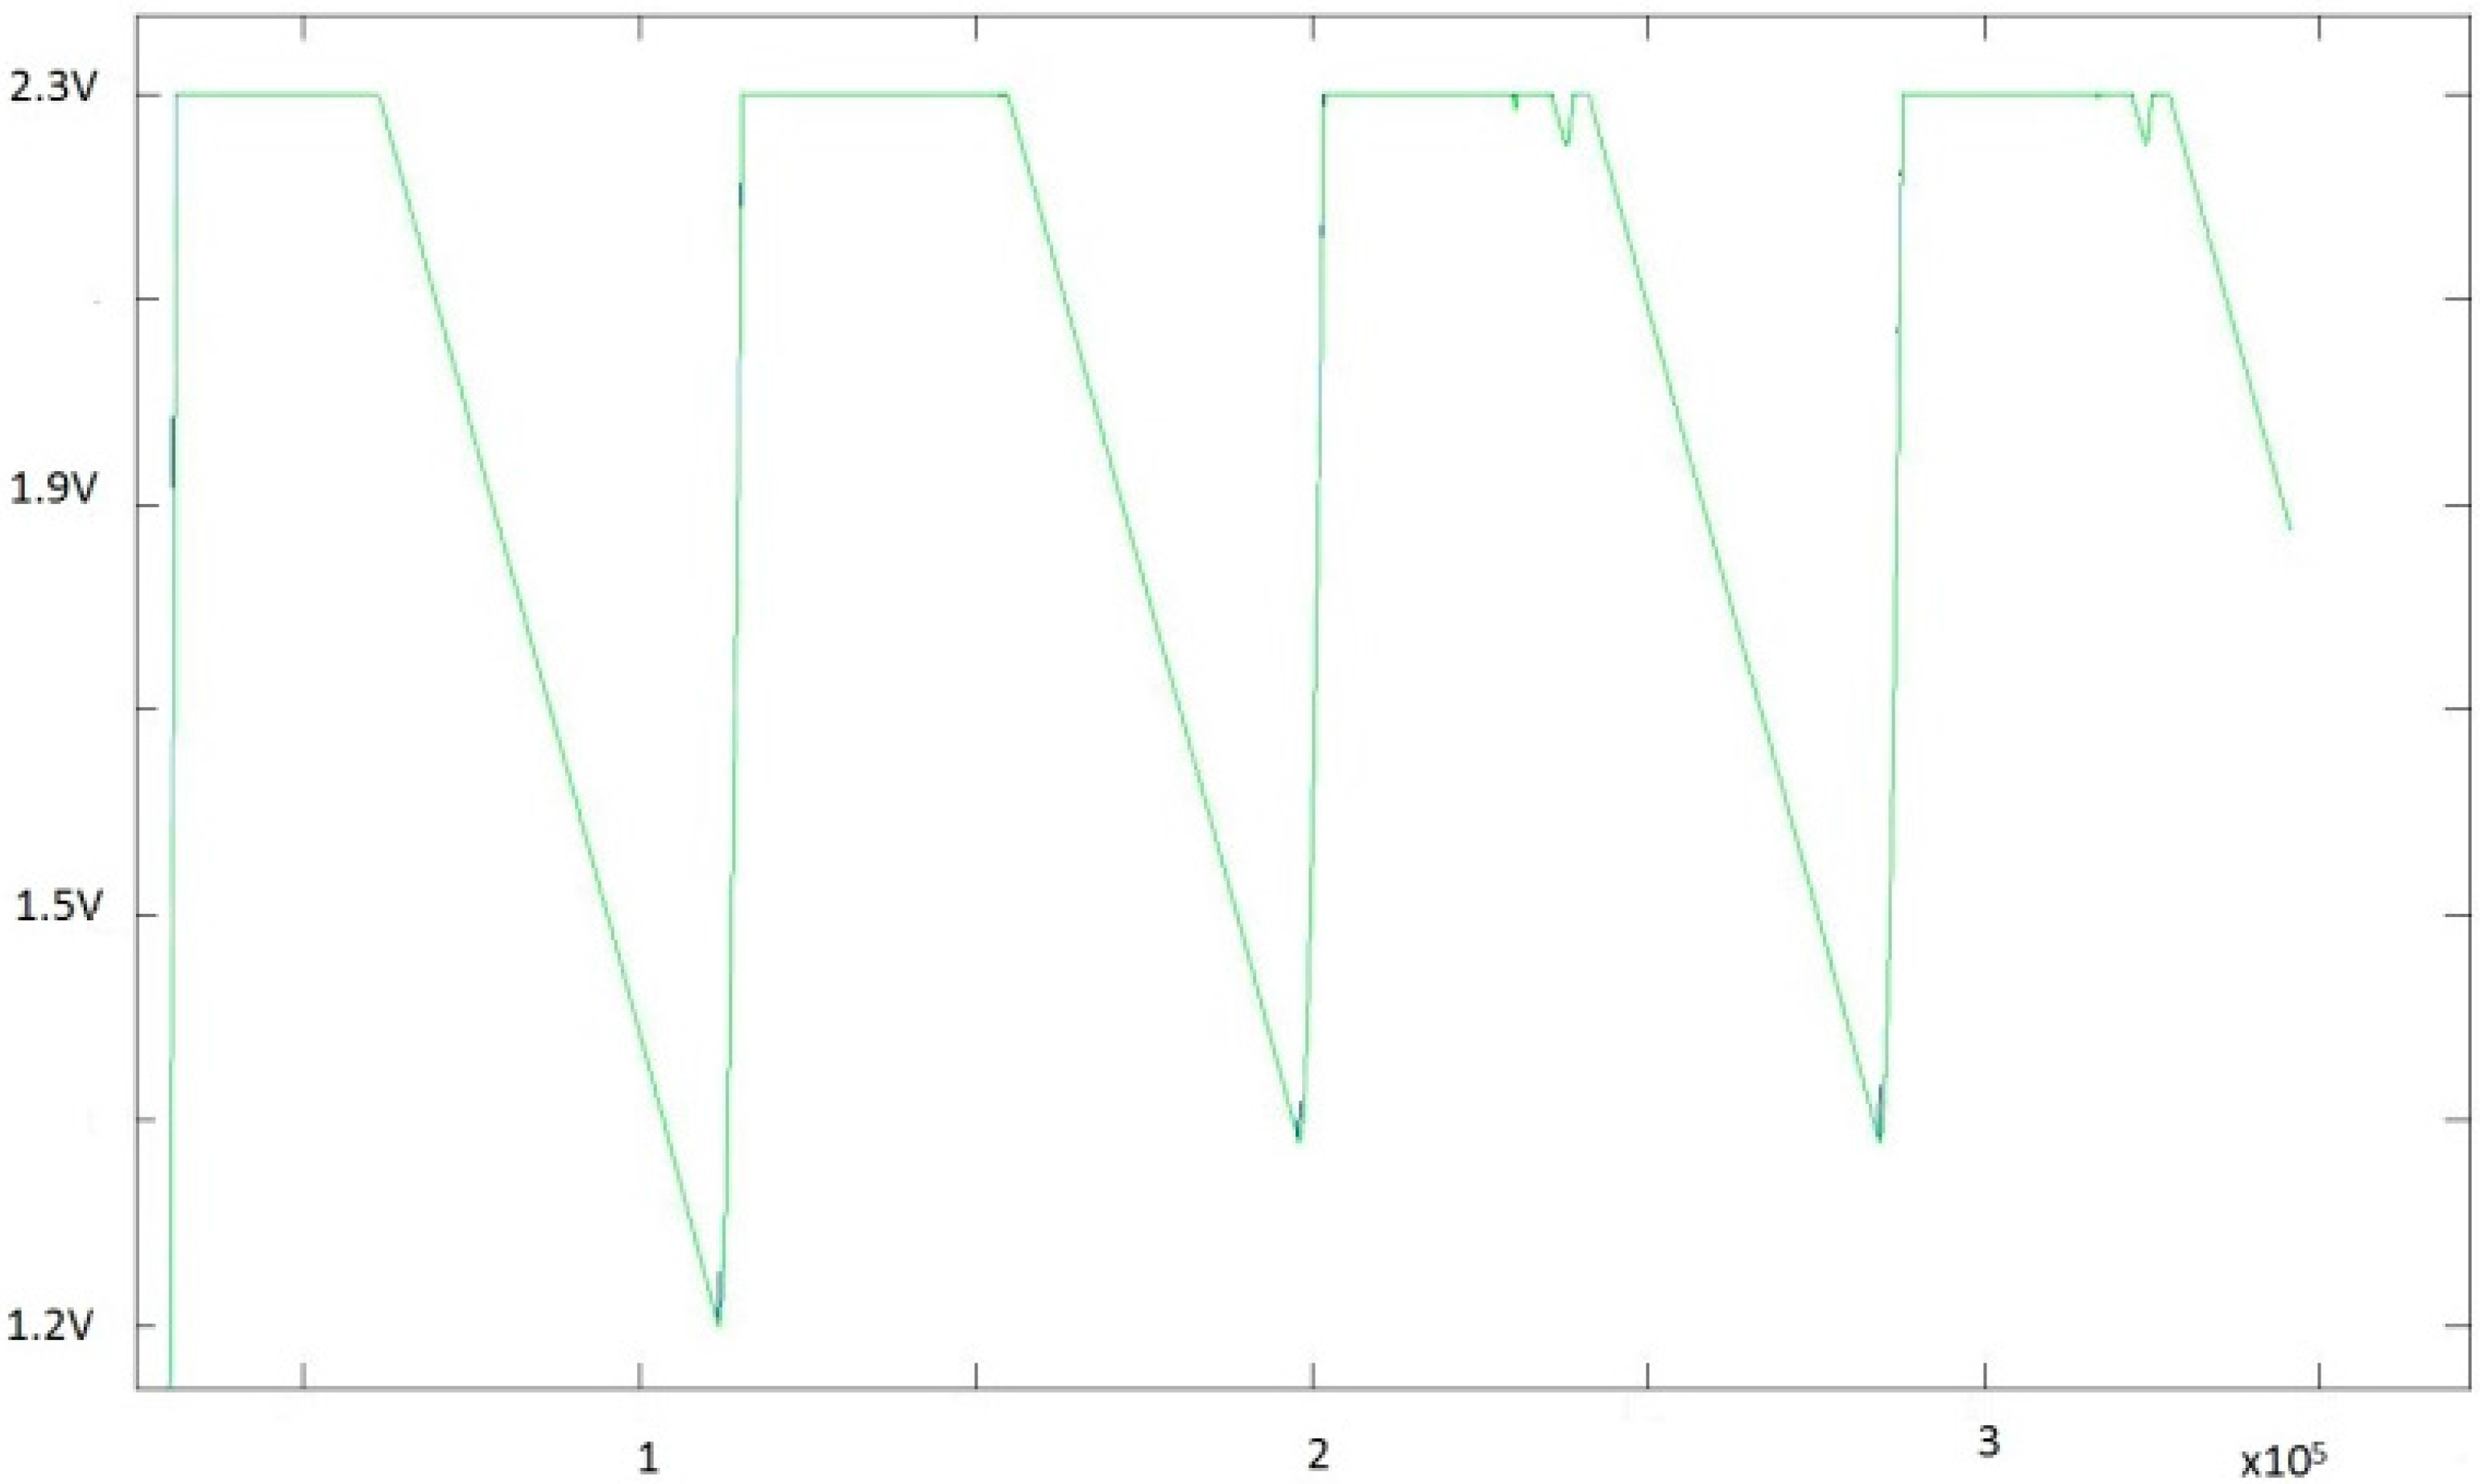
4.3. Energy Harvesting Module

5. Results
5.1. Preliminaries

| G (W/m2) | T (°C) | k | SE (k) | γ | SE (γ) | b | SE (b) | RSE | MPP Error (%) |
|---|---|---|---|---|---|---|---|---|---|
| 100 | 25 | 0.17 | 0.0024 | 1.17 | 0.0009 | 20.35 | 1.70 | 0.0015 | −0.73 |
| 200 | 25 | 0.34 | 0.0049 | 1.19 | 0.0010 | 17.09 | 1.47 | 0.0031 | −0.22 |
| 400 | 25 | 0.67 | 0.0101 | 1.22 | 0.0013 | 14.73 | 1.36 | 0.0064 | 0.13 |
| 500 | 25 | 0.84 | 0.0129 | 1.23 | 0.0013 | 14.11 | 1.34 | 0.0082 | 0.21 |
| 600 | 25 | 1.01 | 0.0157 | 1.23 | 0.0014 | 13.65 | 1.35 | 0.0100 | 0.24 |
| 800 | 25 | 1.35 | 0.0217 | 1.25 | 0.0015 | 13.00 | 1.38 | 0.0138 | 0.25 |
| 1000 | 25 | 1.68 | 0.0281 | 1.25 | 0.0016 | 12.57 | 1.44 | 0.0179 | 0.18 |
| 100 | 45 | 0.17 | 0.0023 | 1.08 | 0.0008 | 20.08 | 1.53 | 0.0015 | −0.74 |
| 200 | 45 | 0.34 | 0.0047 | 1.10 | 0.0010 | 16.67 | 1.31 | 0.0030 | −0.19 |
| 400 | 45 | 0.68 | 0.0097 | 1.13 | 0.0012 | 14.26 | 1.19 | 0.0062 | 0.14 |
| 500 | 45 | 0.85 | 0.0123 | 1.14 | 0.0013 | 13.64 | 1.18 | 0.0078 | 0.20 |
| 600 | 45 | 1.02 | 0.0150 | 1.15 | 0.0014 | 13.18 | 1.17 | 0.0095 | 0.22 |
| 800 | 45 | 1.36 | 0.0207 | 1.16 | 0.0015 | 12.53 | 1.20 | 0.0132 | 0.18 |
| 1000 | 45 | 1.70 | 0.0268 | 1.17 | 0.0016 | 12.10 | 1.24 | 0.0171 | 0.08 |
| 100 | 60 | 0.17 | 0.0022 | 1.01 | 0.0008 | 19.89 | 1.42 | 0.0014 | −0.71 |
| 200 | 60 | 0.34 | 0.0046 | 1.04 | 0.0010 | 16.37 | 1.20 | 0.0029 | −0.15 |
| 400 | 60 | 0.68 | 0.0094 | 1.07 | 0.0012 | 13.93 | 1.09 | 0.0060 | 0.16 |
| 500 | 60 | 0.85 | 0.0119 | 1.08 | 0.0013 | 13.30 | 1.07 | 0.0076 | 0.19 |
| 600 | 60 | 1.02 | 0.0146 | 1.09 | 0.0014 | 12.84 | 1.07 | 0.0092 | 0.19 |
| 800 | 60 | 1.36 | 0.0201 | 1.10 | 0.0015 | 12.20 | 1.08 | 0.0127 | 0.12 |
| 1000 | 60 | 1.70 | 0.0260 | 1.11 | 0.0016 | 11.77 | 1.12 | 0.0165 | −0.03 |
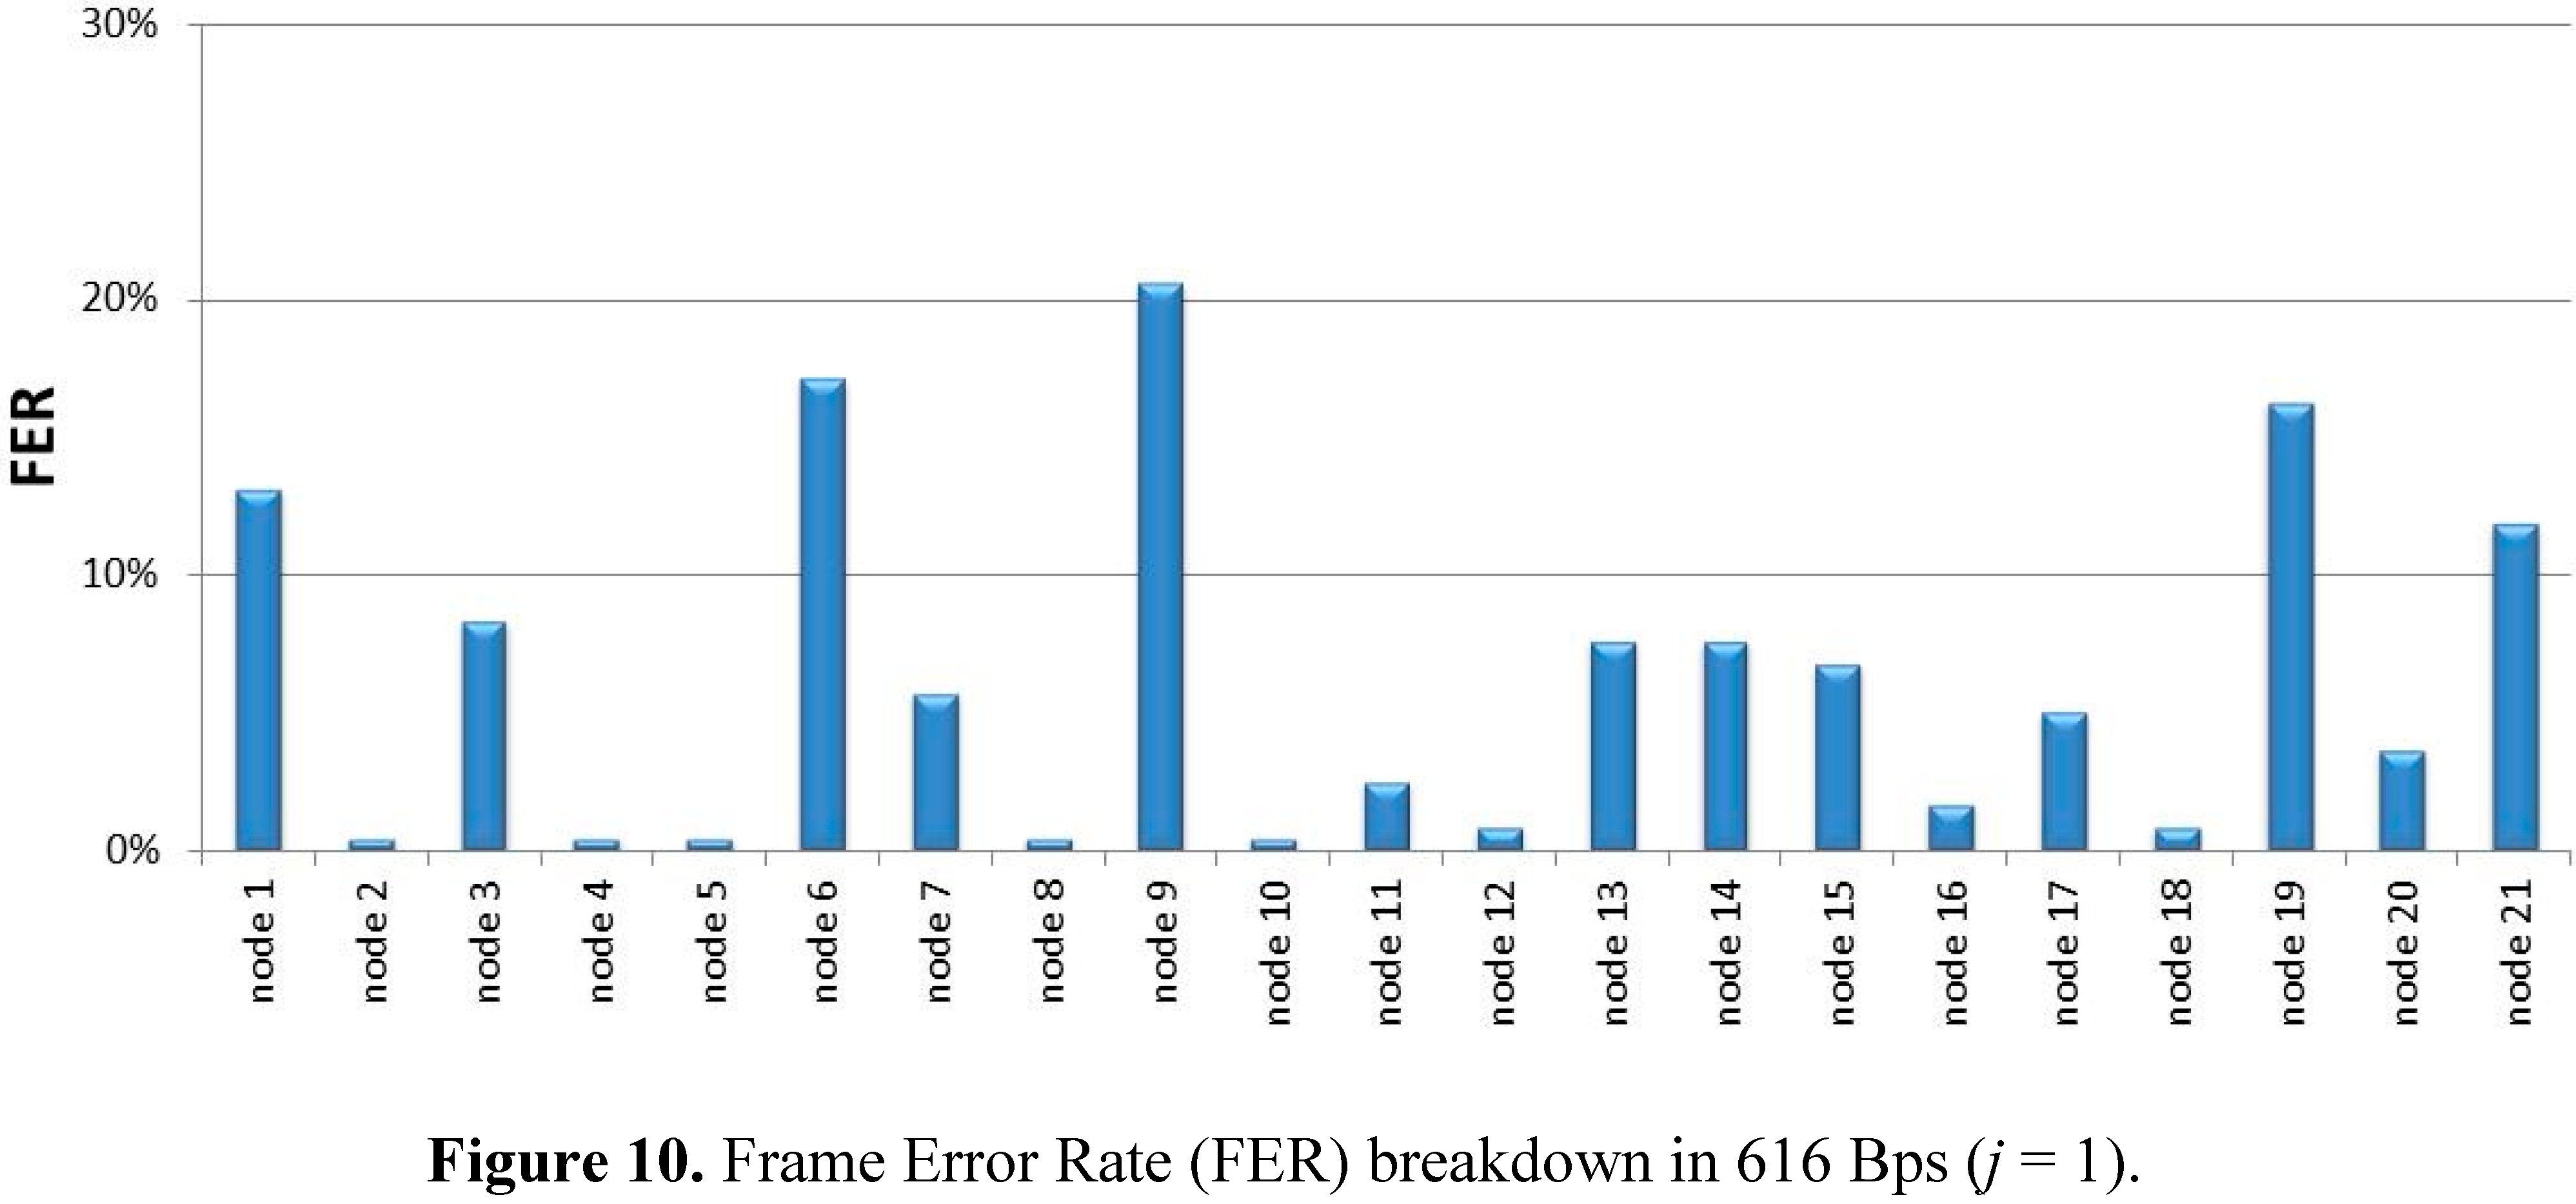
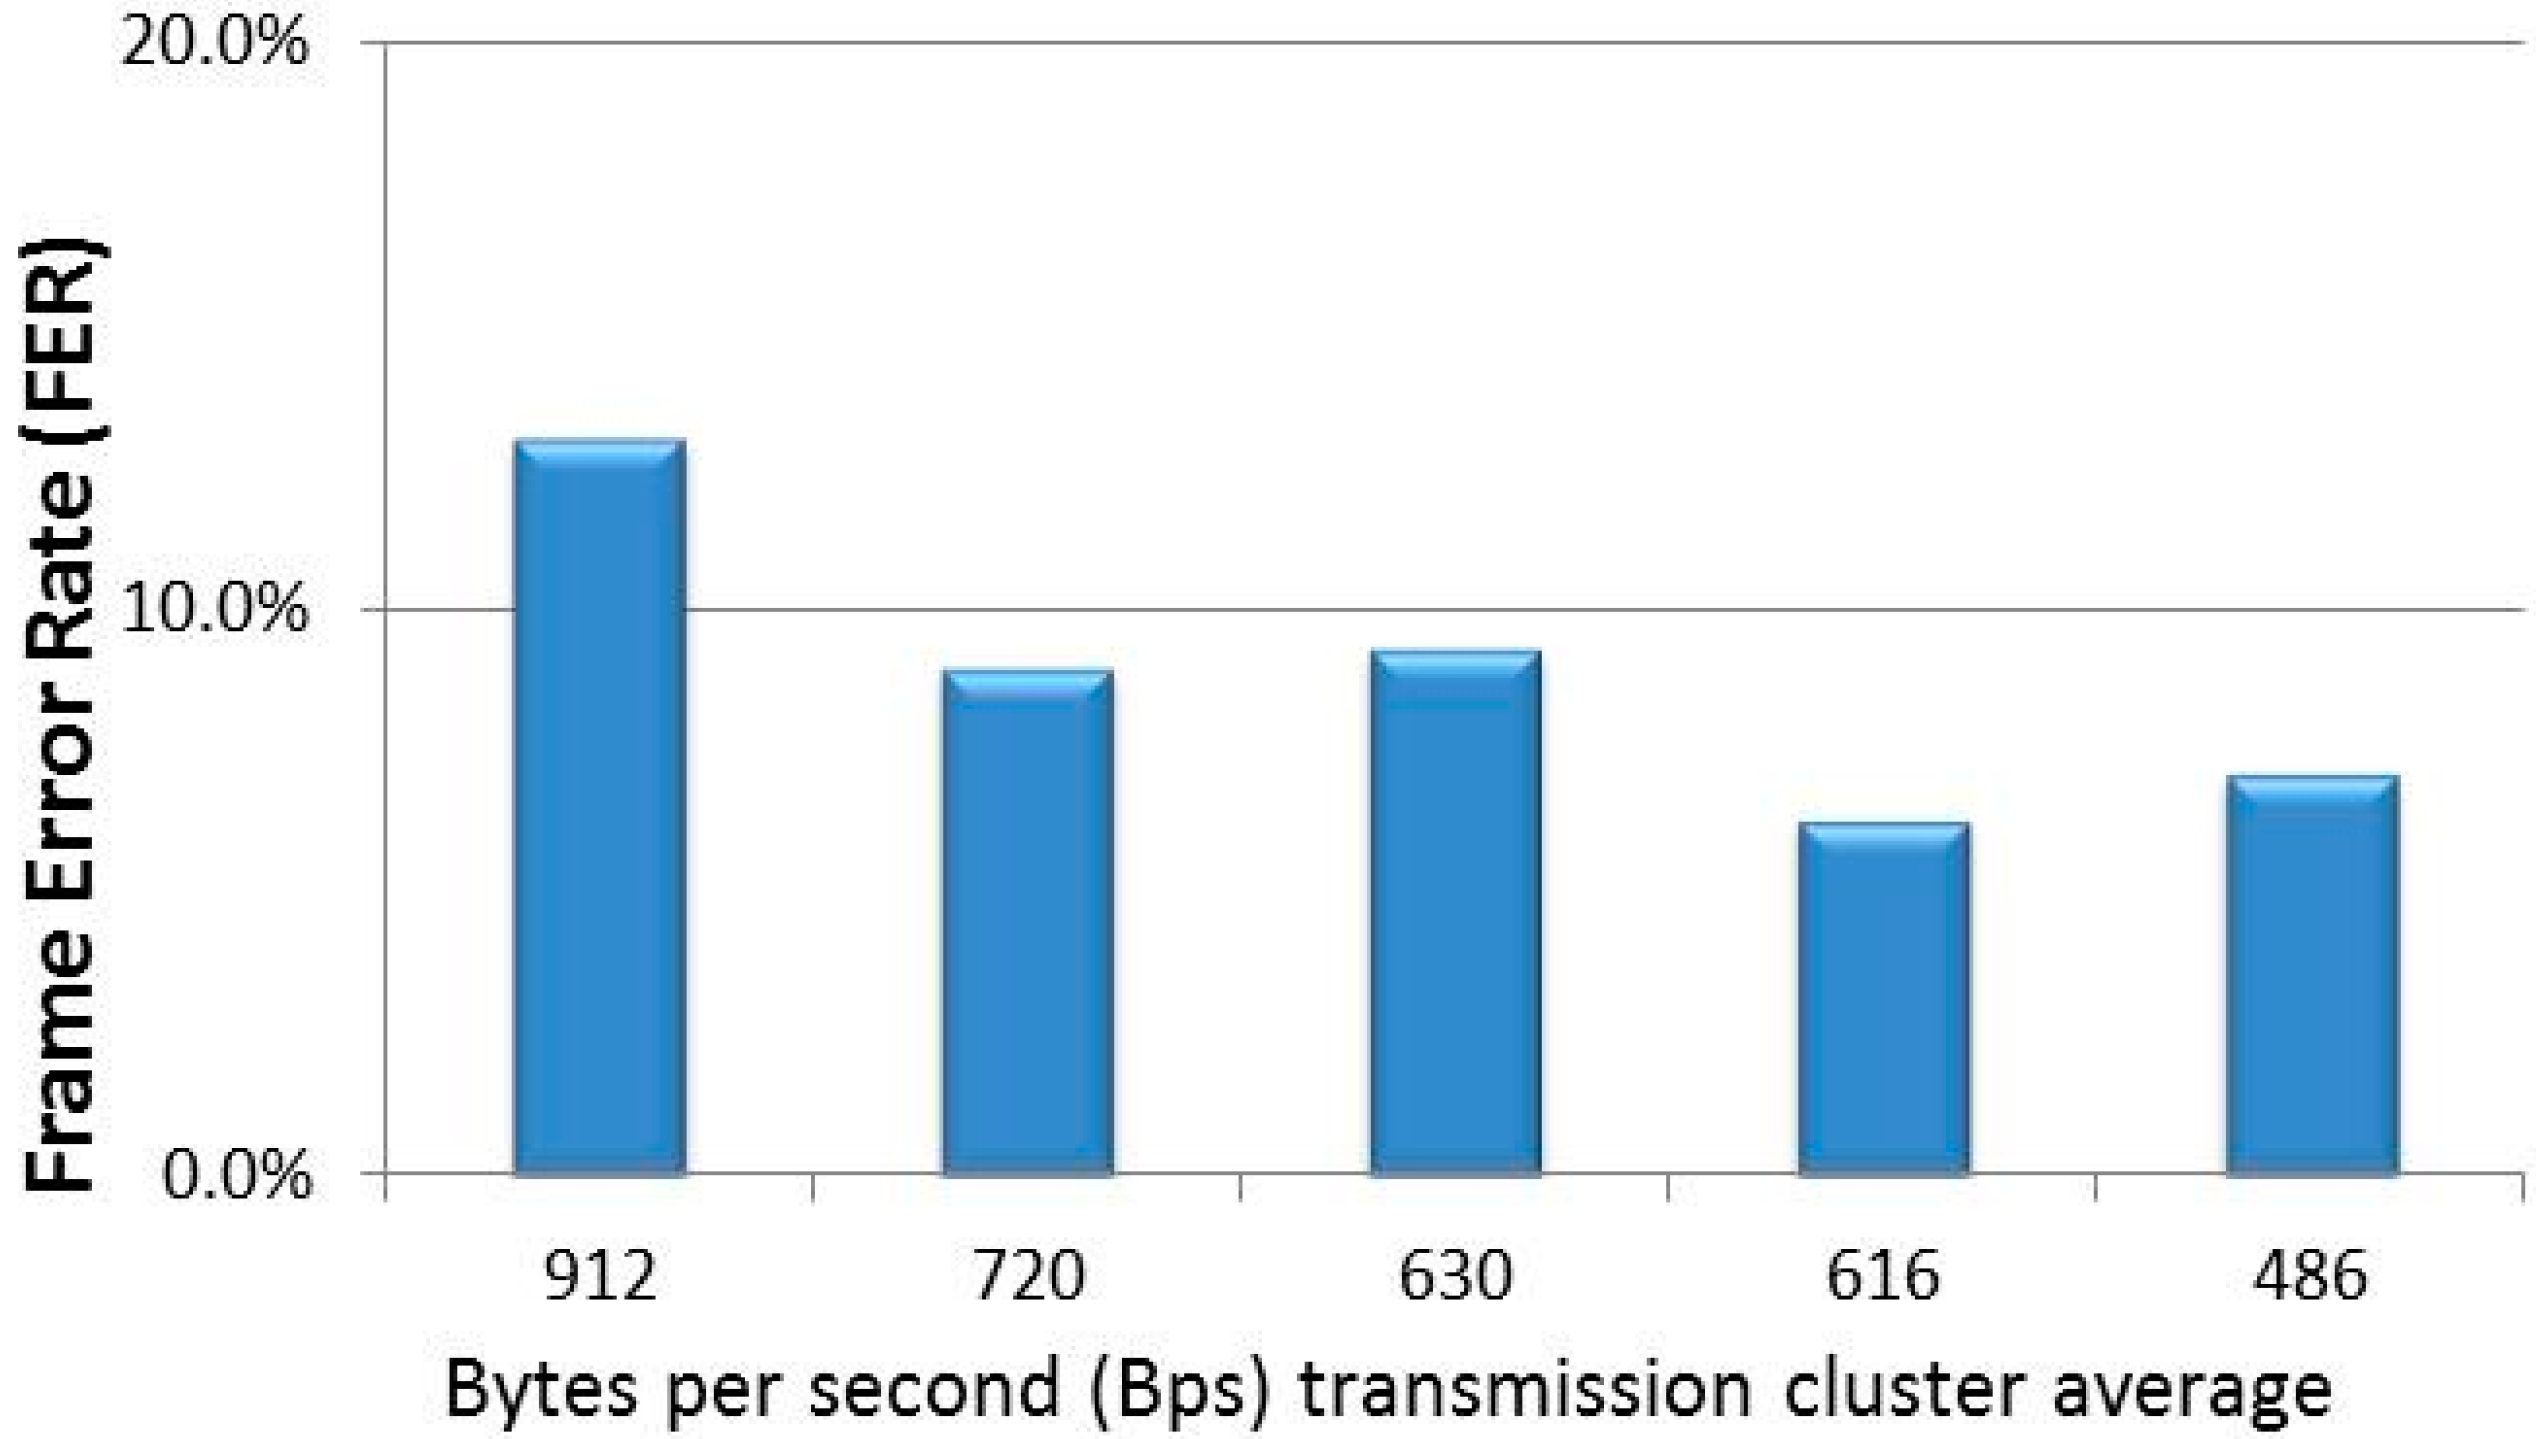
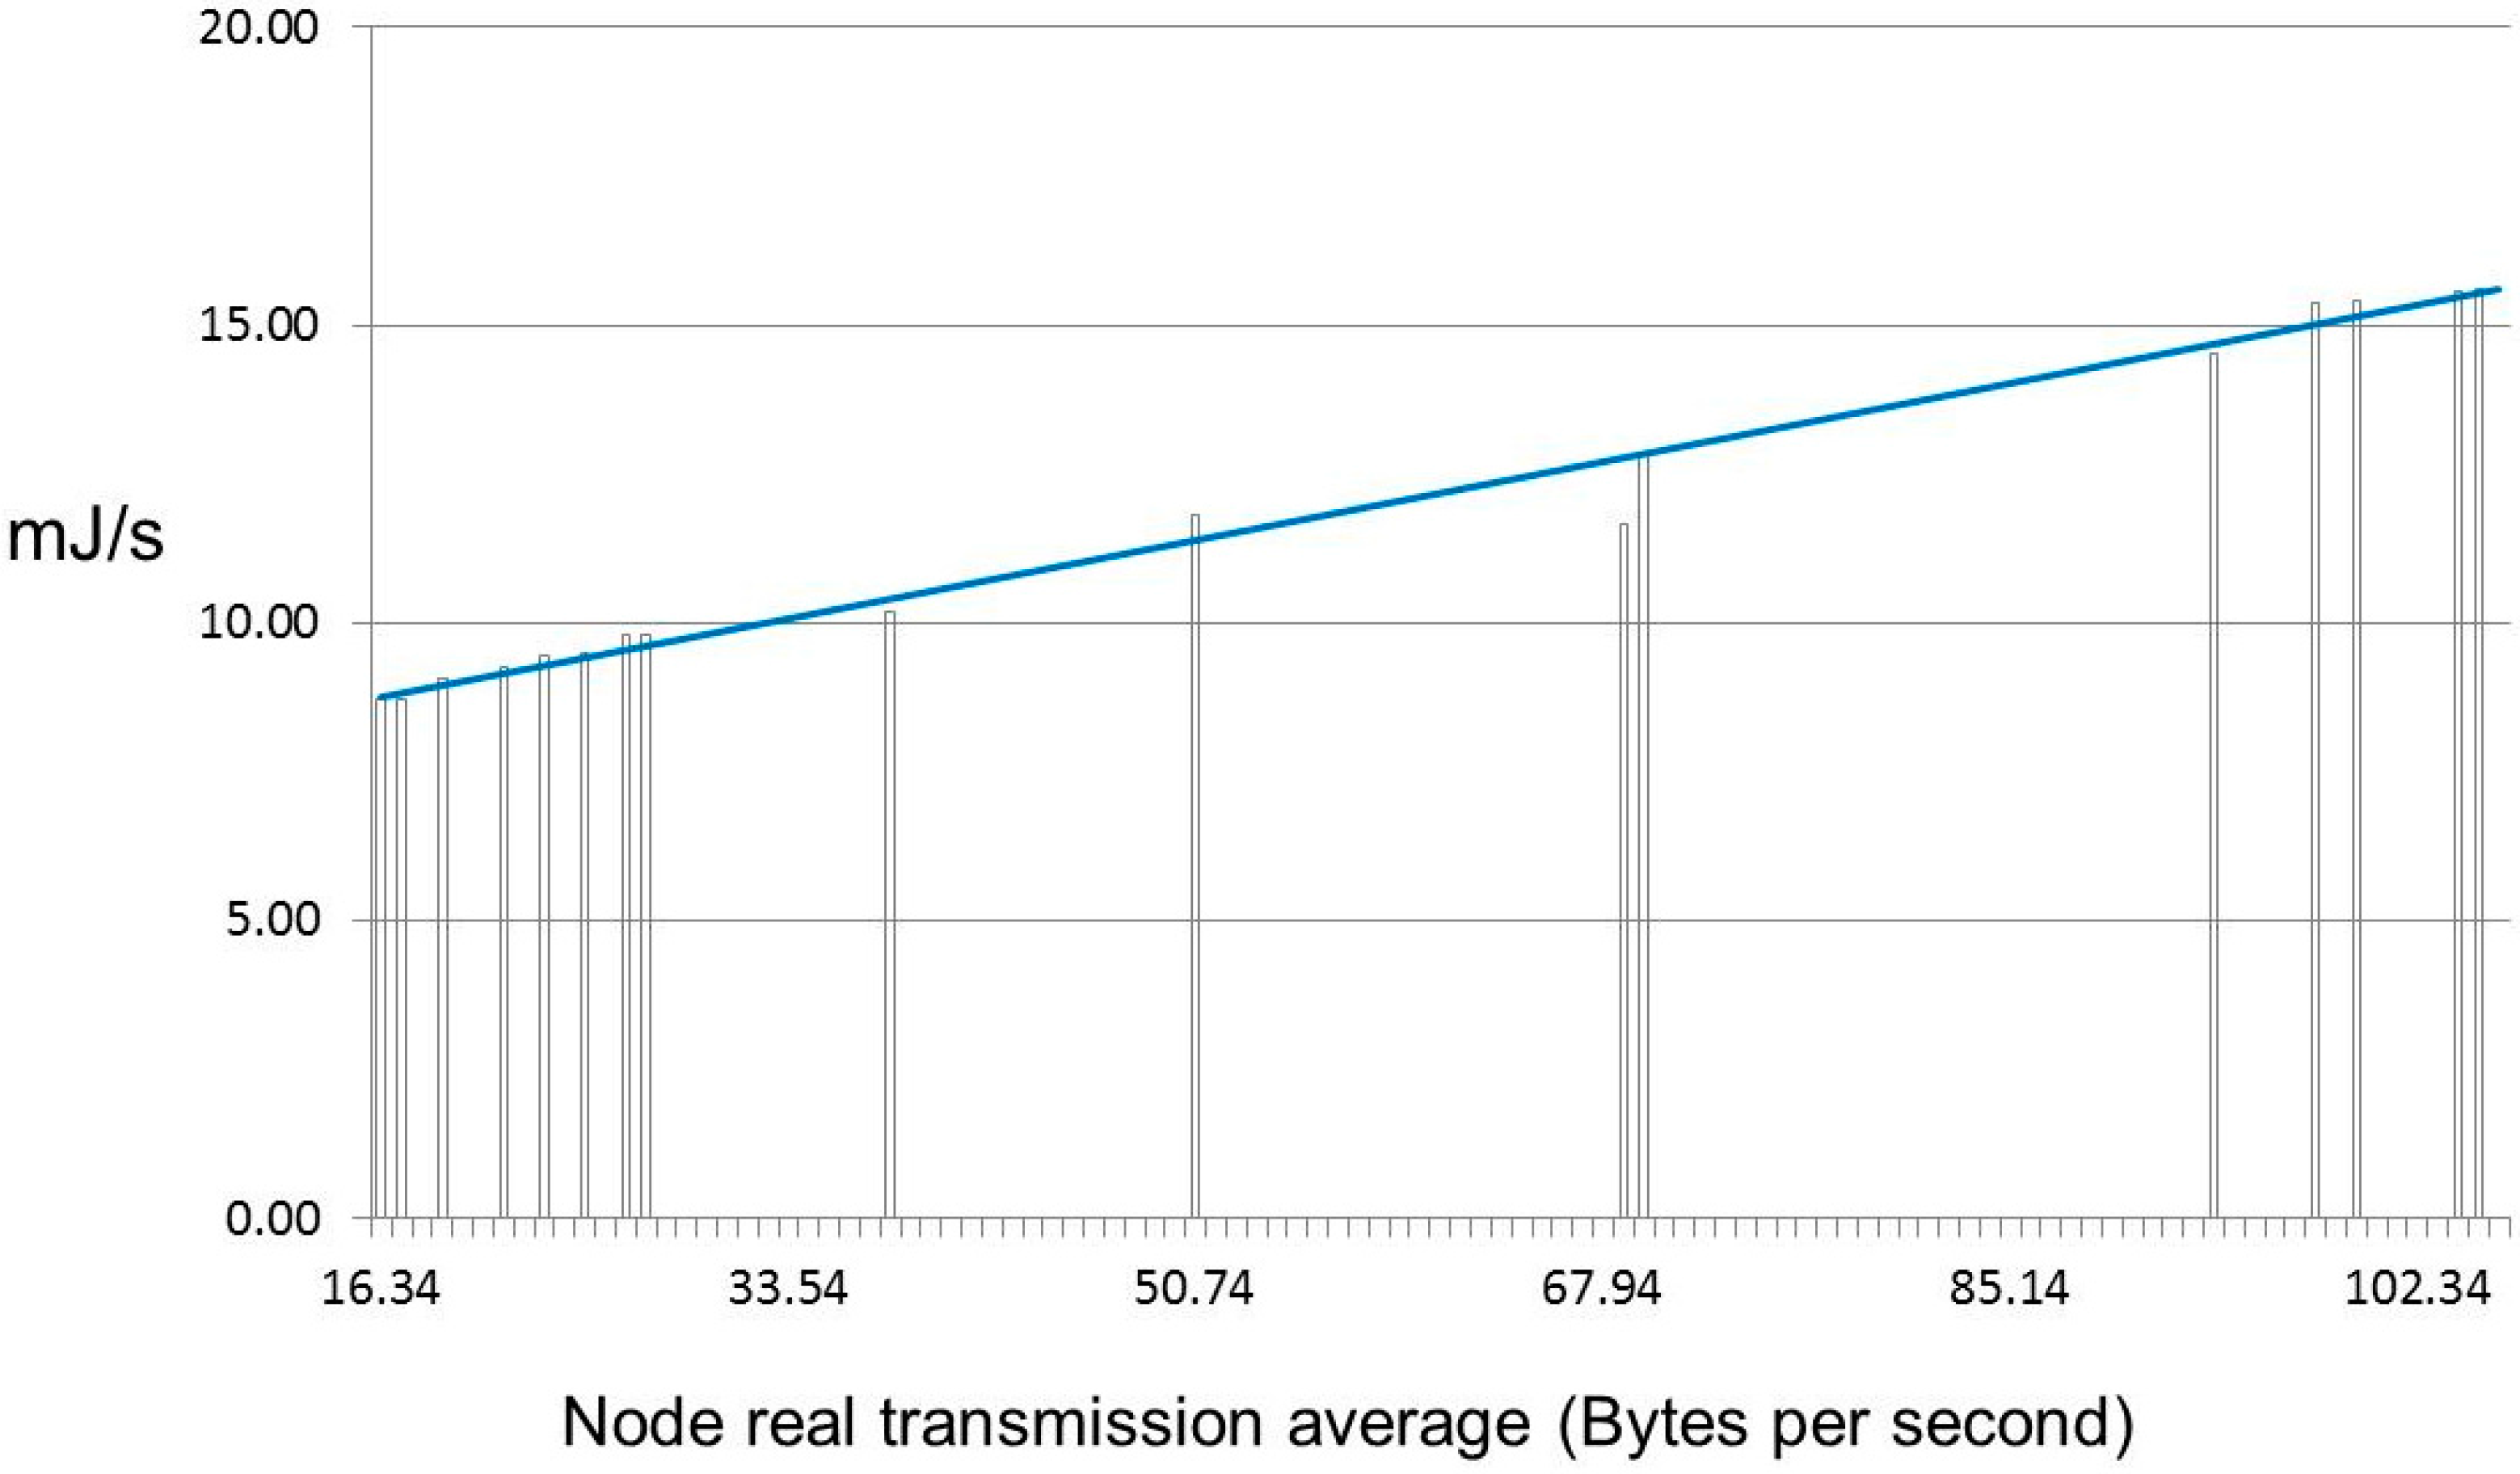
5.2. Wireless Network Capacity Analysis


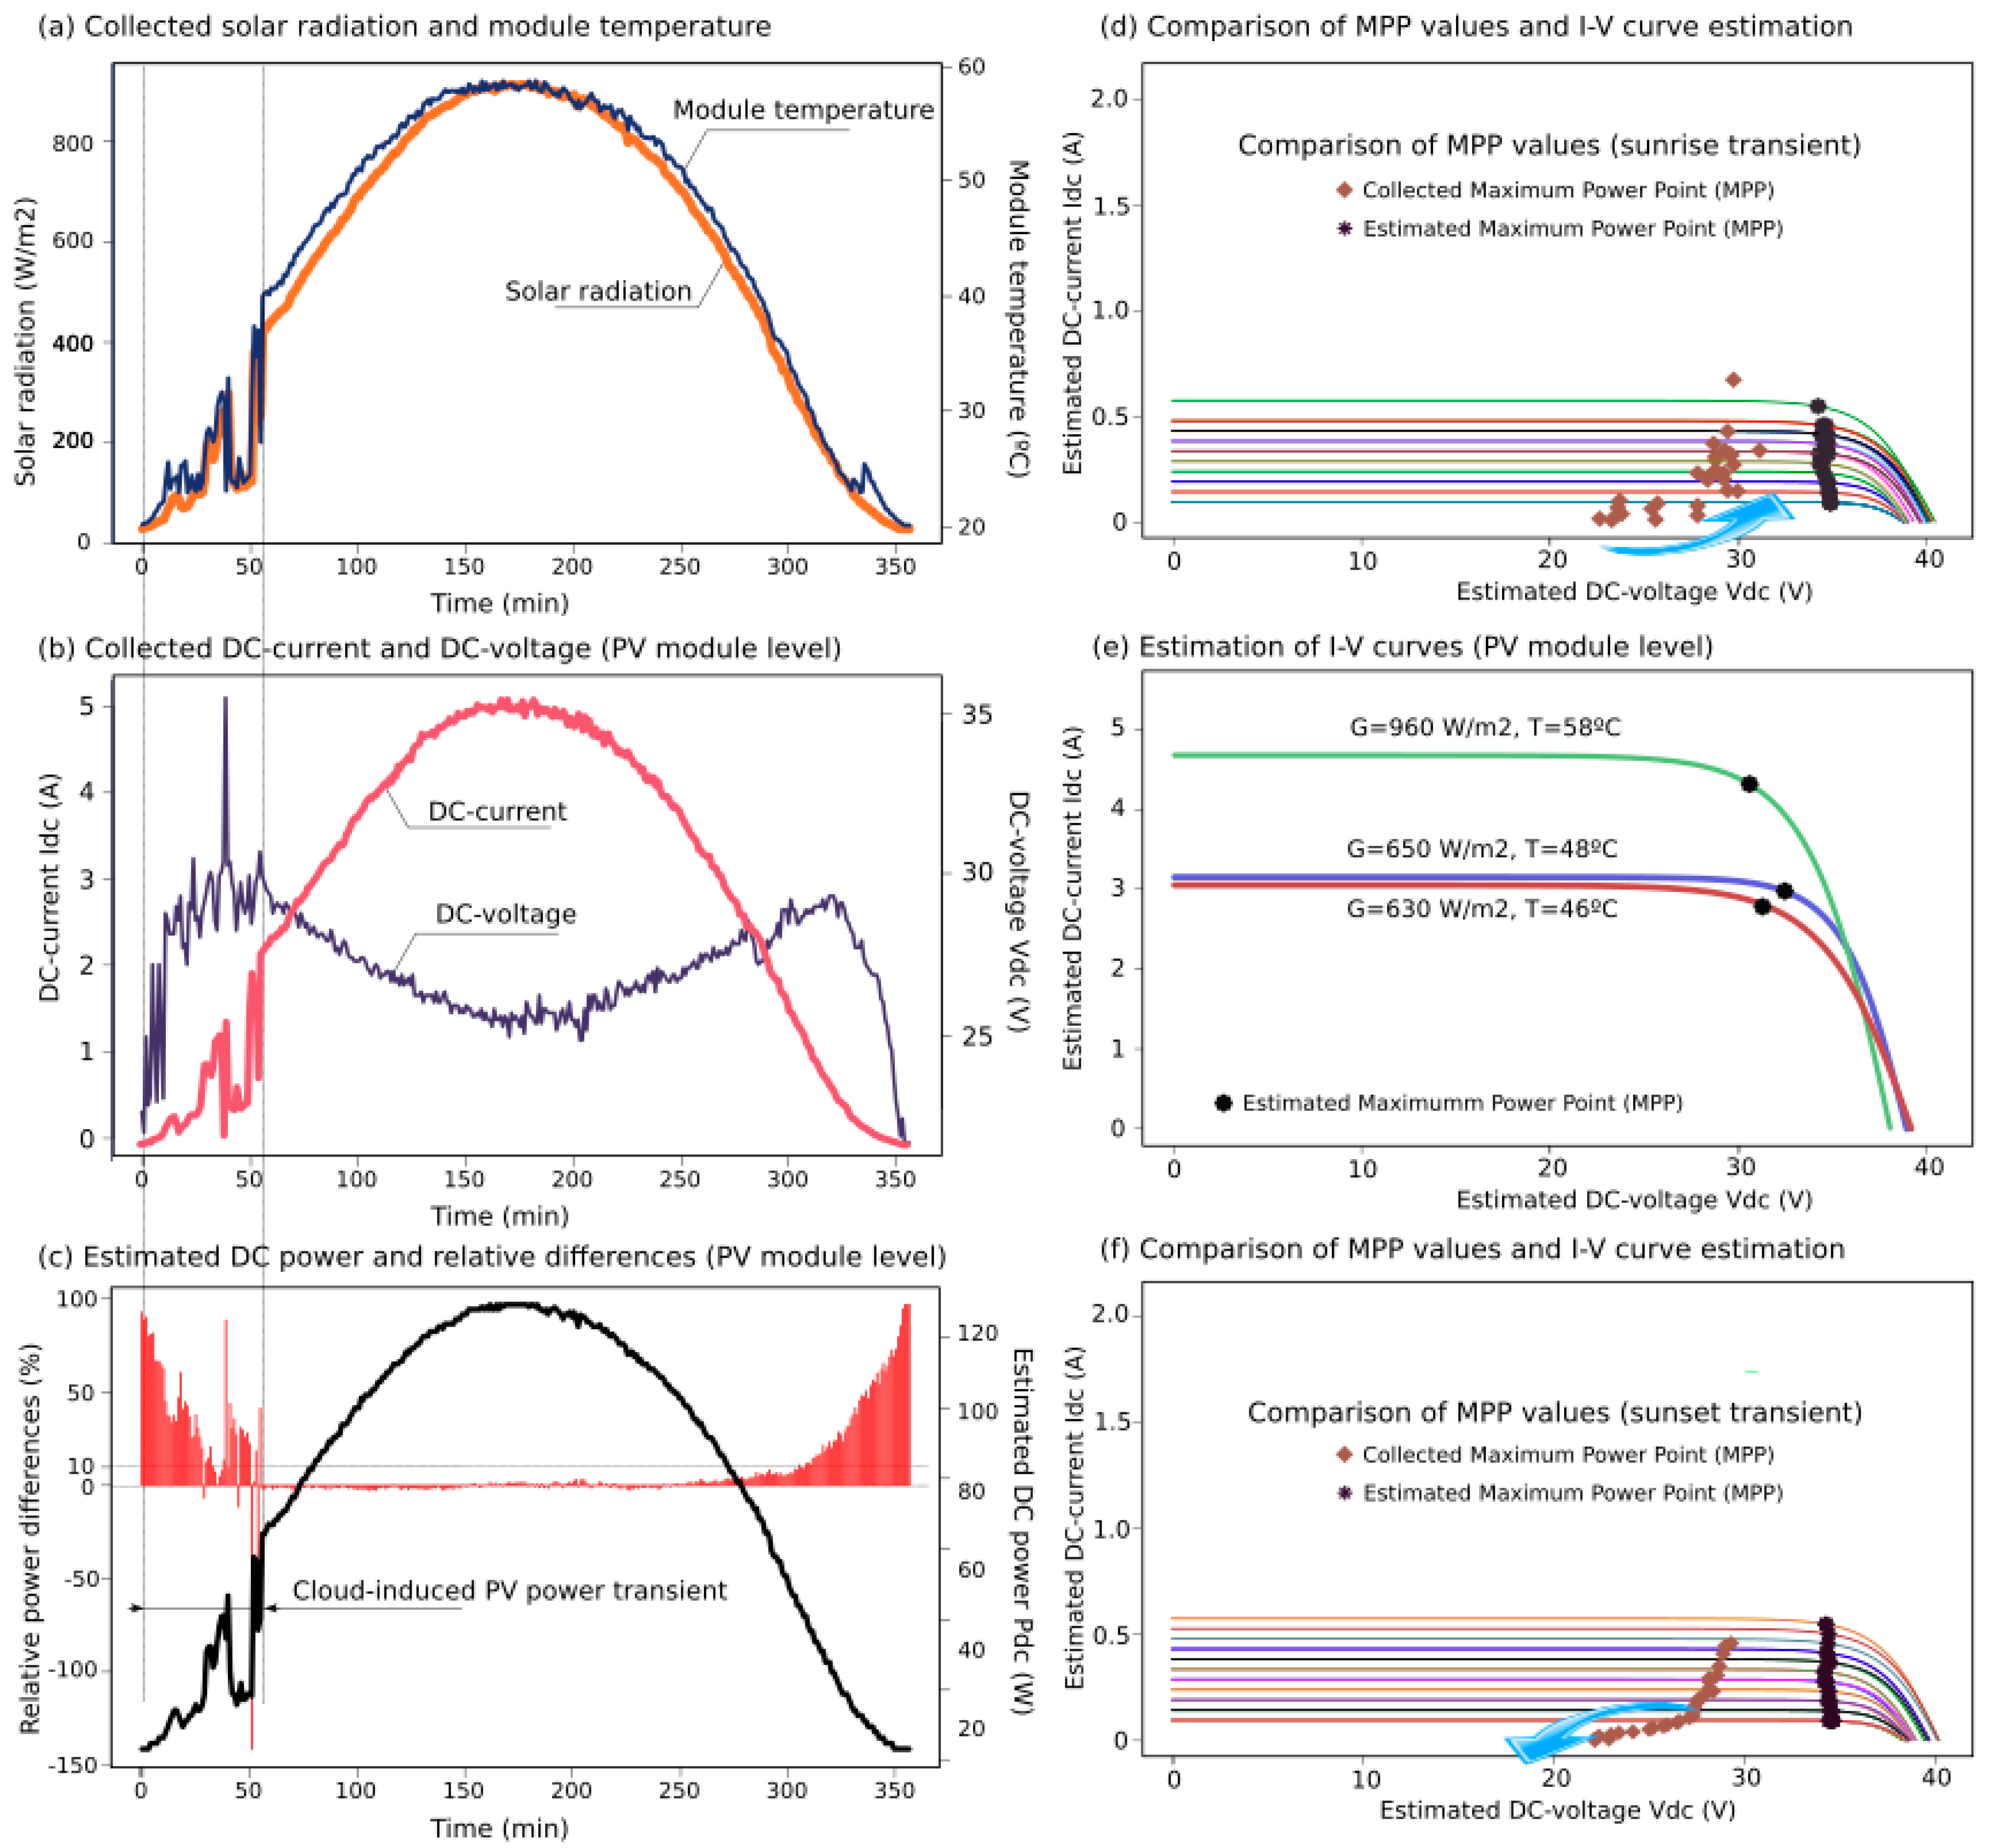
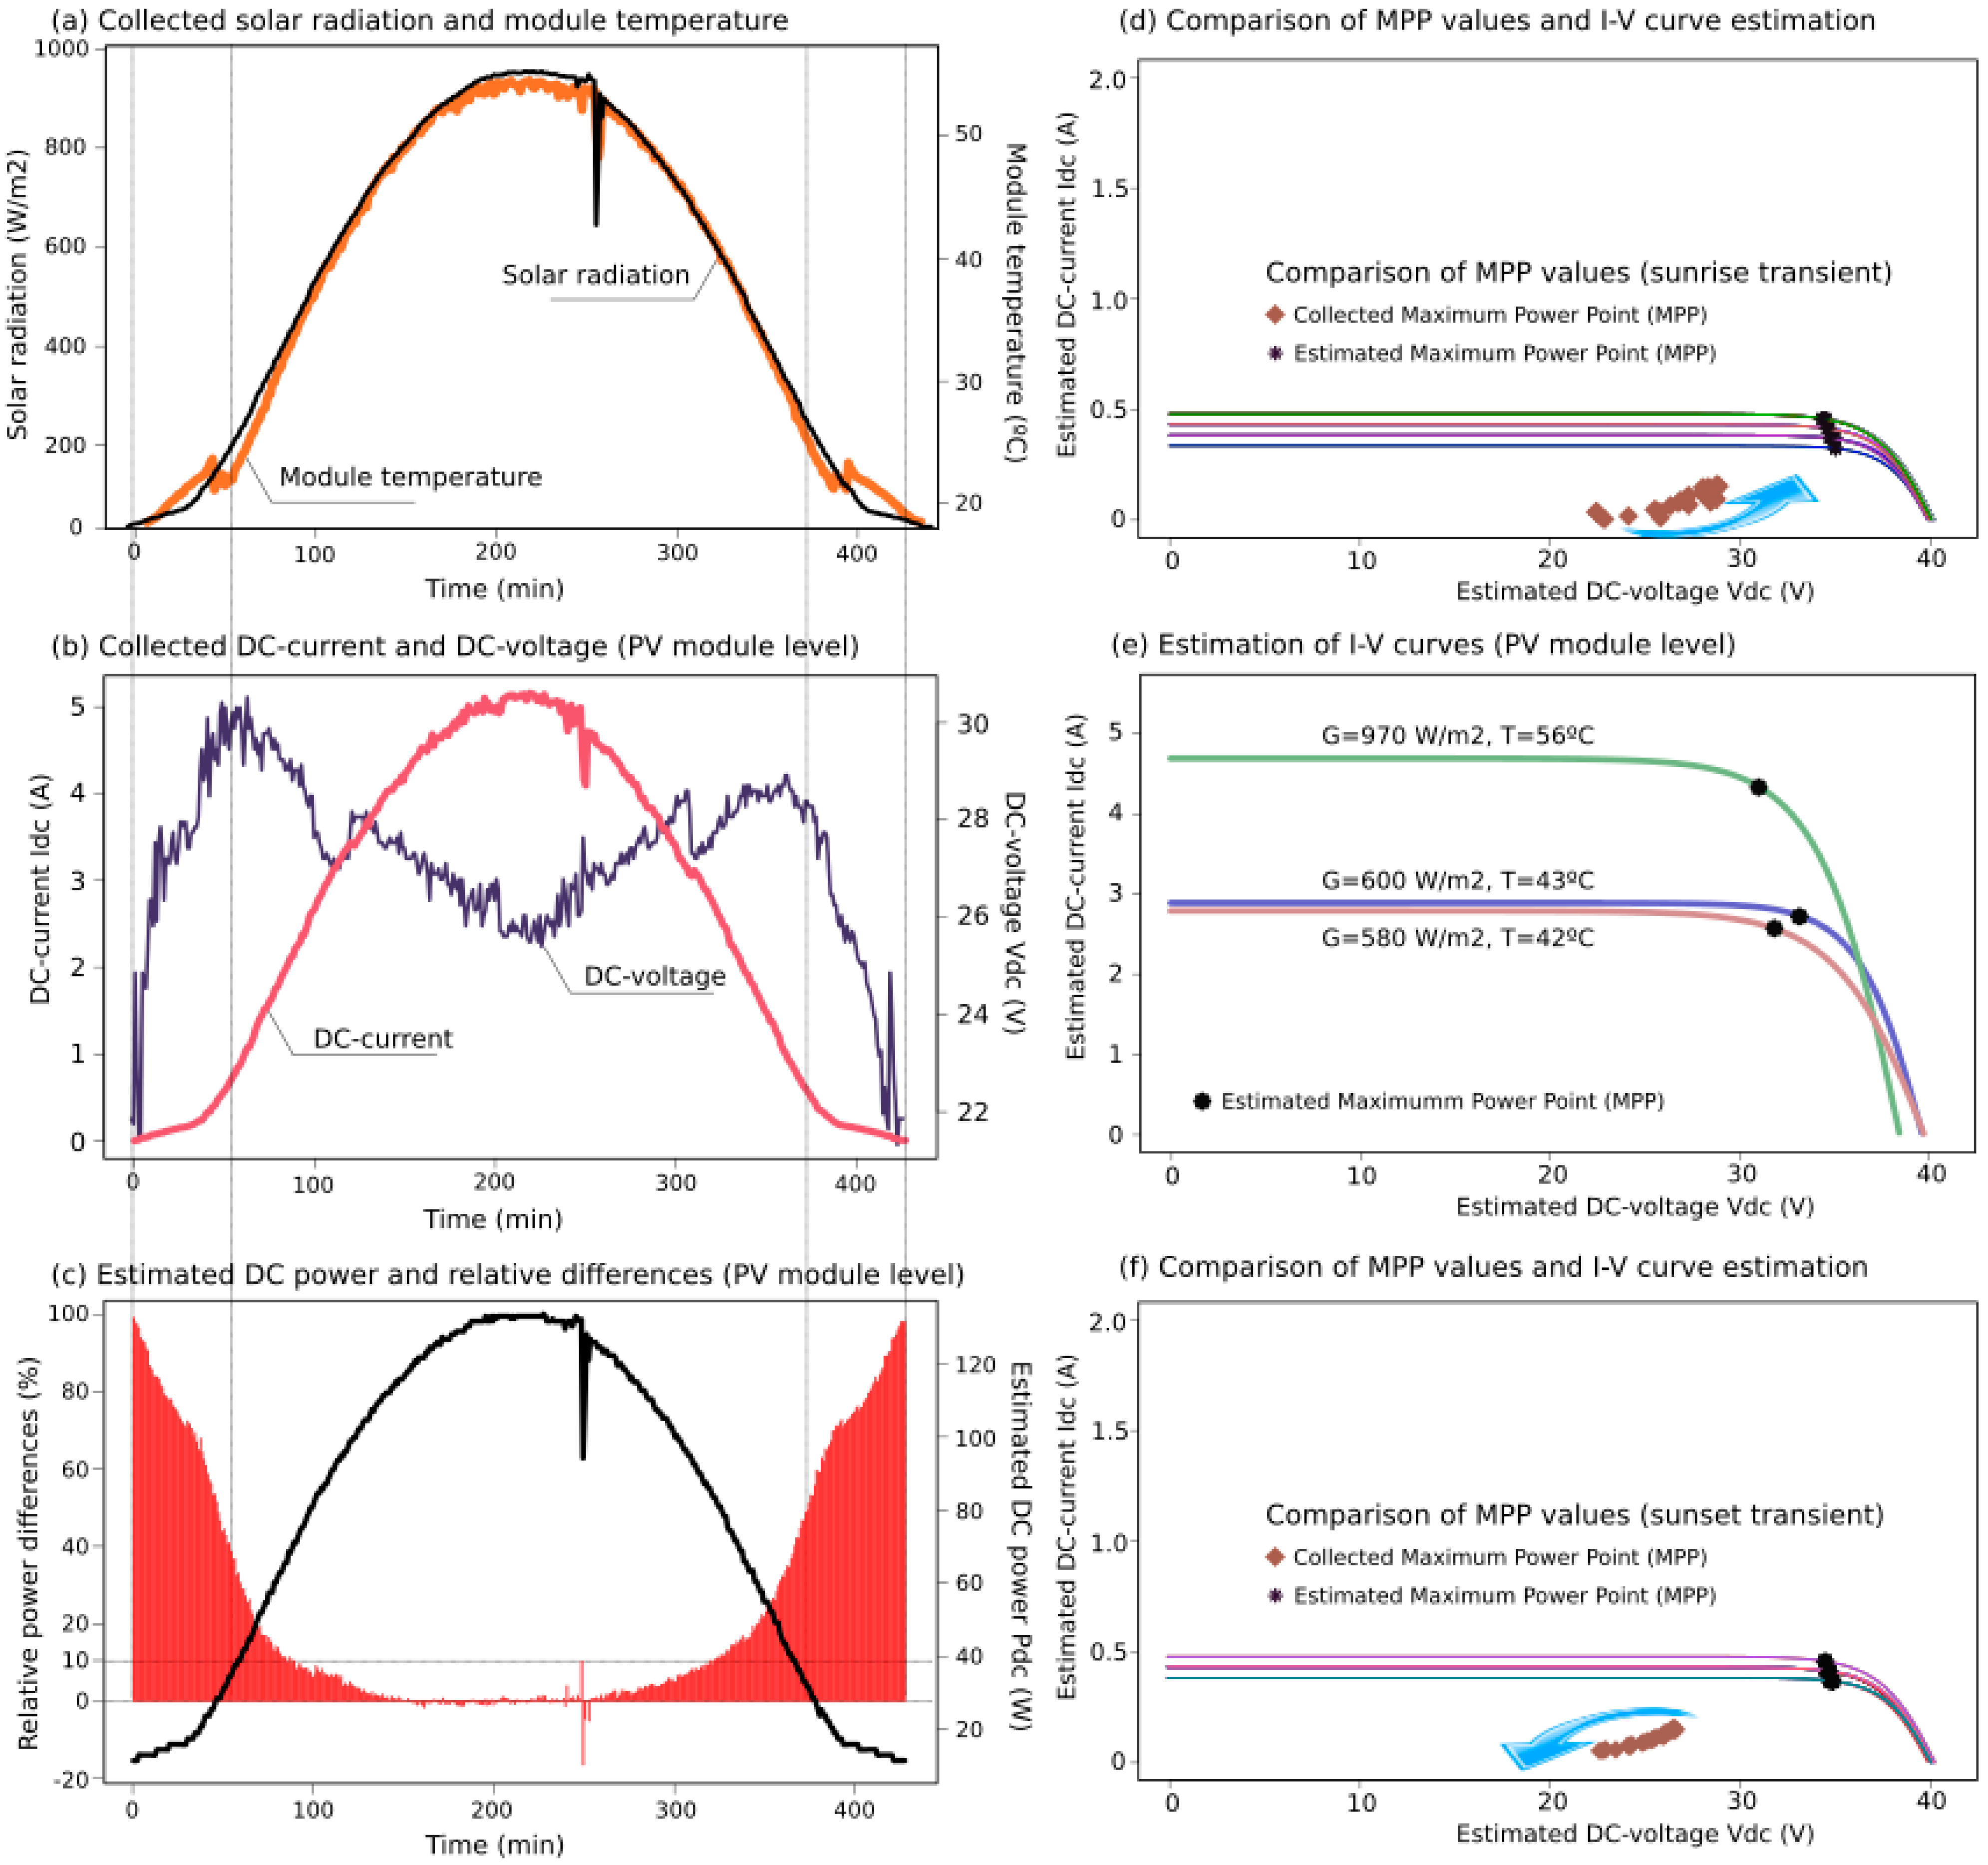
5.3. Collected Data and PV Module Performance Estimations

6. Conclusions
Acknowledgments
Author Contributions
Conflicts of Interest
References
- Global Wind Energy Council. Global Wind Report—Annual Market Update 2013. Available online: http://www.gwec.net/wp-content/uploads/2014/04/GWEC-Global-Wind-Report_9-April-2014.pdf (accessed on 7 March 2015).
- Bialasiewicz, J.T. Renewable Energy Systems with Photovoltaic Power Generators: Operation and Modeling. IEEE Trans. Ind. Electron. 2008, 55, 2752–2758. [Google Scholar] [CrossRef]
- Romero-Cadaval, E.; Spagnuolo, G.; Franquelo, L.G.; Ramos-Paja, C.A.; Suntio, T.; Xiao, W.M. Grid-Connected Photovoltaic Generation Plants. IEEE Ind. Electron. Mag. 2013, 7, 6–20. [Google Scholar] [CrossRef]
- Connecting the sun. Solar PV on the Road to Large-Scale Grid Integration; European PV Industry Association (EPIA), 2012. Available online: http://www.epia.org (accessed on 7 March 2015).
- Liserre, M.; Sauter, T.; Hung, J.Y. Future Energy Systems. IEEE Ind. Electron. Mag. 2010. [Google Scholar] [CrossRef]
- Yang, Y.; Wang, H.; Blaabjerg, F. Reactive Power Injection Strategies for Single-Phase Photovoltaic Systems Considering Grid Requirements. IEEE Trans. Ind. Appl. 2014, 50, 4065–4076. [Google Scholar] [CrossRef]
- Analytical Monitoring of Grid-Connected Photovoltaic Systems; Technical Report IEA-PVPS T13-03:2014. International Energy Agency: Brussels, Belgium, 2014. Available online: http://www.iea.org (accessed on 7 March 2015).
- Van Dyk, E.E.; Gxasheka, A.R.; Meyer, E.L. Monitoring current-voltage characteristics and energy output of silicon photovoltaic modules. Renew. Energy 2005, 30, 399–411. [Google Scholar] [CrossRef]
- Forero, N.; Hernández, J.; Gordillo, G. Development of a monitoring system for a PV solar plant. Energy Convers. Manag. 2006, 47, 2329–2336. [Google Scholar] [CrossRef]
- Vergura, S.; Acciani, G.; Amoruso, V.; Patrono, G.E.; Vacca, F. Descriptive and Inferential Statistics for Supervising and Monitoring the Operation of PV Plants. IEEE Trans. Ind. Electron. 2009, 56, 4456–4464. [Google Scholar] [CrossRef]
- Roman, E.; Alonso, R.; Ibanez, P.; Elorduizapatarietxe, S.; Goitia, D. Intelligent PV Module for Grid-Connected PV Systems. IEEE Trans. Ind. Electron. 2006, 53, 1066–1073. [Google Scholar] [CrossRef]
- Sánchez-Pacheco, F.J.; Sotorrío-Ruiz, P.J.; Heredia-Larrubia, J.R.; Pérez-Hidalgo, F.; de Cardona, M.S. PLC-Based PV Plants Smart Monitoring System: Field Measurements and Uncertainty Estimation. IEEE Trans. Instrum. Meas. 2014, 63, 2215–2222. [Google Scholar] [CrossRef]
- Ayompe, L.M.; Duffy, A.; McCormack, S.J.; Conlon, M. Measured performance of a 1.72 kW rooftop grid connected photovoltaic system in Ireland. Energy Convers. Manag. 2011, 52, 816–825. [Google Scholar] [CrossRef]
- Carullo, A.; Vallan, A. Outdoor Experimental Laboratory for Long-Term Estimation of Photovoltaic-Plant Performance. IEEE Trans. Instrum. Meas. 2012, 61, 1307–1314. [Google Scholar] [CrossRef]
- García-Hernández, C.F.; Ibarguengoytia-González, P.H.; Pérez-Diaz, J.A. Wireless Sensor Networks and Applications: A Survey. Int. J. Comput. Sci. Netw. Secur. 2007, 7, 264–273. [Google Scholar]
- Petrone, G.; Spagnuolo, G.; Teodorescu, R.; Veerachary, M.; Vitelli, M. Reliability Issues in PV Power Processing Systems. IEEE Trans. Ind. Electron. 2008, 55, 2569–2580. [Google Scholar] [CrossRef]
- Prieto, M.J.; Pernía, A.M.; Nuño, F.; Díaz, J.; Villegas, P.J. Development of a Wireless Sensor Network for Individual Monitoring of Panels in a Photovoltaic Plant. Sensors 2014, 14, 2379–2396. [Google Scholar] [CrossRef] [PubMed]
- Andò, B.; Baglio, S.; Pistorio, A.; Tina, G.M.; Ventura, C. Sentinella: Smart Monitoring of Photovoltaic Systems at Panel Level. IEEE Trans. Instrum. Meas. 2015. [Google Scholar] [CrossRef]
- Dargie, W.; Poellabauer, C. Fundamentals of Wireless Sensor Networks: Theory and Practice; John Wiley and Sons.: Chichester West Sussex, UK, 2010. [Google Scholar]
- Sohraby, K.; Minoli, D.; Znati, T. Wireless Sensor Networks: Technology, Protocols, and Applications; John Wiley and Sons.: Chichester West Sussex, UK, 2007. [Google Scholar]
- Mau, S. Basic Principles for Designing PV Plant Monitoring Systems; International Energy Agency (IEA), Photovoltaic Power Systems Program: Barcelona, Spain, 2013. Available online: http://www.iea-pvps.org/ (accessed on 7 March 2015).
- Molina-García, A.; Campelo, J.C.; Serrano, J.J.; Gómez-Lázaro, E.; García-Sánchez, T. Application of Wireless Sensor Network to PV Solar Module Monitoring. In Proceedings of the 4th Solar Integration Workshop, Berlin, Germany, 10–11 November 2014; pp. 1–5.
- Ishaque, K.; Salam, Z.; Syafaruddin, A. A comprehensive MATLAB Simulink PV system simulator with partial shading capability based on two-diode model. Sol. Energy 2011, 85, 2217–2227. [Google Scholar] [CrossRef]
- Xiao, W.; Dunford, W.G.; Palmer, P.R.; Capel, A. Regulation of Photovoltaic Voltage. IEEE Trans. Ind. Electron. 2007, 54, 1365–1374. [Google Scholar] [CrossRef]
- Chan, D.S.H.; Phang, J.C.H. Analytical methods for the extraction of solar-cell single and double diode model parameters from I–V characteristics. IEEE Trans. Electron. Devices 1987, ED-34, 286–293. [Google Scholar] [CrossRef]
- Lui, S.; Dougal, R.A. Dynamic multiphysics models for solar array. IEEE Trans. Energy Convers. 2002, 17, 285–294. [Google Scholar]
- Vengatesh, R.; Rajan, S. Investigation of cloudless solar radiation with PV module employing matlab-simulink. Sol. Energy 2011, 85, 1727–1734. [Google Scholar] [CrossRef]
- Tian, H.; Mancilla-David, F.; Ellis, K.; Muljadi, E.; Jenkins, P. A cell-to-module-to-array detailed model for photovoltaic panels. Sol. Energy 2012, 86, 2695–2706. [Google Scholar] [CrossRef]
- Skoplaki, E.; Palyvos, J.A. On the temperature dependence of photovoltaic module electrical performance: A review of efficiency/power correlations. Sol. Energy 2009, 83, 614–624. [Google Scholar] [CrossRef]
- Molina-García, A.; Guerrero-Pérez, J.; Bueso, M.C.; Kessler, M.; Gómez-Lázaro, E. A New Solar Module Modeling for PV Applications Based on a Symmetrized and Shifted Gompertz Model. IEEE Trans. Energy Convers. 2015, 30, 51–59. [Google Scholar] [CrossRef]
- R Core Team. R: A Language and Environment for Statistical Computing. R Foundation for Statistical Computing: Vienna (Austria), 2014. Available online: http://www.R-project.org (accessed on 7 March 2015).
- Aranda, E.D.; Galan, J.A.G.; de Cardona, M.S.; Marquez, J.M.A. Measuring the I–V curve of PV generators. IEEE Ind. Electron. Mag. 2009, 3, 4–14. [Google Scholar] [CrossRef]
- Reis, A.M.; Coleman, N.T.; Marshall, M.W.; Lehman, P.A.; Chamberlin, C.E. Comparison of PV module performance before and after 11-years of field exposure. In Proceedings of the 29th IEEE Photovoltaic Specialists Conference, New Orleans, LA, USA, 19–24 May 2002; pp. 1432–1435.
- Feldman, D.; Barbose, G.; Margolis, R.; James, T.; Weaver, S.; Darghouth, N.; Fu, R.; Davidson, C.; Booth, S.; Wiser, R.; et al. Photovoltaic System Pricing Trends, Historical, Recent, and Near-Term Projections 2014 Edition. Available online: http://www.nrel.gov/docs/fy14osti/62558.pdf (accessed on 10 July 2015).
- Willig, A. Recent and emerging topics in wireless industrial communications: A selection. IEEE Trans. Ind. Inform. 2008, 4, 102–124. [Google Scholar] [CrossRef]
- ZigBee Specification. Zigbee Standards Organization. 2006. Available online: http://www.zigbee.org (accessed on 7 March 2015).
- Sánchez, A.; Aguilar, J.; Blanc, S.; Serrano, J.J. RFID-based wake-up system for Wireless sensor networks. In Proceedings of the SPIE Micro Technologies, VLSI Circuits and Systems V, Prague, Czech Republic, 18–20 April 2011.
- STR912FAW33. ARM966E-S 16/32-Bit Flash MCU with Ethernet, USB, CAN, AC Motor Control, 4 timers, ADC, RTC, DMA. Available online: http://www.st.com (accessed on 7 March 2015).
- NXP Low Power RF. JN Wireless Microcontrollers. Available online: http://www.jennic.com (accessed on 7 March 2015).
- Falvo, M.C.; Capparella, S. Safety issues in PV systems: Design choices for a secure fault detection and for preventing fire risk. Case Stud. Fire Saf. 2015, 3, 1–16. [Google Scholar] [CrossRef]
- Optical Isolation for Solar Power Applications. Available online: http://www.vishay.com (accessed on 2 June 2015).
- Design Guidelines for Optocoupler Safety Agency Compliance. Available online: http://www.vishay.com (accessed on 2 June 2015).
- Vishay Semiconductors. Optocoupler, Phototransistor Output, High Reliability, 5300 VRMS. Available online: http://www.vishay.com (accessed on 2 June 2015).
- ACS712 Fully Integrated, Hall Effect-Based Linear Current Sensor IC Allegro Microsystems. Available online: http://www-allegromicro.com (accessed on 7 March 2015).
- Thermometrics.PT1000 Sensor. Available online: http://www.thermometricscorp.com (accessed on 2 June 2015).
- Kipp & Zonnen. CMP3 Pyranometer. Available online: http://www.kippzonnen.com (accessed on 2 June 2015).
- Energy Metering IC with SPI Interface and Active Power Pulse Output. Available online: http://www.microchip.com (accessed on 7 March 2015).
- Futulec. The ELECTRONIC COMPONENTS Superstore. Solar Cells Division. Available online: http://www.futurlec.com/Solar_Cell.shtml (accessed on 7 March 2015).
- Jiang, X.; Polastre, J.; Culler, D. Perpetual environmentally powered sensor networks. In Proceedings of the Fourth International Symposium on Information Processing in Sensor Networks, IPSN/SPOTS, Los Angeles, CA, USA, 25–27 April 2005.
- Sanchez, A.; Blanc, S.; Climent, S.; Yuste, P.; Ors, R. SIVEH: Numerical Computing Simulation of Wireless Energy-Harvesting Sensor Nodes. Sensors 2013, 13, 11750–11771. [Google Scholar] [CrossRef]
- hotoWatt-PW1650. Available online: http://www.photowatt.com/ (accessed on 7 March 2015).
- Applications Solars. PW 1650 Data-Sheet and Temperature Coefficient. Available online: http://www.aplicasolars.com/pdf/plaques-fotovoltaiques/pw1650mc.pdf (accessed on 10 July 2015).
- Nelson, J.A. Effects of Cloud-Induced PV Power Transient on Power System Protection. PhD Thesis, Faculty of California Polytechnic State University, San Luis Obispo, CA, USA, 2010. Available online: http://digitalcommons.calpoly.edu/cgi/viewcontent.cgi?article=1448&context=theses (accessed on 2 June 2015). [Google Scholar]
- Lenox, C. Variability in a Large Scale PV Installation. In Proceedings of the Utility-Scale PV Variability Workshop; Cedar Rapids, IA, USA, 7 October 2009. Available online: http://www.nrel.gov/eis/pdfs/47514.pdf (accessed on 2 June 2015).
© 2015 by the authors; licensee MDPI, Basel, Switzerland. This article is an open access article distributed under the terms and conditions of the Creative Commons Attribution license (http://creativecommons.org/licenses/by/4.0/).
Share and Cite
Molina-García, A.; Campelo, J.C.; Blanc, S.; Serrano, J.J.; García-Sánchez, T.; Bueso, M.C. A Decentralized Wireless Solution to Monitor and Diagnose PV Solar Module Performance Based on Symmetrized-Shifted Gompertz Functions. Sensors 2015, 15, 18459-18479. https://doi.org/10.3390/s150818459
Molina-García A, Campelo JC, Blanc S, Serrano JJ, García-Sánchez T, Bueso MC. A Decentralized Wireless Solution to Monitor and Diagnose PV Solar Module Performance Based on Symmetrized-Shifted Gompertz Functions. Sensors. 2015; 15(8):18459-18479. https://doi.org/10.3390/s150818459
Chicago/Turabian StyleMolina-García, Angel, José Carlos Campelo, Sara Blanc, Juan José Serrano, Tania García-Sánchez, and María C. Bueso. 2015. "A Decentralized Wireless Solution to Monitor and Diagnose PV Solar Module Performance Based on Symmetrized-Shifted Gompertz Functions" Sensors 15, no. 8: 18459-18479. https://doi.org/10.3390/s150818459
APA StyleMolina-García, A., Campelo, J. C., Blanc, S., Serrano, J. J., García-Sánchez, T., & Bueso, M. C. (2015). A Decentralized Wireless Solution to Monitor and Diagnose PV Solar Module Performance Based on Symmetrized-Shifted Gompertz Functions. Sensors, 15(8), 18459-18479. https://doi.org/10.3390/s150818459