
Application of Cavity Enhanced Absorption Spectroscopy to the Detection of Nitric Oxide, Carbonyl Sulphide, and Ethane—Breath Biomarkers of Serious Diseases

Abstract
:1. Introduction to Laser Absorption Spectroscopy
2. Application of CES for Human Breath Analysis

| Breath Gas | Formula | Typical Fraction [ppb] | Diseases |
|---|---|---|---|
| Nitric oxide | NO | <35 | Asthma, angina, hyperbilirubinemia |
| Carbon monoxide | CO | 1000–10,000 | |
| Pentane | C5H12 | <10 | Breast cancer, lung cancer |
| Aceton | (CH3)2CO | <1000 | Diabetes |
| Ammonia | NH3 | <2000 | Liver disease, stomach ulcers and duodenal ulcers caused by Helicobacter pylori |
| Carbonyl sulfide | OCS | <10 | Liver disease, transplant rejection |
| Ethane | C2H6 | <10 | Alzheimer’s disease, atherosclerosis, diabetes, cancers |
3. Characterization of Selected Biomarkers
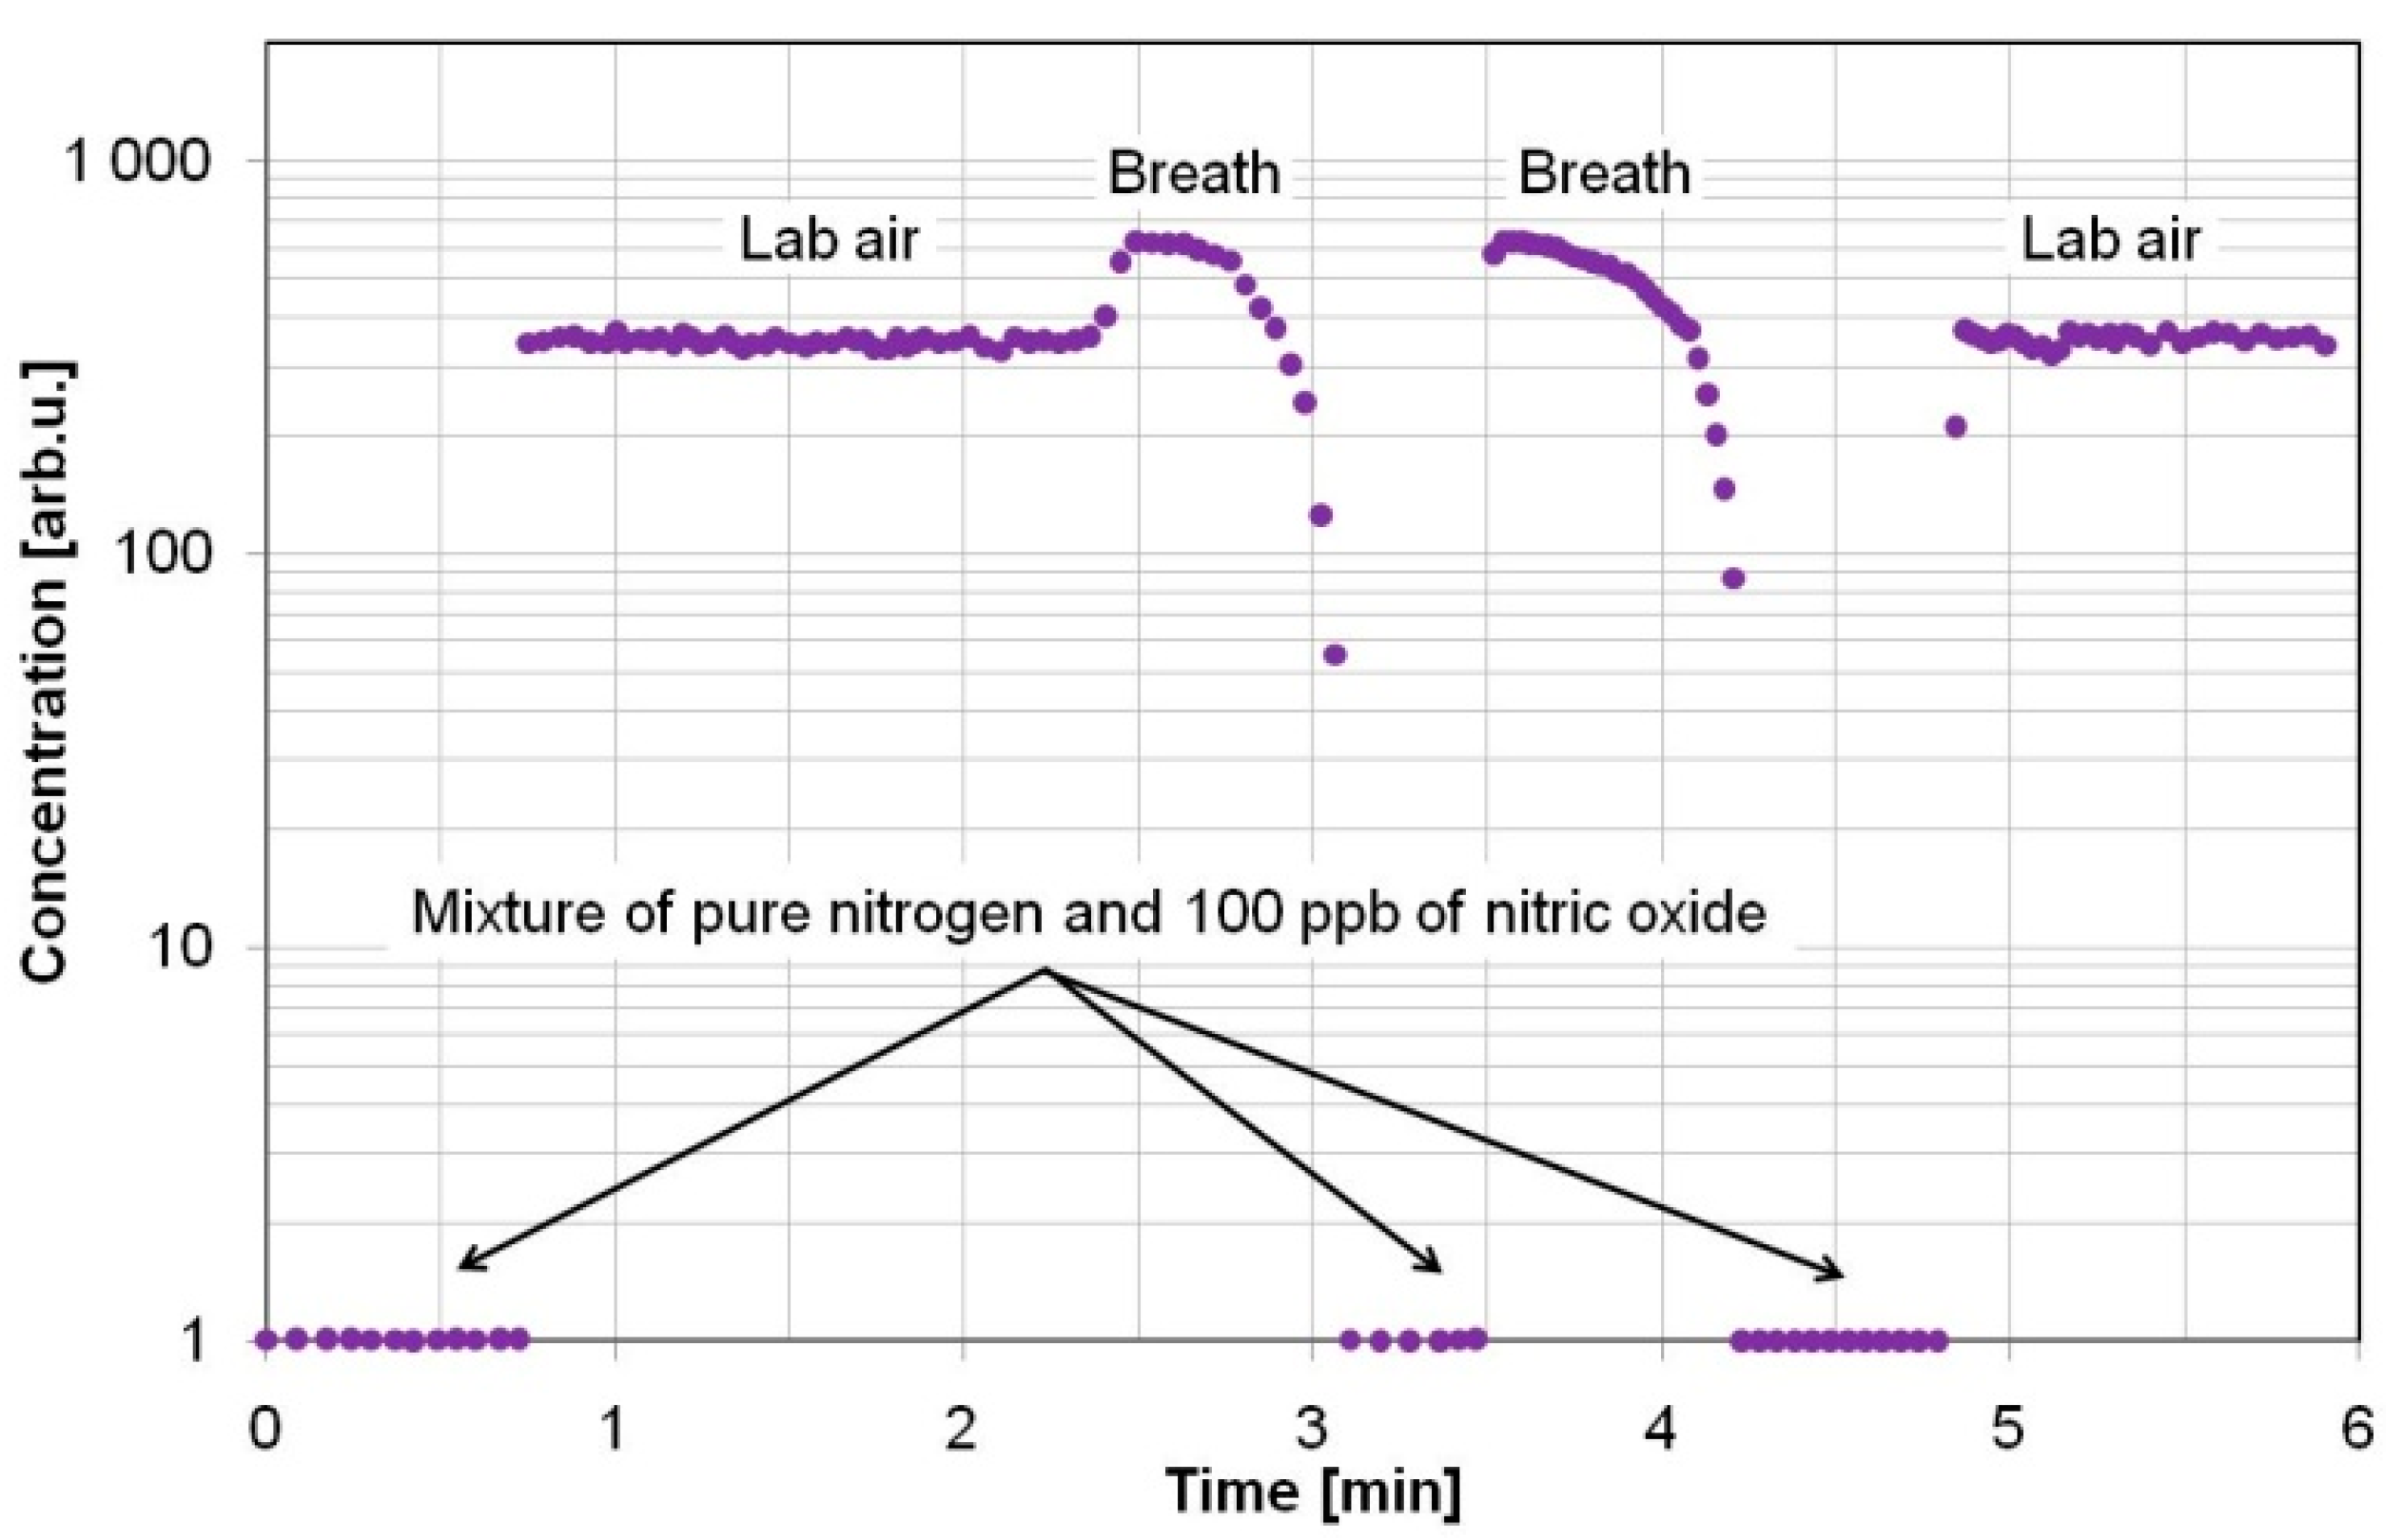
3.1. Nitric Oxide
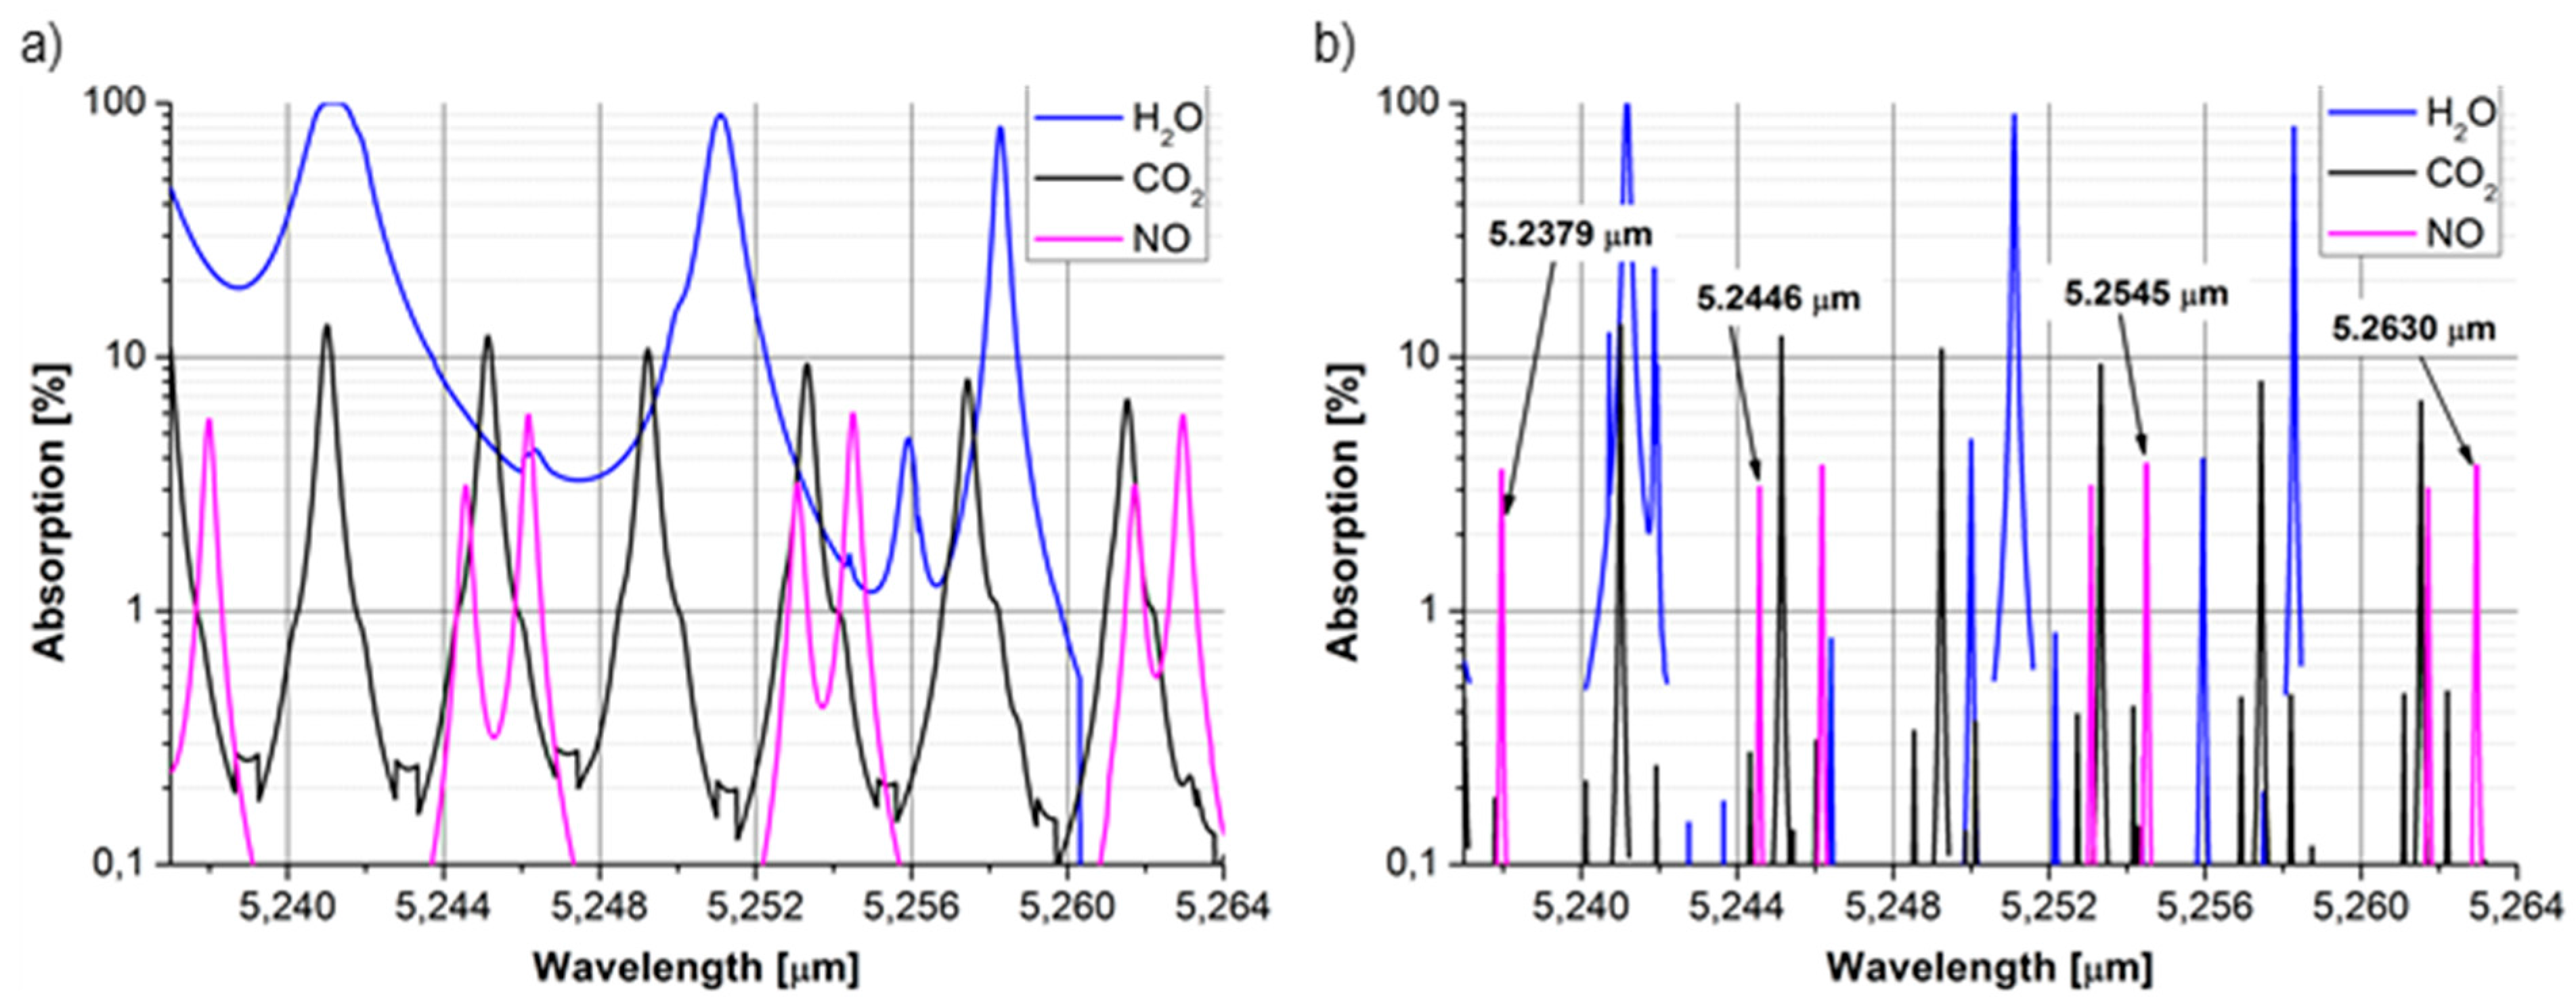
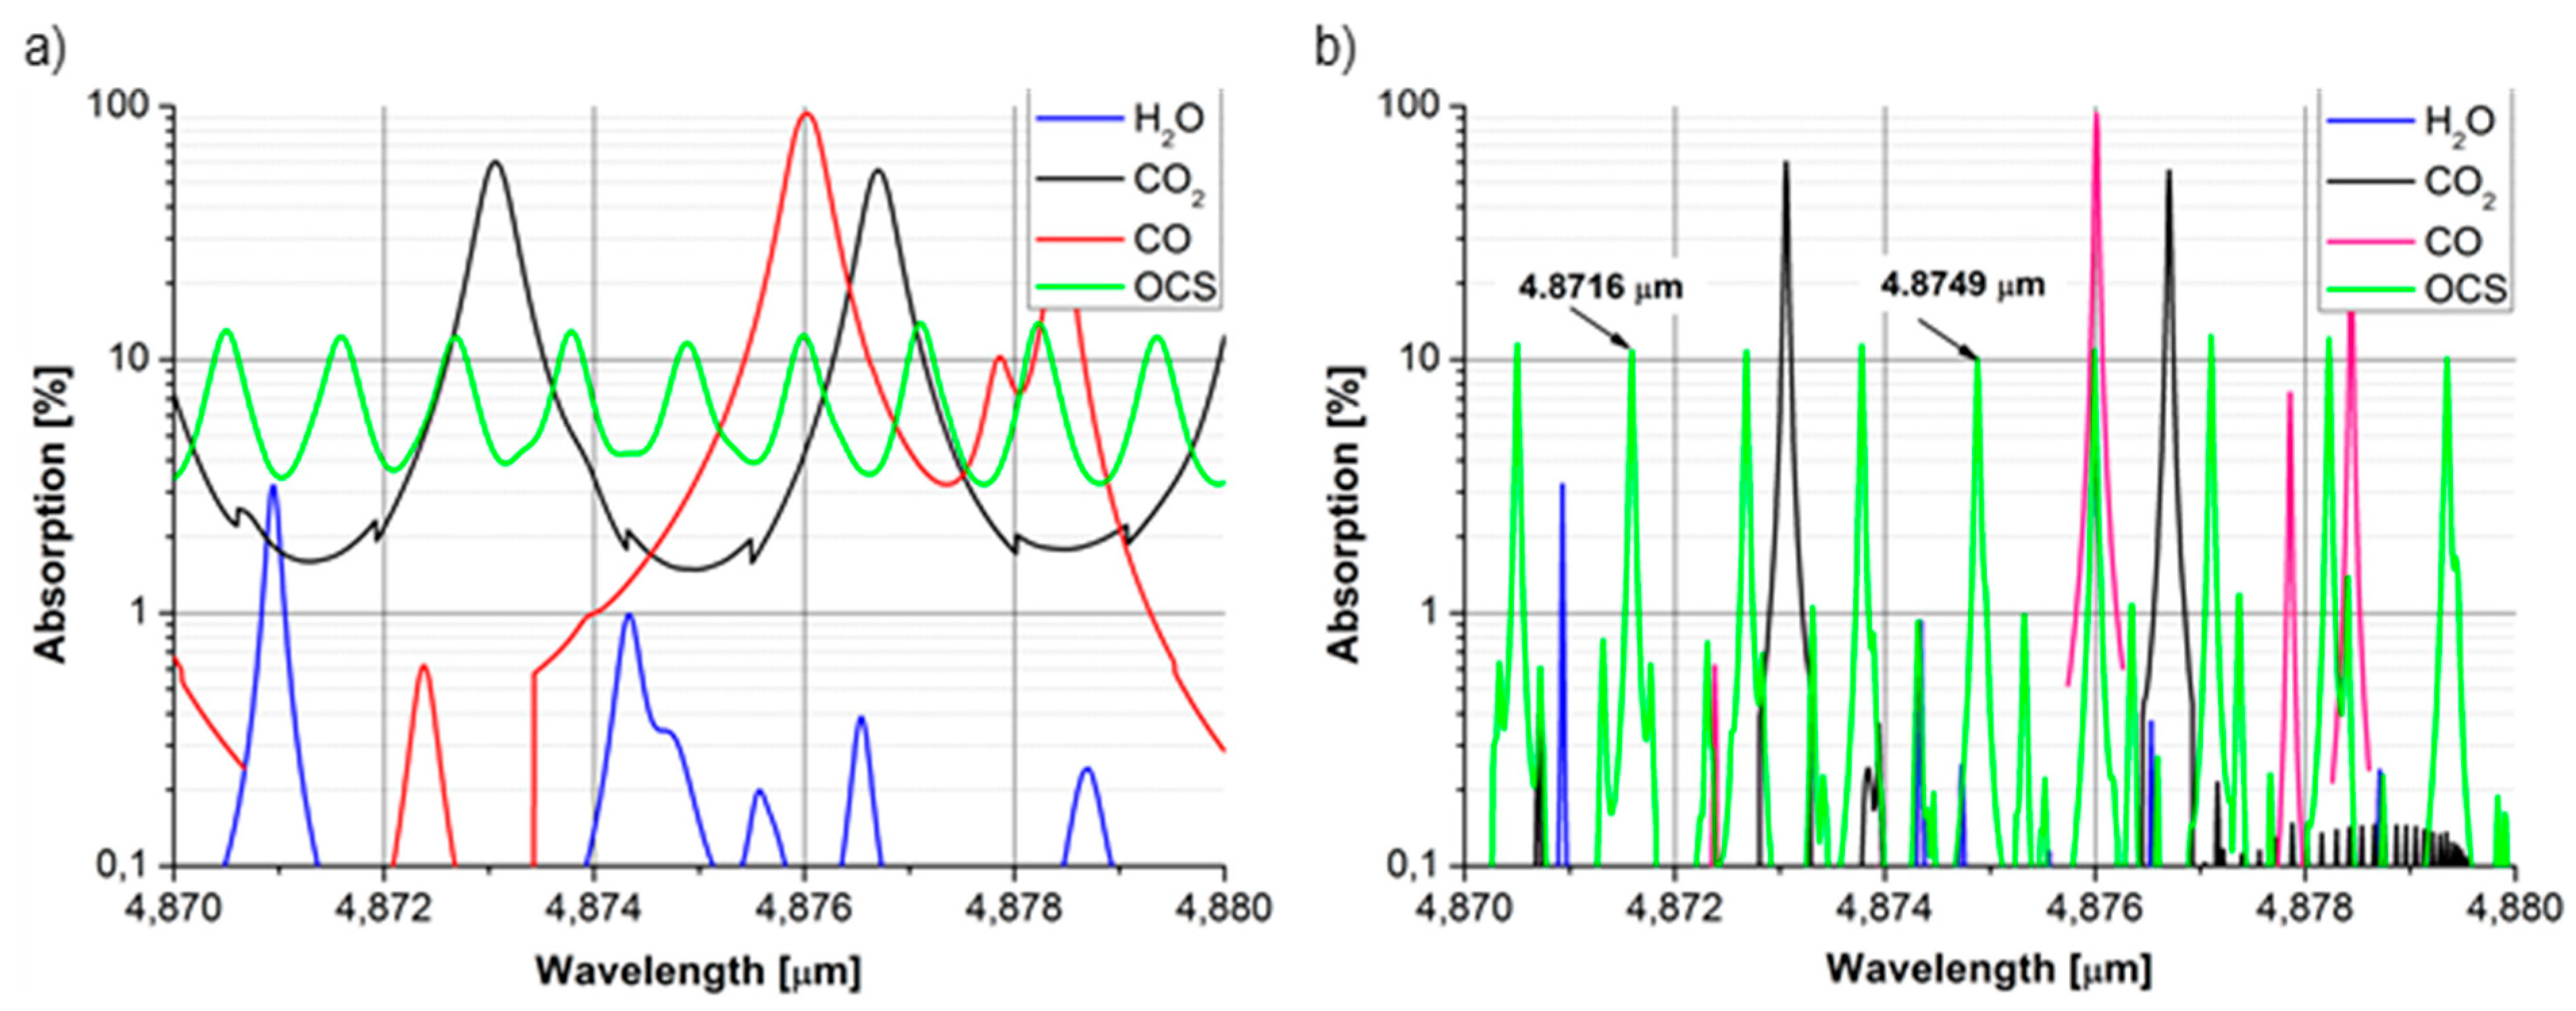
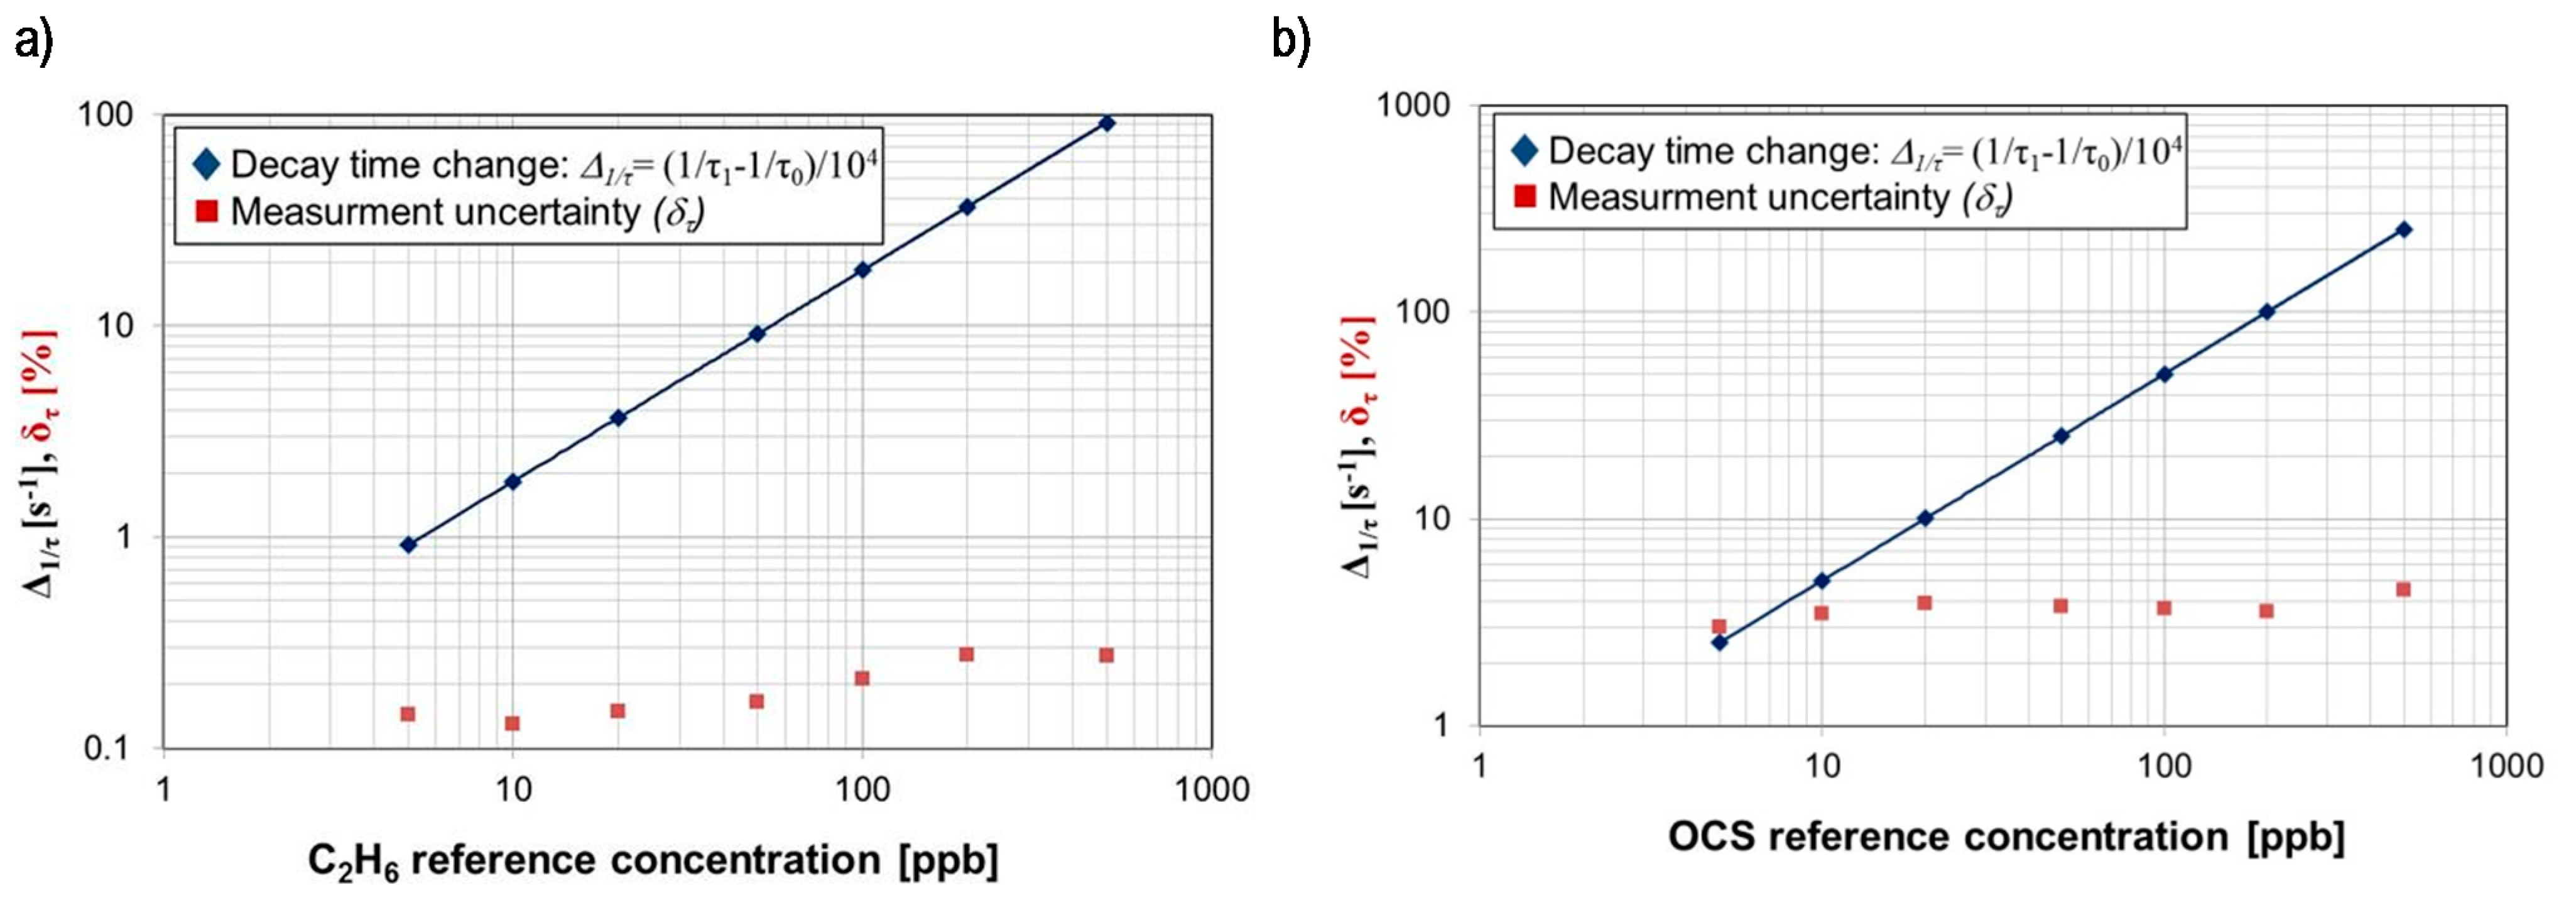
3.2. Carbonyl Sulphide
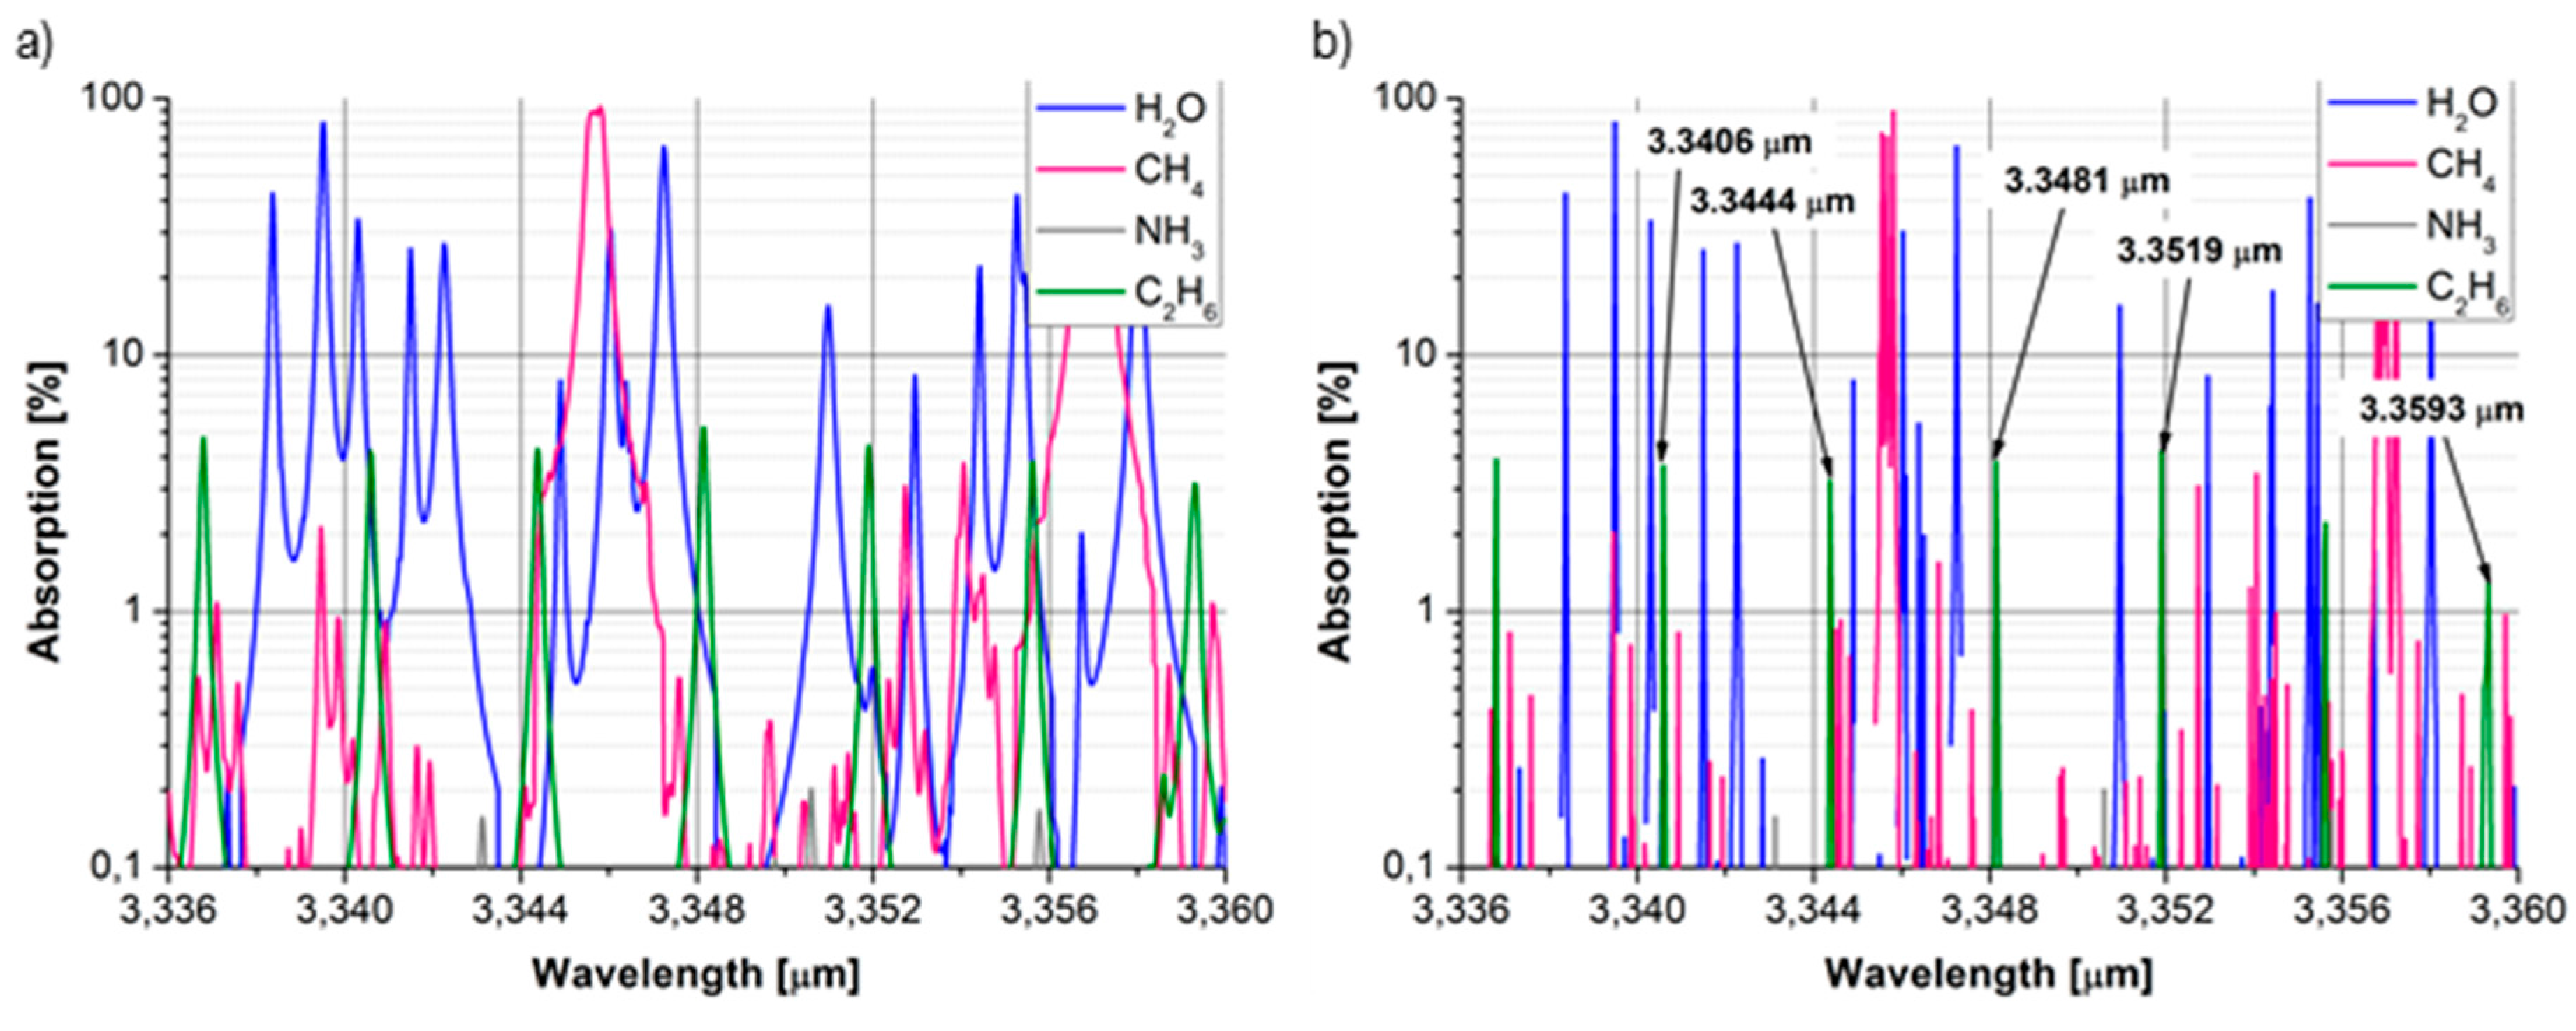
3.3. Ethane

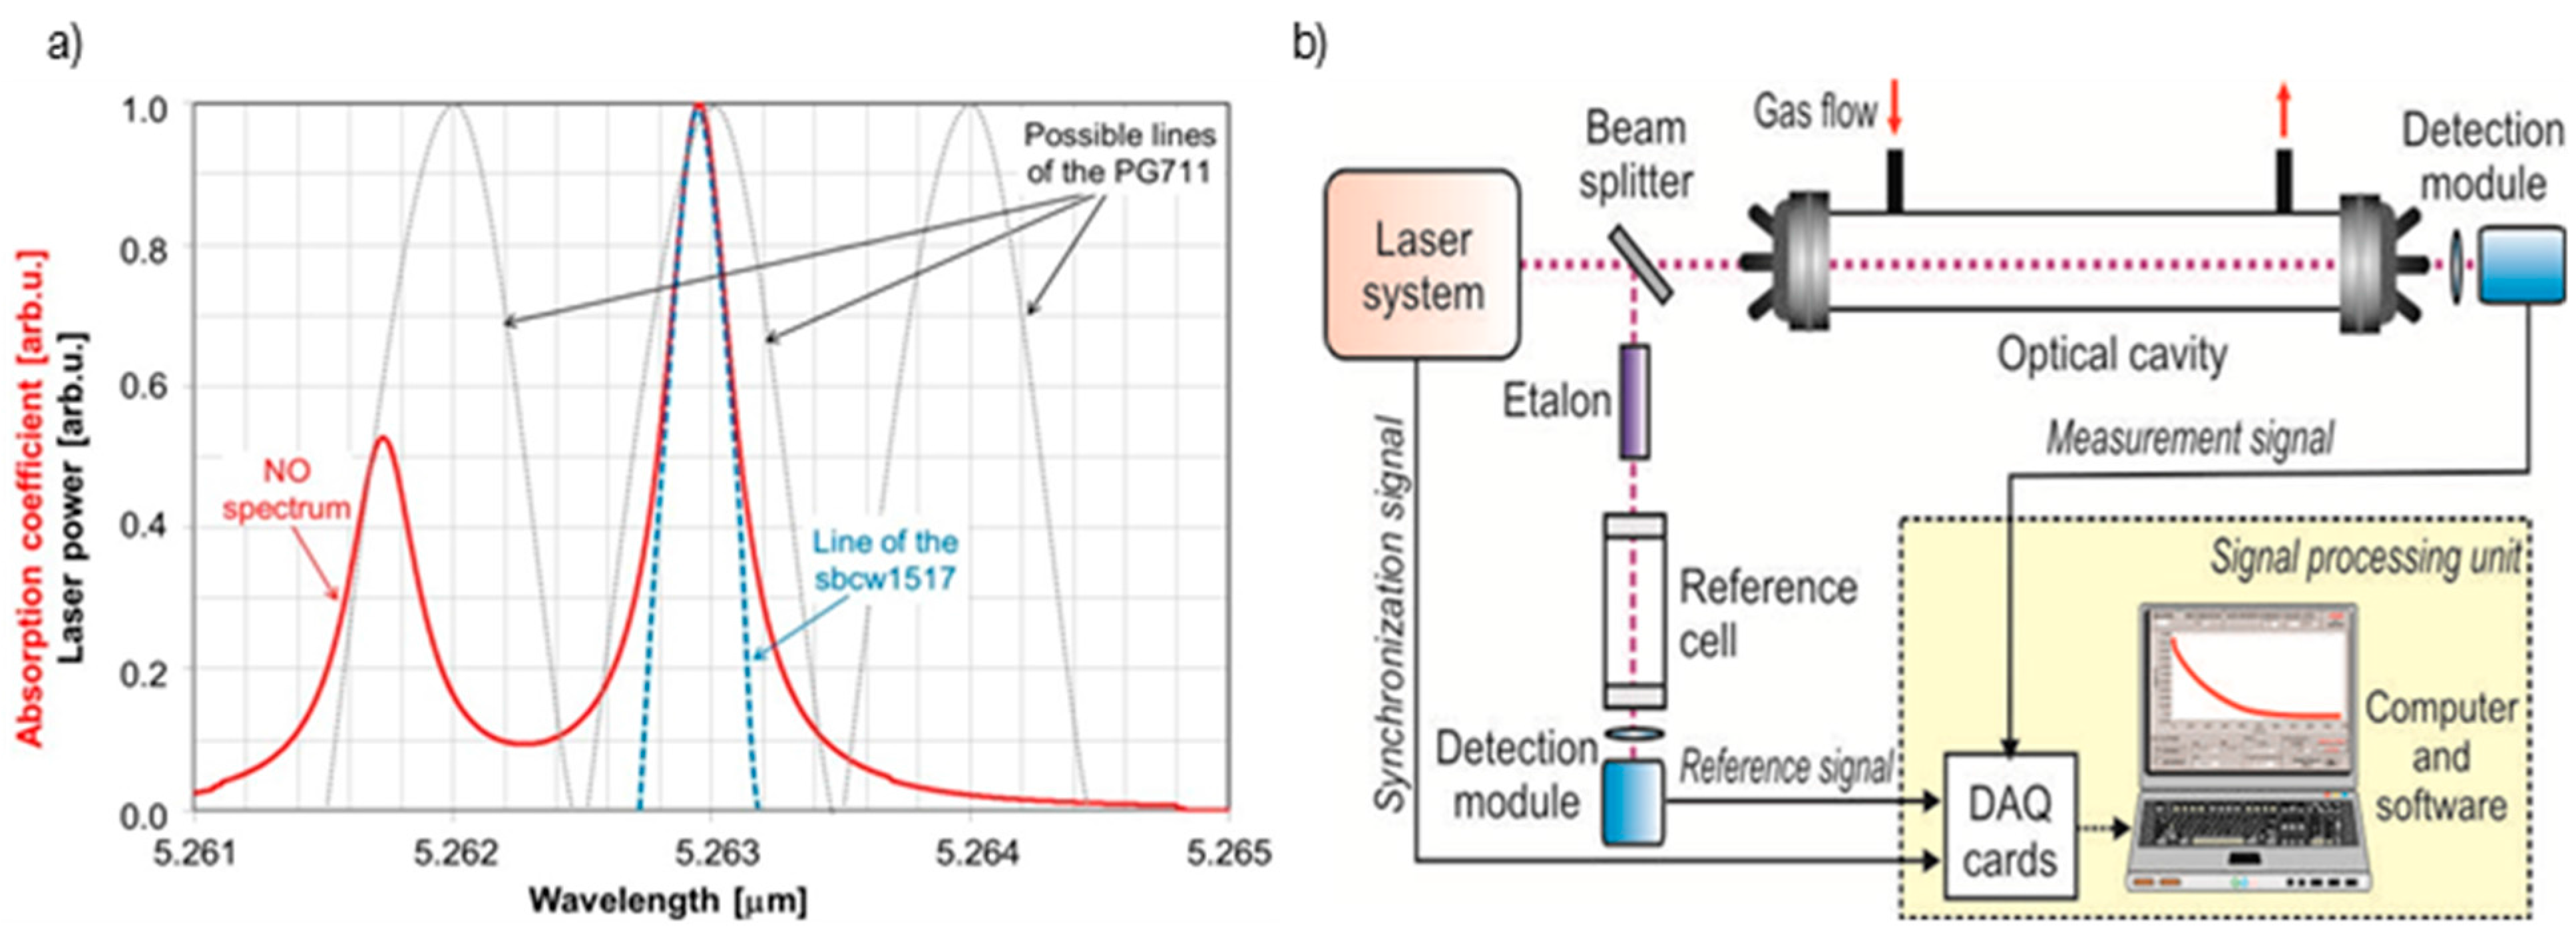
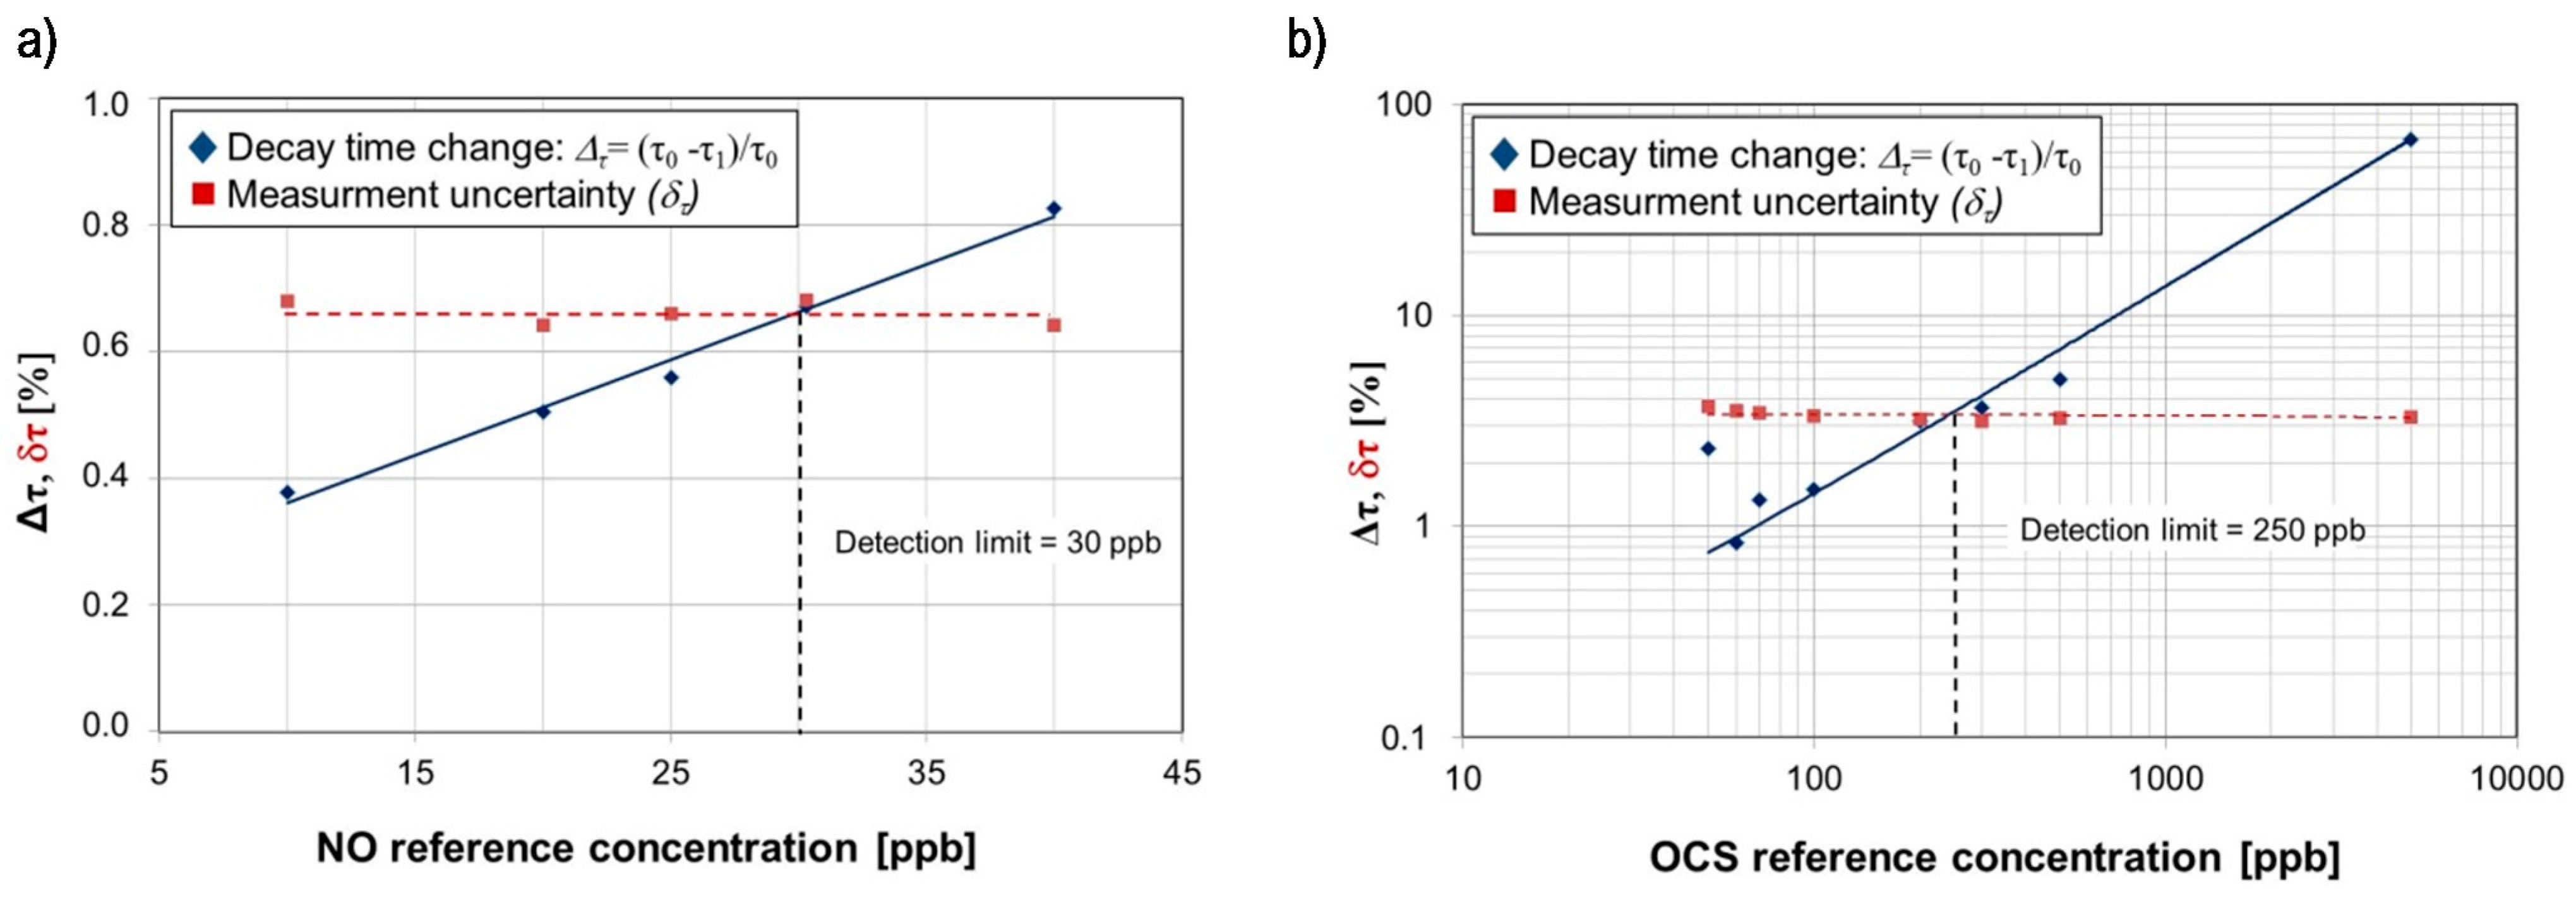
4. Experimental Results
| Lasing Wavelength | 5.2627 µm |
| Voltage supply | 10.452 V |
| Average current | 0.095 A |
| Laser temperature | 2.8 °C |
| Duty cycle | 40% (@1 kHz) |
| Beam diameter | 3 mm |
| Beam divergence | <3 mrad |

| Gas | Type of Permutation Tube | Achieved Concentrations | Comments |
|---|---|---|---|
| NO | 57SA 4316 | 1 ppb *–2 ppm ** | Refillable tube |
| OCS | ELSRT2W 45184 | 1 ppb *–270 ppb ** | Disposable tube |
| C2H6 | 57HA 4573 | 5 ppb *–6.9 ppm ** | Refillable tube |

| Wavelength [µm] | Biomarker | Detection Limit [ppb] | Uncertainty [%] | Type of Applied Laser |
|---|---|---|---|---|
| 5.2630 | NO | 30 | 0.7 | QCL |
| 5.2624 | OCS | 250 | 3.4 | QCL |
| 4.8716 | OCS | 0.9 | 2.6 | Tunable laser system |
| 3.3481 | C2H6 | 0.3 | 0.2 | Tunable laser system |
5. Conclusions
Acknowledgments
Conflicts of Interest
References
- McCurdy, M.R.; Bakhirkin, Y.; Wysocki, G.; Lewicki, R.; Tittel, F.K. Recent advances of laser-spectroscopy-based techniques for applications in breath analysis. J. Breath Res. 2007, 1. [Google Scholar] [CrossRef] [PubMed]
- Bögözi, T.; Popp, J.; Frosch, T. Fiber-enhanced Raman multi-gas spectroscopy: What is the potential of its application to breath analysis? Bioanalysis 2015, 7, 281–284. [Google Scholar] [CrossRef] [PubMed]
- Spagnolo, V.; Lewicki, R.; Dong, L.; Tittel, F.K. Quantum-cascade-laser-based optoacoustic detection for breath sensor applications. In Proceedings of the 2011 IEEE International Workshop on Medical Measurements and Applications Proceedings (MeMeA), Bari, Italy, 30–31 May 2011; pp. 332–335.
- Wang, C.; Sahay, P. Breath analysis using laser spectroscopic techniques: Breath biomarkers, spectral fingerprints, and detection limit. Sensors 2009, 9, 8230–8262. [Google Scholar] [CrossRef] [PubMed]
- Engel, G.S.; Moyer, E.J.; Keutsch, F.N.; Anderson, J.G. Innovations in cavity enhanced laser absorption spectroscopy: Using in situ measurements to probe the mechanisms driving climate change. In Proceedings of the NASA Earth Science Technology Conference (ESTC), College Park, MD, USA, 28–30 August 2001.
- Buszewski, B.; Grzywinski, D.; Ligor, T.; Stacewicz, T.; Bielecki, Z.; Wojtas, J. Detection of volatile organic compounds as biomarkers in breath analysis by different analytical techniques. Bioanalysis 2013, 5, 2287–2306. [Google Scholar] [CrossRef] [PubMed]
- Wojtas, J.; Bielecki, Z.; Stacewicz, T.; Mikolajczyk, J.; Nowakowski, M. Ultrasensitive laser spectroscopy for breath analysis. Opt. Electron. Rev. 2012, 20, 77–90. [Google Scholar] [CrossRef]
- American Thoracic Society; European Respiratory Society. ATS/ERS Recommendations for standardized procedures for the online and offline measurement of exhaled lower respiratory nitric oxide and nasal nitric oxide. Am. J. Respir. Crit. Care Med. 2005, 171, 912–930. [Google Scholar]
- Menzel, L.; Kosterev, A.A.; Curl, R.F.; Tittel, F.K.; Gmachl, C.; Capasso, F.; Sivco, D.L.; Baillargeon, J.N.; Hutchinson, A.L.; Cho, A.Y.; et al. Spectroscopic detection of biological NO with a quantum cascade laser. Appl. Phys. B 2001, 72, 859–863. [Google Scholar] [CrossRef] [PubMed]
- Smith, A.D.; Cowan, J.O.; Brassett, K.P.; Herbison, G.P.; Taylor, D.R. Use of exhaled nitric oxide measurements to guide treatment in chronic asthma. N. Engl. J. Med. 2005, 352, 2163–2173. [Google Scholar] [CrossRef] [PubMed]
- EPA 749-F-94–009a, Chemical Summary for Carbonyl Sulphide. Available online: http://www.epa.gov/chemfact/s_carbns.txt (accessed on 21 May 2015).
- Draft Toxicological Profile for Hydrogen Sulfide and Carbonyl Sulfide. Available online: http://www.atsdr.cdc.gov/toxprofiles/tp114.pdf (accessed on 21 May 2015).
- Sehnert, S.S.; Jiang, L.; Burdick, J.F.; Risby, T.H. Breath biomarkers for detection of human liver diseases: A preliminary study. Biomarkers 2002, 7, 174–187. [Google Scholar] [CrossRef] [PubMed]
- Studer, S.M.; Orens, J.B.; Rosas, I.; Krishnan, J.A.; Cope, K.A.; Yang, S.; Conte, J.V.; Becker, P.B.; Risby, T.H. Patterns and significance of exhaled-breath biomarkers in lung transplant rejection with acute allograft rejection. J. Heart Lung Transplant. 2001, 20, 1158–1166. [Google Scholar] [CrossRef]
- Neri, G.; Bonavita, A.; Ipsale, S.; Micali, G.; Rizzo, G.; Donato, N. Carbonyl sulphide (COS) monitoring on MOS sensors for biomedical applications. In Proceedings of the IEEE International Symposium on Industrial Electronics, Vigo, Spain, 4–7 June 2007; pp. 2776–2781.
- Bennett, L.; Ciaffoni, L.; Denzer, W.; Hancock, G.; Lunn, A.D.; Peverall, R.; Praun, S.; Ritchie, G.A. Achemometric study on human breath mass spectra for biomarker identification in cystic fibrosis. J. Breath Res. 2009, 3. [Google Scholar] [CrossRef] [PubMed]
- Paredi, P.; Kharitonov, S.A.; Barnes, P.J. Elevation of exhaled ethane concentration in asthma. Am. J. Respir. Crit. Care Med. 2000, 162, 1450–1454. [Google Scholar] [CrossRef] [PubMed]
- Olopade, C.O.; Zakkar, M.; Swedler, W.I.; Rubinstein, I. Exhaled pentane levels in acute asthma. Chest 1997, 111, 862–865. [Google Scholar] [CrossRef] [PubMed]
- Paredi, P.; Kharitonov, S.A.; Leak, D.; Ward, S.; Cramer, D.; Barnes, P.J. Exhaled ethane, a marker of lipid peroxidation, is elevated in chronic obstructive pulmonary disease. Am. J. Respir. Crit. Care Med. 2000, 162, 369–373. [Google Scholar] [CrossRef] [PubMed]
- Schubert, J.K.; Miekisch, W.; Geiger, K. Exhaled breath markers in acute respiratory distress syndrome. In Disease Markers in Exhaled Breath; Marczin, N., Kharitonov, S.A., Yacoub, S.M.H., Barnes, P.J., Eds.; CRC Press: New York, NY, USA, 2003; Volume 170, pp. 363–380. [Google Scholar]
- Hietanen, E.; Bartsch, H.; Bereziat, J.C.; Camus, A.M.; McClinton, S.; Eremin, O.; Davidson, L.; Boyle, P. Diet and oxidative stress in breast, colon and prostate cancer patients: A case-control study. Eur. J. Clin. Nutr. 1994, 48, 575–586. [Google Scholar] [PubMed]
- Skeldon, K.D.; McMillan, L.C.; Wyse, C.A.; Monk, S.D.; Gibson, G.; Patterson, C.; France, T.; Longbottom, C.; Padgett, M.J. Application of laser spectroscopy for measurement of exhaled ethane in patients with lung cancer. Resp. Med. 2006, 100, 300–306. [Google Scholar] [CrossRef] [PubMed]
- Sobotka, P.A.; Gupta, D.K.; Lansky, D.M.; Costanzo, M.R.; Zarling, E.J. Breath pentane is a marker of acute cardiac allograft rejection. J. Heart Lung Transplant. 1994, 13, 224–229. [Google Scholar] [PubMed]
- Kneepkens, C.M.; Lepage, G.; Roy, C.C. The potential of the hydrocarbon breath test as a measure of lipid peroxidation. Free Radic. Biol. Med. 1994, 17, 127–160. [Google Scholar] [CrossRef]
- Zhou, M.; Liu, Y.; Duan, Y. Breath biomarkers in diagnosis of pulmonary diseases. Clin. Chim. Acta 2012, 413, 1770–1780. [Google Scholar] [CrossRef] [PubMed]
- Springfield, J.R.; Levitt, M.D. Pitfalls in the use of breath pentane measurements to assess lipid peroxidation. J. Lipid Res. 1994, 35, 1497–1504. [Google Scholar] [PubMed]
- Knutson, M.D.; Handelman, G.J.; Viteri, F.E. Methods for Measuring Ethane and Pentane in Expired Air from Rats and Humans. Free Radic. Biol. Med. 2000, 28, 514–519. [Google Scholar] [CrossRef]
- Phillips, M.; Cataneo, R.N.; Cummin, A.R.C.; Gagliardi, A.J.; Gleeson, K.; Greenberg, J.; Maxfield, R.A.; Rom, W.N. Detection of lung cancer with volatile markers in the breath. Chest 2003, 123, 2115–2123. [Google Scholar] [CrossRef] [PubMed]
- Gordon, S.M.; Szidon, J.P.; Krotoszynski, B.K.; Gibbons, R.D.; O’Neill, H.J. Volatile organic compounds in exhaled air from patients with lung cancer. Clin. Chem. 1985, 31, 1278–1282. [Google Scholar] [PubMed]
- Miekisch, W.; Schubert, J.K.; Noeldge-Schomburg, G.F.E. Diagnostic potential of breath analysis—focus on volatile organic compounds. Clin. Chim. Acta 2004, 347, 25–39. [Google Scholar] [CrossRef] [PubMed]
- Tombez, L.; Schilt, S.; di Francesco, J.; di Domenico, G.; Hofstetter, D.; Thomann, P. Linewidth of a quantum cascade laser assessed from its frequency noise spectrum and impact of the current driver. Appl. Phys. B Lasers Opt. 2012, 109, 407–414. [Google Scholar] [CrossRef]
- Stacewicz, T.; Wojtas, J.; Bielecki, Z.; Nowakowski, M.; Mikolajczyk, J.; Medrzycki, R.; Rutecka, B. Cavity Ring Down Spectroscopy: detection of trace amounts of matter. Opto-Electron. Rev. 2012, 20, 34–41. [Google Scholar] [CrossRef]
- Gawron, W.; Bielecki, Z.; Wojtas, J.; Stanaszek, D.; Lach, J.; Fimiarz, M. Infrared detection module for optoelectronic sensors. Proc. SPIE 2012, 8353. [Google Scholar] [CrossRef]
- Berden, G.; Engeln, R. Cavity Ring-Down Spectroscopy: Techniques and Applications; John Wiley & Sons: Chichester, West Sussex, UK, 2009. [Google Scholar]
© 2015 by the authors; licensee MDPI, Basel, Switzerland. This article is an open access article distributed under the terms and conditions of the Creative Commons Attribution license (http://creativecommons.org/licenses/by/4.0/).
Share and Cite
Wojtas, J. Application of Cavity Enhanced Absorption Spectroscopy to the Detection of Nitric Oxide, Carbonyl Sulphide, and Ethane—Breath Biomarkers of Serious Diseases. Sensors 2015, 15, 14356-14369. https://doi.org/10.3390/s150614356
Wojtas J. Application of Cavity Enhanced Absorption Spectroscopy to the Detection of Nitric Oxide, Carbonyl Sulphide, and Ethane—Breath Biomarkers of Serious Diseases. Sensors. 2015; 15(6):14356-14369. https://doi.org/10.3390/s150614356
Chicago/Turabian StyleWojtas, Jacek. 2015. "Application of Cavity Enhanced Absorption Spectroscopy to the Detection of Nitric Oxide, Carbonyl Sulphide, and Ethane—Breath Biomarkers of Serious Diseases" Sensors 15, no. 6: 14356-14369. https://doi.org/10.3390/s150614356
APA StyleWojtas, J. (2015). Application of Cavity Enhanced Absorption Spectroscopy to the Detection of Nitric Oxide, Carbonyl Sulphide, and Ethane—Breath Biomarkers of Serious Diseases. Sensors, 15(6), 14356-14369. https://doi.org/10.3390/s150614356