
Optimal Self-Tuning PID Controller Based on Low Power Consumption for a Server Fan Cooling System

Abstract
:1. Introduction
2. Description and Problem Formulation
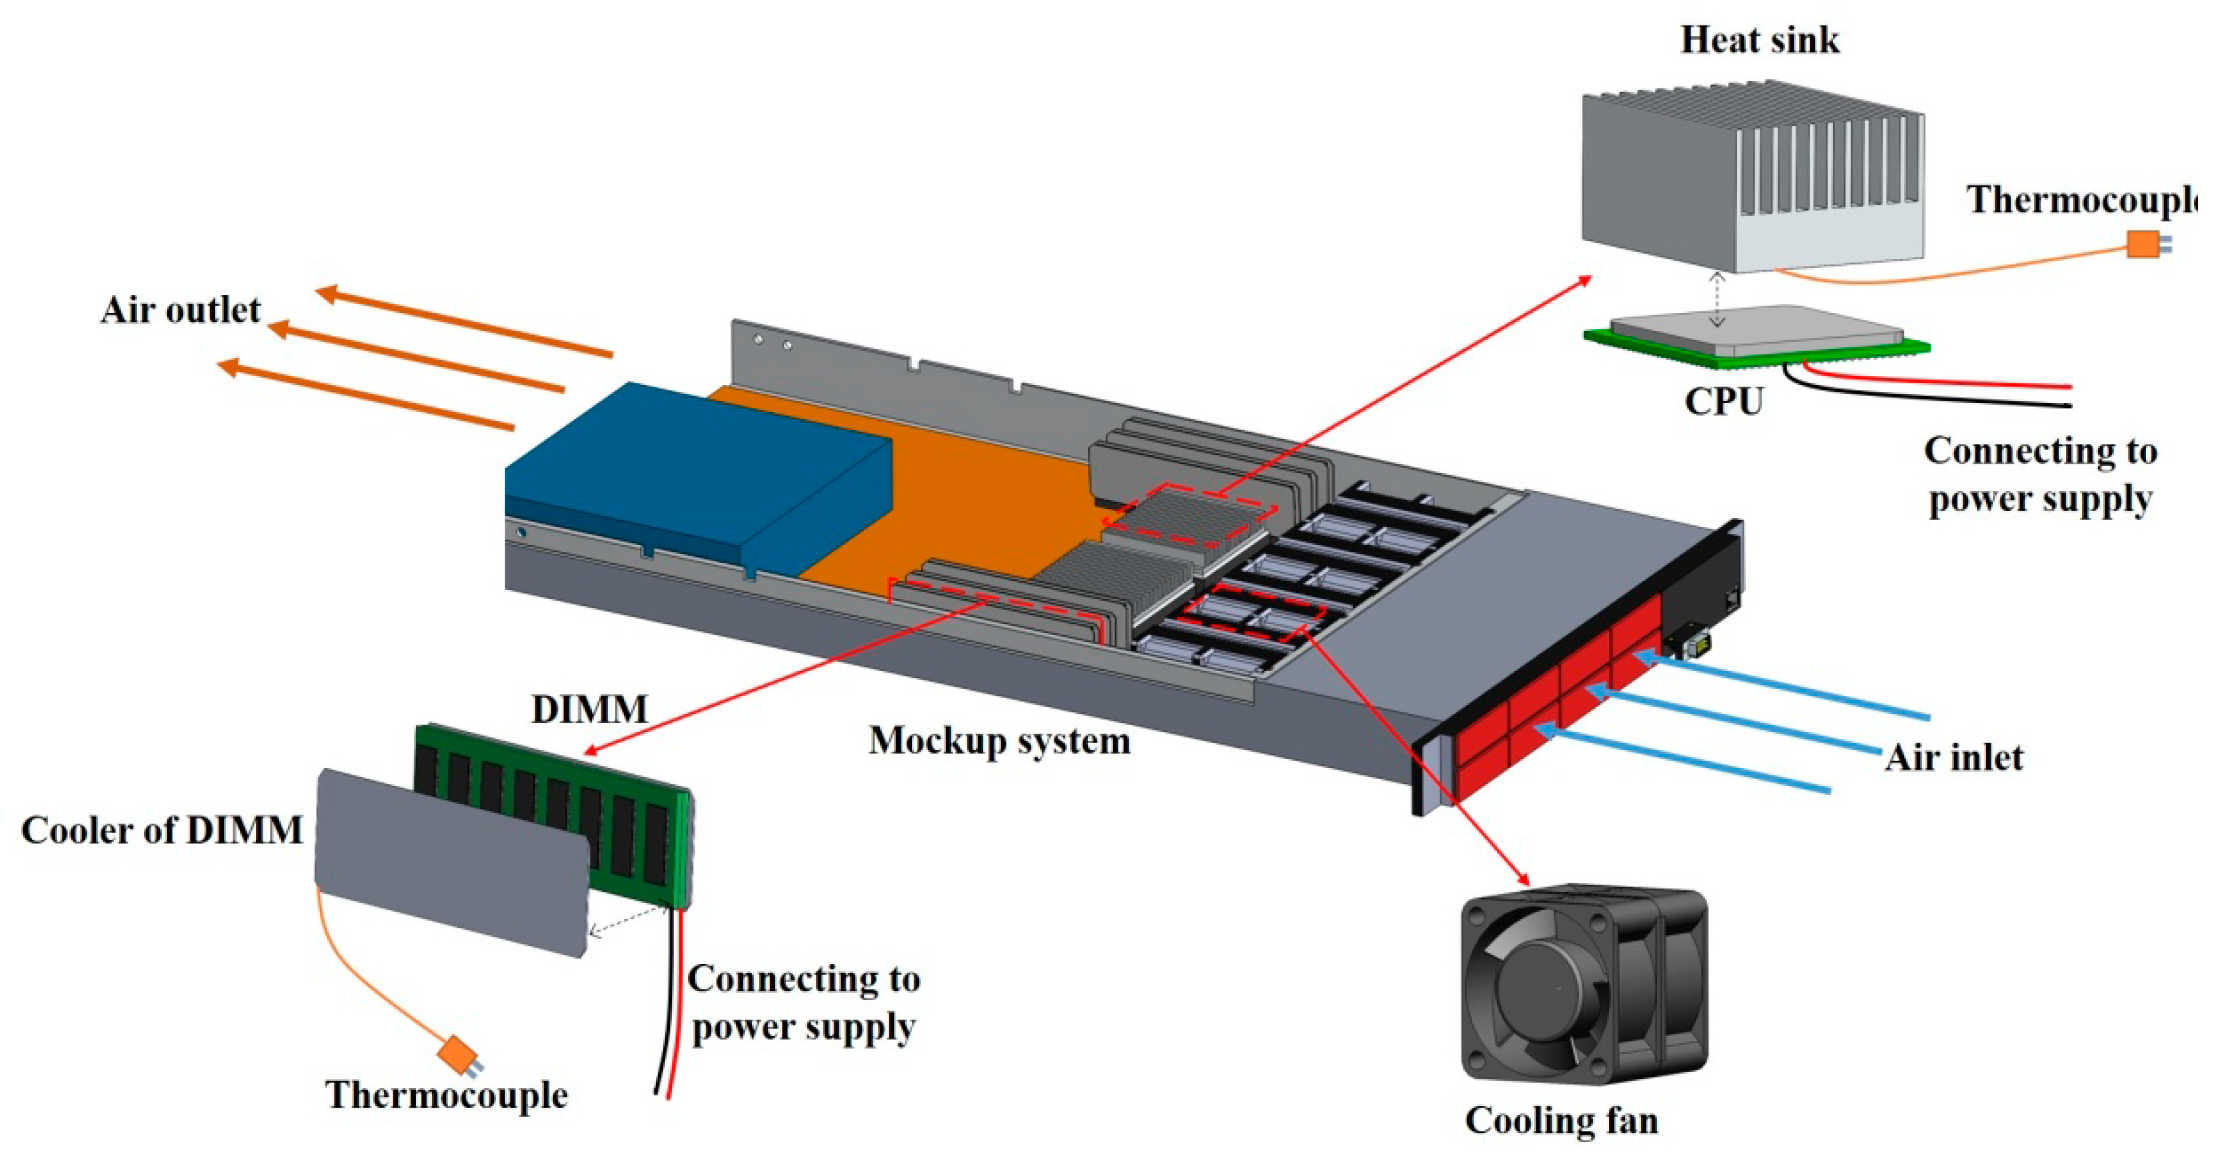
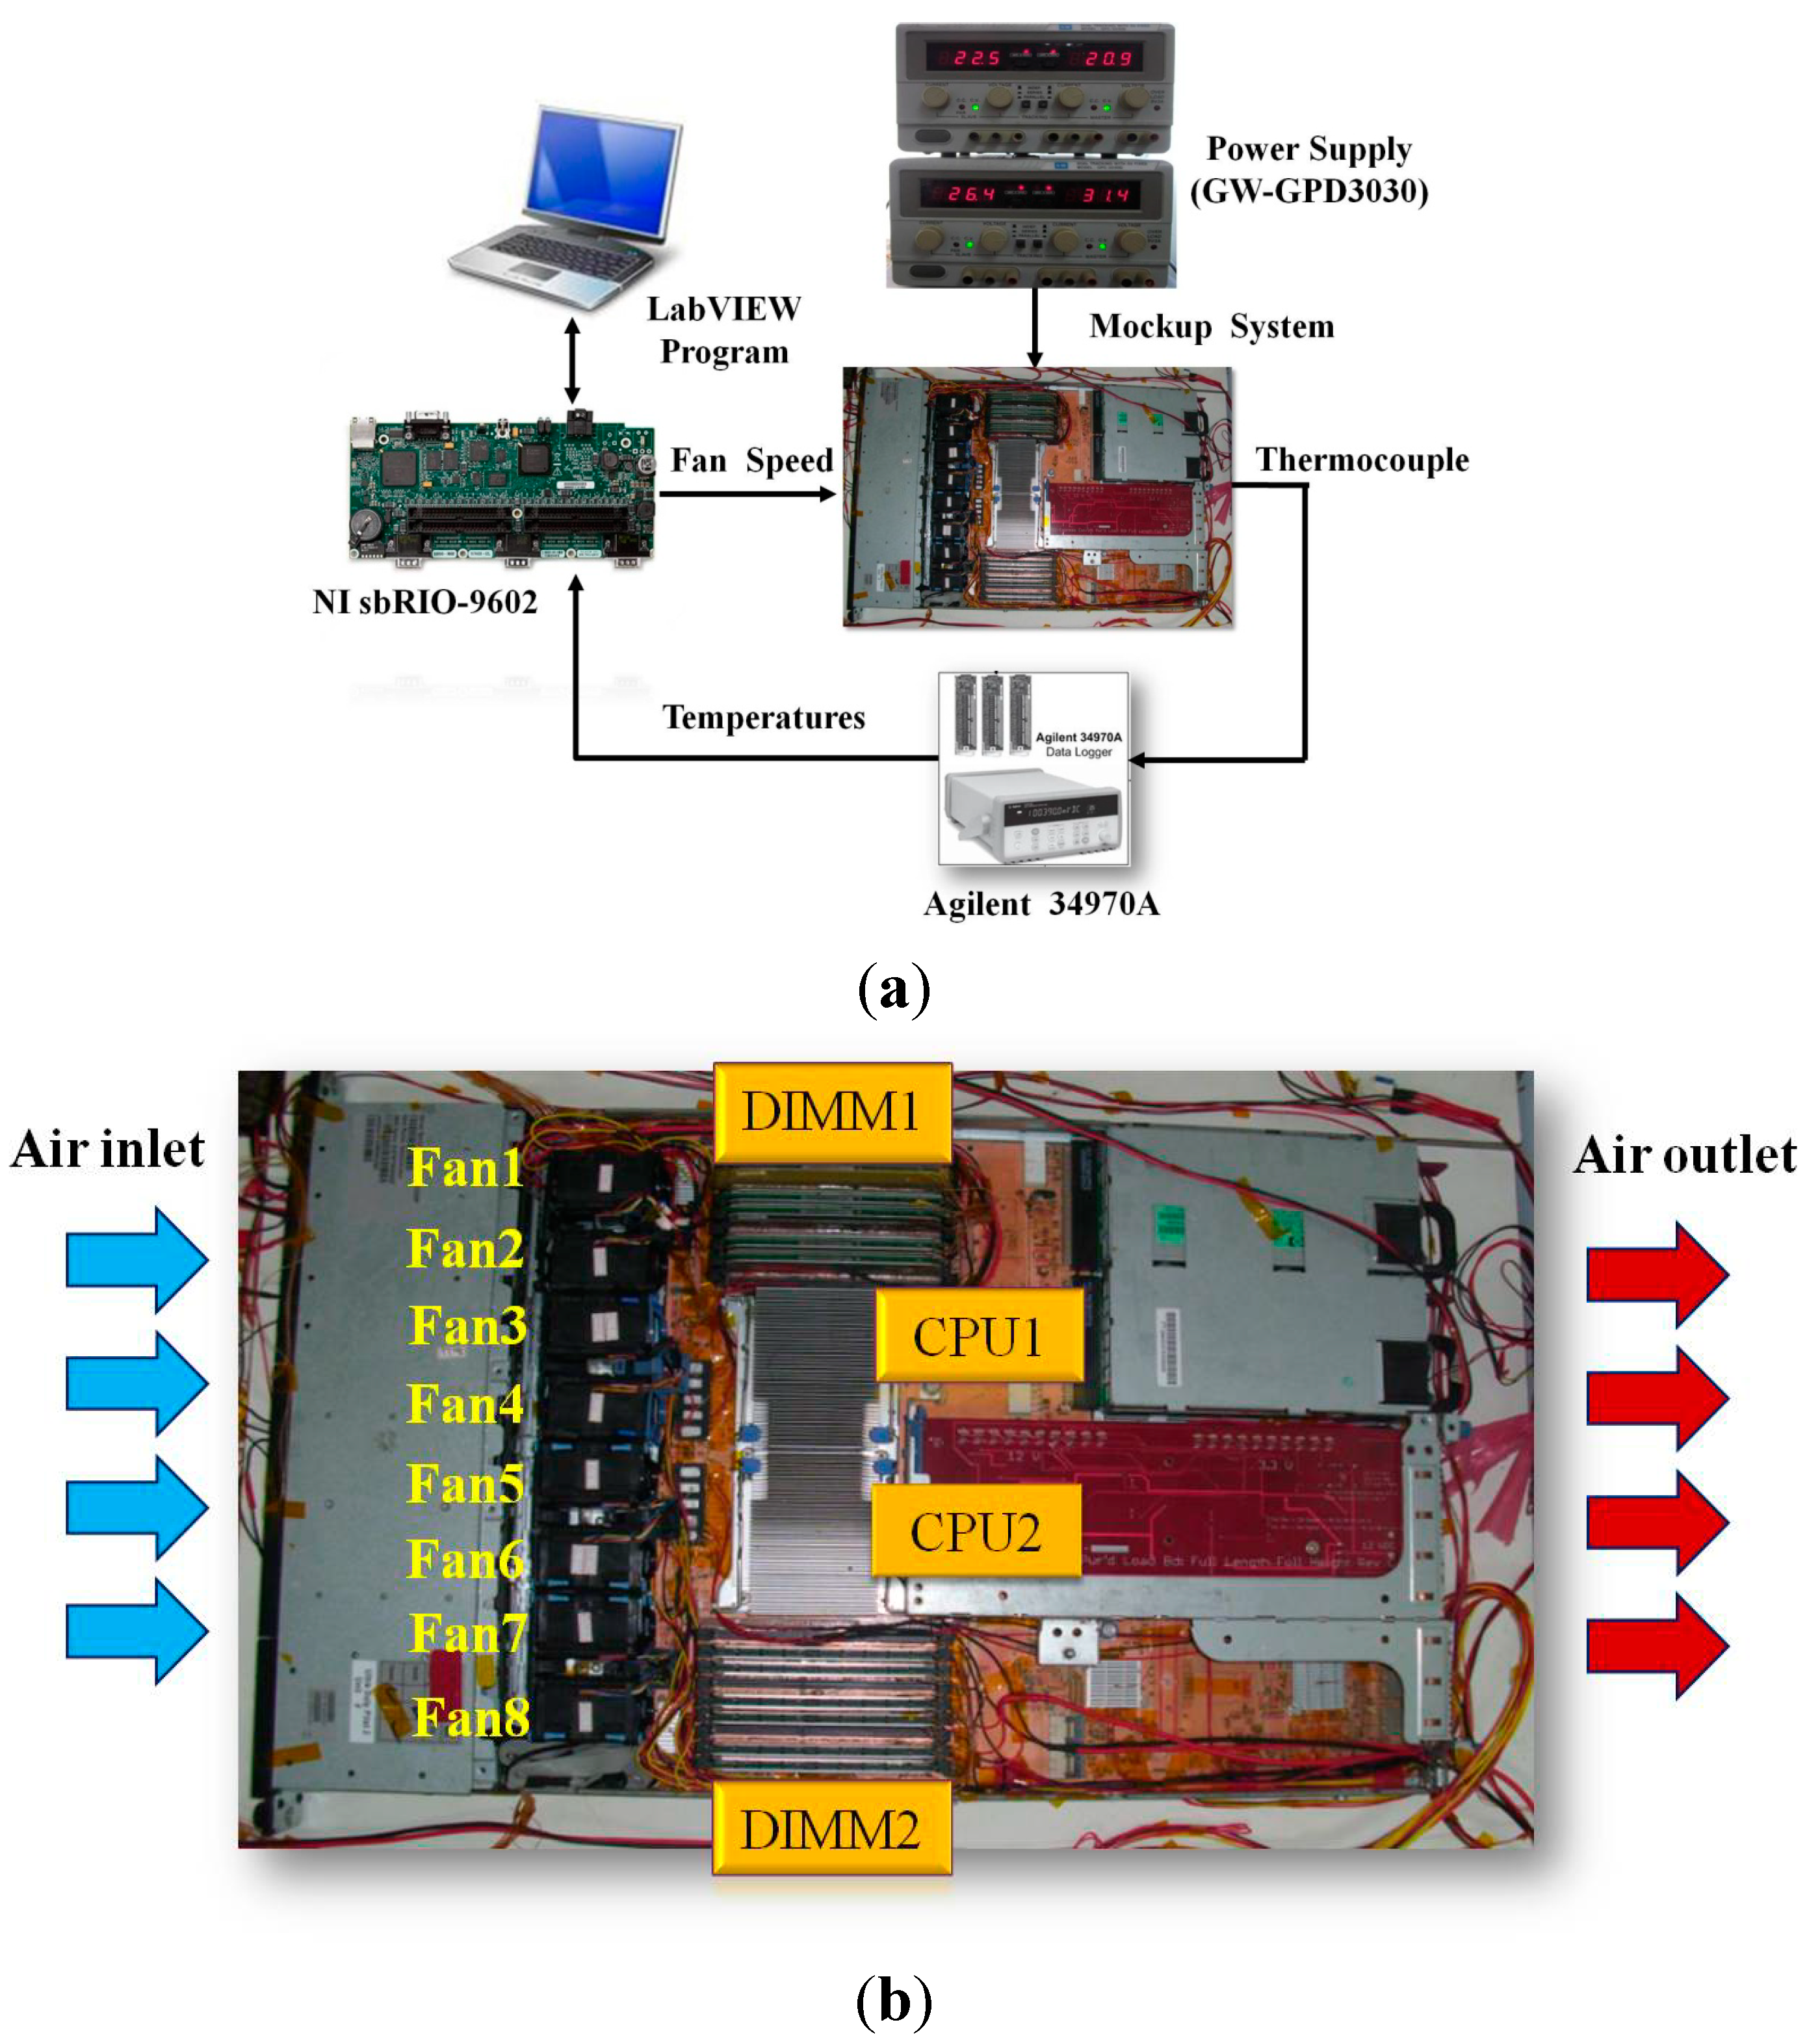
2.1. Server Mockup System
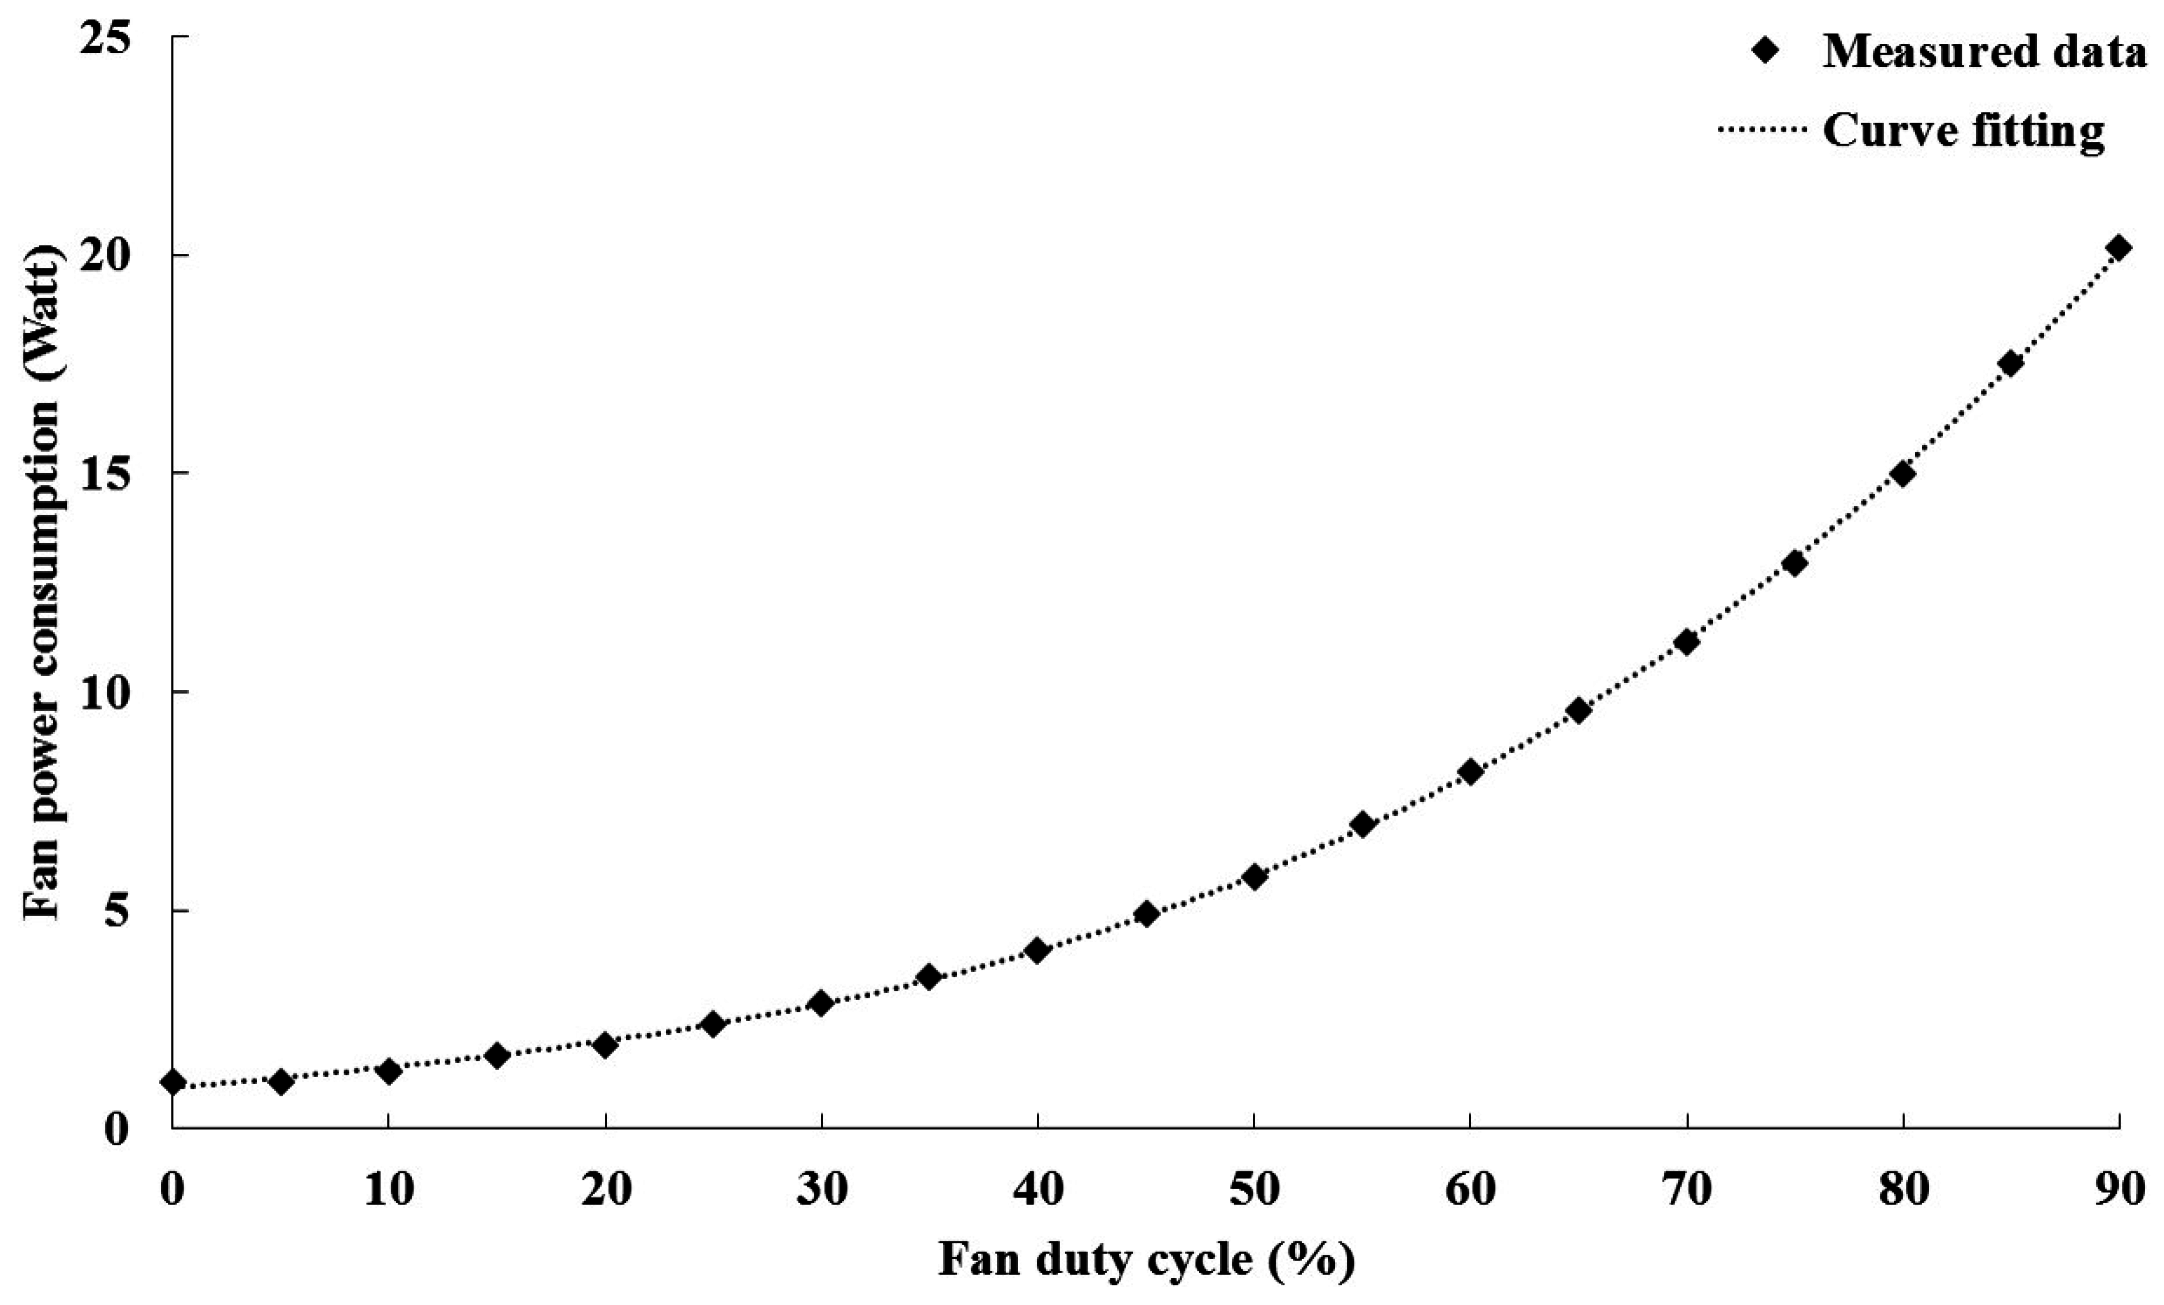
2.2. Problem Formulation
- P = power, ft-lb/min
- F = rotational speed, rpm

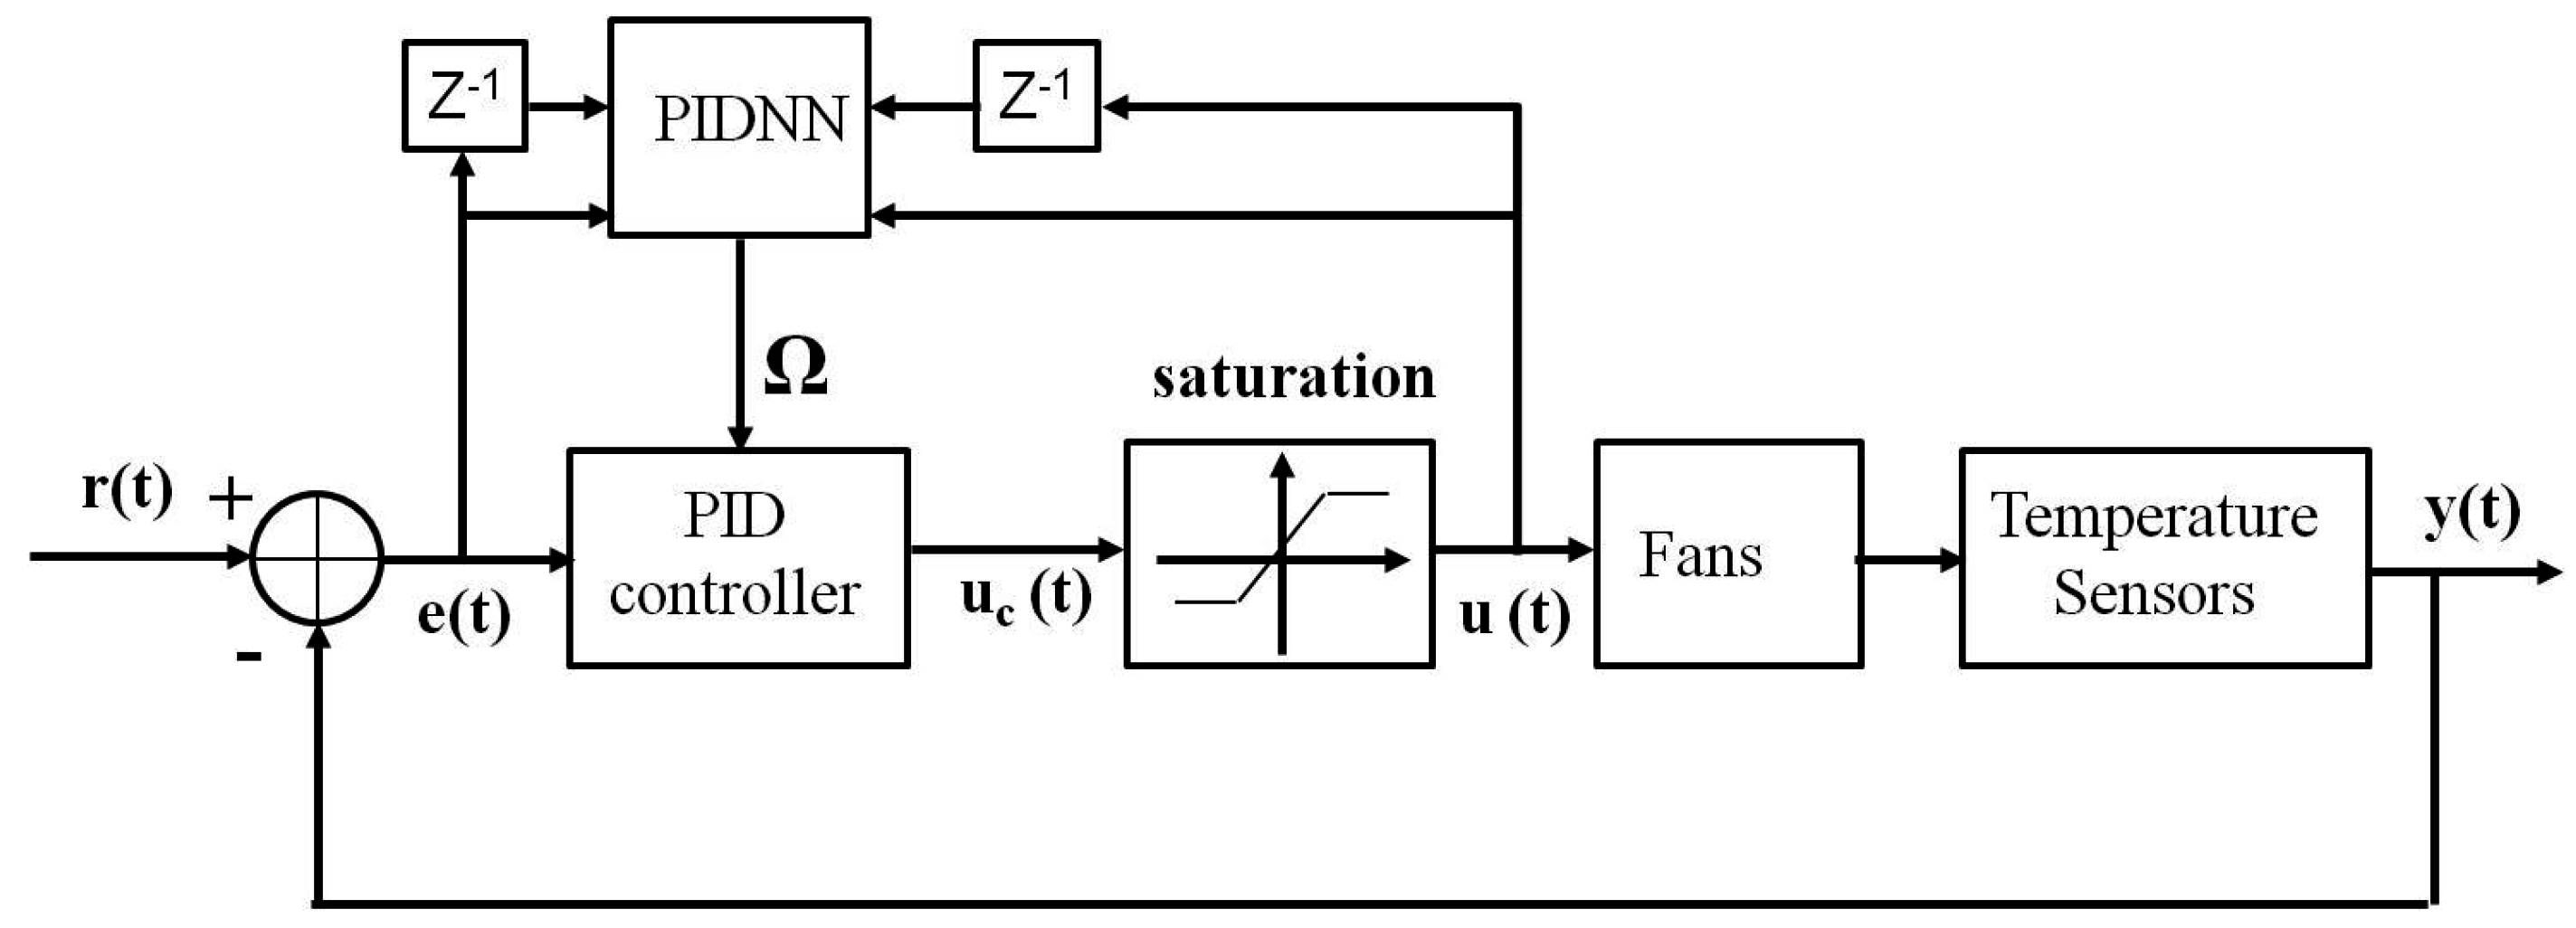
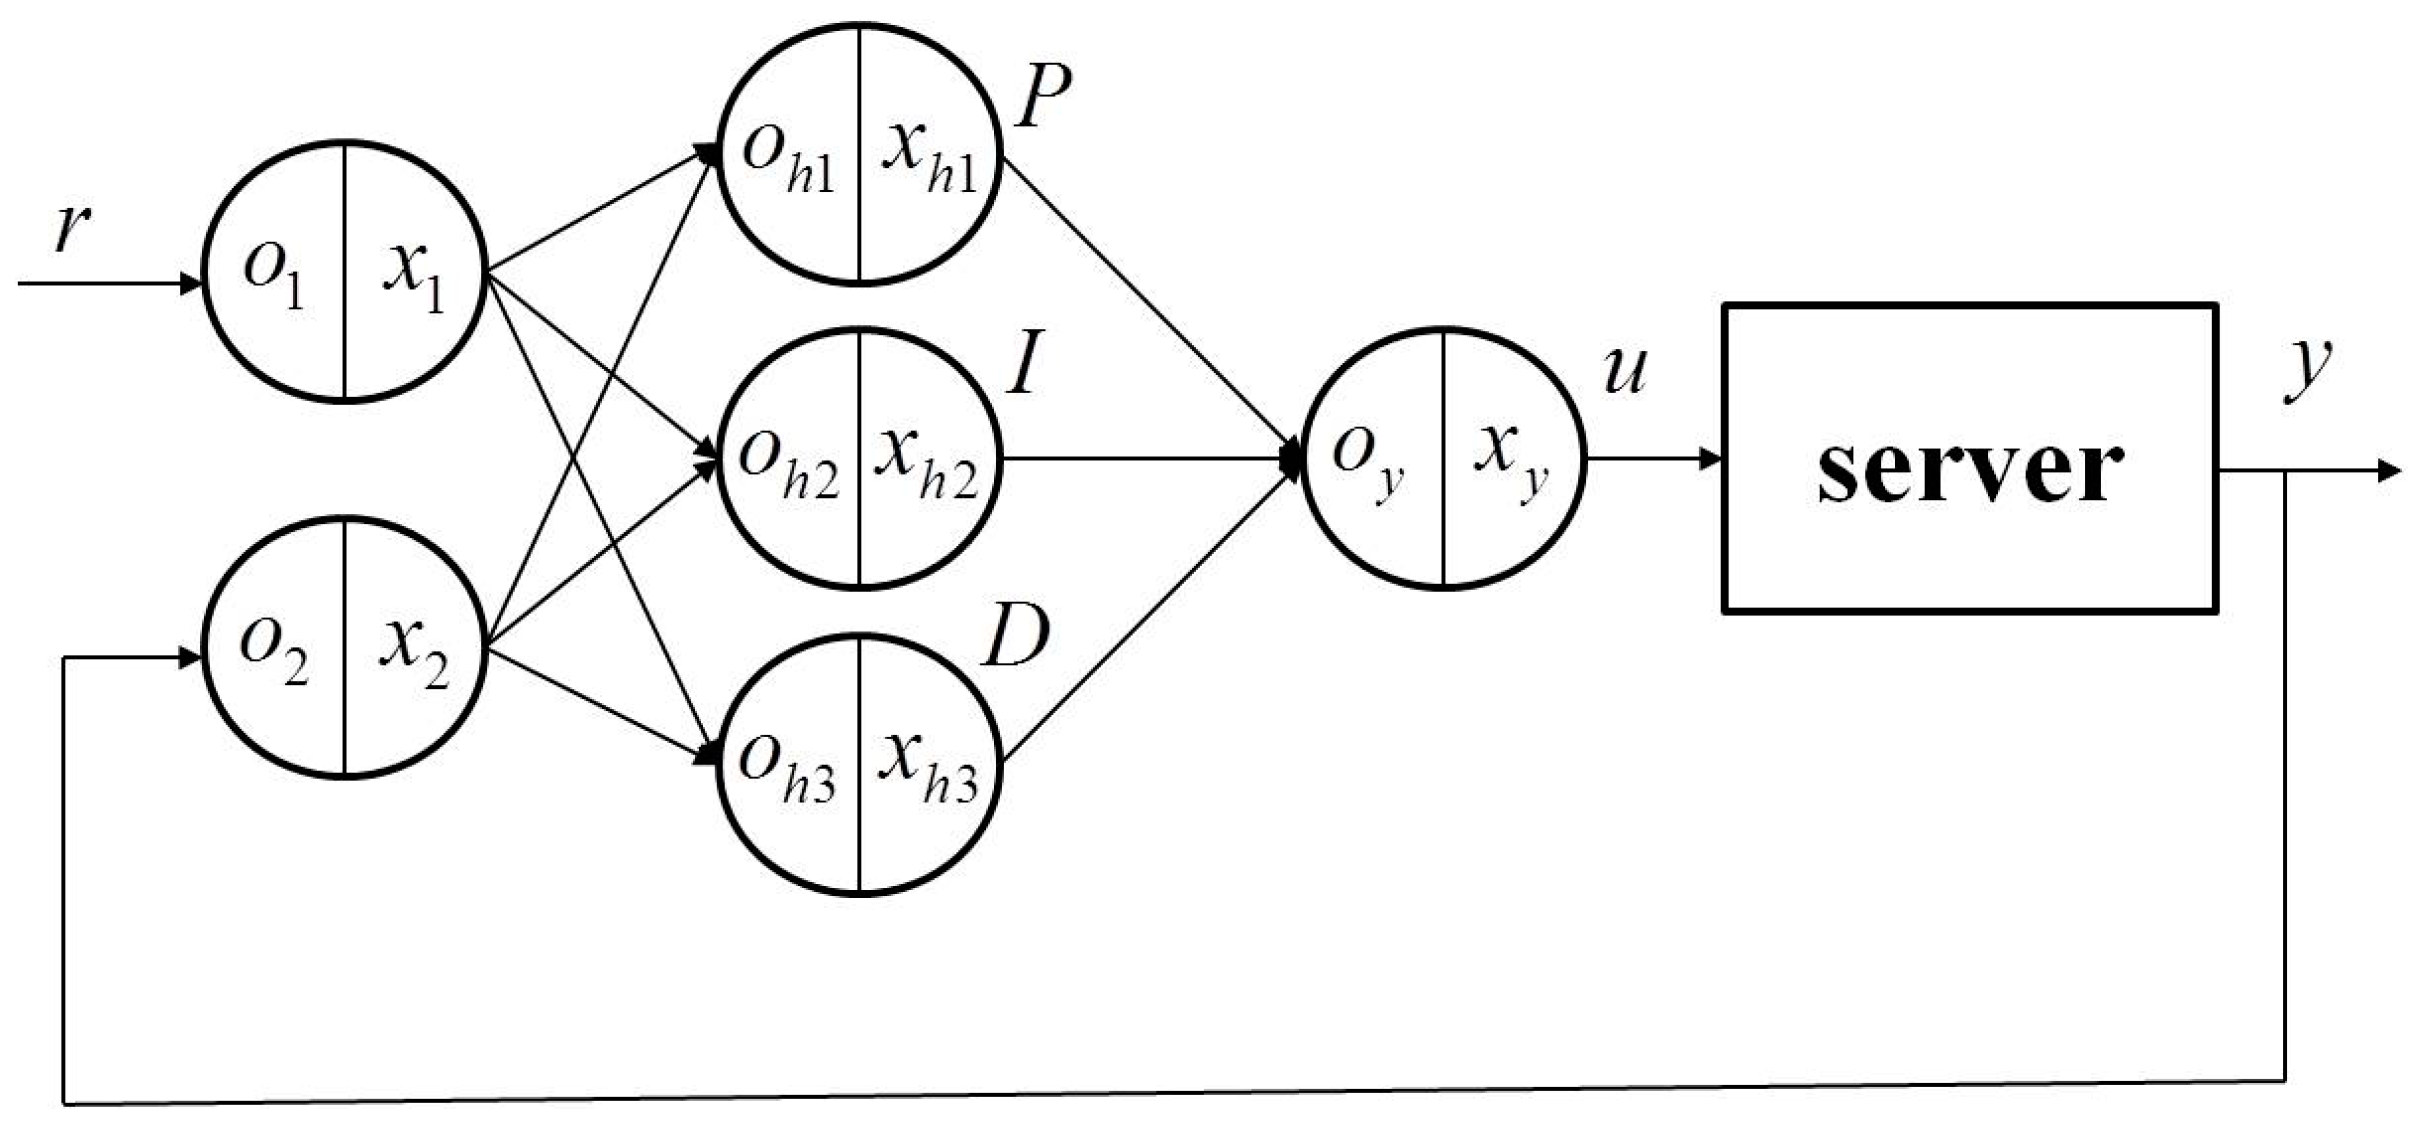
3. Design of the Optimal Self-Tuning PID Controller for the Server Fan Cooling System
- r(t): Temperature set-points
- y(t): Output of temperature sensors
- e(t): Errors of the output temperatures and set-points
- u(t): fan speed
- Ω = [PID]: PID control gains

3.1. PID Controller
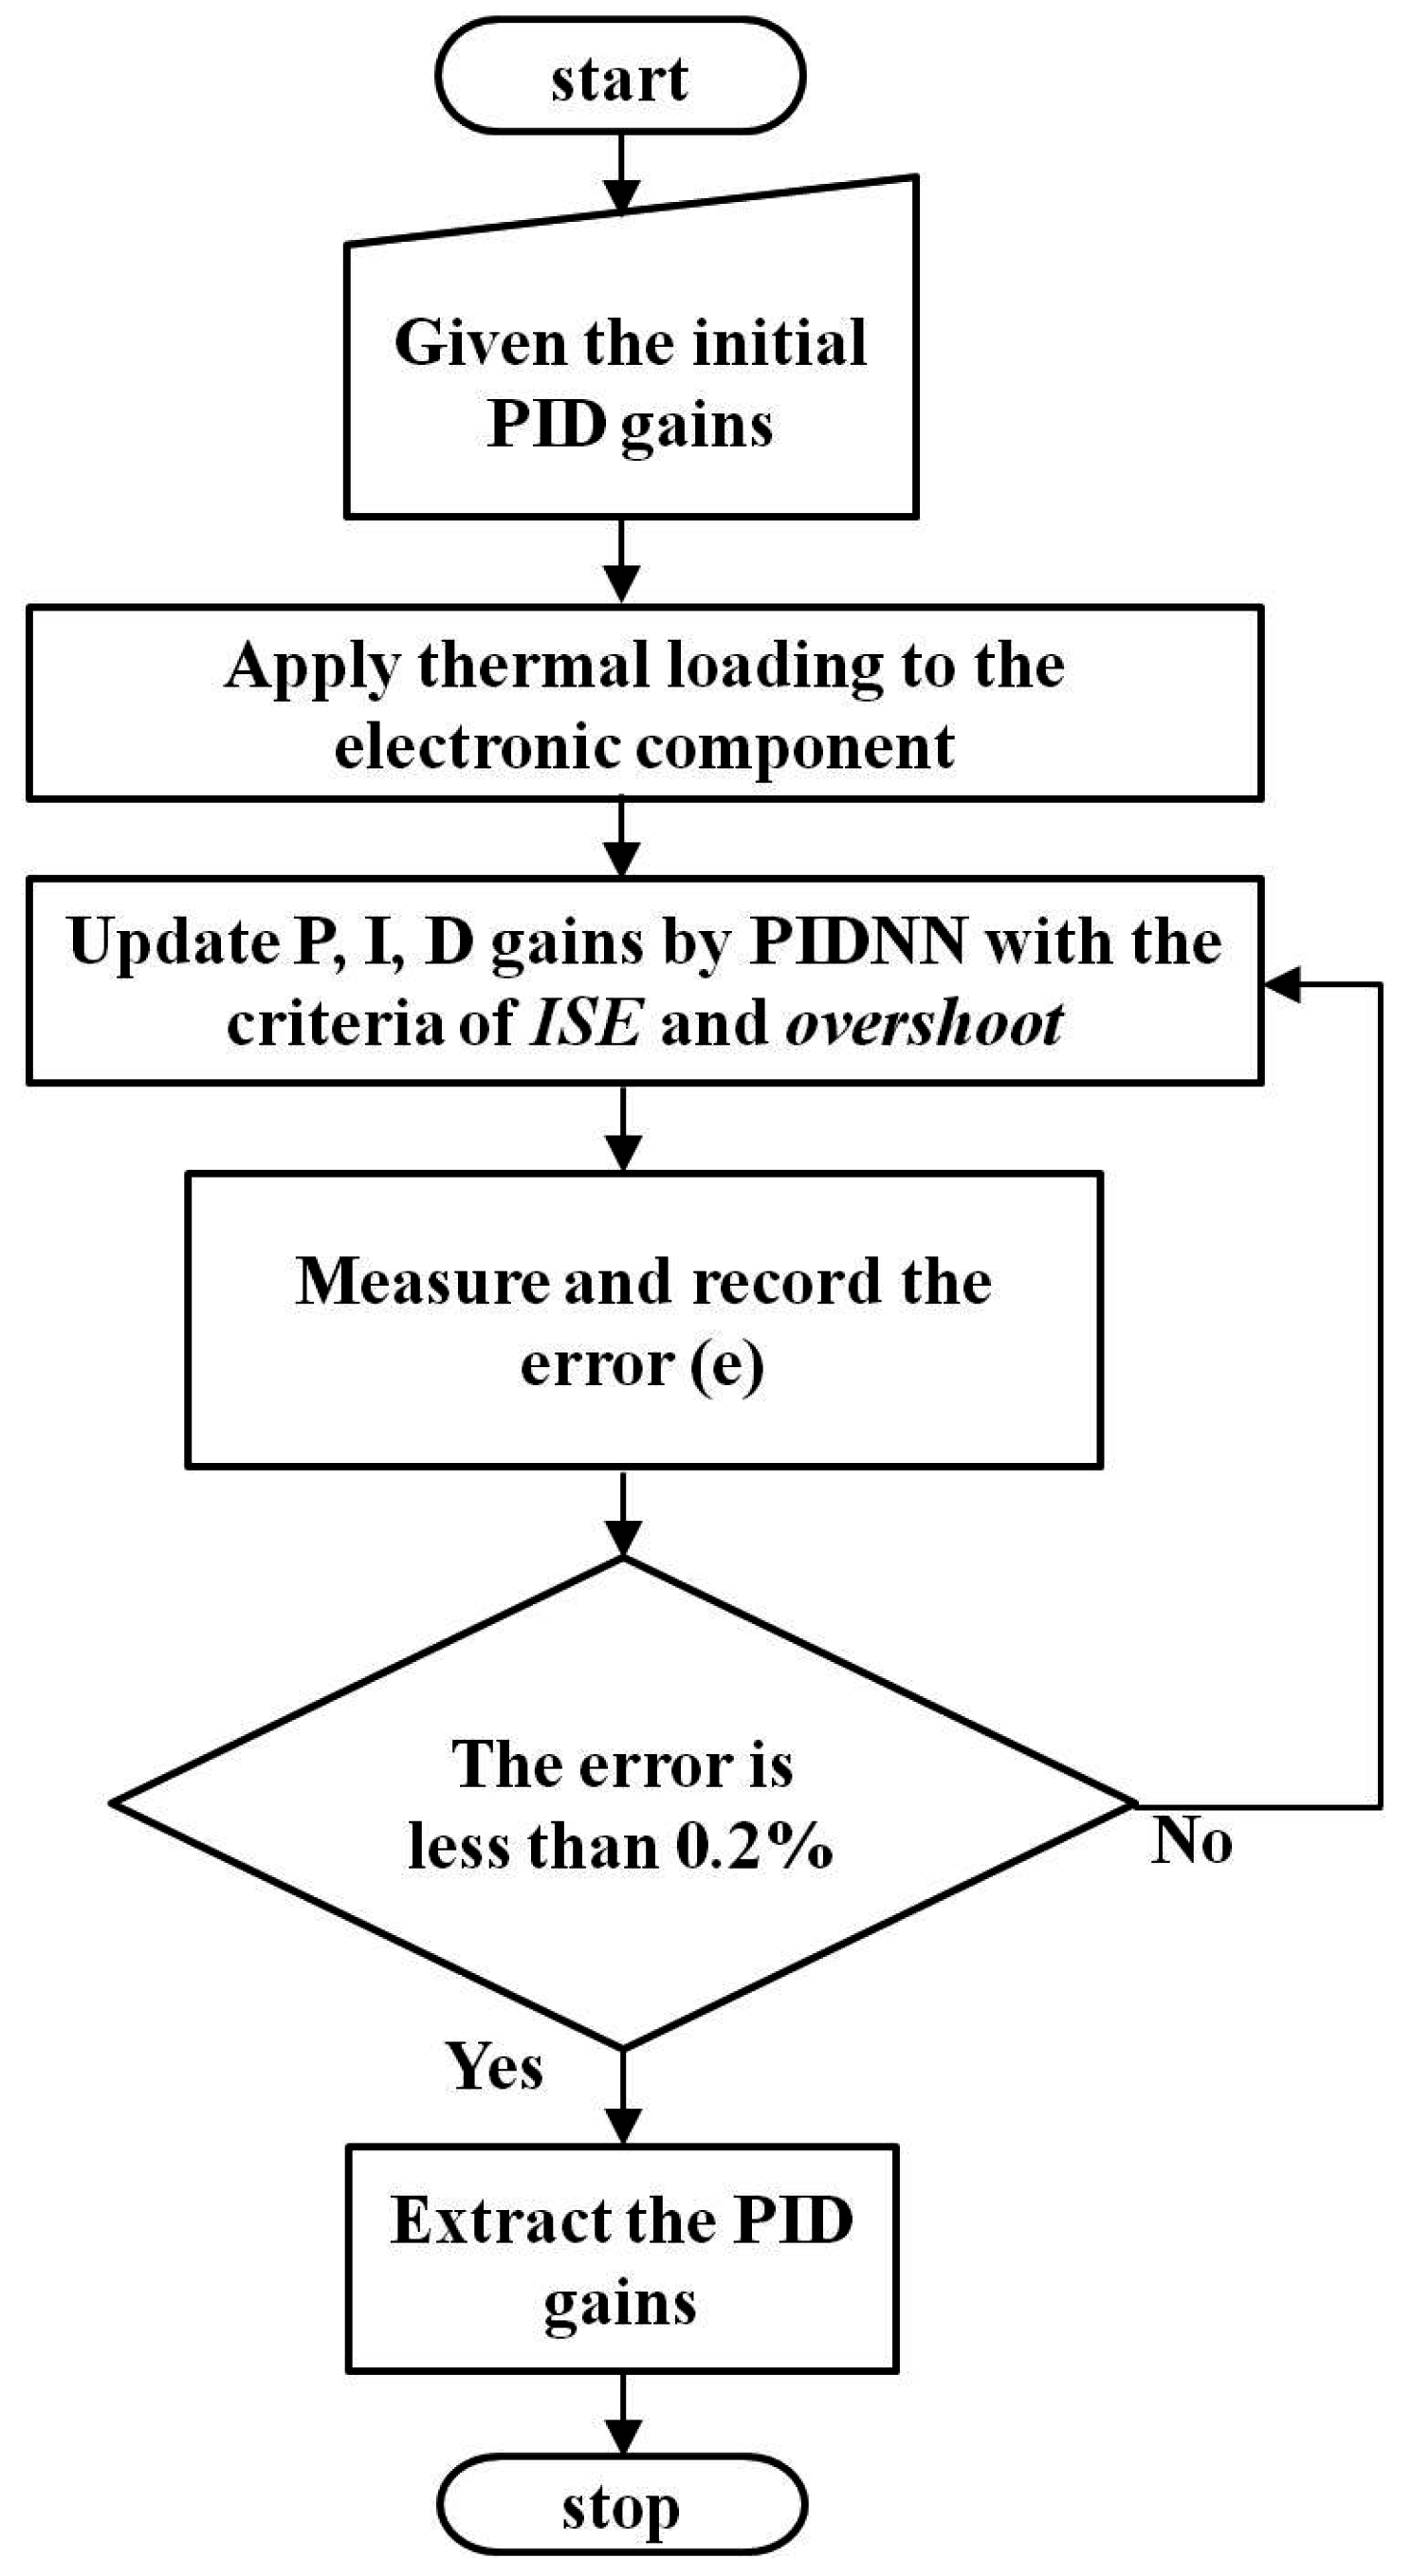
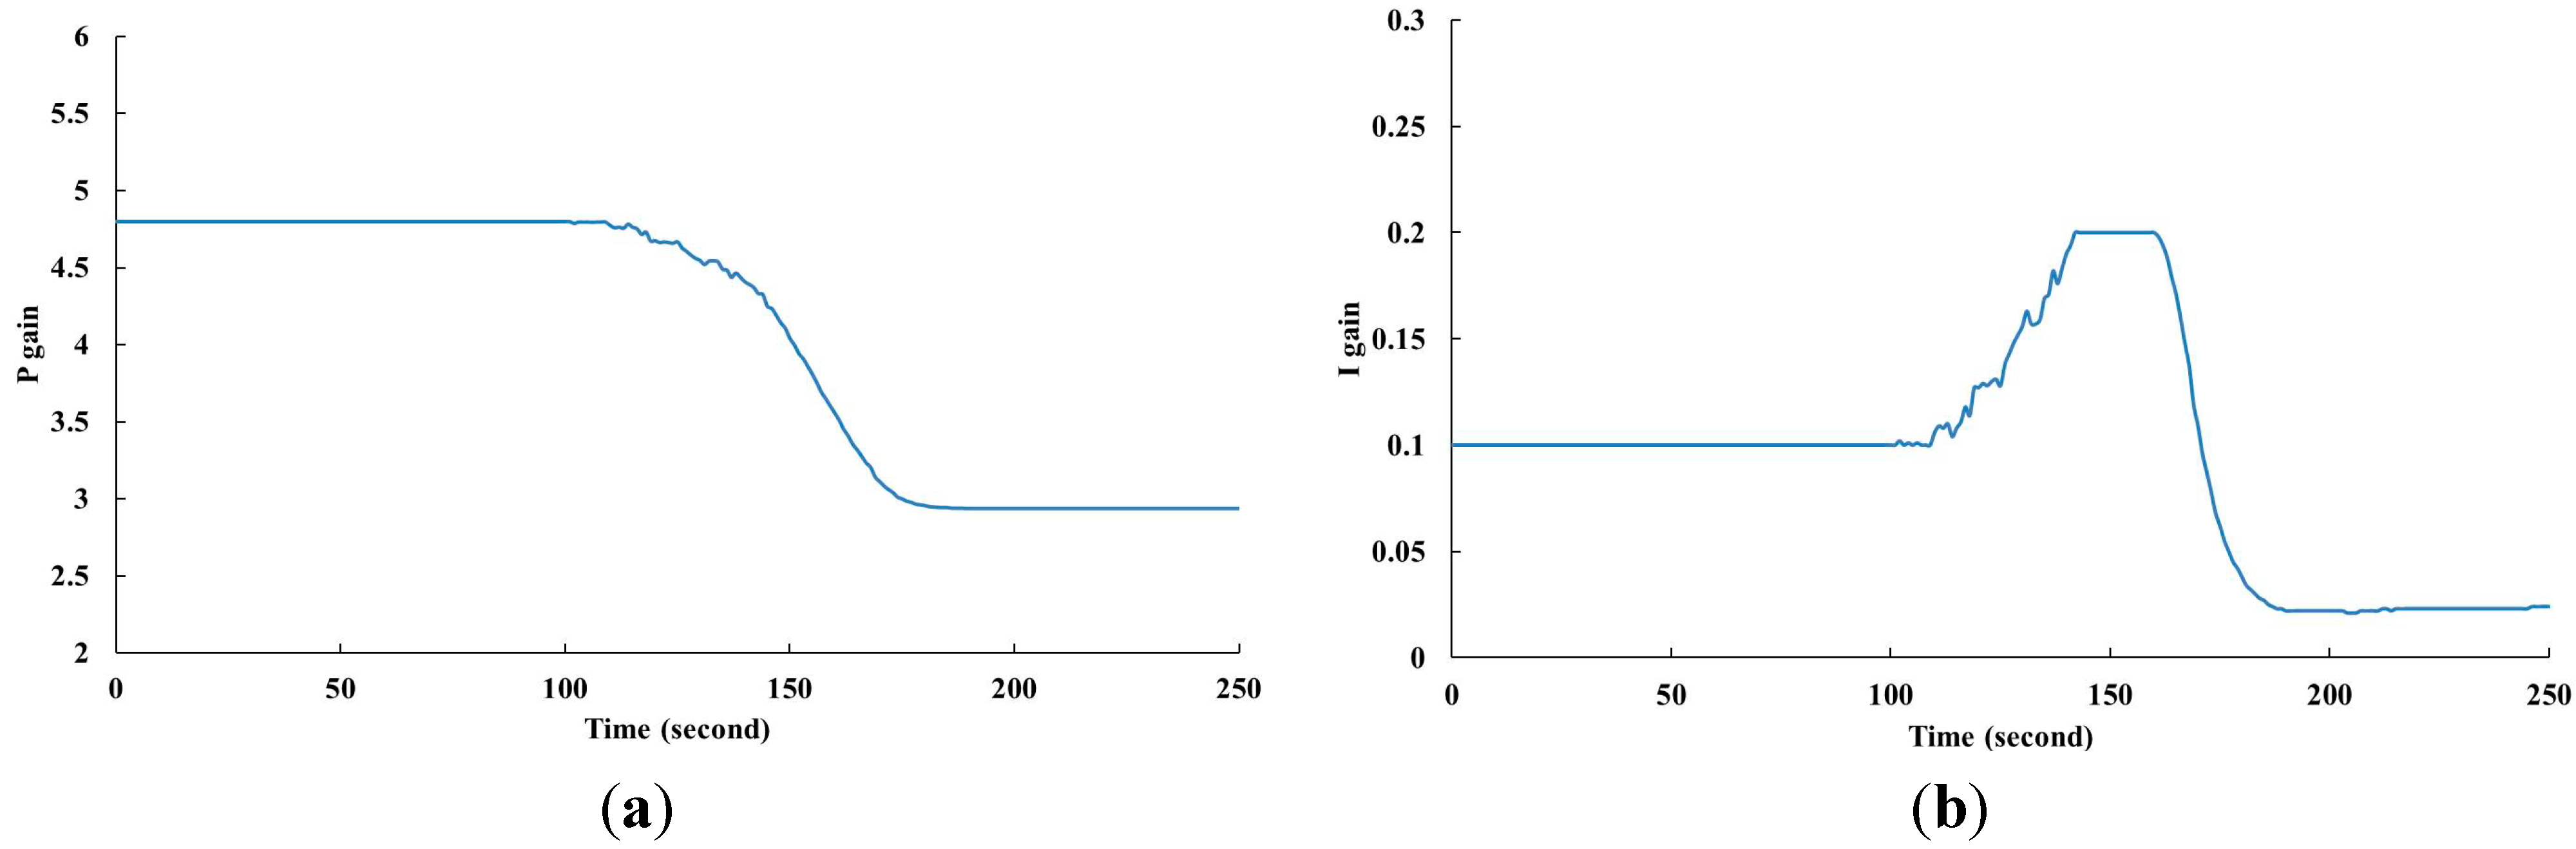
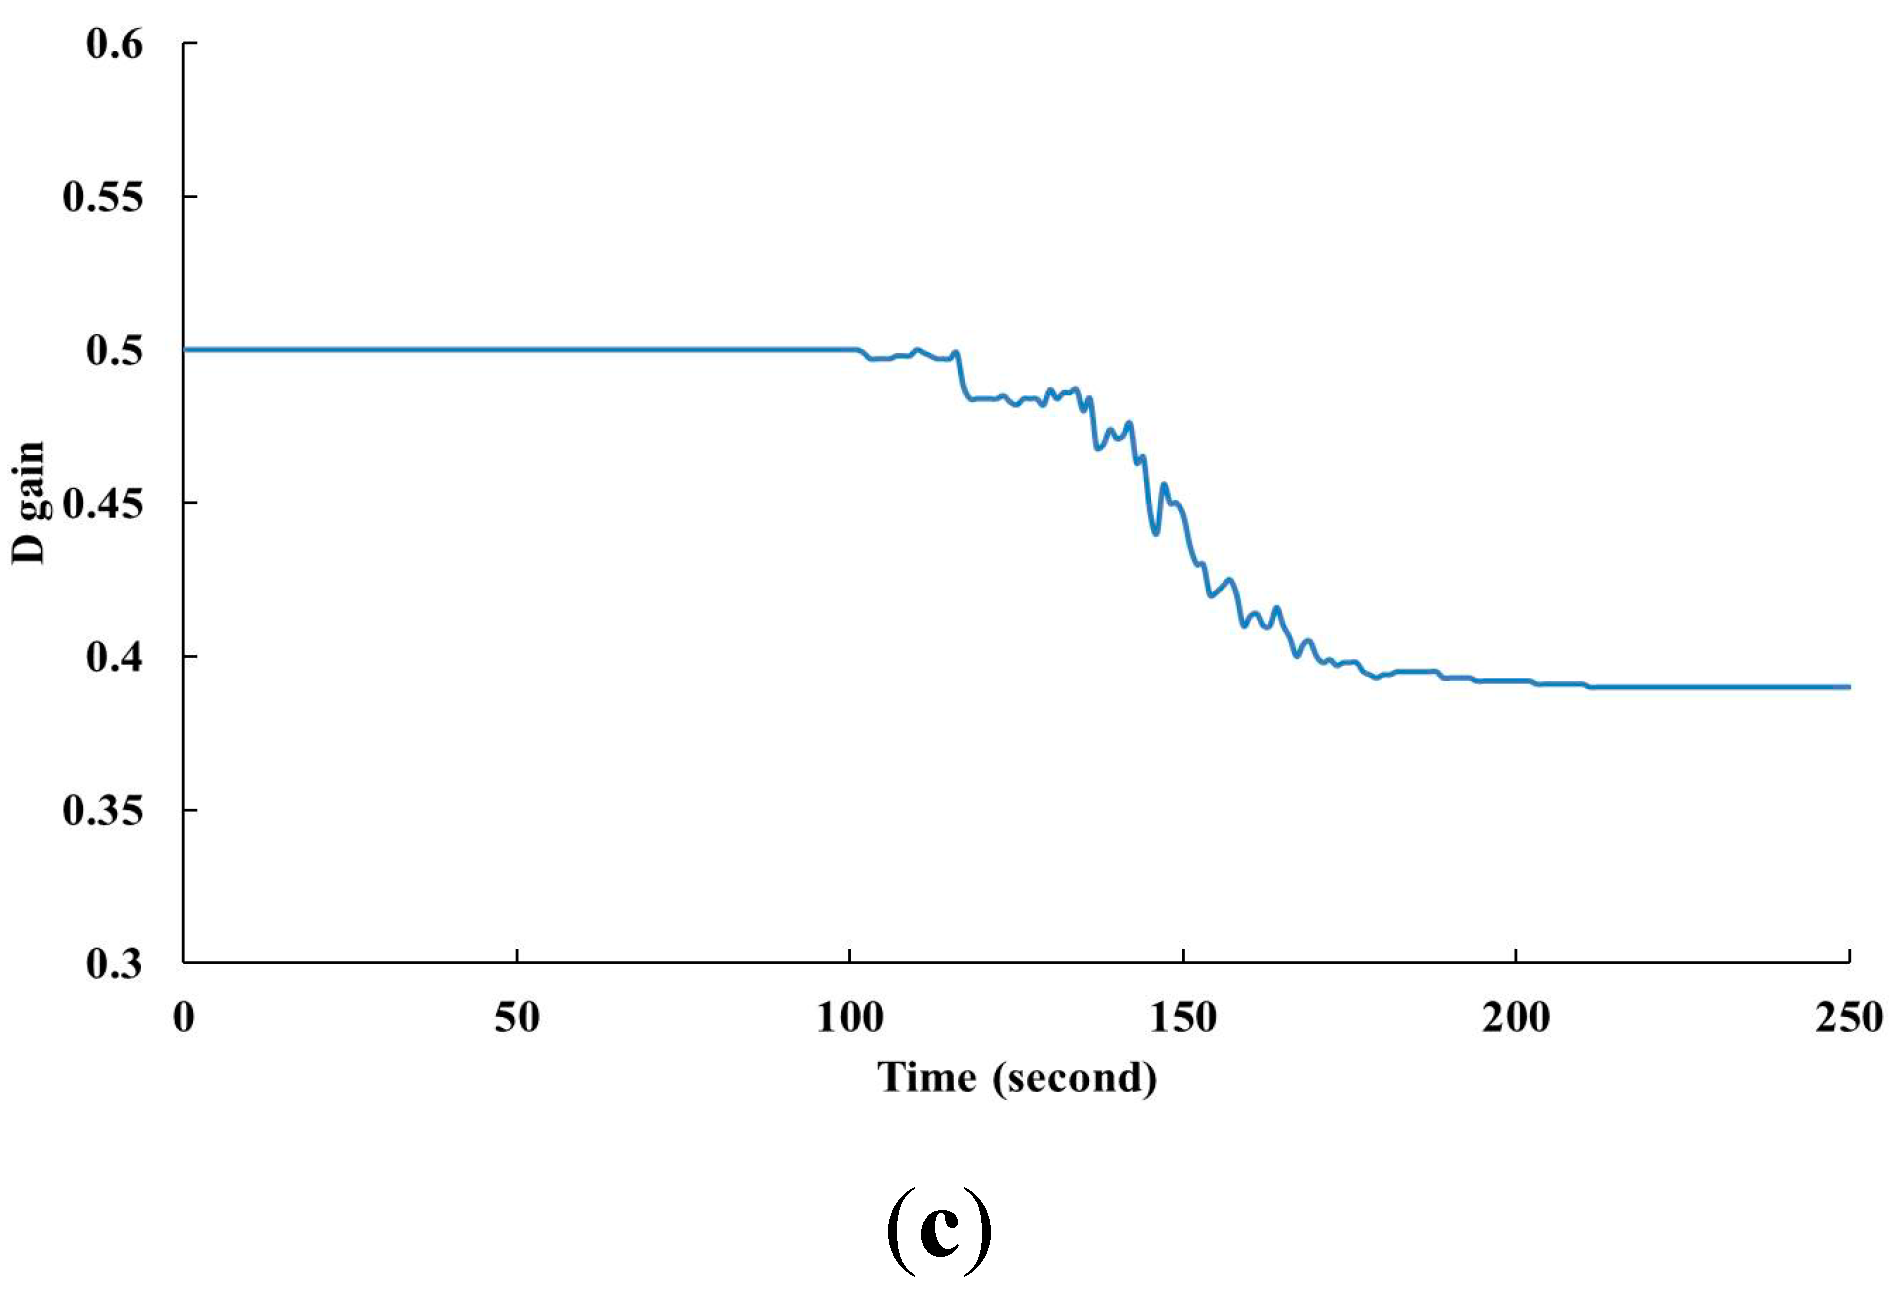
3.2. PID Self-Tuning

4. Experiments and Results


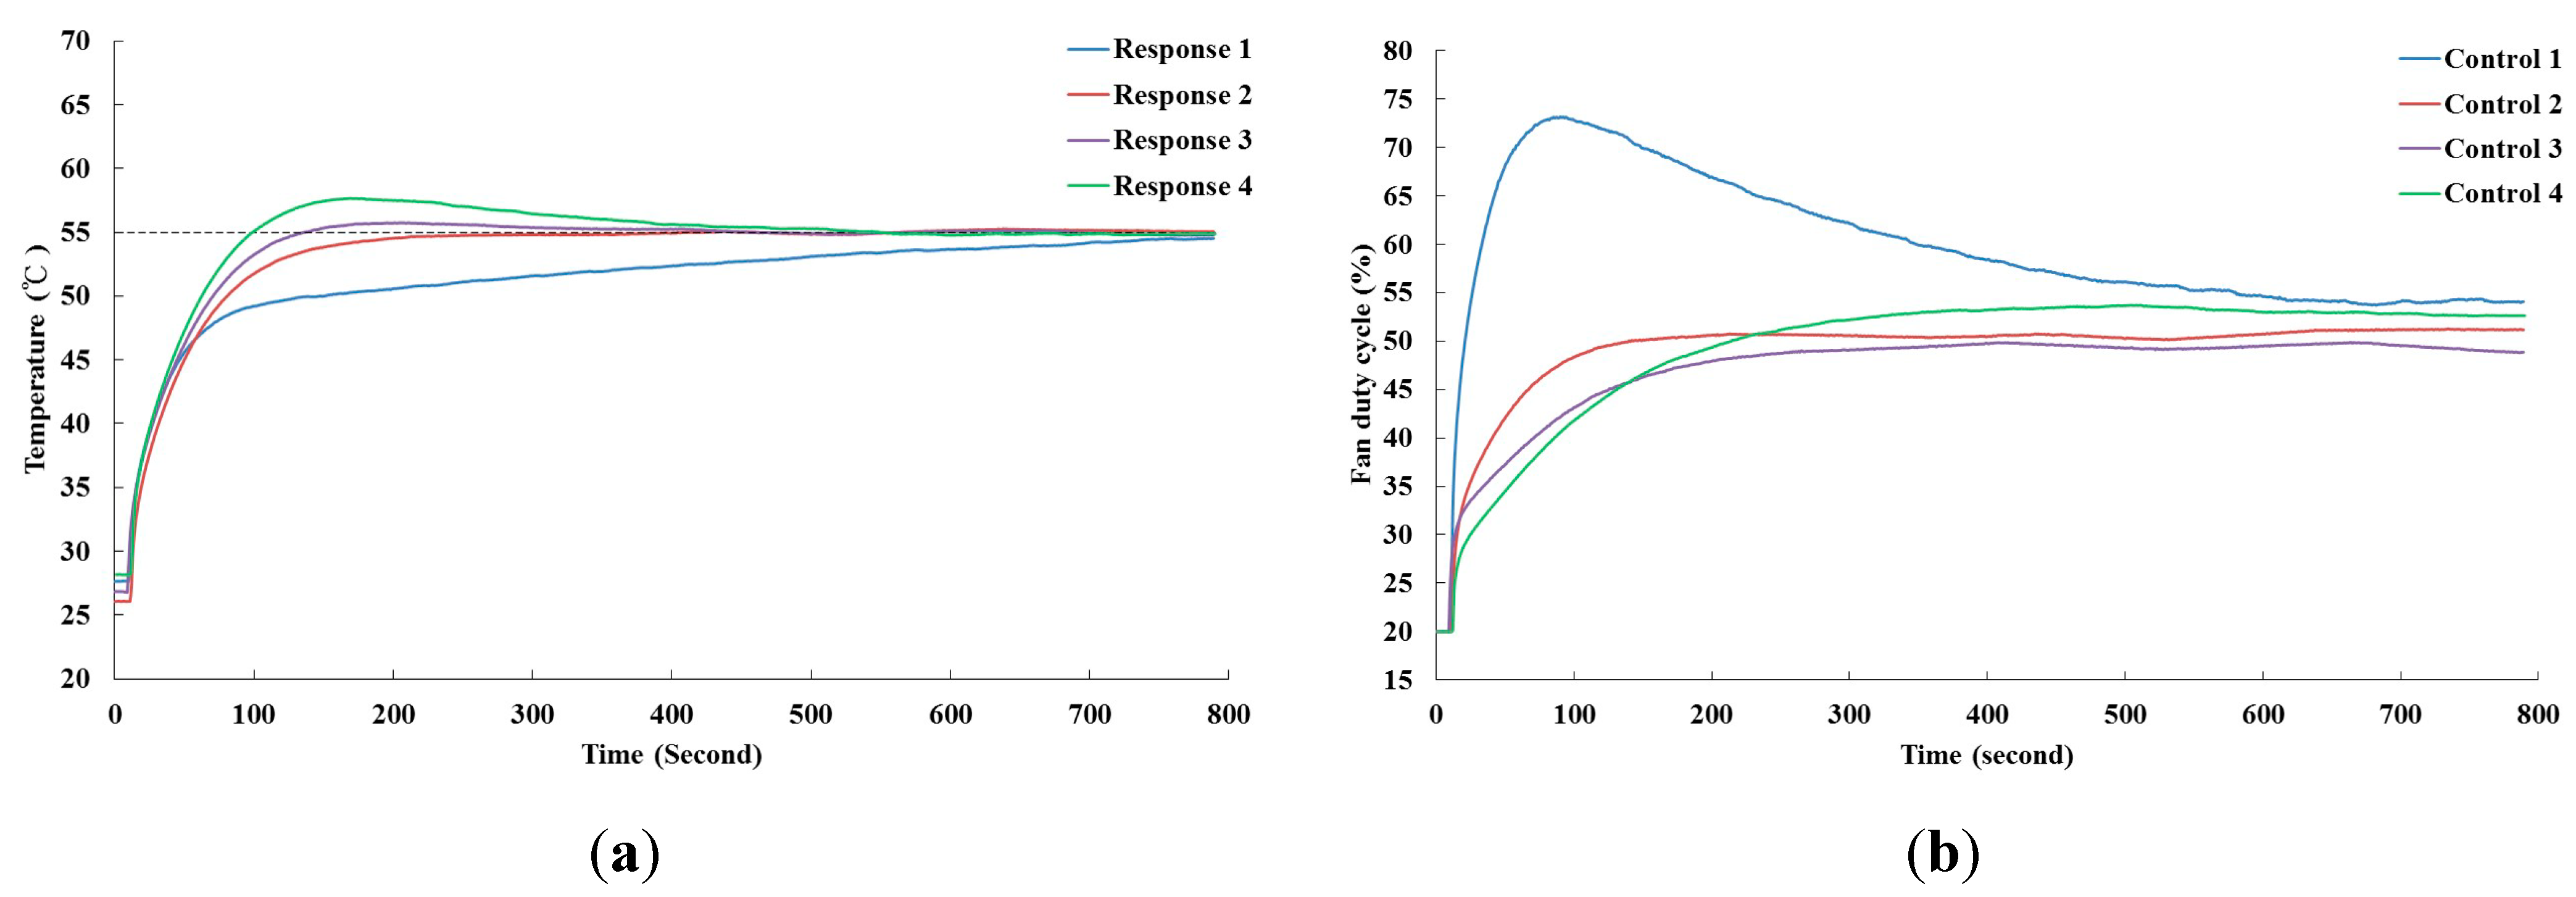
| P | I | D | Overshoot | Fan Power (W) | |
|---|---|---|---|---|---|
| Controller 1 | 2.854 | 0.021 | 0.389 | non | 6422.78 |
| Controller 2 | 1.854 | 0.021 | 0.389 | non | 4463.02 |
| Controller 3 | 1.354 | 0.021 | 0.389 | 1.38% | 4147.13 |
| Controller 4 | 0.854 | 0.021 | 0.389 | 4.83% | 4566.20 |
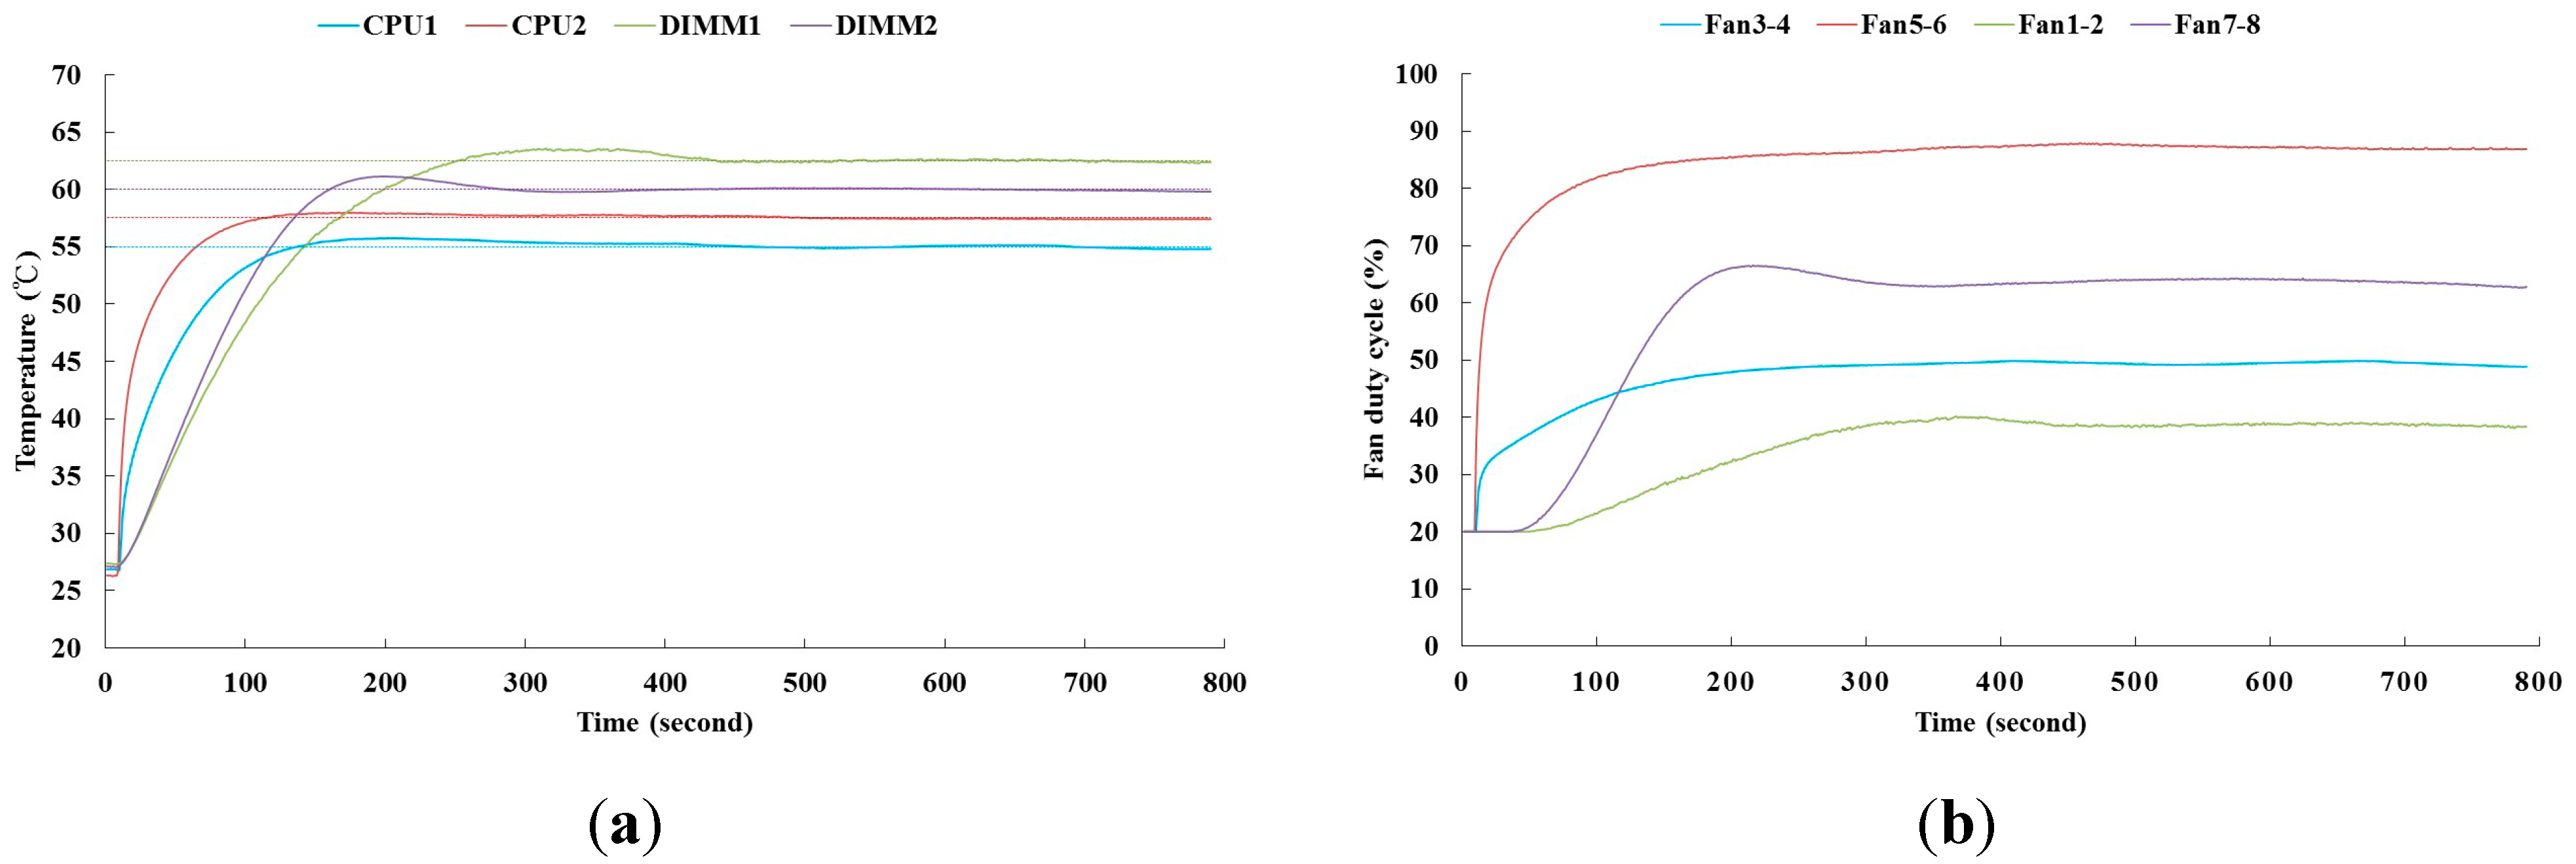
- CPU1: The power load is 80 W and the set-point is 55 °C.
- CPU2: The power load is 80 W and the set-point is 57.5 °C.
- DIMM1: The power load is 60 W and the set-point is 62.5 °C.
- DIMM2: The power load is 60 W and the set-point is 60 °C.
| P | I | D | Overshoot | Fan Power (W) | |
|---|---|---|---|---|---|
| CPU1 | 1.354 | 0.021 | 0.389 | 1.38% | 4174.13 |
| CPU2 | 2.854 | 0.048 | 0.611 | 1.1% | 13,589.56 |
| DIMM1 | 2.064 | 0.021 | 0.507 | 3.3% | 6353.39 |
| DIMM2 | 3.747 | 0.045 | 0.499 | 1.76% | 2736.95 |
| Total Fan Power | 26,854.03 |
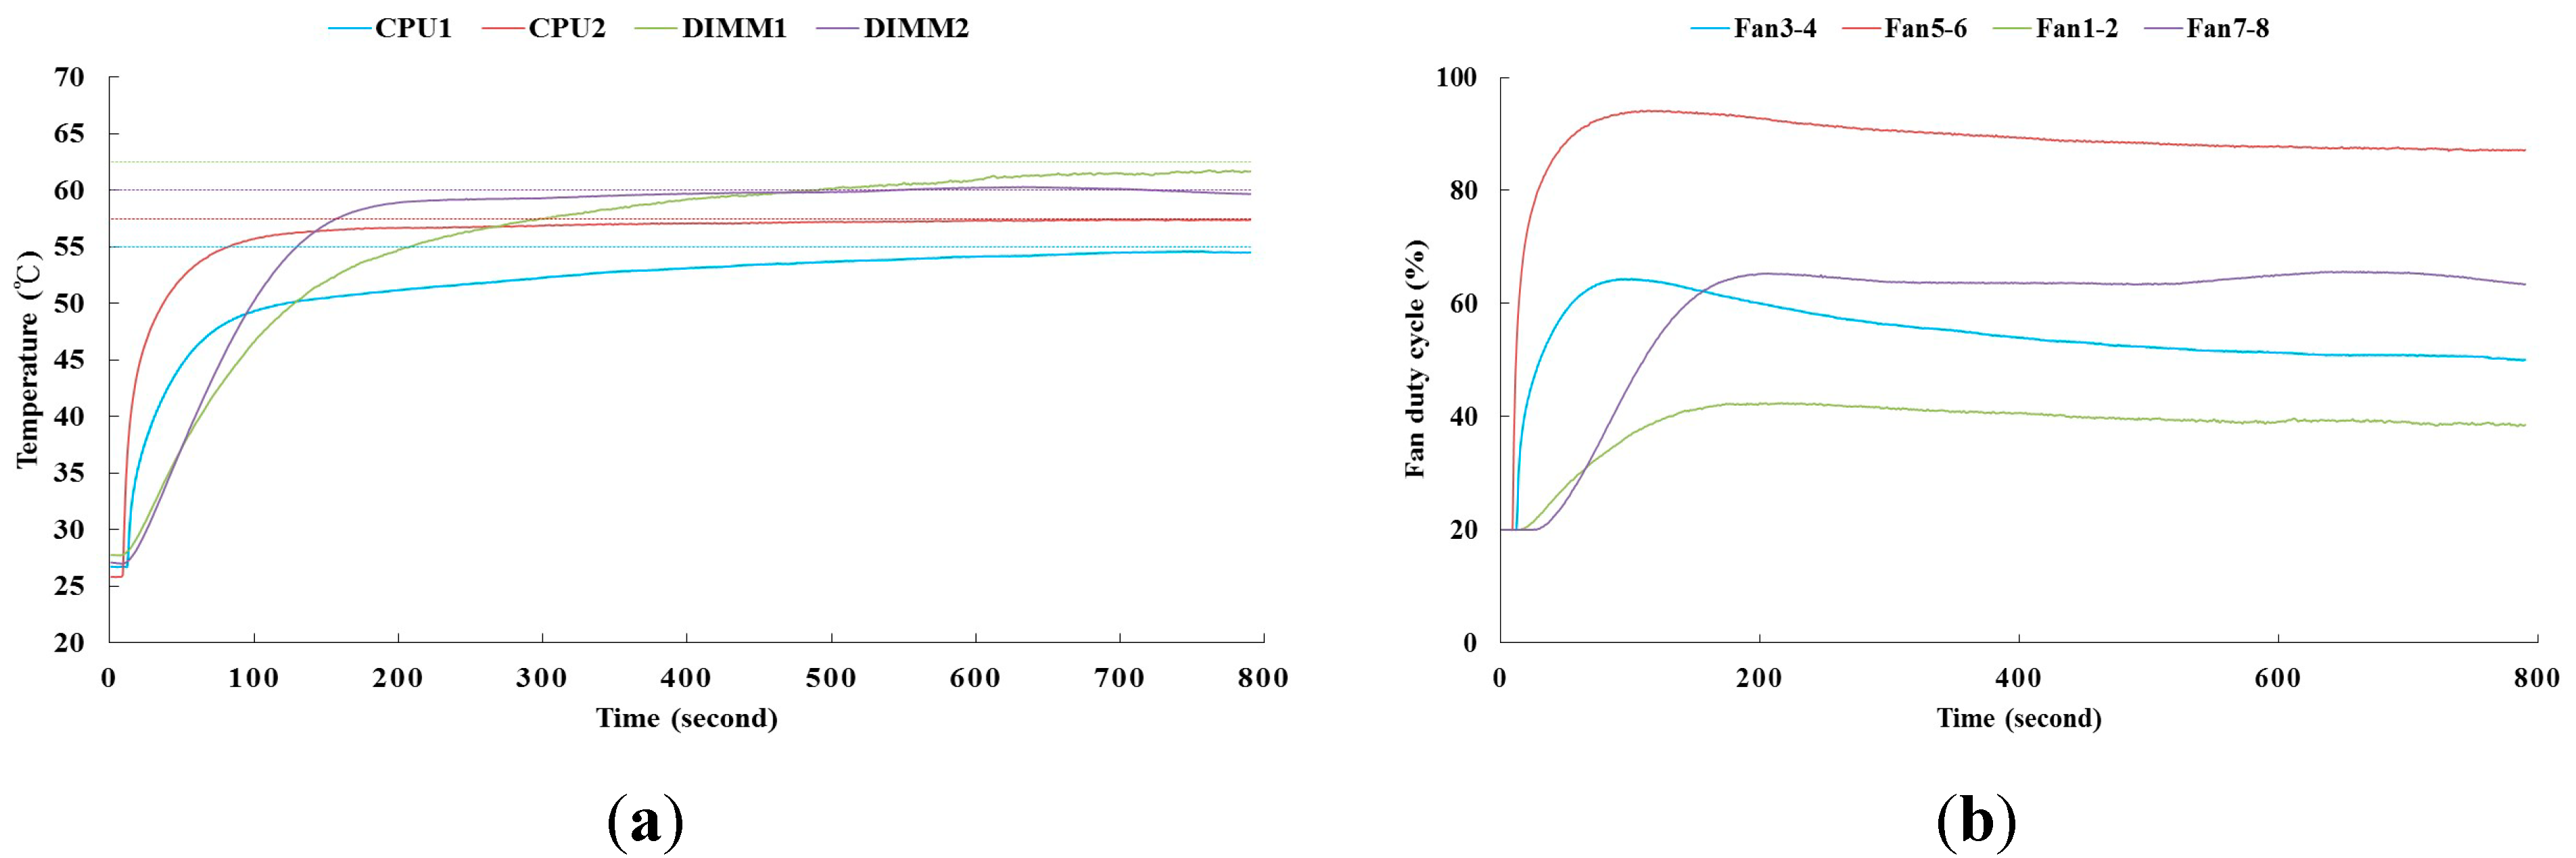
| P | I | D | Fan Power (W) | |
|---|---|---|---|---|
| CPU1 | 2.854 | 0.021 | 0.389 | 6422.78 |
| CPU2 | 3.254 | 0.038 | 0.611 | 15,148.52 |
| DIMM1 | 2.164 | 0.011 | 0.507 | 6550.55 |
| DIMM2 | 4.747 | 0.035 | 0.499 | 3087.87 |
| Total Fan Power | 31,209.72 |
5. Conclusions
- (1)
- This is the first study that discusses how the controller affects fan power consumption in the transient time when the server operates from low to high power state. This method may result in more fan power saving, comparing to the previous researches that focused on the steady-state solution.
- (2)
- Without complicated modeling of the server cooling system, fan power efficiency can be improved by the proposed method.
- (3)
- In general, a skilled engineer may cost a number of hours to tune a PID controller. The results of this work suggest that the proposed controller is not only more suitable for fan power efficiency but also saves considerable labor and time when tuning the PID gains.
- (4)
- During the transient time of 800 s, it appears that up to 14% of fan power can be saved for the 1U rack server when the overshoot criteria falls between 1% and 3.5% in the design of a self-tuning PID controller.
Acknowledgments
Author Contributions
Conflicts of Interest
References
- Lefurgy, C.; Rajamani, K.; Rawson, F.; Felter, W.; Kistler, M.; Keller, T. Energy Management for Commercial Servers. IEEE Comput. 2003, 39, 39–48. [Google Scholar] [CrossRef]
- Patel, C.D.; Bash, C.E.; Sharma, R.; Beitelmam, M.; Friedrich, R.J. Smart Cooling of Data Centers. In Proceedings of the Pacific Rim/ASME International Electronic Packaging Technical Conference and Exhibition, Hawaii, HI, USA, 6–11 July 2003; pp. 129–137.
- Greenberg, S.; Mills, E.; Tschudi, B.; Rumsey, P.; Myatt, B. Best Practices for Data Centers: Lessons Learned from Benchmarking 22 Data Centers. In Proceedings of the ACEEE Summer Study on Energy Efficiency in Buildings, Asilomar, CA, USA, 3 August 2006; pp. 76–87.
- Chiueh, H.; Luh, L.; Draper, J.; Choma, J. A Novel Fully Integrated Fan Controller for Advanced Computer Systems. In Proceedings of the Southwest Symposium on Mixed-Signal Design, San Diego, CA, USA, 27–29 February 2000; pp. 191–194.
- Wang, Z.; Bash, C.; Tolia, N.; Marwah, M.; Zhu, X.; Ranganathan, P. Optimal Fan Speed Control for Thermal Management of Servers. In Proceedings of the ASME/Pacific Rim Technical Conference and Exhibition on Packaging and Integration of Electronic and Photonic Systems, MEMS, and NEMS, San Francisco, CA, USA, 19–23 July 2009; pp. 709–719.
- Rajamani, K.; Rawson, F.; Ware, M.; Hanson, H.; Carter, J.; Rosedahl, T.; Geissler, A.; Silva, G.; Hua, H. Power-Performance Management on an IBM POWER7 Server. In Proceedings of the 2010 ACM/IEEE International Symposium on Low-Power Electronics and Design (ISLPED), Austin, TX, USA, 18–20 August 2010; pp. 201–206.
- Han, X.; Joshi, Y. Energy Reduction in Server Cooling via Real Time Thermal Control. In Proceedings of the 28th IEEE Semiconductor Thermal Measurement and Management Symposium, San Jose, CA, USA, 18–22 March 2012; pp. 20–27.
- Astrom, K.J.; Hagglund, T. The Future of PID Control. Control. Eng. Pract. 2001, 9, 1163–1175. [Google Scholar] [CrossRef]
- Ntogramatzidis, L.; Ferrante, A. Exact Tuning of PID Controllers in Control Feedback Design. IET Control Theory Appl. 2011, 5, 565–578. [Google Scholar] [CrossRef]
- Yamamoto, T.; Takao, K.; Yamada, T. Design of a Data-Driven PID Controller. IEEE Trans. Control Syst. Technol. 2009, 17, 29–39. [Google Scholar] [CrossRef]
- Wang, L.; Du, W.; Wang, H.; Wu, H. Fuzzy Self-Tuning PID Control of the Operation Temperatures in a Two-Staged Membrane Separation Process. J. Nat. Gas. Chem. 2008, 17, 409–414. [Google Scholar] [CrossRef]
- Zeng, S.; Hu, H.; Xu, L.; Li, G. Nonlinear Adaptive PID Controller for Greenhouse Environment Based on RBF Network. Sensors 2012, 12, 5328–5348. [Google Scholar] [CrossRef] [PubMed]
- Shu, H.L.; Pi, Y. PID Neural Networks for Time-Delay Systems. Comput. Chem. Eng. 2000, 24, 859–862. [Google Scholar] [CrossRef]
- Chen, J.H.; Huang, T.C. Applying Neural Networks to on-line Updated PID Controllers for Nonlinear Process Control. J. Process. Control. 2004, 14, 211–230. [Google Scholar] [CrossRef]
- Ren, T.J.; Chen, T.C.; Chen, C.J. Motion Control for a Two-Wheeled Vehicle Using a Self-Tuning PID Controller. Control. Eng. Pract. 2008, 16, 365–375. [Google Scholar] [CrossRef]
- Cong, S.; Liang, Y. PID-Like Neural Network Nonlinear Adaptive Control for Uncertain Multivariable Motion Control Systems. IEEE Trans. Ind. Electron. 2009, 56, 3872–3879. [Google Scholar] [CrossRef]
- Chen, S.Y.; Lin, F.J. Decentralized PID Neural Network Control for Five Degree-of-Freedom Active Magnetic Bearing. Eng. Appl. Artif. Intell. 2013, 26, 962–973. [Google Scholar] [CrossRef]
- Liu, G.P.; Daley, S. Optimal-Tuning PID Control for Industrial Systems. Control. Eng. Pract. 2001, 9, 1185–1194. [Google Scholar] [CrossRef]
- Skadron, K.; Stan, M.; Huang, W.; Velusamy, S.; Sankaranarayanan, K.; Tarjan, D. Temperature-Aware Microarchitecture: Modeling and Implementation. In Proceedings of the 30th Annual International Symposium on Computer Architecture, San Diego, CA, USA, 9–11 June 2003.
- Ayoub, R.; Indukuri, K.; Rosing, T.S. Temperature Aware Dynamic Workload Scheduling in Multisocket CPU Servers. IEEE Trans. Comput. Aided Design Integr. Circuits Syst. 2011, 30, 1359–1372. [Google Scholar] [CrossRef]
- Patterson, M. The Effect of Data Center Temperature on Energy Efficiency. In Proceedings of the 11th Intersociety Conference on Thermal and Thermomechanical Phenomena in Electronic Systems, Orlando, FL, USA, 28–31 May 2008; pp. 1167–1174.
- Shu, H.L. Study on the Neural PID Network Based Cascade Control System. Autom. Instrum. 1997, 5, 5–7. [Google Scholar]
- Lin, F.J.; Hwang, J.C.; Tan, K.H.; Lu, Z.H.; Chang, Y.R. Intelligent Control of Doubly-Fed Induction Generator Systems Using PIDNNs. Asian J. Control 2012, 14, 768–783. [Google Scholar] [CrossRef]
© 2015 by the authors; licensee MDPI, Basel, Switzerland. This article is an open access article distributed under the terms and conditions of the Creative Commons Attribution license (http://creativecommons.org/licenses/by/4.0/).
Share and Cite
Lee, C.; Chen, R. Optimal Self-Tuning PID Controller Based on Low Power Consumption for a Server Fan Cooling System. Sensors 2015, 15, 11685-11700. https://doi.org/10.3390/s150511685
Lee C, Chen R. Optimal Self-Tuning PID Controller Based on Low Power Consumption for a Server Fan Cooling System. Sensors. 2015; 15(5):11685-11700. https://doi.org/10.3390/s150511685
Chicago/Turabian StyleLee, Chengming, and Rongshun Chen. 2015. "Optimal Self-Tuning PID Controller Based on Low Power Consumption for a Server Fan Cooling System" Sensors 15, no. 5: 11685-11700. https://doi.org/10.3390/s150511685
APA StyleLee, C., & Chen, R. (2015). Optimal Self-Tuning PID Controller Based on Low Power Consumption for a Server Fan Cooling System. Sensors, 15(5), 11685-11700. https://doi.org/10.3390/s150511685