
Brain Process for Perception of the “Out of the Body” Tactile Illusion for Virtual Object Interaction


Abstract
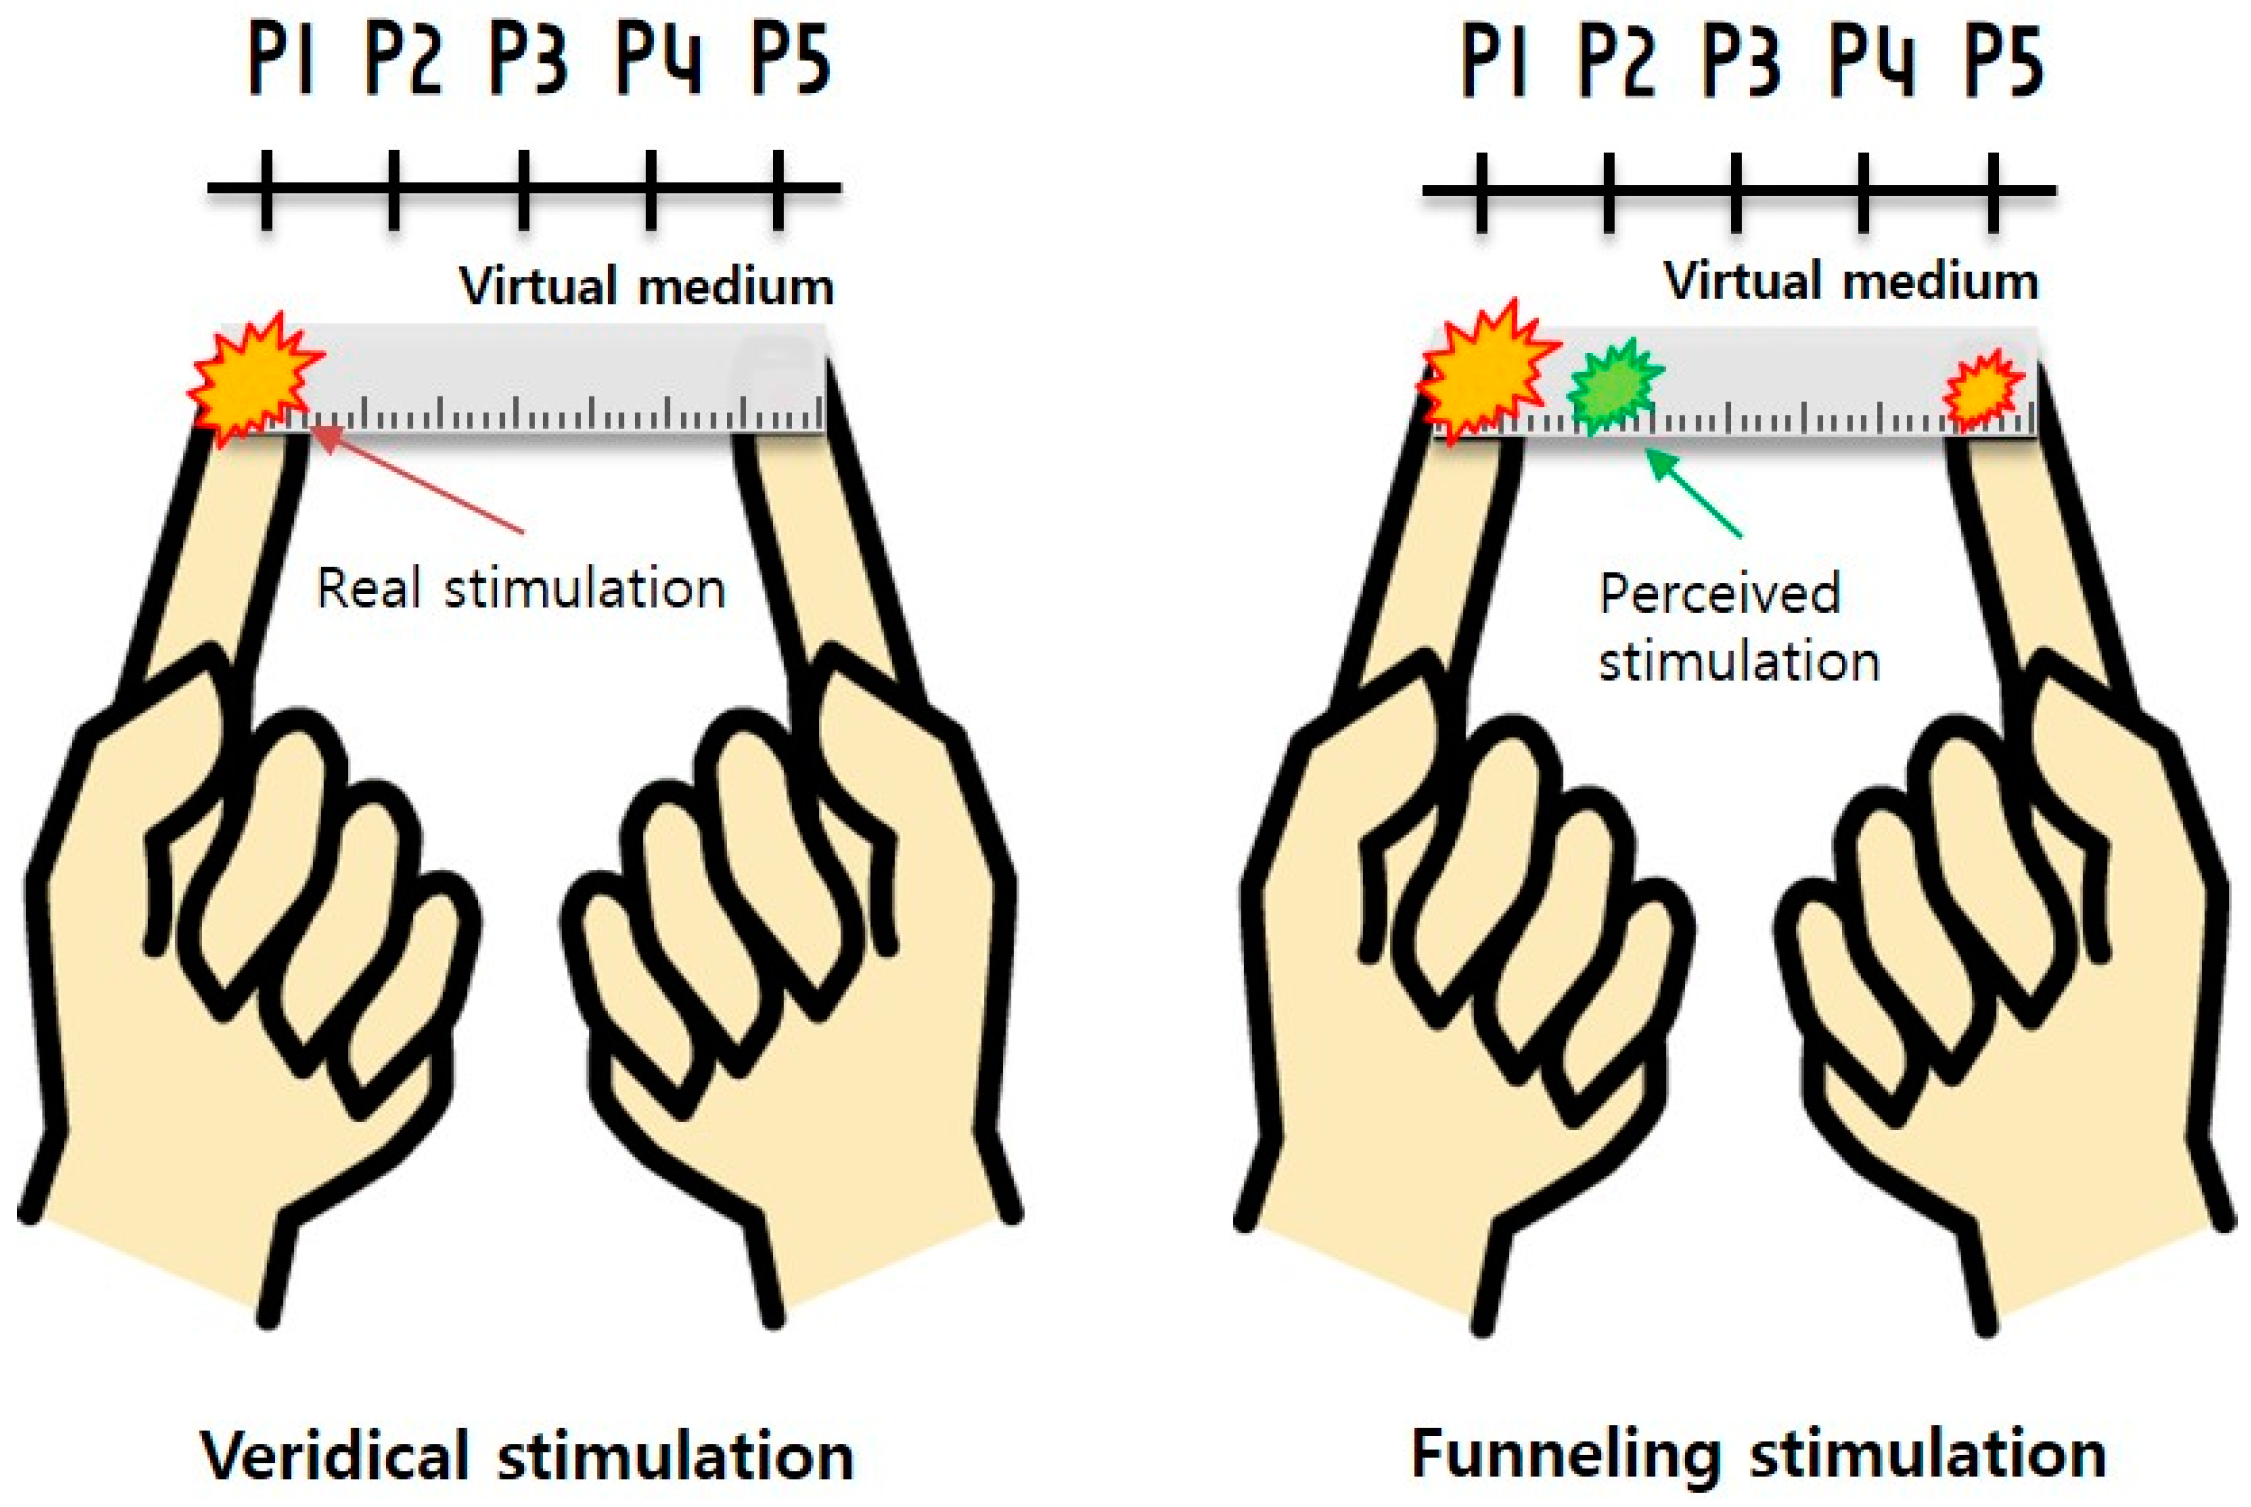
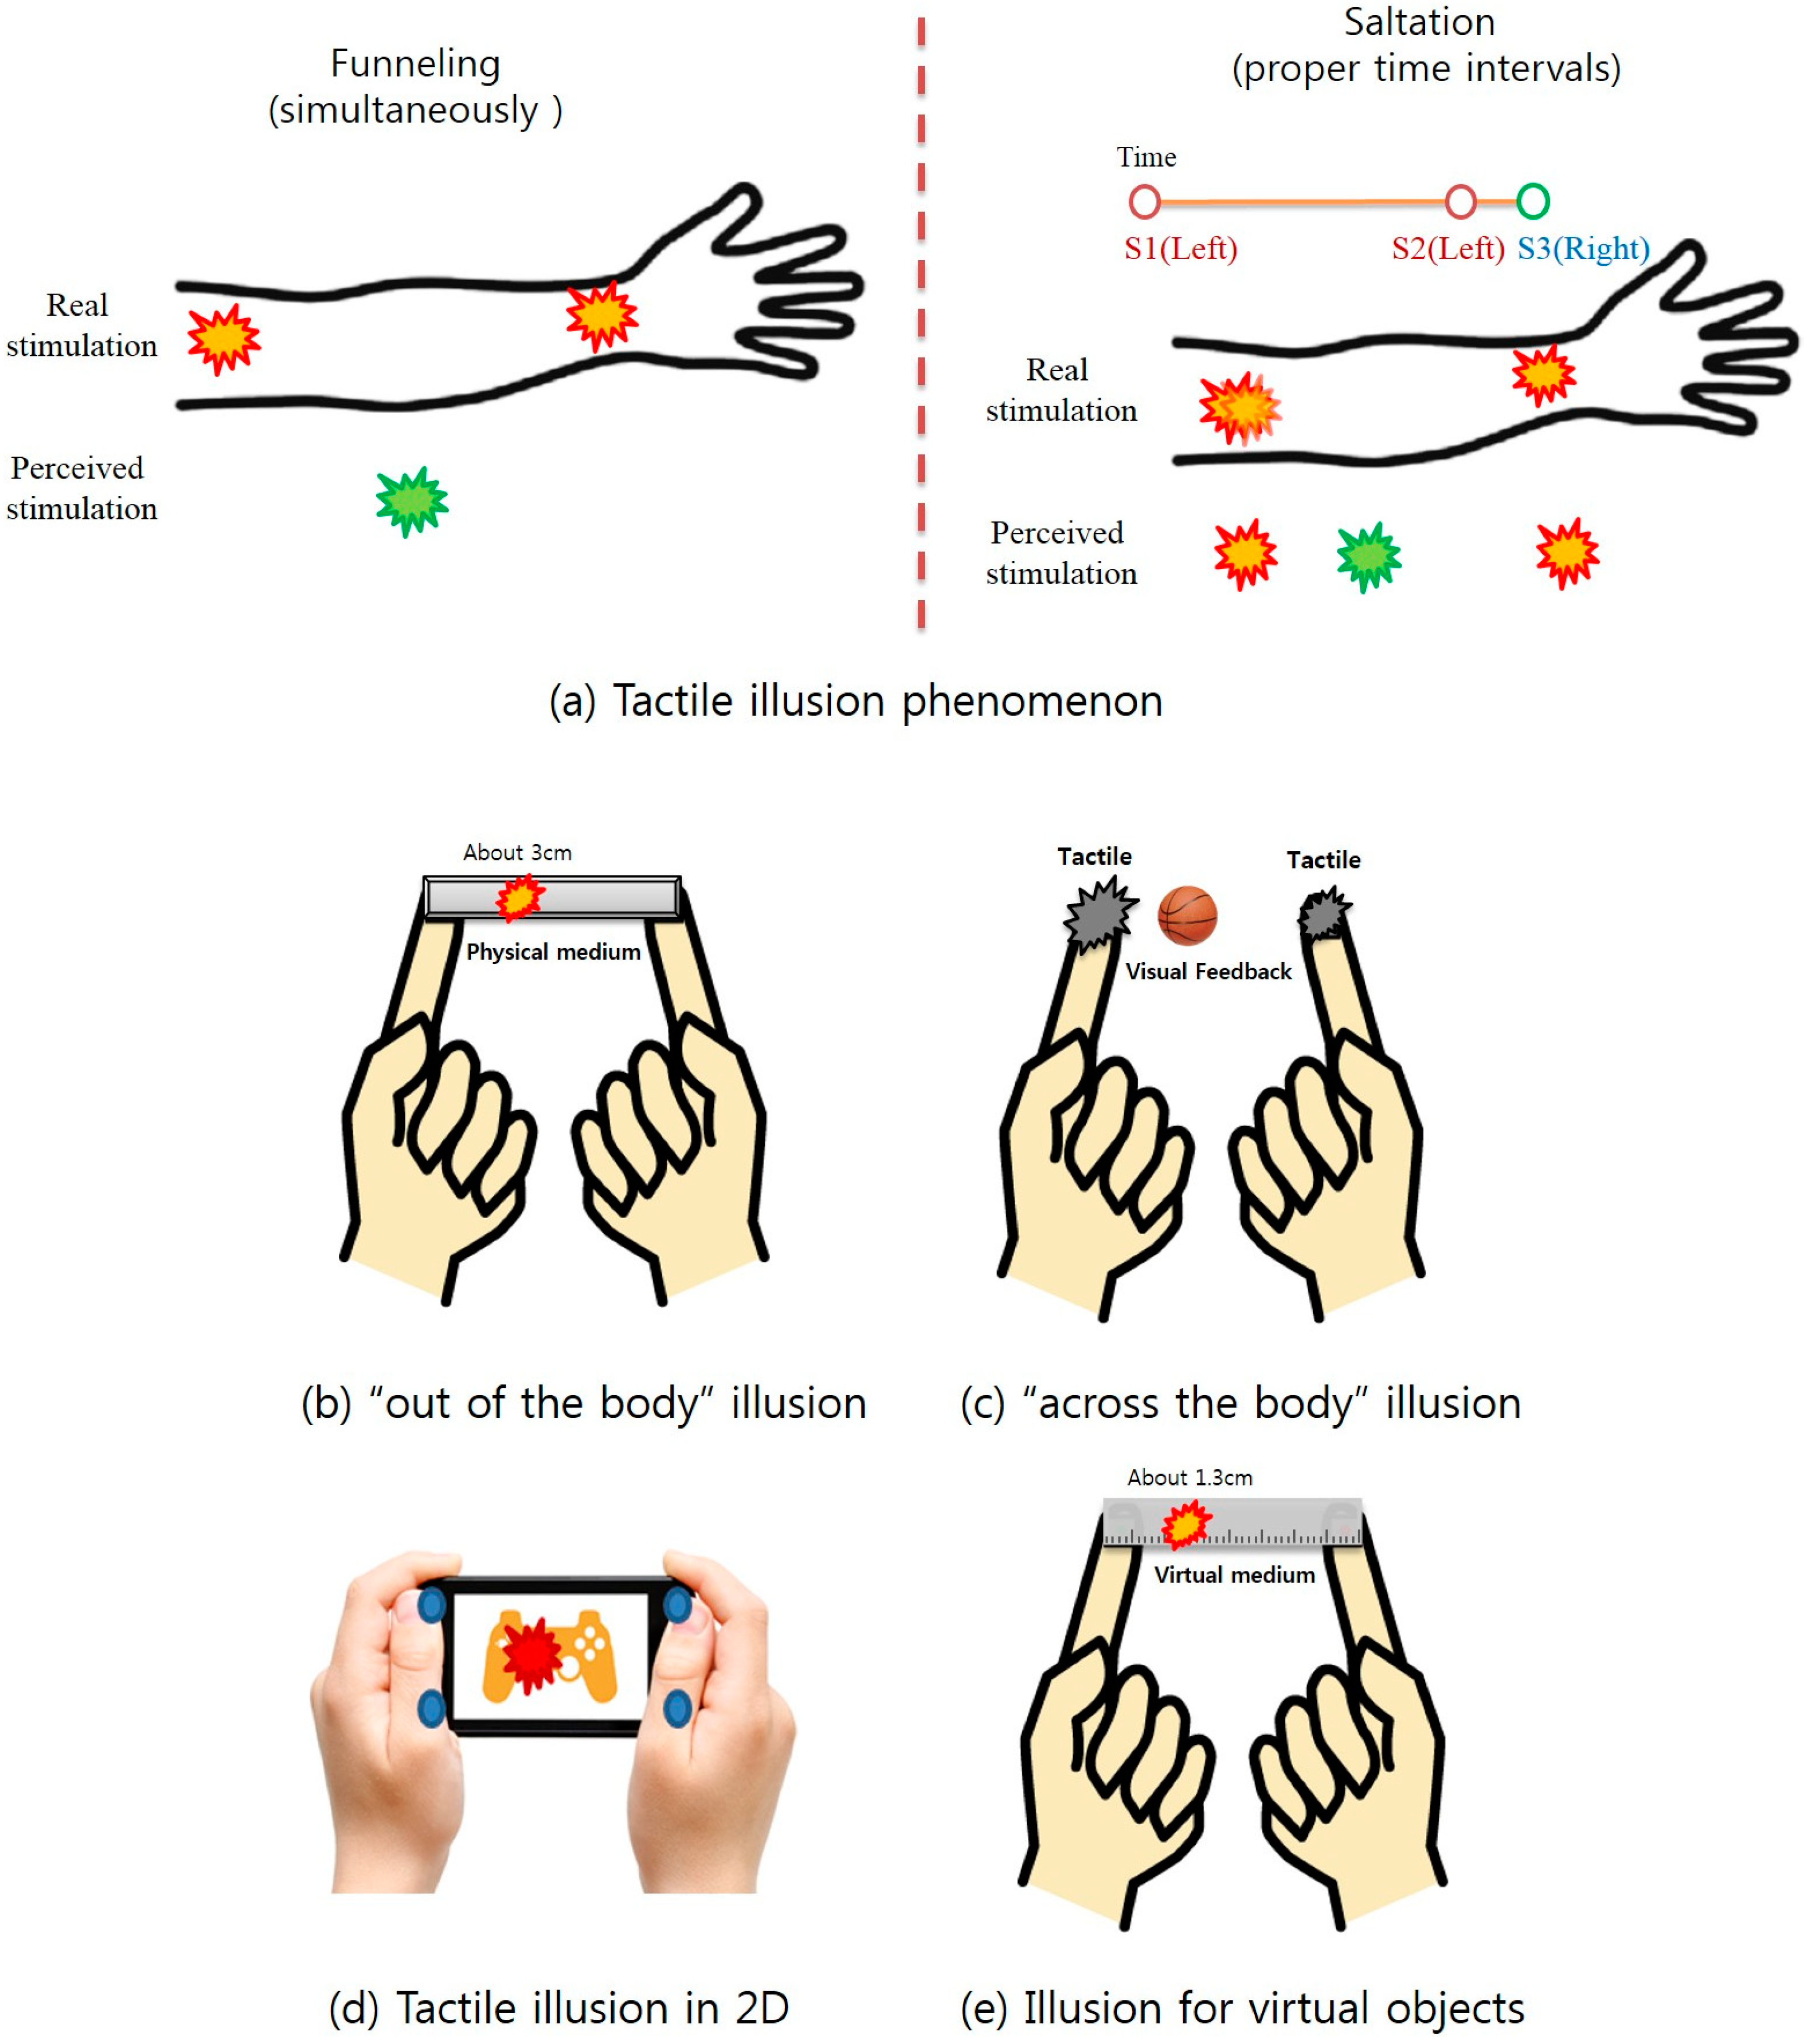
:1. Introduction

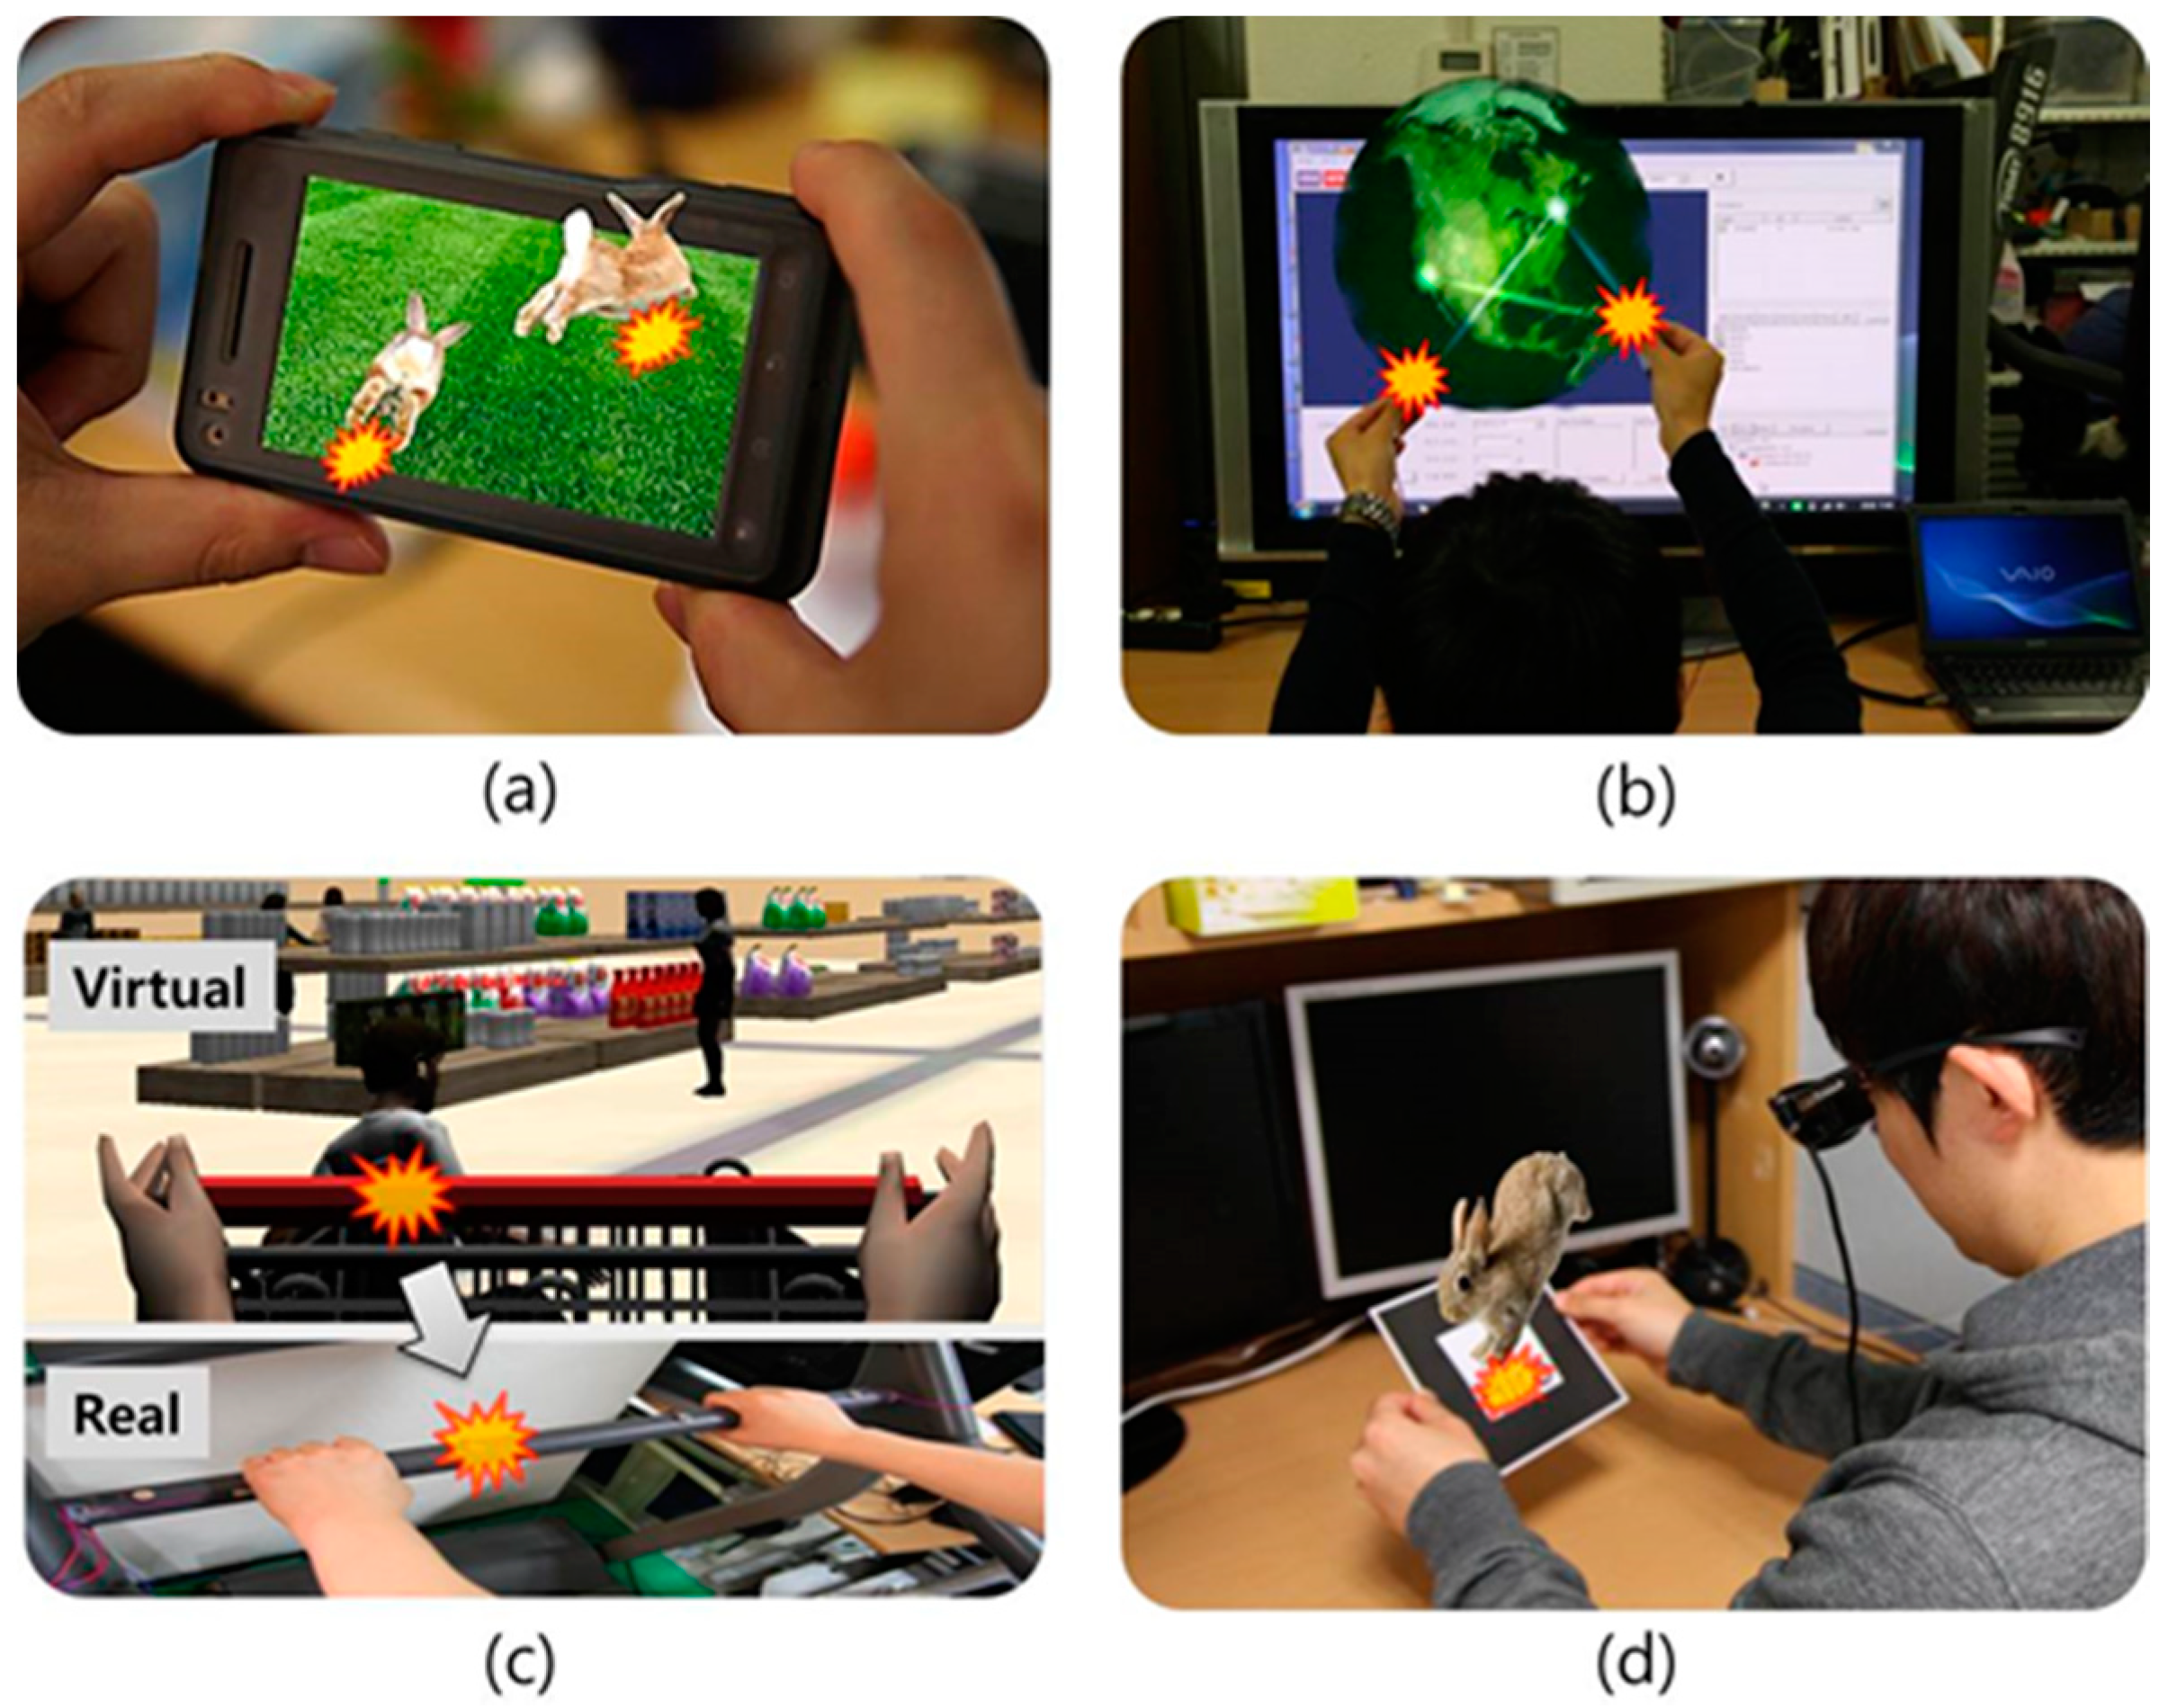
2. Related Work
3. Experimental Section
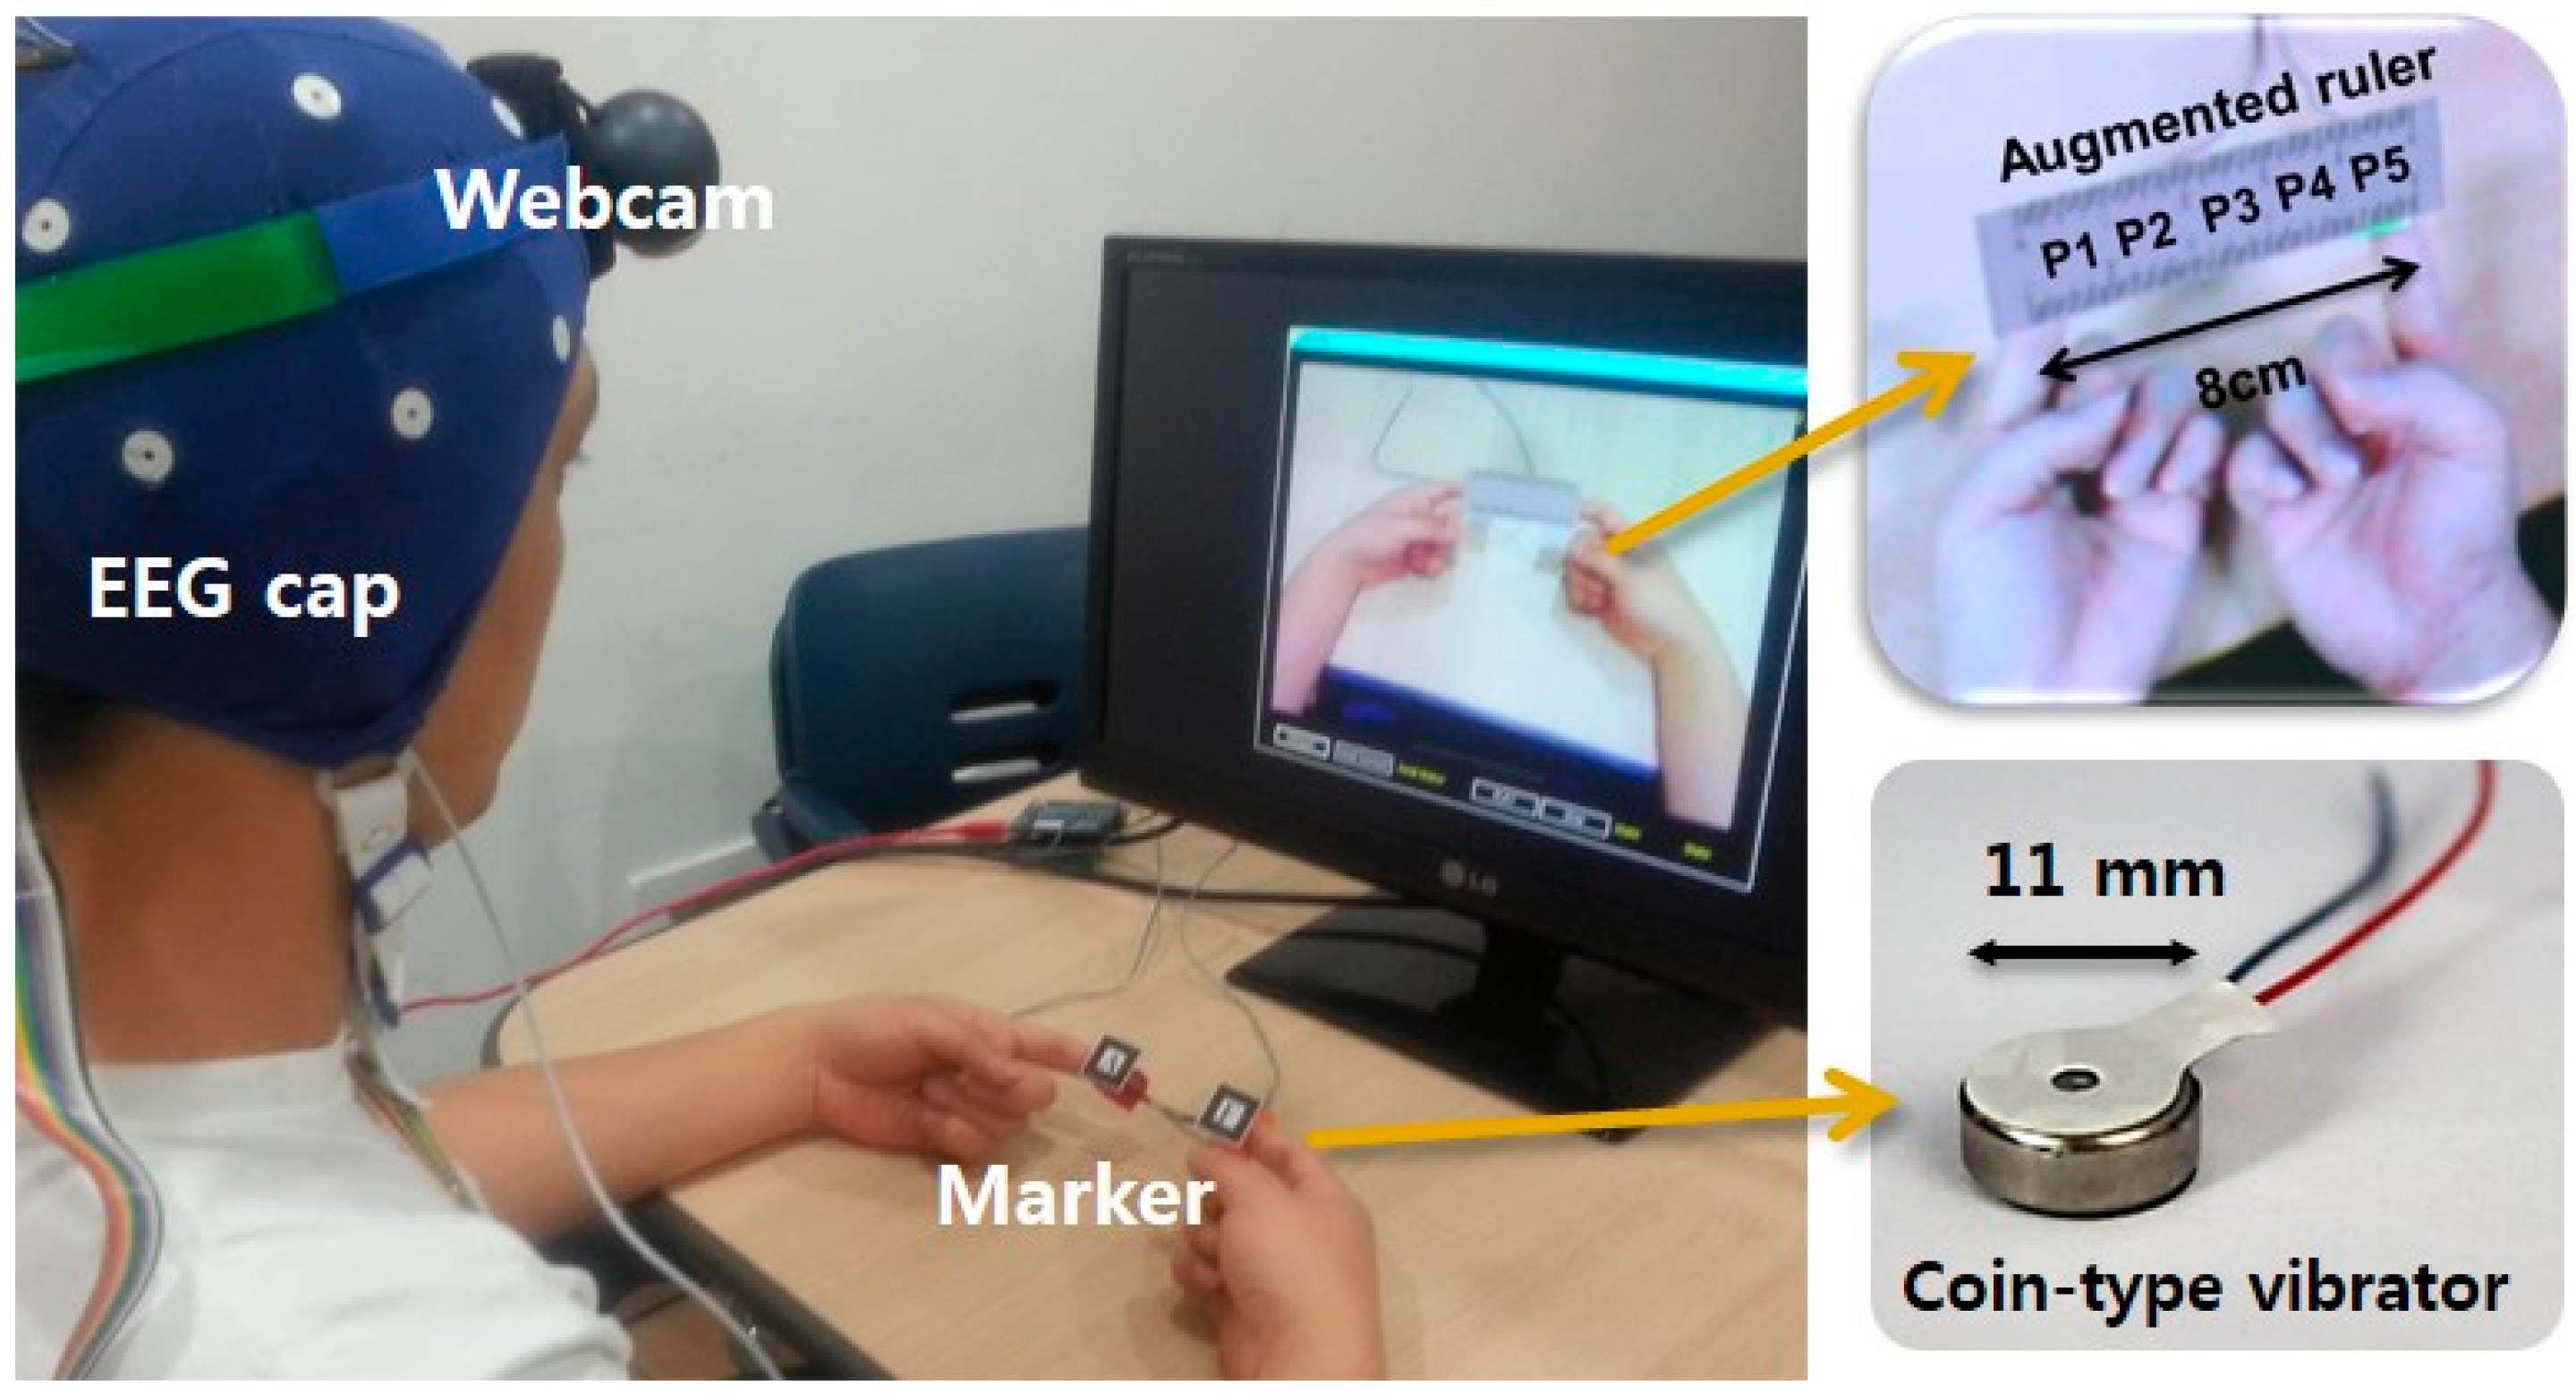
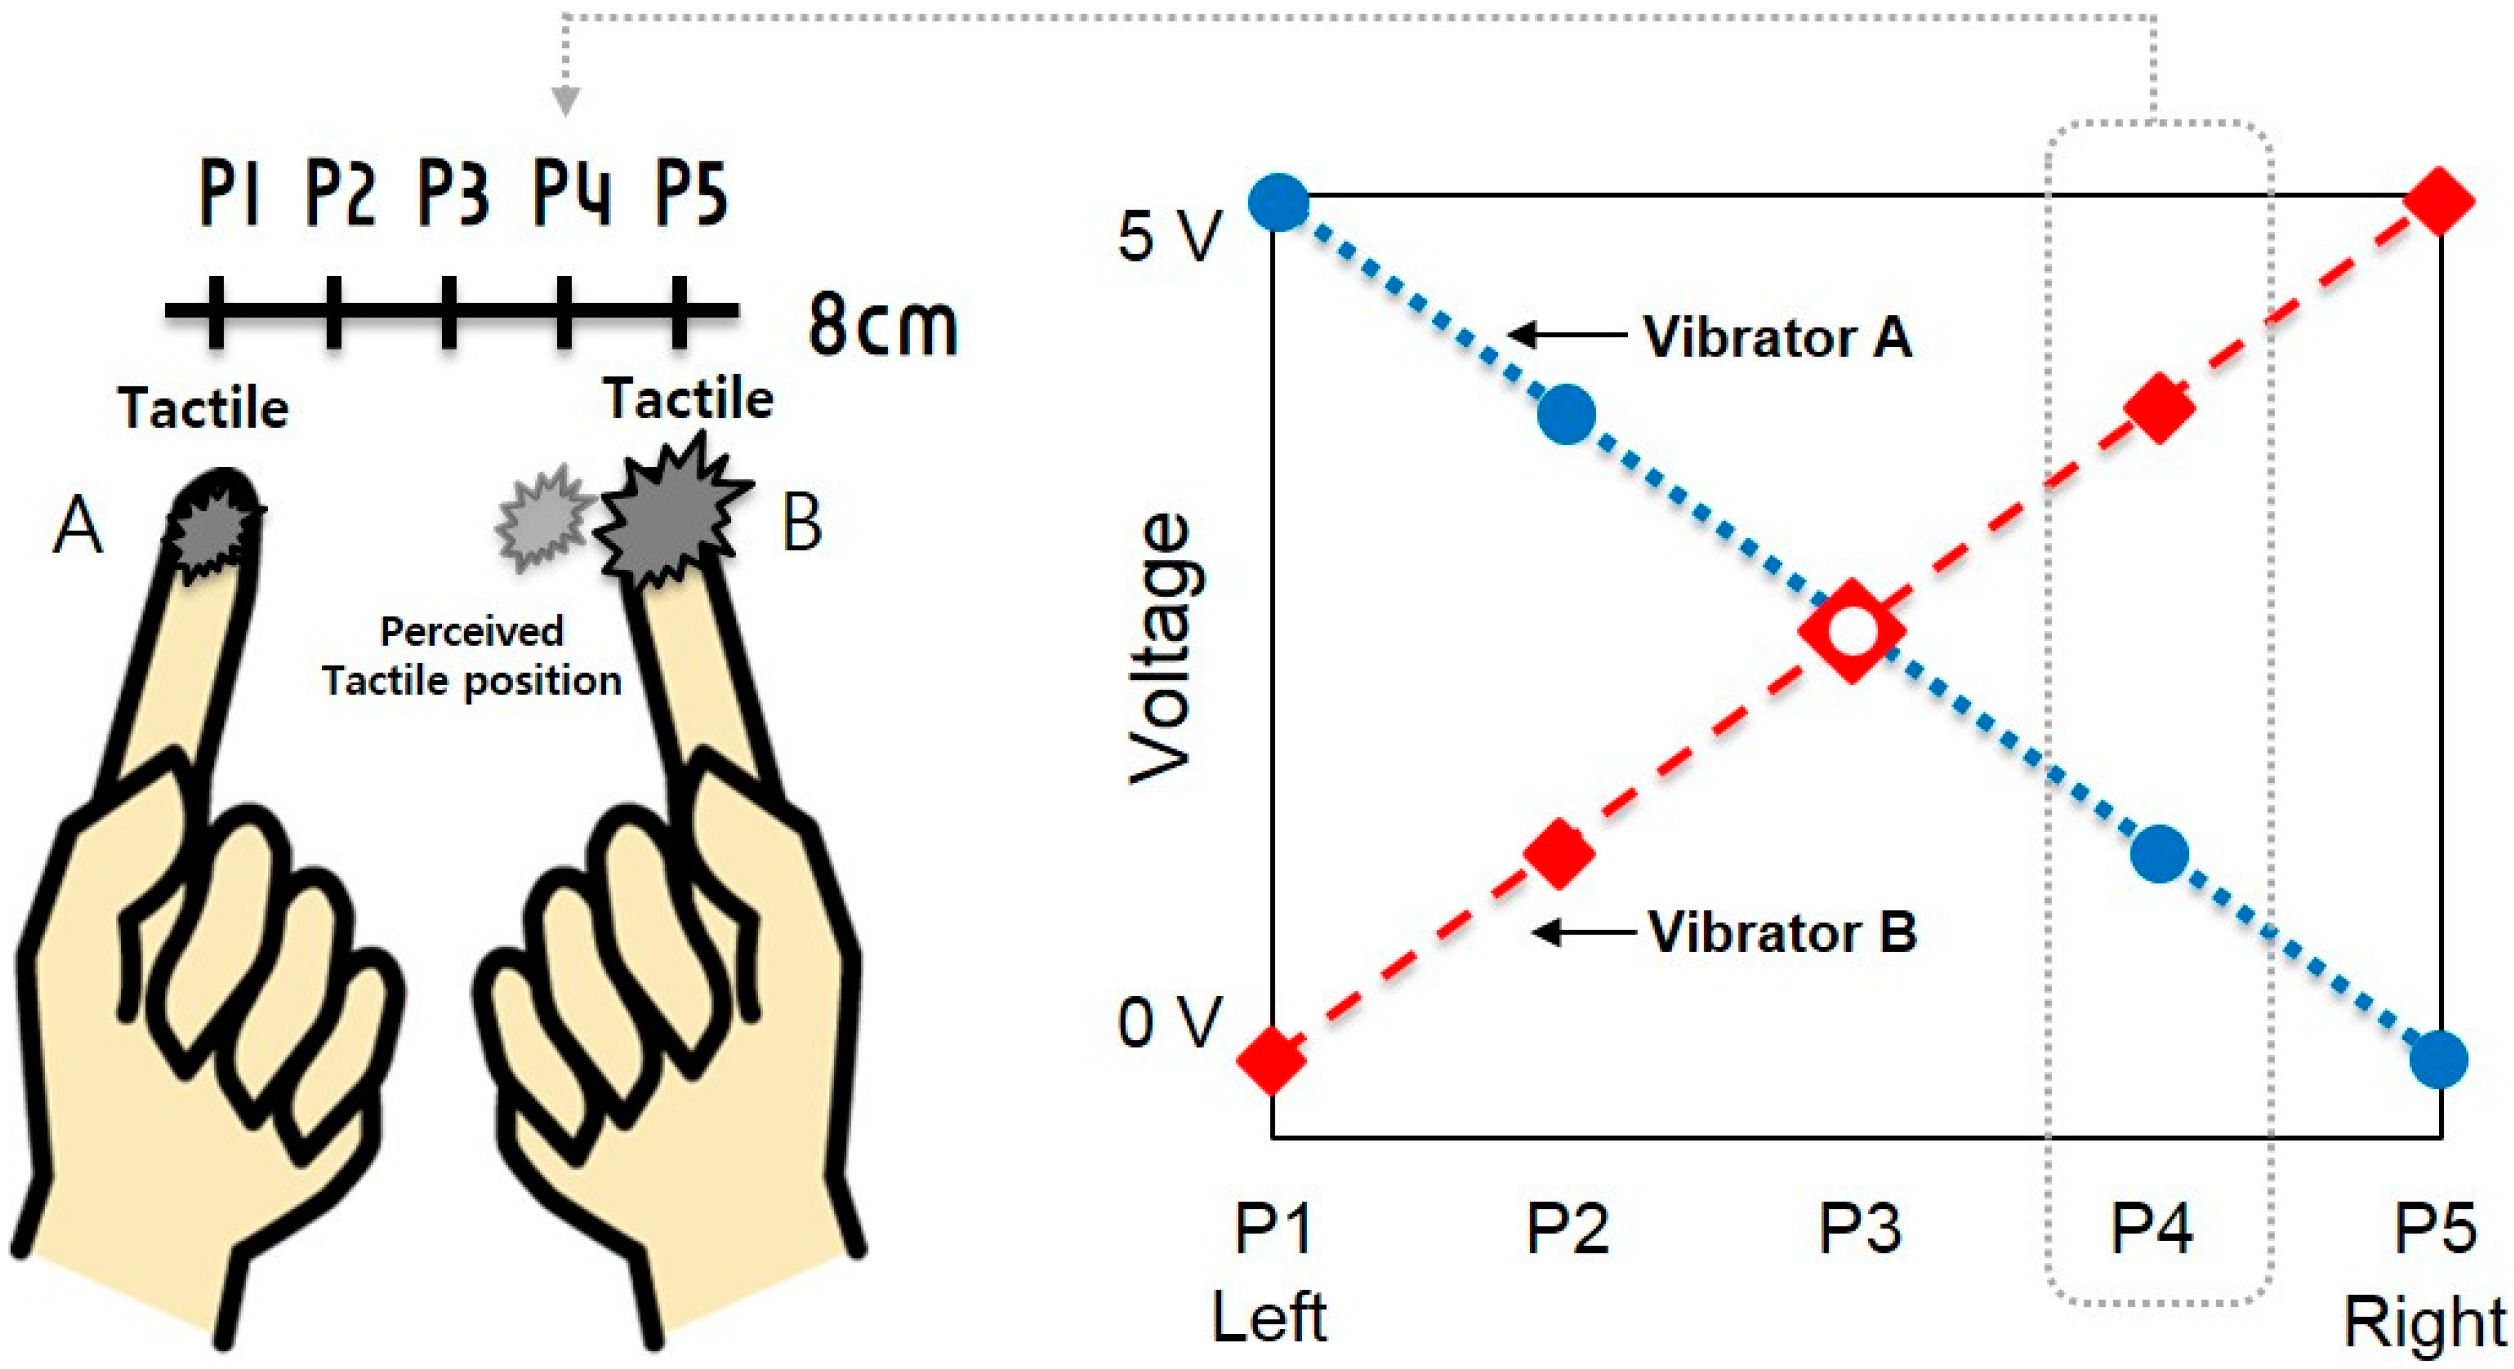
3.1. Experimental Setup


3.2. Experimental Task and Detailed Procedure

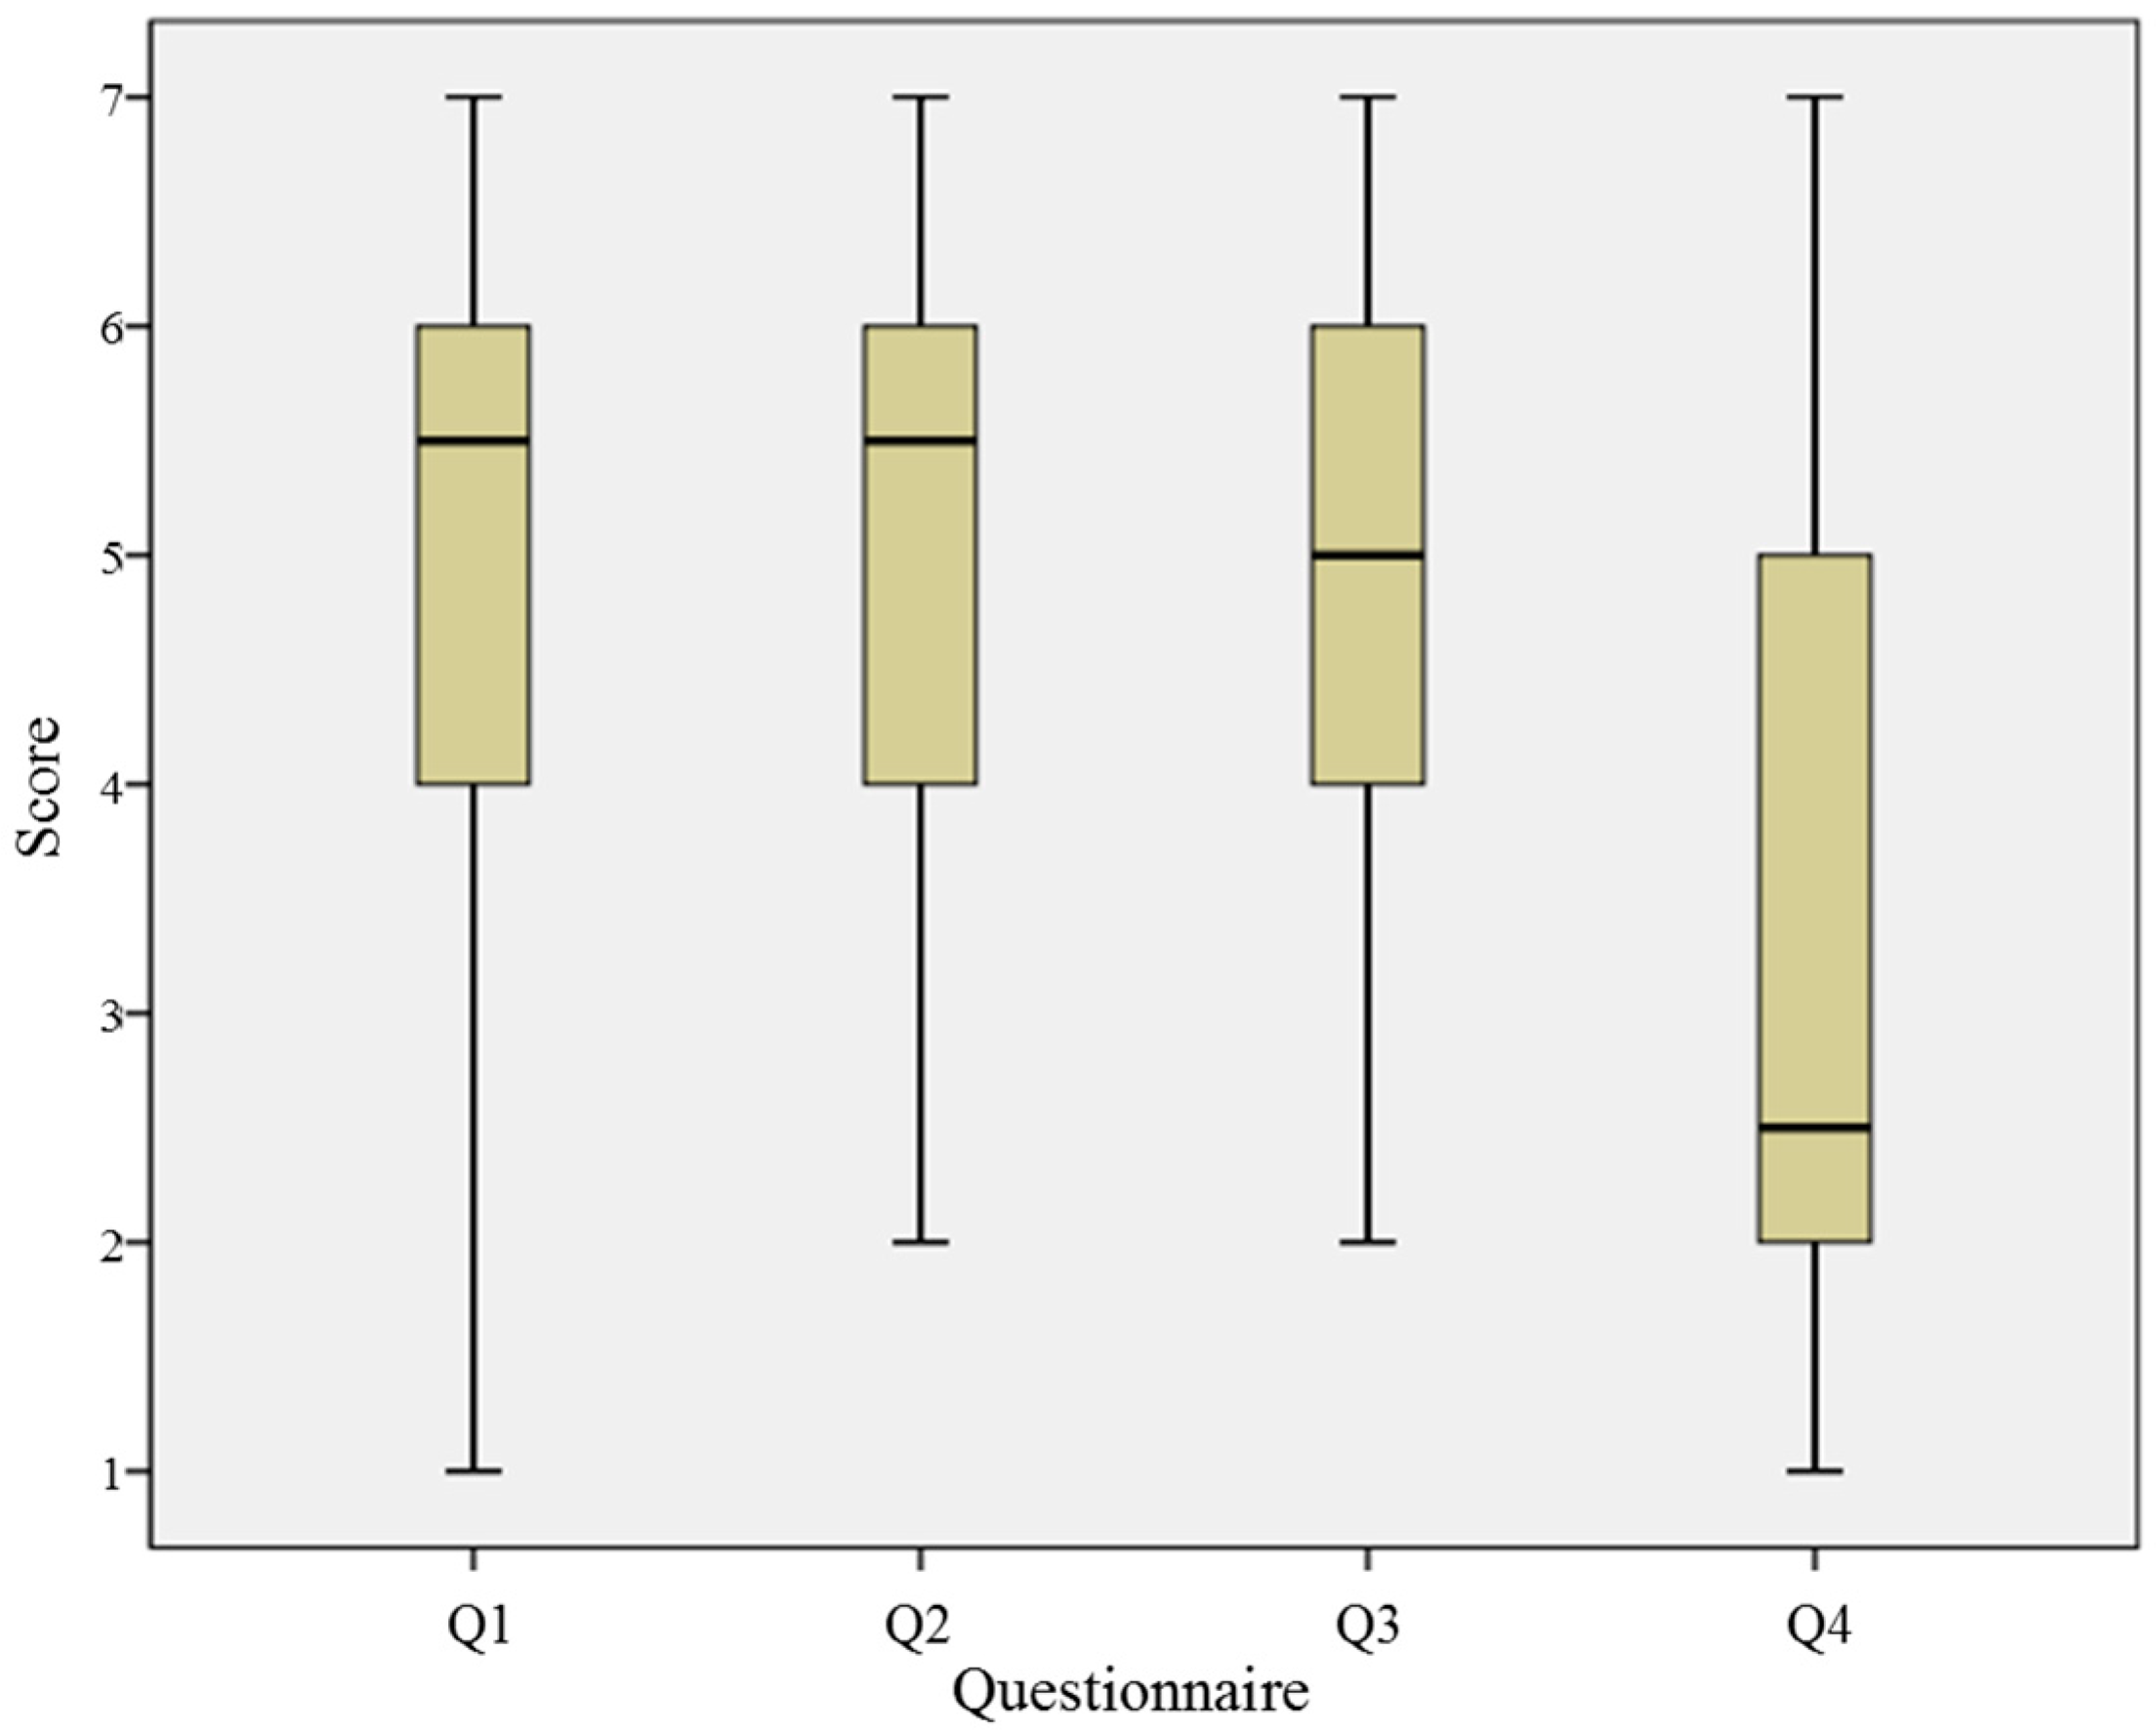
| Number | Question |
|---|---|
| Q1 | Were you able to perceive a sensation from an empty space between the two index fingers? (1: not at all ~7: very well) |
| Q2 | Could you perceive the location of stimulation? (1: not at all ~7: very well) |
| Q3 | How long did it take you to perceive the tactile feedback, if any? (1: instantly ~4: 1–2 s ~7: more than 3 sec) |
| Q4 | How certain are you about your answer overall to Q1, Q2 and Q3? (1: not certain at all ~7: very certain) |
4. Analysis Methods
| Categories of EEG Electrodes (Lobe) | Electrodes |
|---|---|
| Frontal lobe | Fp1, Fp2, F7, F3, Fz, F4, F8 |
| Temporal lobe | T3, T4, T5, T6 |
| Central lobe | C3, Cz, C4 |
| Parietal lobe | P3, Pz, P4 |
| Occipital lobe | O1, O2 |
- (1)
- There exist significant differences in ERP responses between the veridical and illusory conditions (Mann–Whitney U test/Kruskal–Wallis test).
- (2)
- There exist significant differences in ERP responses among the veridical, close-illusory and far-illusory conditions (Kruskal–Wallis test).
5. Results
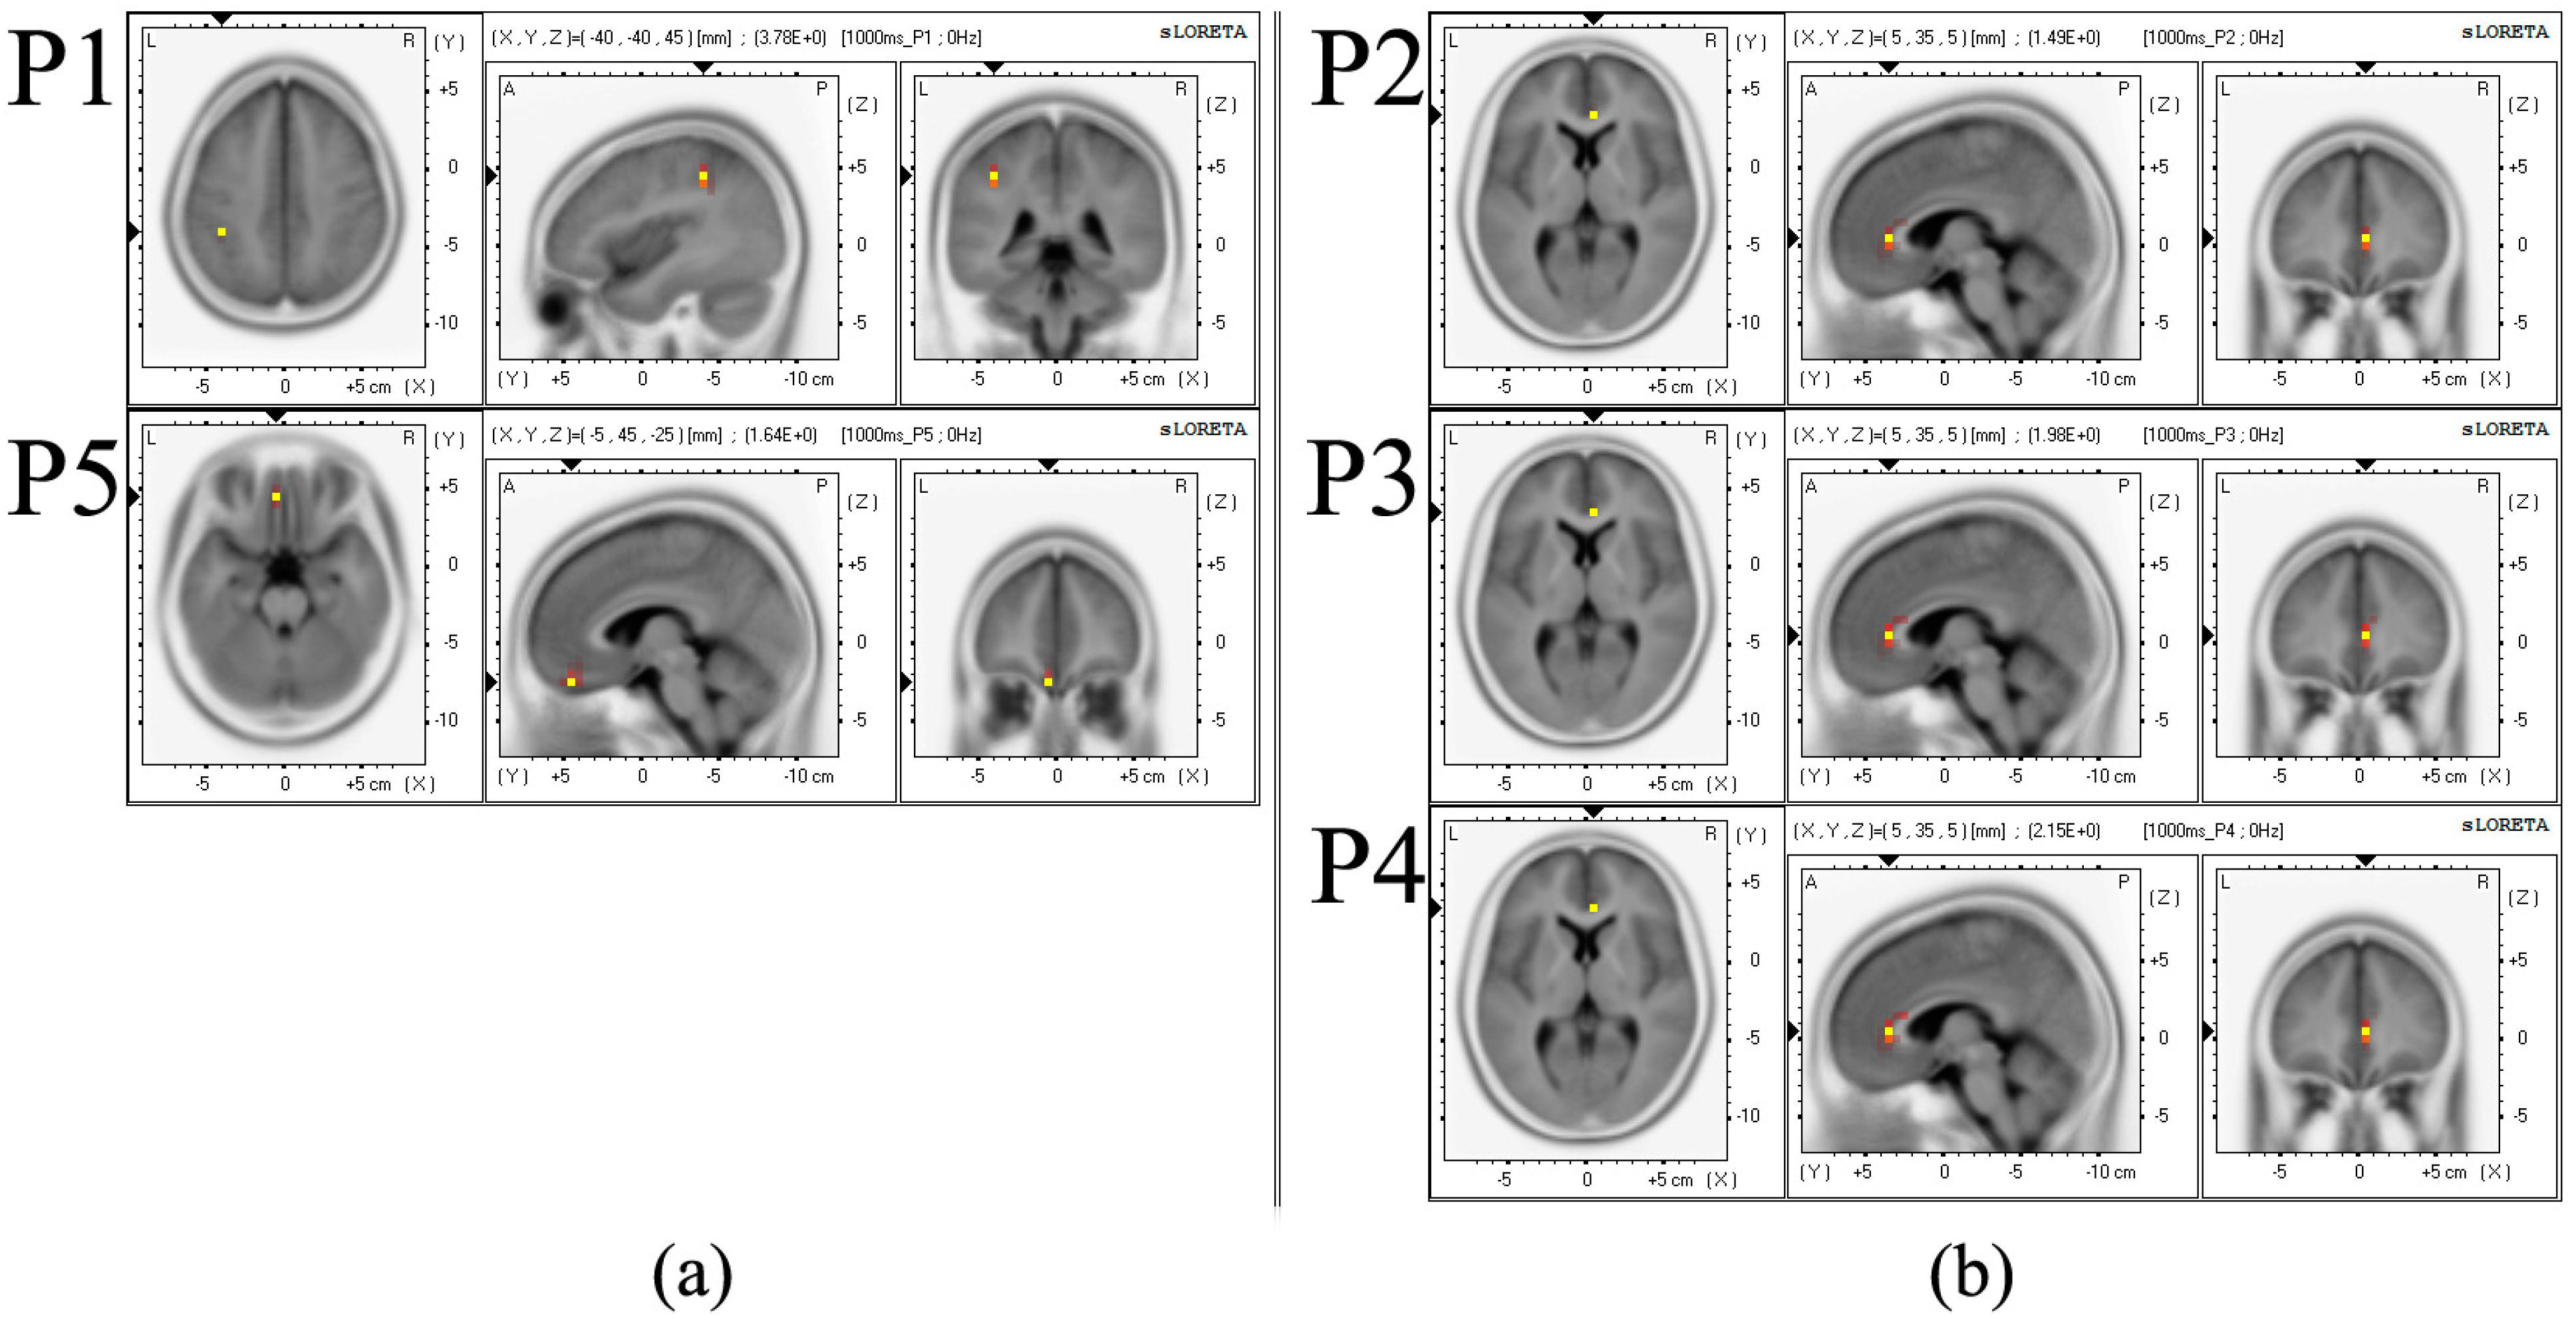
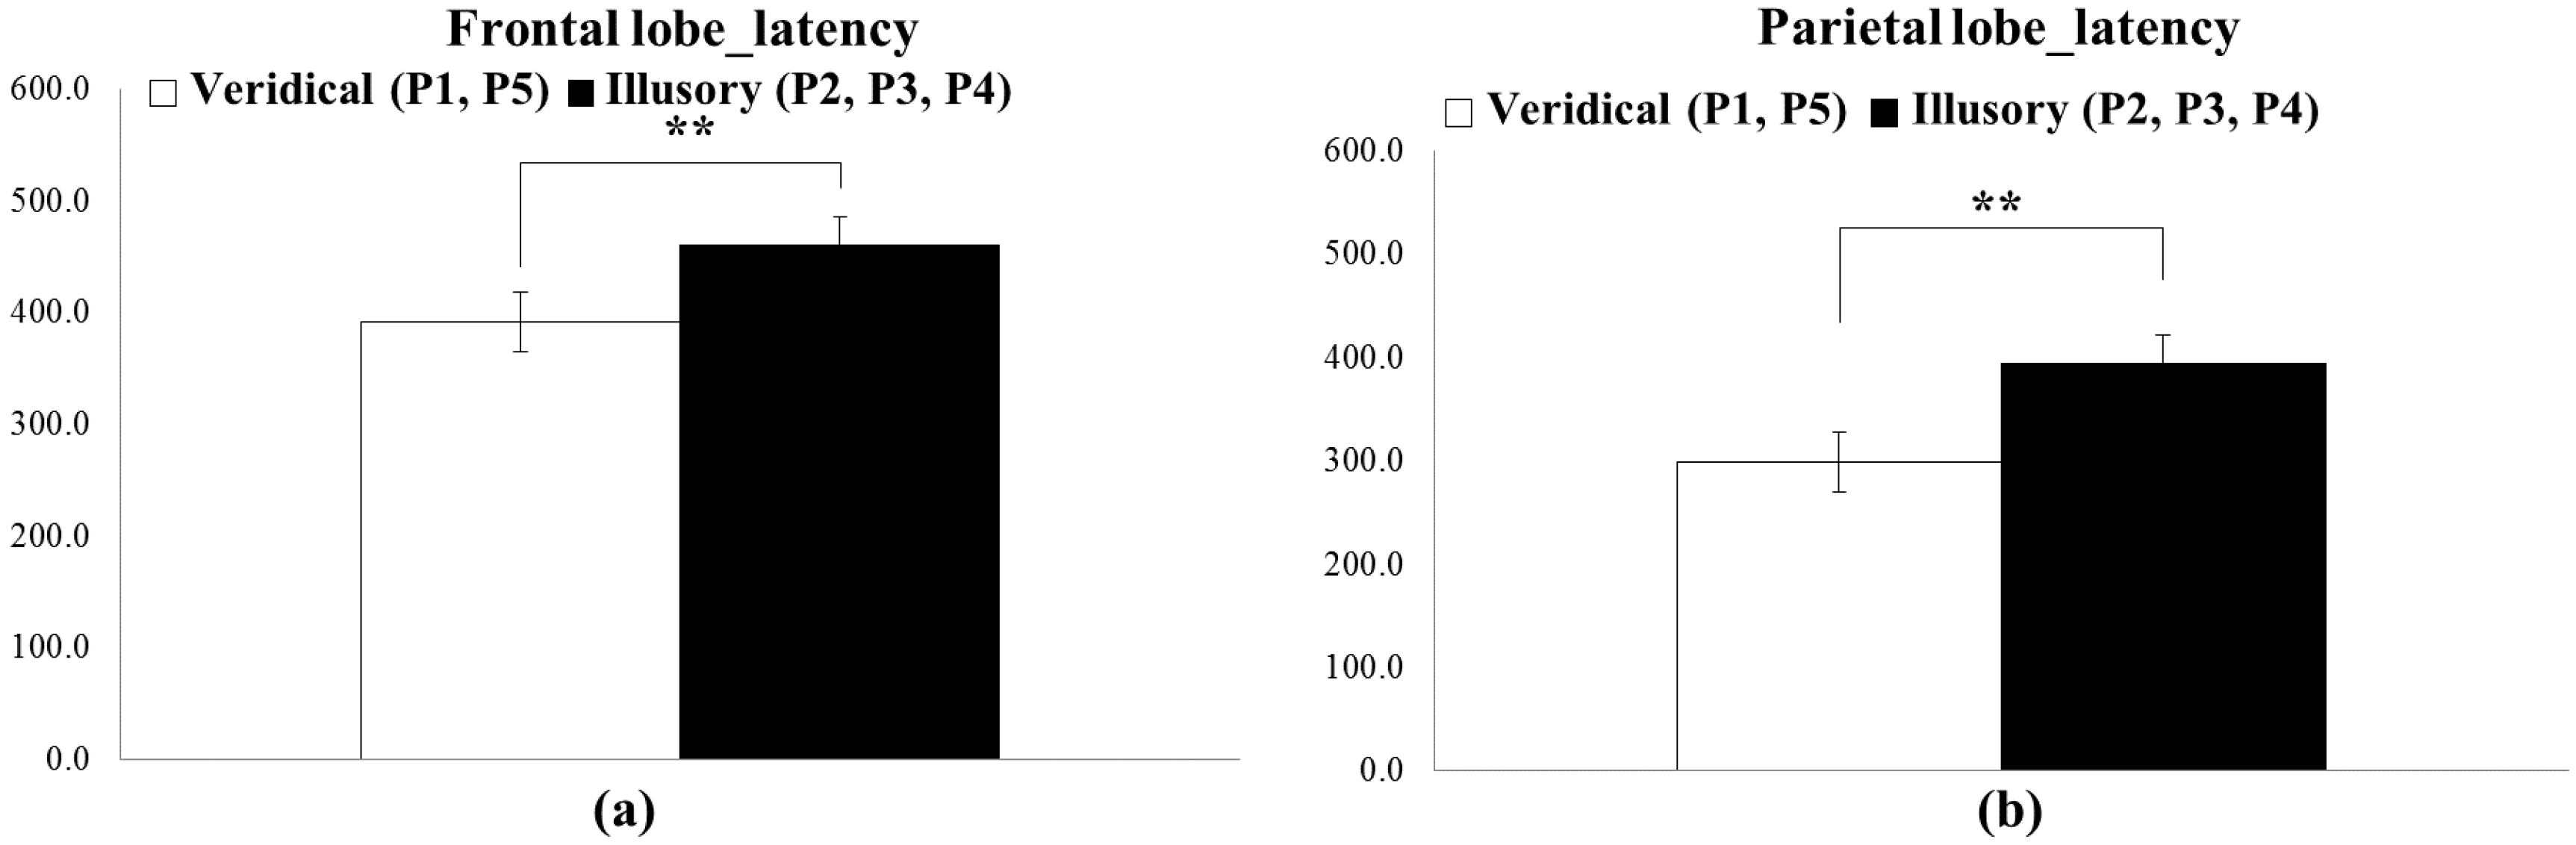
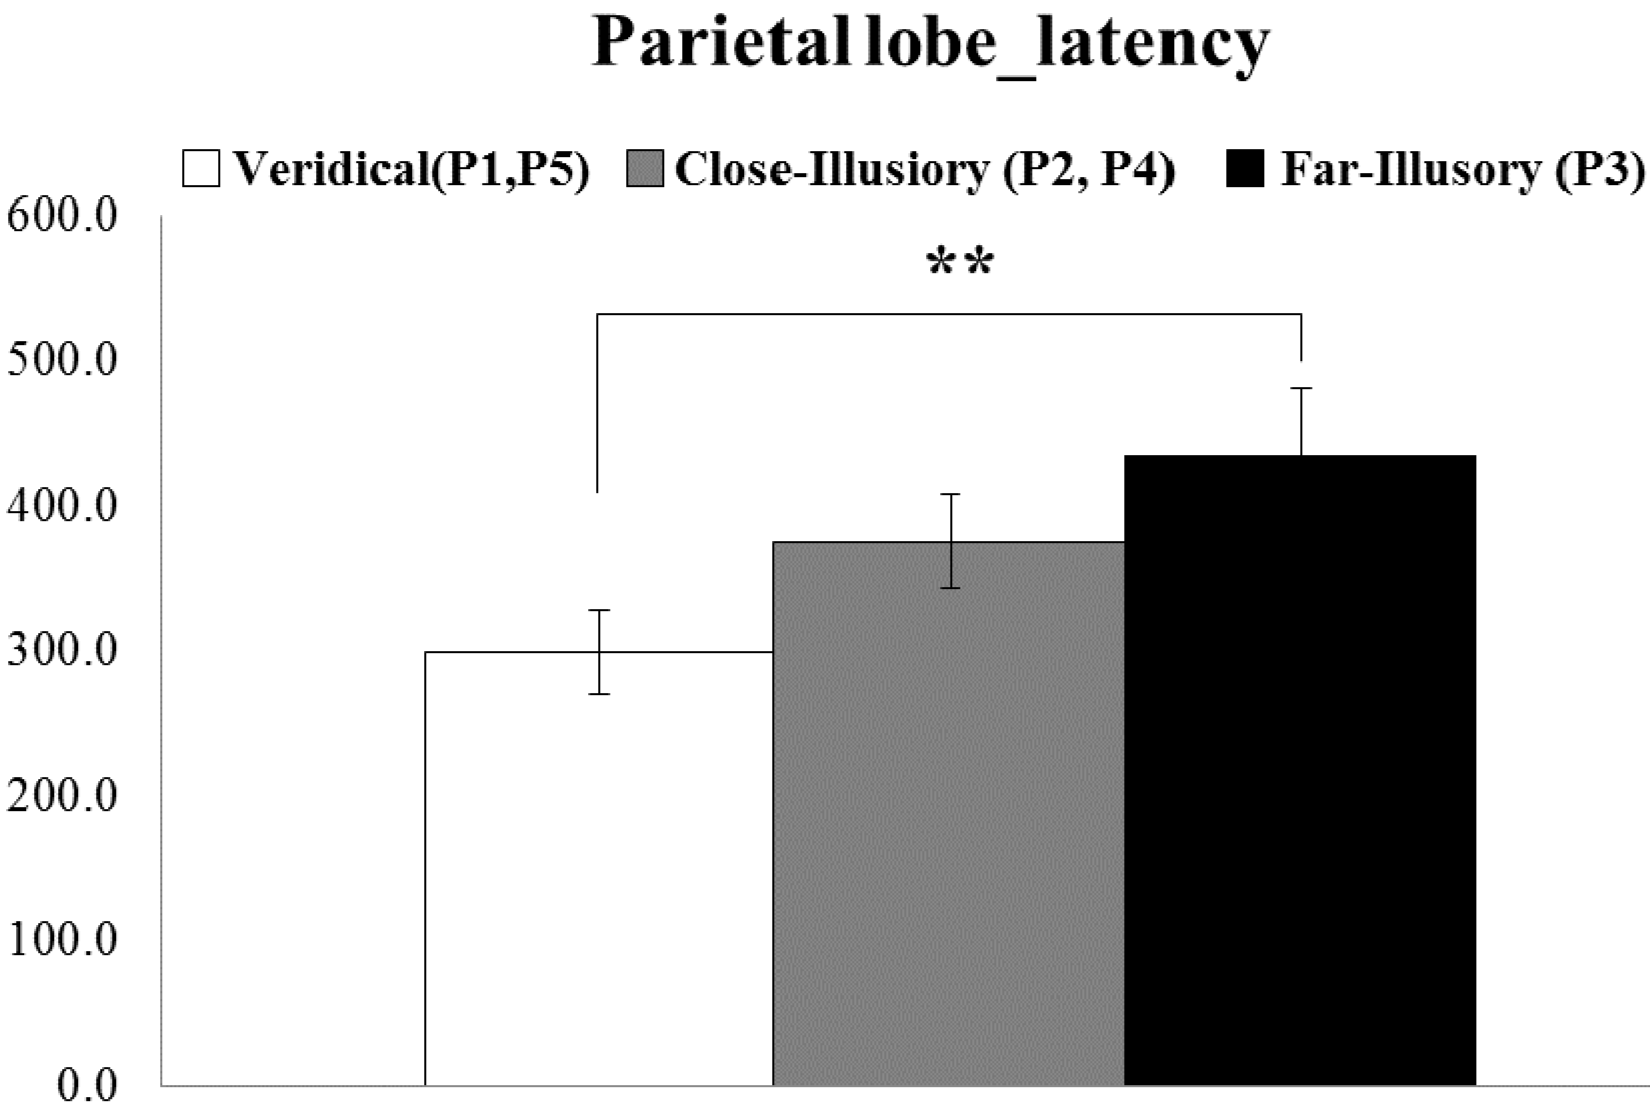
5.1. ERP Result

| Location | MNI (Montreal Neurological Institute) Coordinates | tStatistic | Brain Area | Brodmann Area | ||
|---|---|---|---|---|---|---|
| x | y | z | ||||
| Delta band | ||||||
| P1 * | −40 | −40 | 45 | 3.776 | inferior parietal lobule, parietal lobe | 40 |
| P2 * | 5 | 35 | 5 | 1.495 | anterior cingulate, limbic lobe | 24 |
| P3 * | 5 | 35 | 5 | 1.978 | anterior cingulate, limbic lobe | 24 |
| P4 * | 5 | 35 | 5 | 2.149 | anterior cingulate, limbic lobe | 24 |
| P5 * | −5 | 45 | −25 | 1.639 | Orbital gyrus, frontal lobe | 11 |
| Theta band | ||||||
| P1 | −45 | −45 | 55 | 2.505 | inferior parietal lobule, parietal lobe | 40 |
| P2 | −55 | 35 | 0 | 0.873 | inferior frontal gyrus, frontal lobe | 47 |
| P3 | 10 | 25 | 25 | 1.041 | anterior cingulate, limbic lobe | 32 |
| P4 | −5 | 35 | −25 | 1.319 | rectal gyrus, frontal lobe | 11 |
| P5 | −55 | 35 | 0 | 1.096 | inferior frontal gyrus, frontal lobe | 47 |
| Alpha-1 band | ||||||
| P1 | −45 | −45 | 55 | 1.554 | inferior parietal lobule, parietal lobe | 40 |
| P2 * | −25 | 35 | −5 | 1.279 | inferior frontal gyrus, frontal lobe | 47 |
| P3 * | −5 | 30 | −20 | 1.150 | medial frontal gyrus, frontal lobe | 25 |
| P4 * | −25 | 30 | −5 | 1.144 | inferior frontal gyrus, frontal lobe | 47 |
| P5 * | −45 | 35 | −10 | 1.302 | inferior frontal gyrus, frontal lobe | 47 |
| Alpha-2 band | ||||||
| P1 | −50 | −45 | 55 | 1.131 | inferior parietal lobule, parietal lobe | 40 |
| P2 | −5 | 30 | −25 | 0.548 | rectal gyrus, frontal lobe | 11 |
| P3 | 5 | 50 | 40 | 0.800 | medial frontal gyrus, frontal lobe | 9 |
| P4 | 5 | 20 | −5 | 0.650 | anterior cingulate, limbic lobe | 25 |
| P5 | −5 | 55 | 40 | 0.524 | medial frontal gyrus, frontal lobe | 9 |
| Beta-1 band | ||||||
| P1 | −40 | −45 | 45 | 0.880 | inferior parietal lobule, parietal lobe | 40 |
| P2 | 5 | 25 | 15 | 0.586 | anterior cingulate, limbic lobe | 24 |
| P3 | 5 | −50 | 70 | 0.797 | postcentral gyrus, limbic lobe | 5 |
| P4 | 5 | 25 | 15 | 0.650 | anterior cingulate, limbic lobe | 24 |
| P5 | 5 | 30 | 20 | 0.540 | anterior cingulate, limbic lobe | 24 |
| Beta-2 band | ||||||
| P1 | −35 | −50 | 45 | 0.512 | inferior parietal lobule, parietal lobe | 40 |
| P2 | −60 | −55 | 70 | 0.325 | middle temporal gyrus, temporal lobe | 37 |
| P3 | −5 | −55 | 70 | 0.599 | postcentral gyrus, parietal lobe | 7 |
| P4 | −65 | −50 | 70 | 0.401 | superior temporal gyrus, temporal lobe | 22 |
| P5 | −60 | −65 | 70 | 0.336 | inferior temporal gyrus, temporal lobe | 37 |
| Beta-3 band | ||||||
| P1 | −35 | −50 | 45 | 0.512 | inferior parietal lobule, parietal lobe | 40 |
| P2 | 10 | −60 | 70 | 0.325 | postcentral gyrus, parietal lobe | 7 |
| P3 | 5 | −50 | 70 | 0.599 | postcentral gyrus, parietal lobe | 5 |
| P4 | 10 | −55 | 70 | 0.401 | postcentral gyrus, parietal lobe | 7 |
| P5 | 5 | −55 | 70 | 0.336 | postcentral gyrus, parietal lobe | 7 |
| Gamma band | ||||||
| P1 | −15 | −55 | 60 | 0.529 | superior parietal lobule, parietal lobe | 7 |
| P2 | −5 | −50 | 60 | 0.481 | precuneus, parietal lobe | 7 |
| P3 | −5 | −50 | 60 | 0.576 | precuneus, parietal lobe | 7 |
| P4 | −5 | −50 | 60 | 0.611 | precuneus, parietal lobe | 7 |
| P5 | −5 | −50 | 55 | 0.503 | precuneus, parietal lobe | 7 |
5.3. Subjective Questionnaires
6. Discussion
7. Conclusions
Acknowledgments
Author Contributions
Conflicts of Interest
References
- Borst, C.W.; Cavanaugh, C.D. Haptic Controller Design and Palm-sized Vibrotactile Array; Technical Report, Center for Advanced Computer Studies, University of Louisiana at Lafayette: Lafayette, LA, USA, 2004. [Google Scholar]
- Borst, C.W.; Baiyya, V.B. Enhancing VR-based Visualization with a 2D Vibrotactile Array. In Proceedings of the 2007 ACM Symposium on Virtual Reality Software and Technology, Newport Beach, CA, USA, 7 November 2007; pp. 183–186.
- Yang, G.; Jin, M.; Jin, Y.; Kang, S. T-mobile: Vibrotactile Display pad with Spatial and Directional Information for Hand-held Device. In Proceedings of the Intelligent Robots and Systems (IROS), 2010 IEEE/RSJ International Conference on Taipei International Convention Center, Taipei, Taiwan, 18–22 October 2010; pp. 5245–5250.
- Piateski, E.; Jones, L. Vibrotactile Pattern Recognition on the Arm and Torso. In Proceedings of the First JointEurohaptics Conferenceand Symposium on Haptic Interfaces for Virtual Environment and Teleoperator Systems, World Haptics 2005, Pisa, Italy, 18–20 March 2005; pp. 90–95.
- Geldard, F.A.; Sherrick, C.E. The Cutaneous “Rabbit”: A Perceptual Illusion. Science 1972, 178, 178–179. [Google Scholar] [CrossRef] [PubMed]
- Flach, R.; Haggard, P. The cutaneous rabbit revisited. J. Exp. Psychol.Hum. Percept. Perform. 2006, 32, 717–732. [Google Scholar] [CrossRef] [PubMed]
- Alles, D.S. Information transmission by phantom sensations. IEEE Trans. Man-Mach. Syst. 1970, 11, 85–91. [Google Scholar] [CrossRef]
- Chen, L.M.; Friedman, R.M.; Roe, A.W. Optical imaging of a tactile illusion in area 3b of the primary somatosensory cortex. Science 2003, 302, 881–885. [Google Scholar] [CrossRef] [PubMed]
- Gardner, E.P.; Spencer, W.A. Sensory funneling. I. Psychophysical observations of human subjects and responses of cutaneous mechanoreceptive afferents in the cat to patterned skin stimuli. J. Neurophysiol. 1972, 35, 925–953. [Google Scholar] [PubMed]
- Miyazaki, M.; Hirashima, M.; Nozaki, D. The “cutaneous rabbit” hopping out of the body. J. Neurosci. 2010, 30, 1856–1860. [Google Scholar] [CrossRef] [PubMed]
- Eimer, M.; Forster, B.; Vibell, J. Cutaneous saltation within and across arms: A new measure of the saltation illusion in somatosensation. Percept. Psychophys. 2005, 67, 458–468. [Google Scholar] [CrossRef] [PubMed]
- Kim, Y.; Lee, J.; Kim, G. Extending out of the Body Saltation to 2D Mobile Tactile Interaction. In Proceedings of the 10th asia pacific conference on Computer human interaction, Matsue, Japan, 30 August 2012; pp. 67–74.
- Lipari, N.G.; Borst, C.W. Study of 2D Vibration Summing for Improved Intensity Control in Vibrotactile Array Rendering. Adv. Vis. Comput. 2014, 8888, 325–334. [Google Scholar]
- Lee, J.; Kim, Y.; Kim, G. Funneling and Saltation Effects for Tactile Interaction with Virtual Objects. In Proceedings of the ACM SIGCHI Conference on Human Factors in Computing Systems, Austin, TX, USA, 10 May 2012; pp. 3141–3148.
- Chen, L.M.; Turner, G.H.; Friedman, R.M.; Zhang, N.; Gore, J.C.; Roe, A.W.; Avison, M.J. High-resolution maps of real and illusory tactile activation in primary somatosensory cortex in individual monkeys with functional magnetic resonance imaging and optical imaging. J. Neurosci. 2007, 27, 9181–9191. [Google Scholar] [CrossRef] [PubMed]
- Chen, L.M.; Friedman, R.; Roe, A.W. Somatosensory: Imaging Tactile Perception. In Imaging the Brain with Optical Methods; Springer: NewYork, NY, USA, 2010; pp. 65–92. [Google Scholar]
- Gross, L. Classic illusion sheds new light on the neural site of tactile perception. PLoS Biol. 2006, 4. [Google Scholar] [CrossRef]
- Cohen, M.J.; Ament, P.A.; Schandler, S.L.; Vulpe, M. Changes in the P300 component of the tactile event-related potential following spinal cord injury. Spinal Cord 1996, 34, 107–112. [Google Scholar] [CrossRef]
- Mitsudo, T.; Gagnon, C.; Takeichi, H.; Grondin, S. An electroencephalographic investigation of the filled-duration illusion. Front. Integr. Neurosci. 2011, 5. [Google Scholar] [CrossRef]
- Petsche, H.; Pockberger, H.; Rappelsberger, P. EEG Topography and Mental Performance. In Topographic Mapping of Brain Electrical Activity; Butterworth Publishers: Stoneham, MA, USA, 1986. [Google Scholar]
- Sauseng, P.; Klimesch, W.; Stadler, W.; Schabus, M.; Doppelmayr, M.; Hanslmayr, S.; Birbaumer, N. A shift of visual spatial attention is selectively associated with human EEG alpha activity. Eur. J. Neurosci. 2005, 22, 2917–2926. [Google Scholar] [CrossRef] [PubMed]
- Gevins, A.S.; Zeitlin, G.M.; Doyle, J.C.; Yingling, C.D.; Schaffer, R.E.; Callaway, E.; Yeager, C.L. Electroencephalogram correlates of higher cortical functions. Science 1979, 203, 665–668. [Google Scholar] [CrossRef] [PubMed]
- Jensen, O.; Kaiser, J.; Lachaux, J.P. Human gamma-frequency oscillations associated with attention and memory. Trends Neurosci. 2007, 30, 317–324. [Google Scholar] [CrossRef] [PubMed]
- Valentino, D.A.; Arruda, J.E.; Gold, S.M. Comparison of QEEG and response accuracy in good vs poorer performers during a vigilance task. Int. J. Psychophysiol. 1993, 15, 123–133. [Google Scholar] [CrossRef] [PubMed]
- Bekesy, G.V. Funneling in the nervous system and its role in loudness and sensation intensity on the skin. J. Acoust. Soc. Am. 1958, 30, 399–412. [Google Scholar] [CrossRef]
- Barghout, A.; Cha, J.; el Saddik, A.; Kammerl, J.; Steinbach, E. Spatial Resolution of Vibrotactile Perception on the Human Forearm when Exploiting Funneling Illusion. In Proceedings of the IEEE International Workshop on Haptic Audio visual Environments and Games, Lecco, Italy, 7–8 November 2009; pp. 19–23.
- Rahal, L.; Cha, J.; El Saddik, A.; Kammerl, J.; Steinbach, E. Investigating the Influence of Temporal Intensity Changes on Apparent Movement Phenomenon. In Proceedings of the 2009 IEEE International Conference on Virtual Environments, Human-Computer Interfaces and Measurement Systems (VECIMS), Hong Kong, China, 11–13 May 2009; pp. 310–313.
- Mizukami, Y.; Sawada, H. Tactile information transmission by apparent movement phenomenon using shape-memory alloy device. Int. J. Disabil. Hum. Dev. 2006, 5, 277–284. [Google Scholar] [CrossRef]
- Tan, H.Z.; Pentland, A. Tactual displays for wearable computing. Pers. Technol. 1997, 1, 225–230. [Google Scholar] [CrossRef]
- Ramachandran, V.S.; Blakeslee, S.; Sacks, O.W. Phantoms in the Brain: Probing the Mysteries of the Human Mind; William Morrow Paperbacks: New York, NY, USA, 1998. [Google Scholar]
- Bark, K.; Hyman, E.; Tan, F.; Cha, E.; Jax, S.A.; Buxbaum, L.J.; Kuchenbecker, K.J. Effects of Vibrotactile Feedback on Human Learning of Arm Motions. IEEE Trans. Neural Syst. Rehabil. Eng. 2014, 23, 51–63. [Google Scholar] [CrossRef] [PubMed]
- Ma, K.; Hommel, B. The virtual-hand illusion: Effects of impact and threat on perceived ownership and affective resonance. Front. Psychol. 2014, 4. [Google Scholar] [CrossRef]
- Ehrsson, H.H.; Holmes, N.P.; Passingham, R.E. Touching a rubber hand: feeling of body ownership is associated with activity in multisensory brain areas. J. Neurosci. 2005, 25, 10564–10573. [Google Scholar] [CrossRef] [PubMed]
- Slater, M.; Perez-Marcos, D.; Ehrsson, H.H.; Sanchez-Vives, M.V. Towards a digital body: The virtual arm illusion. Front. Hum. Neurosci. 2008, 2. [Google Scholar] [CrossRef]
- Sanchez-Vives, M.V.; Spanlang, B.; Frisoli, A.; Bergamasco, M.; Slater, M. Virtual hand illusion induced by visuomotor correlations. PLoS ONE 2010, 5, e10381. [Google Scholar] [CrossRef] [PubMed]
- Padilla-Castañeda, M.A.; Frisoli, A.; Pabon, S.; Bergamasco, M. The modulation of ownership and agency in the virtual hand illusion under visuotactile and visuomotor sensory feedback. Presence 2014, 23, 209–225. [Google Scholar] [CrossRef]
- Blankenburg, F.; Ruff, C.C.; Deichmann, R.; Rees, G.; Driver, J. The cutaneous rabbit illusion affects human primary sensory cortex somatotopically. PLoS Biol. 2006, 4, e69. [Google Scholar] [CrossRef] [PubMed]
- Bäckman, L.; Almkvist, O.; Andersson, J.; Nordberg, A.; Winblad, B.; Reineck, R.; Långström, B. Brain activation in young and older adults during implicit and explicit retrieval. J. cogn. neurosci. 1997, 9, 378–391. [Google Scholar] [CrossRef]
- Shared Space/ARToolKit Download Page. Available online: http://www.hitl.washington.edu/ARToolKit/ (accessed on 13 November 2014).
- Arduino. Available online: http://www.arduino.cc/ (accessed on 13 November 2014).
- Jahwa Electronics. Available online: http://www.jahwa.co.kr/ (accessed on 13 November 2014).
- Jung, J.; Choi, S. Perceived Magnitude and Power Consumption of Vibration Feedback in Mobile Devices. In Proceedings of the 12th International Conference on Human-Computer Interaction. Interaction Platforms and Techniques, Beijing, China, 22–27 July 2007; pp. 354–363.
- Burdea, G.; Coiffet, P. Virtual Reality Technology; John Wiley & Sons: Hoboken, NJ, USA, 2003; pp. 663–664. [Google Scholar]
- Sherrick, C.E. A scale for rate of tactual vibration. J. Acoust. Soc. Am. 1985, 78, 78–83. [Google Scholar] [CrossRef] [PubMed]
- Jasper, H.H. The ten twenty electrode system of the international federation. Electroencephalogr. Clin. Neurophysiol. 1958, 10, 371–375. [Google Scholar]
- Jolliffe, I.T. Principal Component Analysis (Springer Series in Statistics), 2nd ed.; Springer: New York, NY, USA, 2002. [Google Scholar]
- Carter, R. The Human Brain Book; Penguin: Melbourne, Australia, 2014. [Google Scholar]
- Ros, T.; Théberge, J.; Frewen, P.A.; Kluetsch, R.; Densmore, M.; Calhoun, V.D.; Lanius, R.A. Mind over chatter: Plastic up-regulation of the fMRI salience network directly after EEG neurofeedback. Neuroimage 2013, 65, 324–335. [Google Scholar] [CrossRef] [PubMed]
- Zaehle, T.; Sandmann, P.; Thorne, J.D.; Jäncke, L.; Herrmann, C.S. Transcranial direct current stimulation of the prefrontal cortex modulates working memory performance: Combined behavioural and electrophysiological evidence. BMC Neurosci. 2011, 12. [Google Scholar] [CrossRef]
- Zhuang, X.; Sekiyama, K.; Fukuda, T. Evaluation of Human Sense by Biological Information Analysis. In Proceedings of the IEEE International Symposium on Micro-NanoMechatronics and Human Science (MHS), Nagoya, Japan, 9 November 2009; pp. 74–79.
- Brouwer, A.M.; van Erp, J.B. A tactile P300 brain-computer interface. Front. Neurosci. 2010, 19. [Google Scholar] [CrossRef]
- Pascual-Marqui, R. Standardized low-resolution brain electromagnetic tomography (sLORETA): Technical details. Methods Find. Exp. Clin. Pharmacol. 2002, 24, 5–12. [Google Scholar] [PubMed]
- Dolce, G.; Waldeier, H. Spectral and multivariate analysis of EEG changes during mental activity in man. Electroen. Clin. Neurosci. 1974, 36, 577–584. [Google Scholar] [CrossRef]
- Kakizaki, T. Evaluation of mental task strain based on occipital beta activity and subjective rating of task difficulty. Eur. J. Appl. Physiol. 1985, 54, 466–470. [Google Scholar] [CrossRef]
- Tucker, D.M.; Dawson, S.L.; Roth, D.L.; Penland, J.G. Regional changes in EEG power and coherence during cognition: Intensive study of two individuals. Behav. neurosci. 1985, 99, 564–577. [Google Scholar] [CrossRef] [PubMed]
- Cohen, D. Secret Language of the Mind: A Visual Inquiry Into the Mysteries of Consciousness; Chronicle Books: San Francisco, CA, USA, 1996. [Google Scholar]
- Collins, M.L.; Nelson, C.A.; Luciana, M. Handbook of Developmental Cognitive Neuroscience; Nelson, C.A., Luciana, M., Eds.; The MIT Press: Cambridge, MA, USA, 2001. [Google Scholar]
- Funahashi, S.; Bruce, C.J.; Goldman-Rakic, P.S. Mnemonic coding of visual space in the monkey’s dorsolateral prefrontal cortex. J. Neurophysiol. 1989, 61, 331–349. [Google Scholar] [PubMed]
- Smith, E.E.; Jonides, J. Storage and executive processes in the frontal lobes. Science 1999, 283, 1657–1661. [Google Scholar] [CrossRef] [PubMed]
- Ohara, S.; Lenz, F.; Zhou, Y. Sequential neural processes of tactile–visual crossmodal working memory. Neuroscience 2006, 139, 299–309. [Google Scholar] [CrossRef] [PubMed]
- Fuster, J.M. The prefrontal cortex—An update: Time is of the essence. Neuron 2001, 30, 319–3331. [Google Scholar] [CrossRef] [PubMed]
- Carter, C.S.; Botvinick, M.M.; Cohen, J.D. The contribution of the anterior cingulate cortex to executive processes in cognition. Rev. Neurosci. 1999, 10, 49–58. [Google Scholar] [PubMed]
- Bachevalier, J.; Brickson, M.; Hagger, C. Limbic-dependent recognition memory in monkeys develops early in infancy. Neuroreport 1993, 4, 77–80. [Google Scholar] [CrossRef] [PubMed]
- Gloor, P.; Olivier, A.; Quesney, L.F.; Andermann, F.; Horowitz, S. The role of the limbic system in experiential phenomena of temporal lobe epilepsy. Ann. Neurol. 1982, 12, 129–144. [Google Scholar] [CrossRef] [PubMed]
- Reed, C.L.; Shoham, S.; Halgren, E. Neural substrates of tactile object recognition: An fMRI study. Hum. Brain. Map. 2004, 21, 236–246. [Google Scholar] [CrossRef]
- Benarroch, E.E. Basic Neurosciences with Clinical Applications; Elsevier Health Sciences: Amsterdam, The Netherlands, 2006. [Google Scholar]
- Milner, T.E.; Franklin, D.W.; Imamizu, H.; Kawato, M. Central control of grasp: Manipulation of objects with complex and simple dynamics. NeuroImage 2007, 36, 388–395. [Google Scholar] [CrossRef] [PubMed]
- Akatsuka, K.; Noguchi, Y.; Harada, T.; Sadato, N.; Kakigi, R. Neural codes for somatosensory two-point discrimination in inferior parietal lobule: An fMRI study. NeuroImage 2008, 40, 852–858. [Google Scholar] [CrossRef] [PubMed]
- ROLLS, E.T. 19. Multisensory Neuronal Convergence of Taste, Somatosensory, Visual, Olfactory, and Auditory Inputs. In The Handbook of Multisensory Processes; Stein, B.E., Ed.; MIT Press: London, UK, 2004; p. 312. [Google Scholar]
- Craig, A.D.; Reiman, E.M.; Evans, A.; Bushnell, M.C. Functional imaging of an illusion of pain. Nature 1996, 384, 258–260. [Google Scholar] [CrossRef] [PubMed]
- Devinsky, O.; Morrell, M.J.; Vogt, B.A. REVIEW ARTICLE Contributions of anterior cingulate cortex to behavior. Brain 1995, 118, 279–306. [Google Scholar] [CrossRef] [PubMed]
- Miller, G.A. The magical number seven, plus or minus two: Some limits on our capacity for processing information. Psychol. Rev. 1956, 63, 81–97. [Google Scholar] [CrossRef] [PubMed]
© 2015 by the authors; licensee MDPI, Basel, Switzerland. This article is an open access article distributed under the terms and conditions of the Creative Commons Attribution license (http://creativecommons.org/licenses/by/4.0/).
Share and Cite
Lee, H.J.; Lee, J.; Kim, C.J.; Kim, G.J.; Kim, E.-S.; Whang, M. Brain Process for Perception of the “Out of the Body” Tactile Illusion for Virtual Object Interaction. Sensors 2015, 15, 7913-7932. https://doi.org/10.3390/s150407913
Lee HJ, Lee J, Kim CJ, Kim GJ, Kim E-S, Whang M. Brain Process for Perception of the “Out of the Body” Tactile Illusion for Virtual Object Interaction. Sensors. 2015; 15(4):7913-7932. https://doi.org/10.3390/s150407913
Chicago/Turabian StyleLee, Hye Jin, Jaedong Lee, Chi Jung Kim, Gerard J. Kim, Eun-Soo Kim, and Mincheol Whang. 2015. "Brain Process for Perception of the “Out of the Body” Tactile Illusion for Virtual Object Interaction" Sensors 15, no. 4: 7913-7932. https://doi.org/10.3390/s150407913
APA StyleLee, H. J., Lee, J., Kim, C. J., Kim, G. J., Kim, E.-S., & Whang, M. (2015). Brain Process for Perception of the “Out of the Body” Tactile Illusion for Virtual Object Interaction. Sensors, 15(4), 7913-7932. https://doi.org/10.3390/s150407913