2.1. Differential Pressure Sensor for Wet-Wet Application
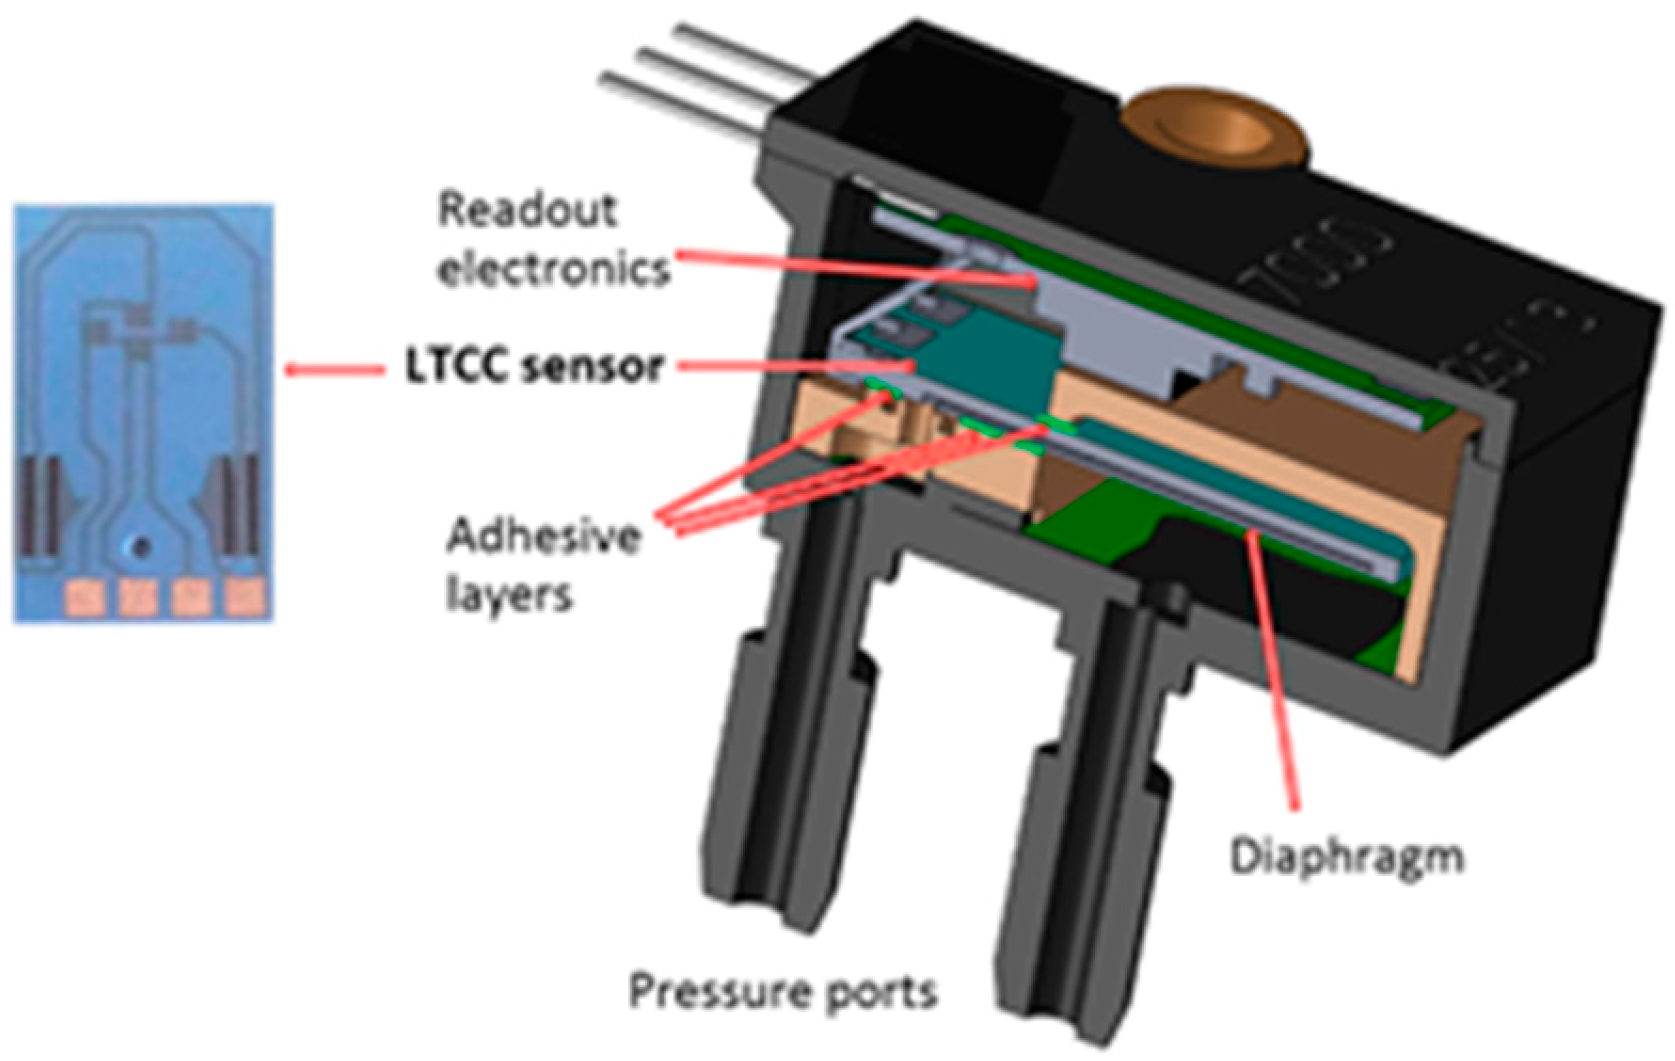
Differential pressure sensors (DPS) normally operate in direct contact with the pressure media on both pressure ports. When the medium is a liquid it is a wet-wet application. The sensor discussed in this paper was designed for measurement of the water pressure. Although the LTCC sensing structure itself can be compatible with this pressure media, the electric connections and the readout electronic must be protected from it. Therefore, similarly to micro-machined MEMS sensors, the relatively robust ceramic pressure sensor is enclosed in the housings having adequate pressure ports for the measured pressure media.
The heart of the DPS considered in this paper is an LTCC pressure sensor in the Wheatstone configuration (
Figure 1), which is a slightly modified successor of the sensors that have been proven appropriate for measurements of the air pressure in water-rich environments [
12]. For wet-wet measurements the functional thick-film resistors are covered with a thin protective film or are buried in an LTCC structure with the additional 50 µm LTCC layer on the top surface. The LTCC sensor is glued in an appropriate plastic housing where it is fixed in a cantilever form. The selected plastic housing serves as an alternative to a more expensive metal housing. A special two-part construction of the housing enables direct contact of the sensing diaphragm with the pressure media, while the electric connections and readout electronics parts can be protected from it. Such a structure provides good mechanical isolation of the sensing diaphragm from the stresses that can originate from the housing. However, the residual stresses introduced in the structure when curing the adhesive may affect the sensor characteristics.
Figure 1.
Schematic presentation of the cross section of the LTCC sensor in the housing for differential pressure measurements in a wet-wet application.
Figure 1.
Schematic presentation of the cross section of the LTCC sensor in the housing for differential pressure measurements in a wet-wet application.
We investigated possible adverse impact of packaging on the characteristics of LTCC pressure sensors. The main goal of our study was to find an appropriate adhesive material and to optimize the technological procedure. We analyzed to what extent the residual stresses introduced into the sensor structure while curing the adhesive critically affect sensor’s key performances. Numerical predictions were used to show the trends and help explain the effects of the individual material/process parameters.
2.2. Envisioned Problems
Initially we used finite-element analyses (FEA) to study the influence of the housing on the characteristics of the low-pressure LTCC sensors (for the pressure range up to 100 mbar) where silicone adhesive can be used and continued with specific requirements for high pressure sensors (up to 10 bar). In the latter case, epoxy-based adhesives, which will be able to withstand the stresses expected in the overload regime, are more appropriate. The epoxy adhesives have relatively high Young’s modulus (of about 3 GPa) and coefficients of the thermal expansion (CTE) > 70 × 10−6 K−1, so that significant residual stresses can remain after curing at elevated temperature of 150 °C. The curing-induced residual stresses may also enhance the internal stresses in the sensor structure under the pressure loads and so adversely influence the sensor’s burst pressure. For the low-pressure sensors, our analysis showed that in spite of the optimized construction (with good stress isolation of the sensing diaphragm), curing at 150 °C may contribute to non-negligible residual stresses influencing the offset and the temperature stability of the sensors’ characteristics. In this respect, proper selection of the adhesive material remains an essential issue. The simulations (i.e., thermal-structural analyses) indirectly revealed the critical points in the manufacturing process and helped in design and process optimisation in the early prototyping phase.
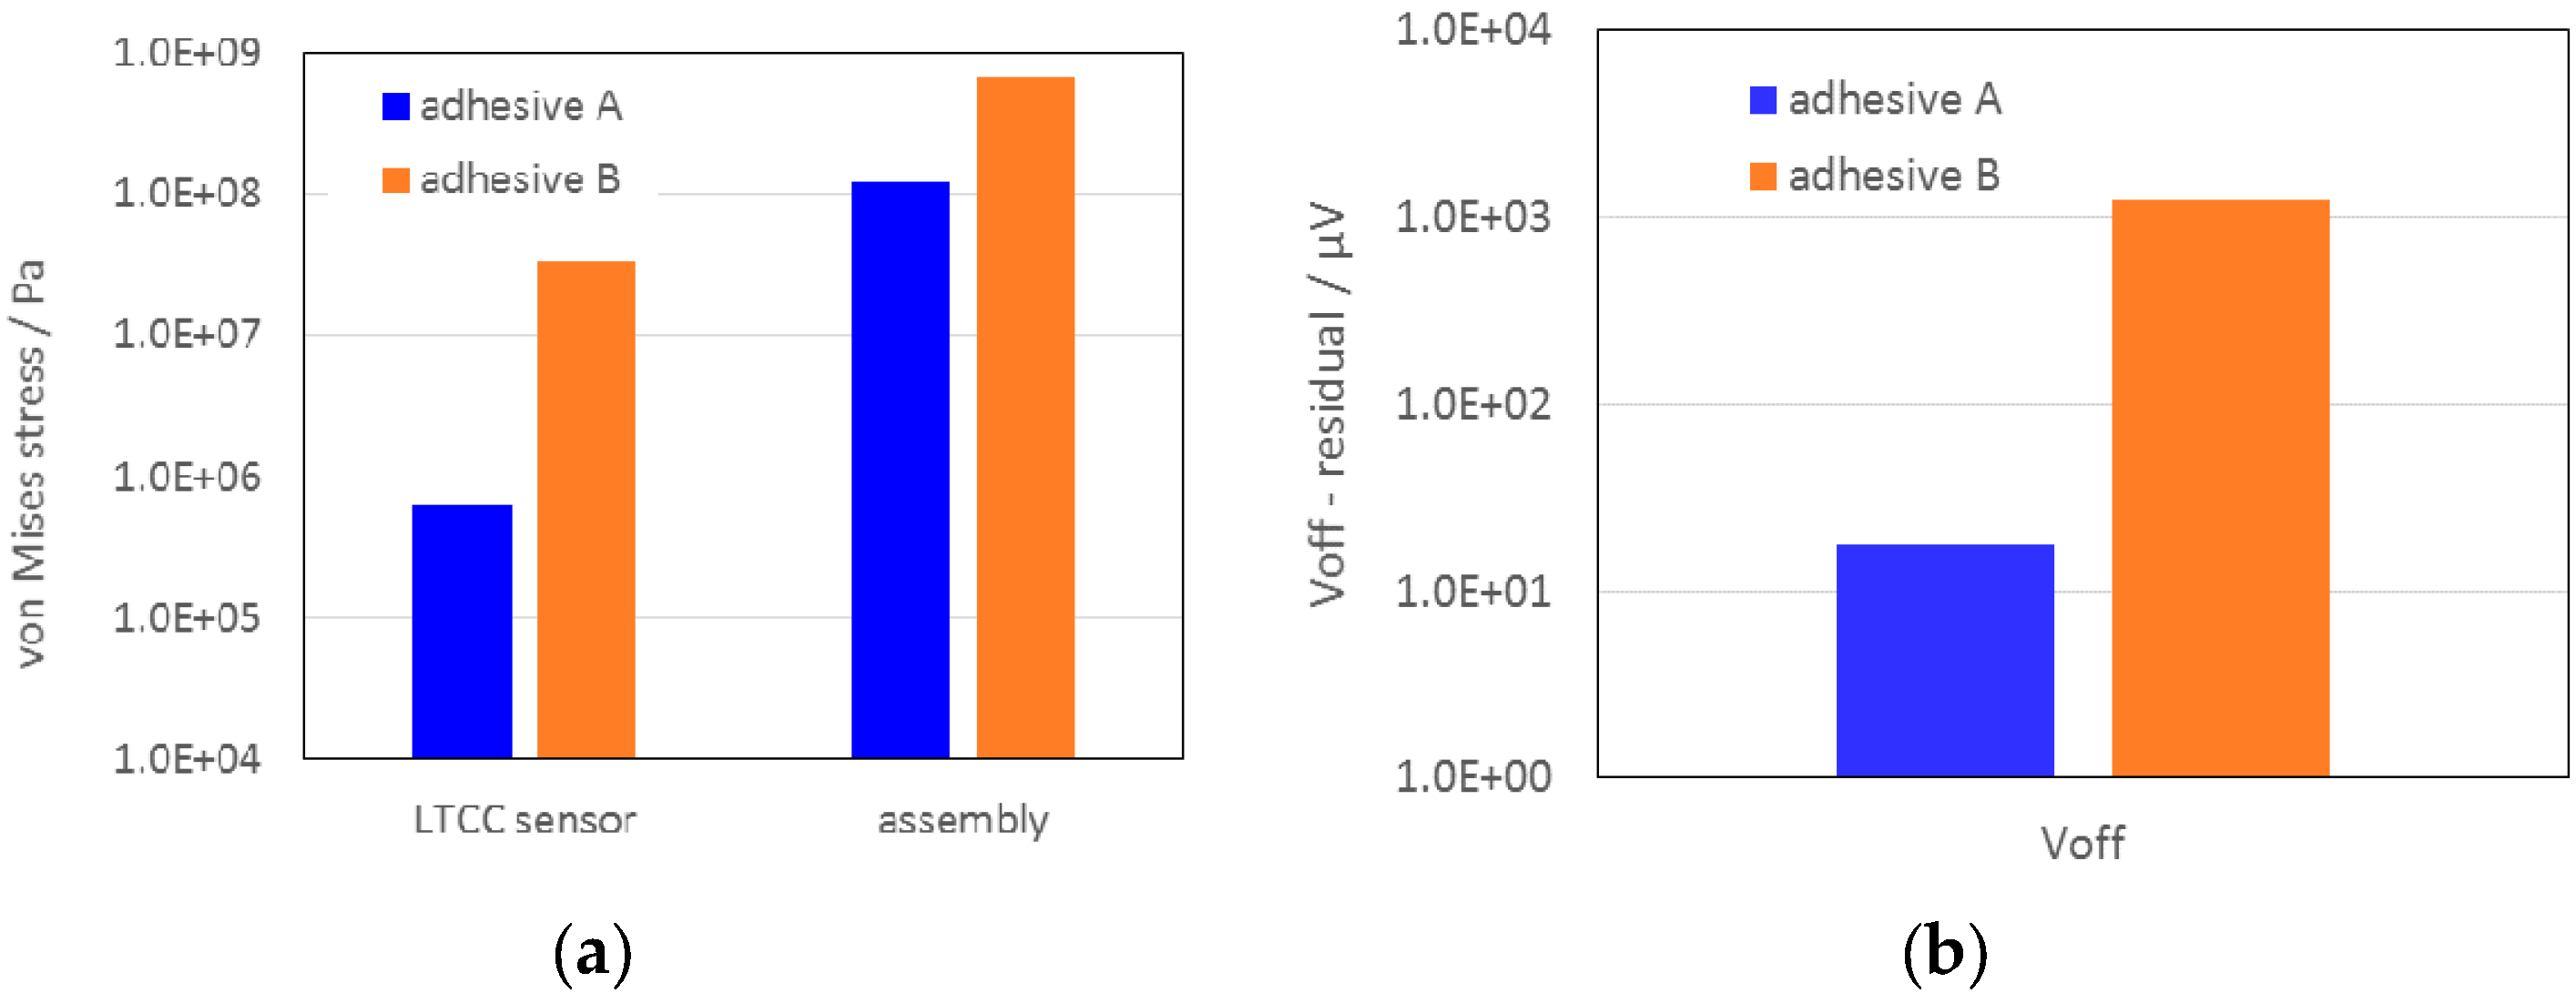
Selection of appropriate adhesives depends on its compatibility with the pressure media and the desired pressure range. Preliminary tests with different commercial adhesives showed that the epoxy adhesives can be appropriate for use in the aggressive media. On the other hand, the silicone based adhesives are more appropriate for non-aggressive media and low pressure ranges. For this case study we selected two heat-curable adhesives (denoted A and B). Adhesive A was a one-component silicone adhesive and B was a one-component aluminium-powder-filled epoxy adhesive. The tensile strength (σmax) of adhesive A is 2.9 MPa and Young’s modulus (Y) is < 1 MPa while σmax and Y of adhesive B are 66 MPa and 3.1 GPa respectively. Both materials are normally cured at 150 °C. Already from these figures it can be anticipated that the effect of curing of such different adhesives on the sensor characteristics can vary greatly. Furthermore, the residual stresses also depend on the whole structure geometry and the sensors’ pressure range.
2.3. Finite Element Modelling
The model for thermal-structural analysis of the sensor-in-package and evaluation of the curing-induced residual stresses was implemented in the Comsol Multiphysics code. It was aimed at prediction of the thermal stress developed in the sensor structure and the effect of the residual stress on the key sensors characteristics: the offset voltage (
Voff) and the sensitivity (S). In order to reduce the model size, we modelled only the inner part of the sensor-in-housing assembly
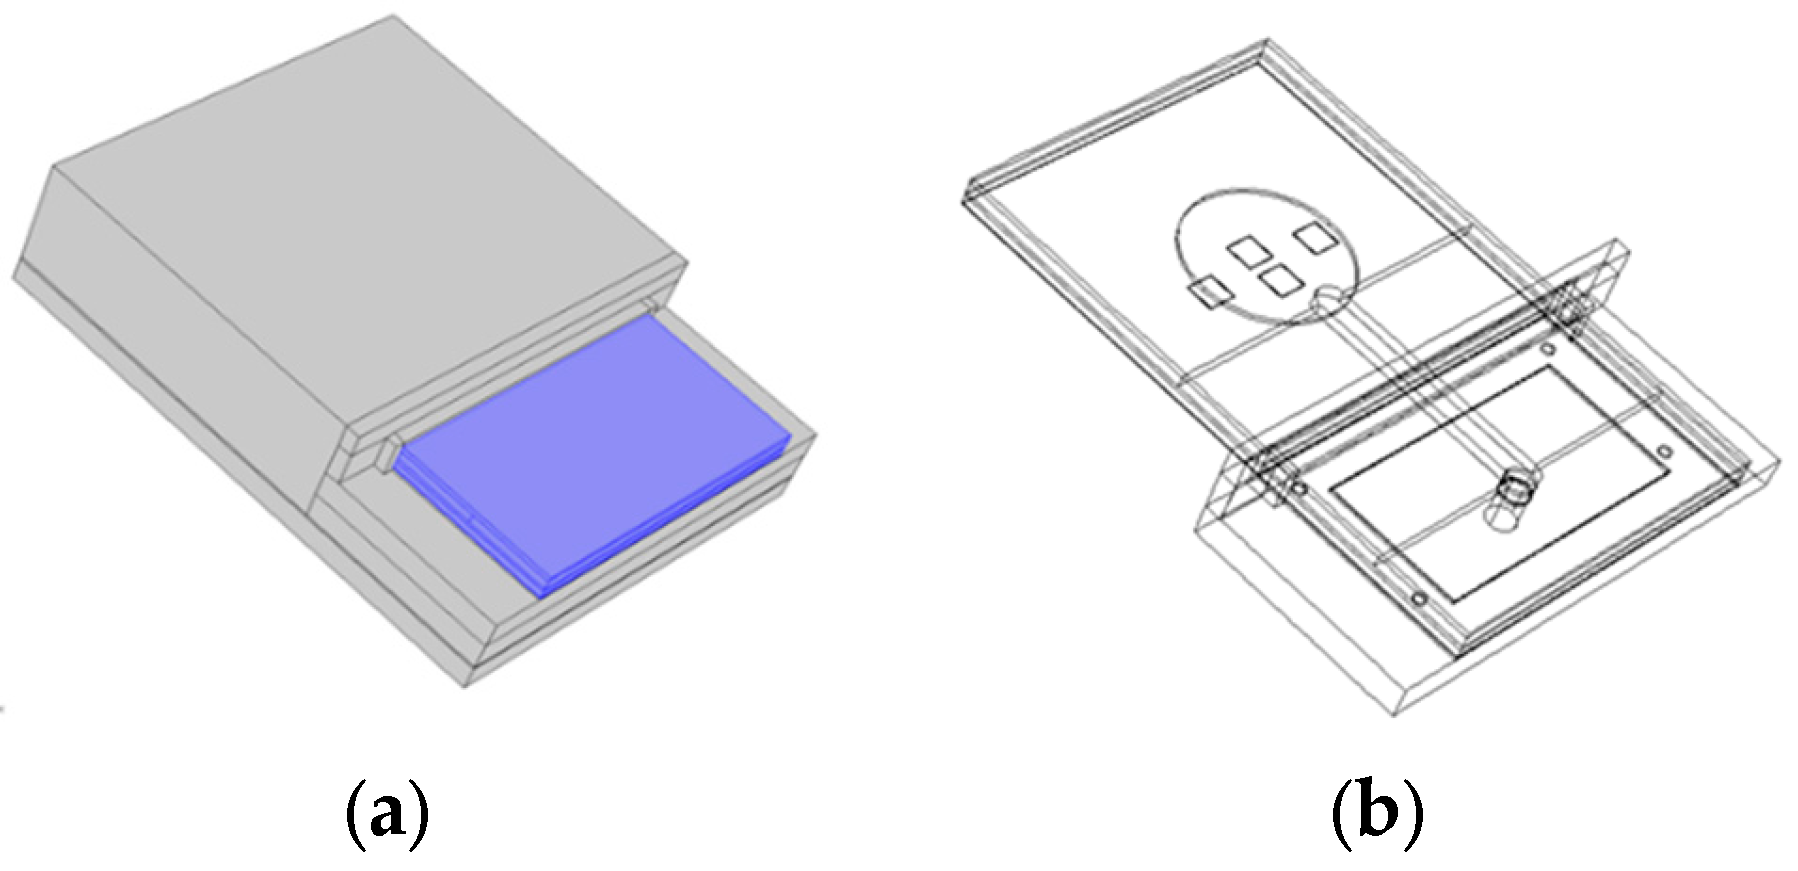
i.e., the LTCC sensor fixed and glued in the plastic holder, which is glued on the bottom of the housing. The simplified geometry is presented in
Figure 2. The visible part of the LTCC sensor structure, which is glued to the housing with a thin layer of adhesive, is colored blue. At this stage we neglected 10 µm conductive lines and the connection pads of the thick-film resistors, since they do not significantly affect the sensitivity, while in this way the number of required elements can be significantly reduced. As will be shown below, the analysis for LTCC sensor part (without housing) with the conductive paths was also carried out and showed very small deviation.
The key modelling assumptions for the prediction of the residual stresses induced by adhesive during cure were as follows:
Since the Young’s modulus of LTCC is significantly higher than those of the materials used for the housing and the adhesives (for at least two orders of magnitude), the formulation of the cure kinetics can be simplified. In this regard, we neglected the adhesive rheology and the effect of changes in its transient behaviors from the gel phase to the elastic solid. We assumed the final stage of the curing process at 150 °C where the adhesive is fully cured and its material properties are those specified in the manufacturer’s data sheets. A similar assumption has been made in [
13] and proved to be appropriate to study the trends of the residual stresses resulting from the curing procedure.
Figure 2.
The simplified model geometry: (a) LTCC sensor placed in the inner part of the sensor-in-housing assembly with visible sensor part (colored blue); (b) wireframe view.
Figure 2.
The simplified model geometry: (a) LTCC sensor placed in the inner part of the sensor-in-housing assembly with visible sensor part (colored blue); (b) wireframe view.
According to the above assumptions, there are no thermal stresses in the sensor structure at the initial temperature of 150 °C. Cooling to the room temperature results in the induced residual stresses.
The material parameters used in the model were obtained from the available data sheets. For modelling thick-film piezo-resistors we built the elastoresistive coupling matrix by using the gauge coefficients evaluated in [
14]. The longitudinal and transverse gauge coefficients are 11.6 and 11.4 respectively. The temperature dependence of resistivity (TCR) and the Joule heating of the thick-film resistors were not considered in this case study. We were primarily focused on the effect of the material CTEs mismatch and the resulting stresses after curing the adhesive at the elevated temperature. The CTEs of LTCC, the thick-film resistor material and the material for the housing (glass fibre reinforced semi-crystalline resin) were 5.8 × 10
−6 K
−1, 8.6 × 10
−6 K
−1, 250 × 10
−6 K
−1, respectively. For adhesive A we used CTE of 200 × 10
−6 K
−1 and for adhesive B a pricewise linear approximation,
i.e., CTE of 70 × 10
−6 K
−1, 100 × 10
−6 K
−1 and 186 × 10
−6 K
−1 in the temperature ranges 0–100, 100–125 and 125–185 °C respectively.
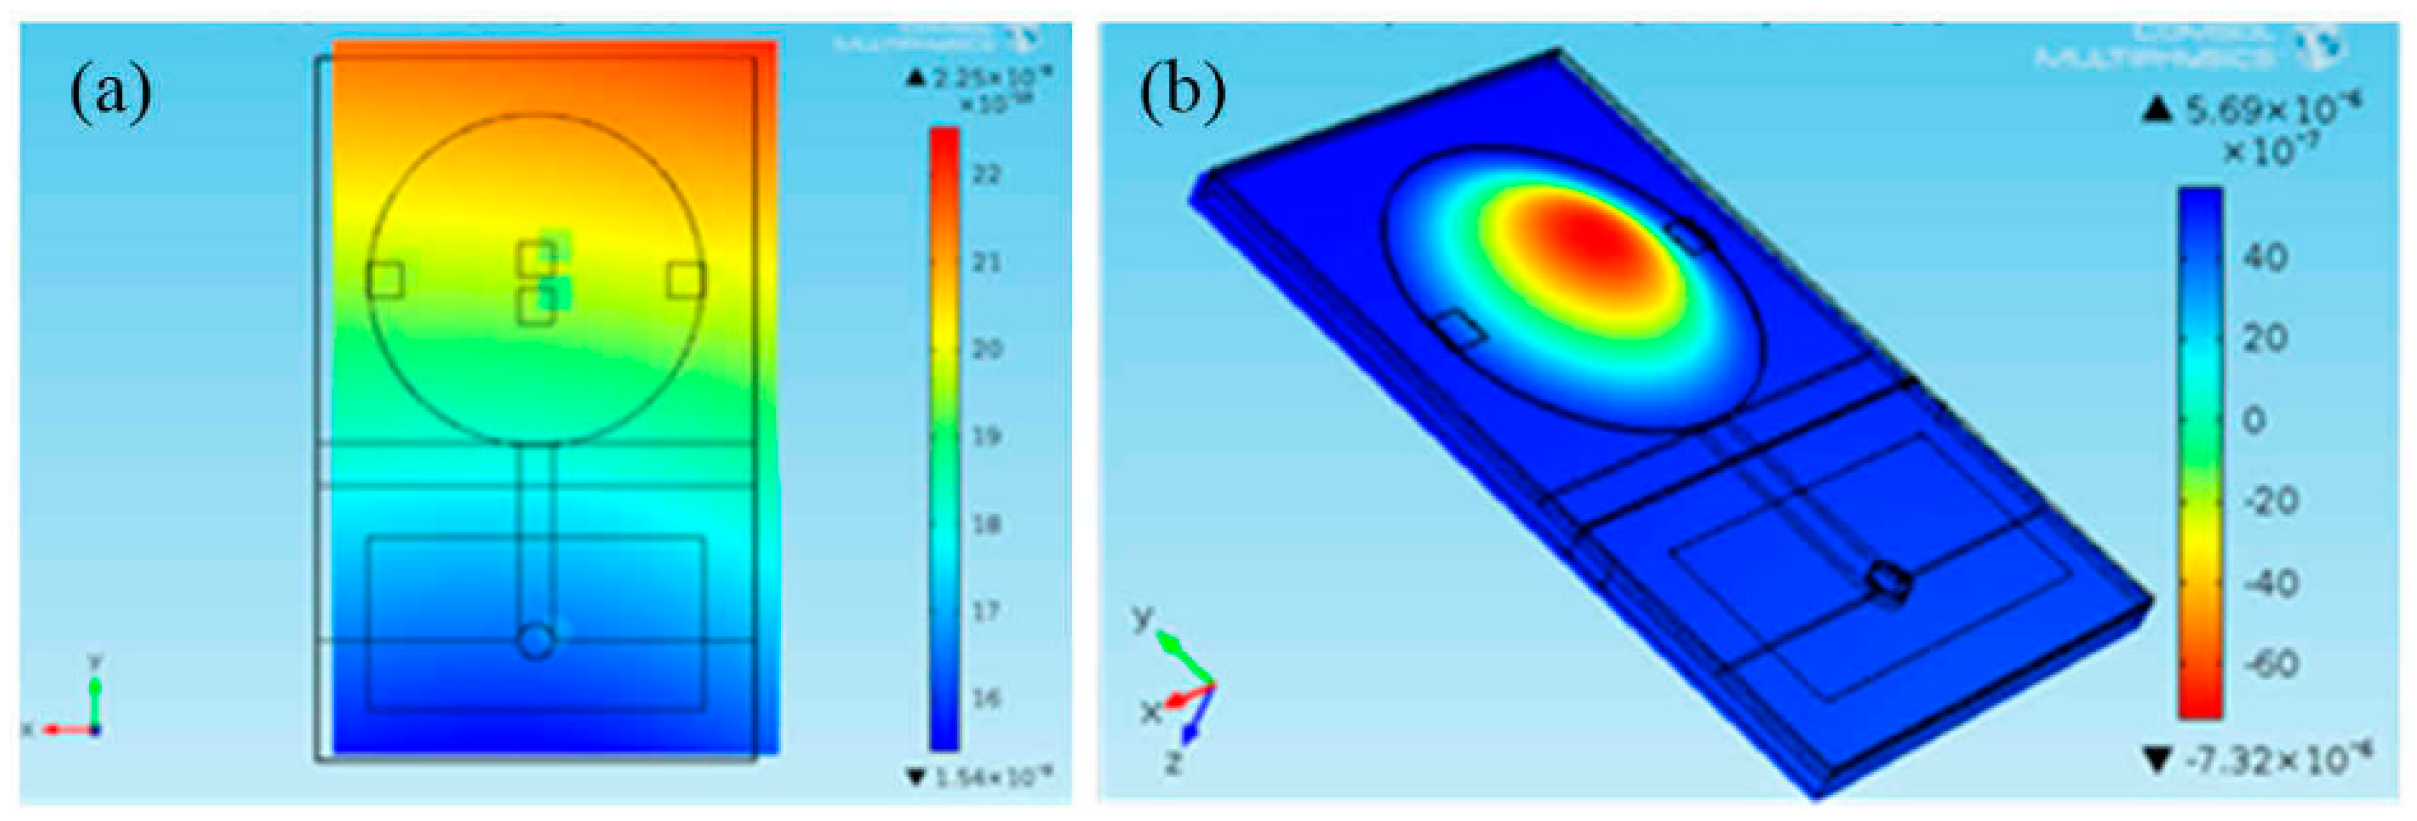
The effect of the residual-stress and the strain in the thick-film sensing resistor regions, resulting in changes in Voff and S, were evaluated as follows: The sensing thick-film resistors are connected in the Wheatstone’s bridge, so that the resistance changes are directly reflected in the bridge output voltage (Vout). Initially all the resistors have the same initial value and Vout = Voff = 0. Due to the non-uniform residual stresses distribution and consequently different strains at the locations of the thick-film piezo-resistors, the resistance changes of the four bridge resistors are different and Voff becomes non-zero. Since we were interested in the resistance changes, rather than the actual resistances, the time-consuming coupled-field FE analysis with calculations of current density within the resistance regions was not necessary. Consequently we used a simplified approach based on structural analysis (solid mechanics interface under the Structural Mechanics branch in Comsol Multiphysics 4.4) and calculation of the resistance changes and the resulting bridge voltage in post processing. The resistance changes were obtained from the average strain components in the piezoresistive regions multiplied with the appropriate gauge coefficients. In this way we have reduced the model size and the time of calculation.
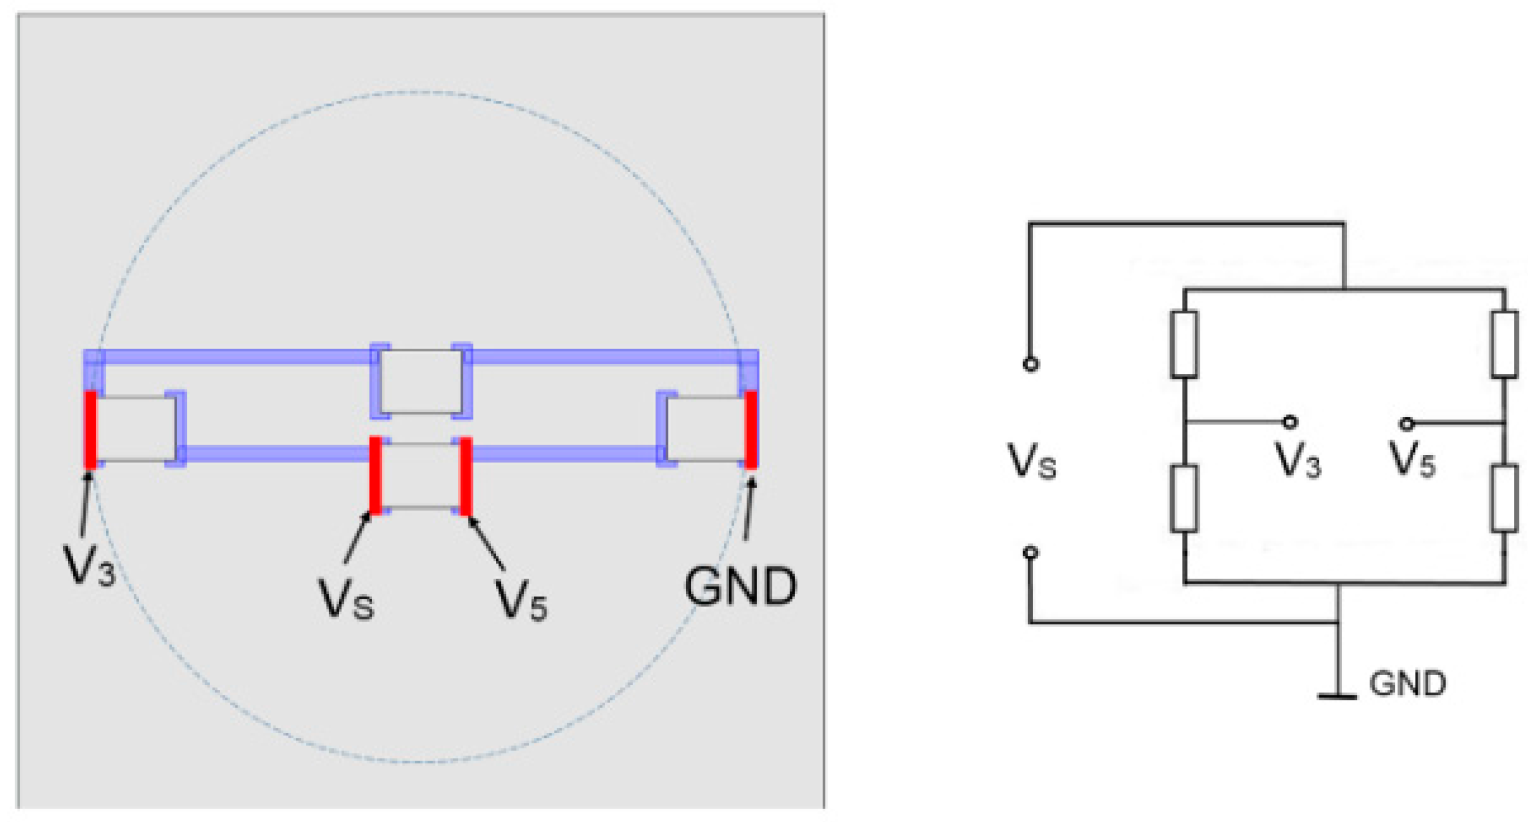
For verification of this simplified modelling approach we also implemented the model by using the Comsol’s Piezo-resistivity physics interface. (This was done solely for the LTCC sensor structure, without the housing.) The electric potential node and the ground nodes determining the bridge voltage (
Vs of 5 V) were defined as the boundary condition on the appropriate resistors connection pads. The bridge output voltage was calculated as the difference between two boundary probes
V3 and
V5 defined as the potential on the surface of the resistor connection pads (
Figure 3).
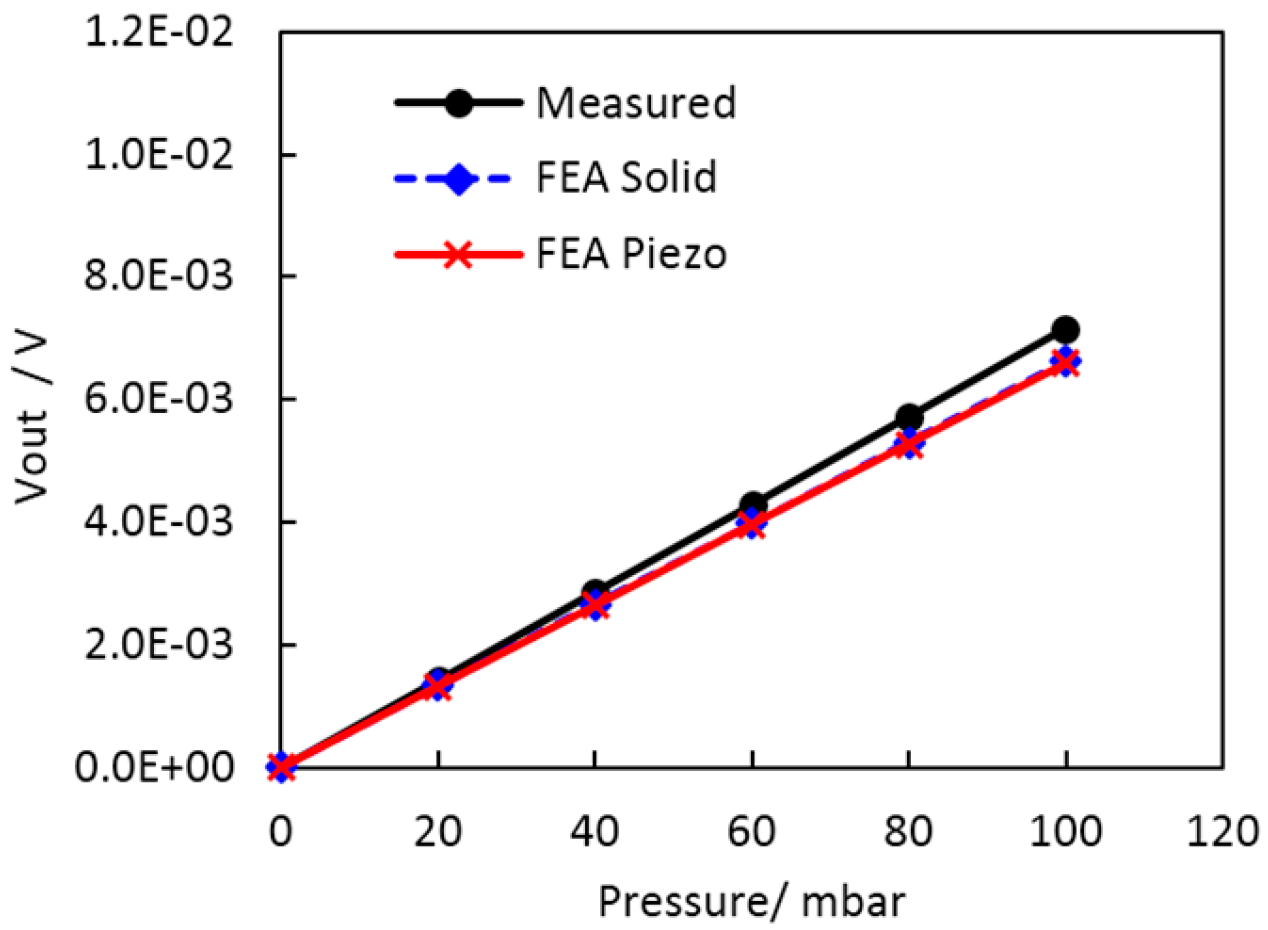
For validation of the model of the 100-mbar LTCC sensor (without the housing) the FEA predictions were compared to the measured response. The predicted sensitivity of 1.36 × 10
−5 V/V/mbar (the span of 6.84 mV at the
VS of 5 V) was slightly lower, but still in relatively good agreement with the typical characteristic of the sensors studied in our previous work [
12,
15]. The simulated and the measured output voltage versus pressure at the room temperature are presented in
Figure 4.
Figure 3.
The detail of the model geometry: the LTCC sensor structure with the thick-film resistors (on the membrane) connected in the Wheatstone bridge with the metal connection paths and the electric scheme.
Figure 3.
The detail of the model geometry: the LTCC sensor structure with the thick-film resistors (on the membrane) connected in the Wheatstone bridge with the metal connection paths and the electric scheme.
Figure 4.
Simulated sensor output versus pressure (simplified model, denoted as FEA Solid, and piezo-resistive domain analysis, denoted as FEA Piezo) and measured characteristics of the 100-mbar sensor with a glued metal tube at 25 °C.
Figure 4.
Simulated sensor output versus pressure (simplified model, denoted as FEA Solid, and piezo-resistive domain analysis, denoted as FEA Piezo) and measured characteristics of the 100-mbar sensor with a glued metal tube at 25 °C.
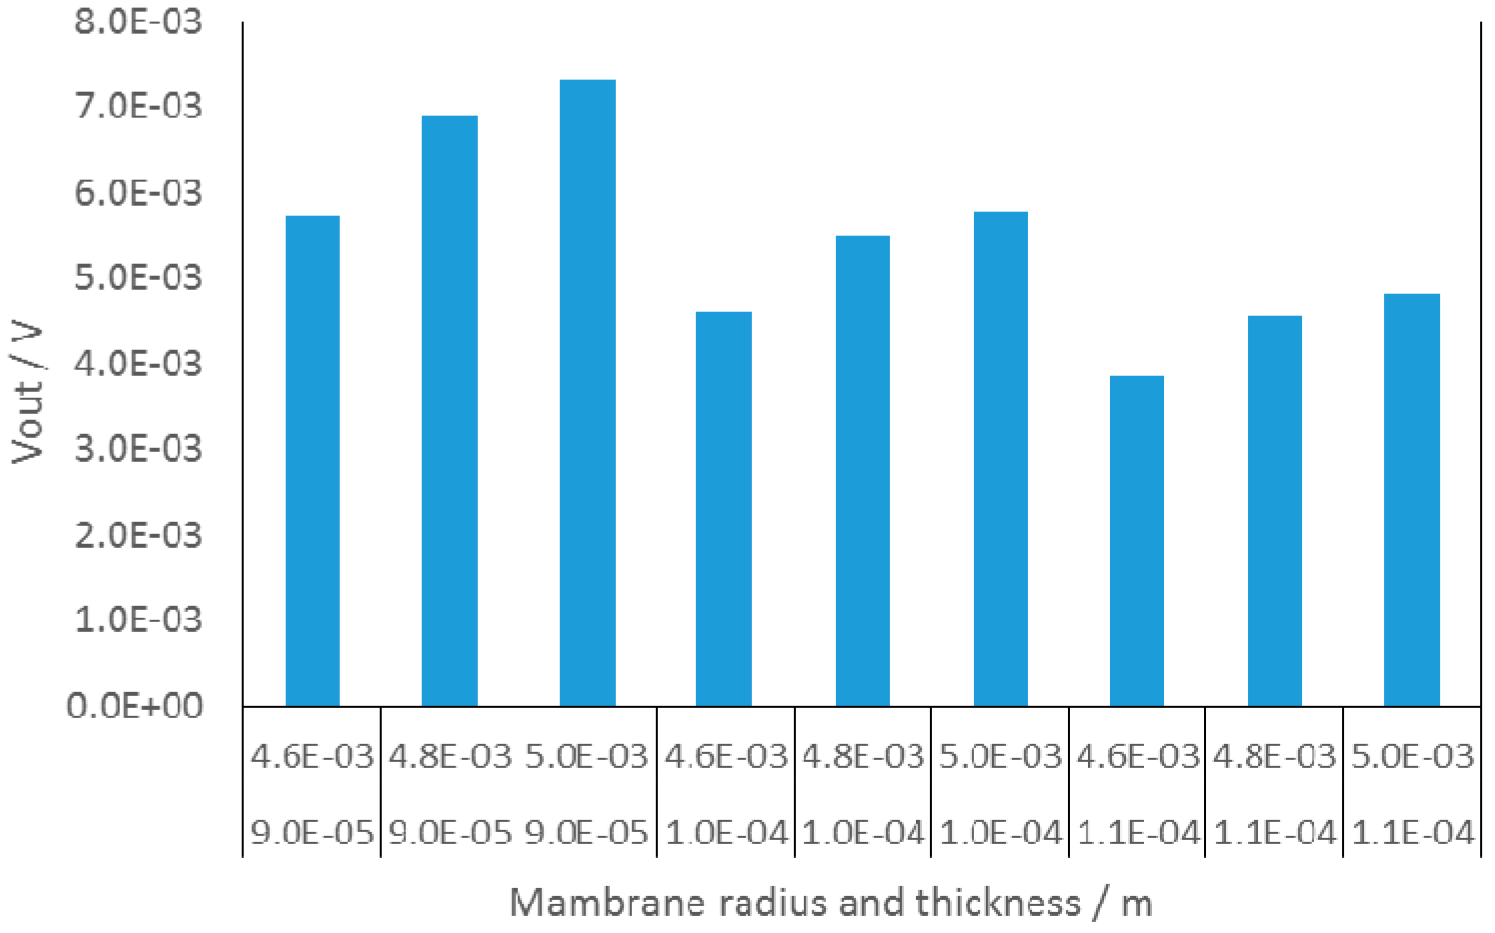
Taking into account that we specified in the model the nominal thickness of the diaphragm, which can differ from the thickness of the processed LTCC structure (up to 10%) and that bonding of the metal tube for application of the pressure in the case of the measured prototypes can also affect the sensor response, the resulting discrepancy of the simulated and measured response was acceptable. In addition we performed further parametric analysis considering deviations of the membrane dimensions. The sensor output voltage obtained for three different membrane diameters and three different thicknesses is shown in
Figure 5. It is evident that the measured data presented in
Figure 4 fall within the predicted tolerance range.
Figure 5.
Results of parametric analysis of 100 mbar sensor.
Figure 5.
Results of parametric analysis of 100 mbar sensor.
The above results validated the proposed model and allowed us to perform further analysis of the LTCC sensor glued in the housing with different adhesive materials. The following cases were studied:
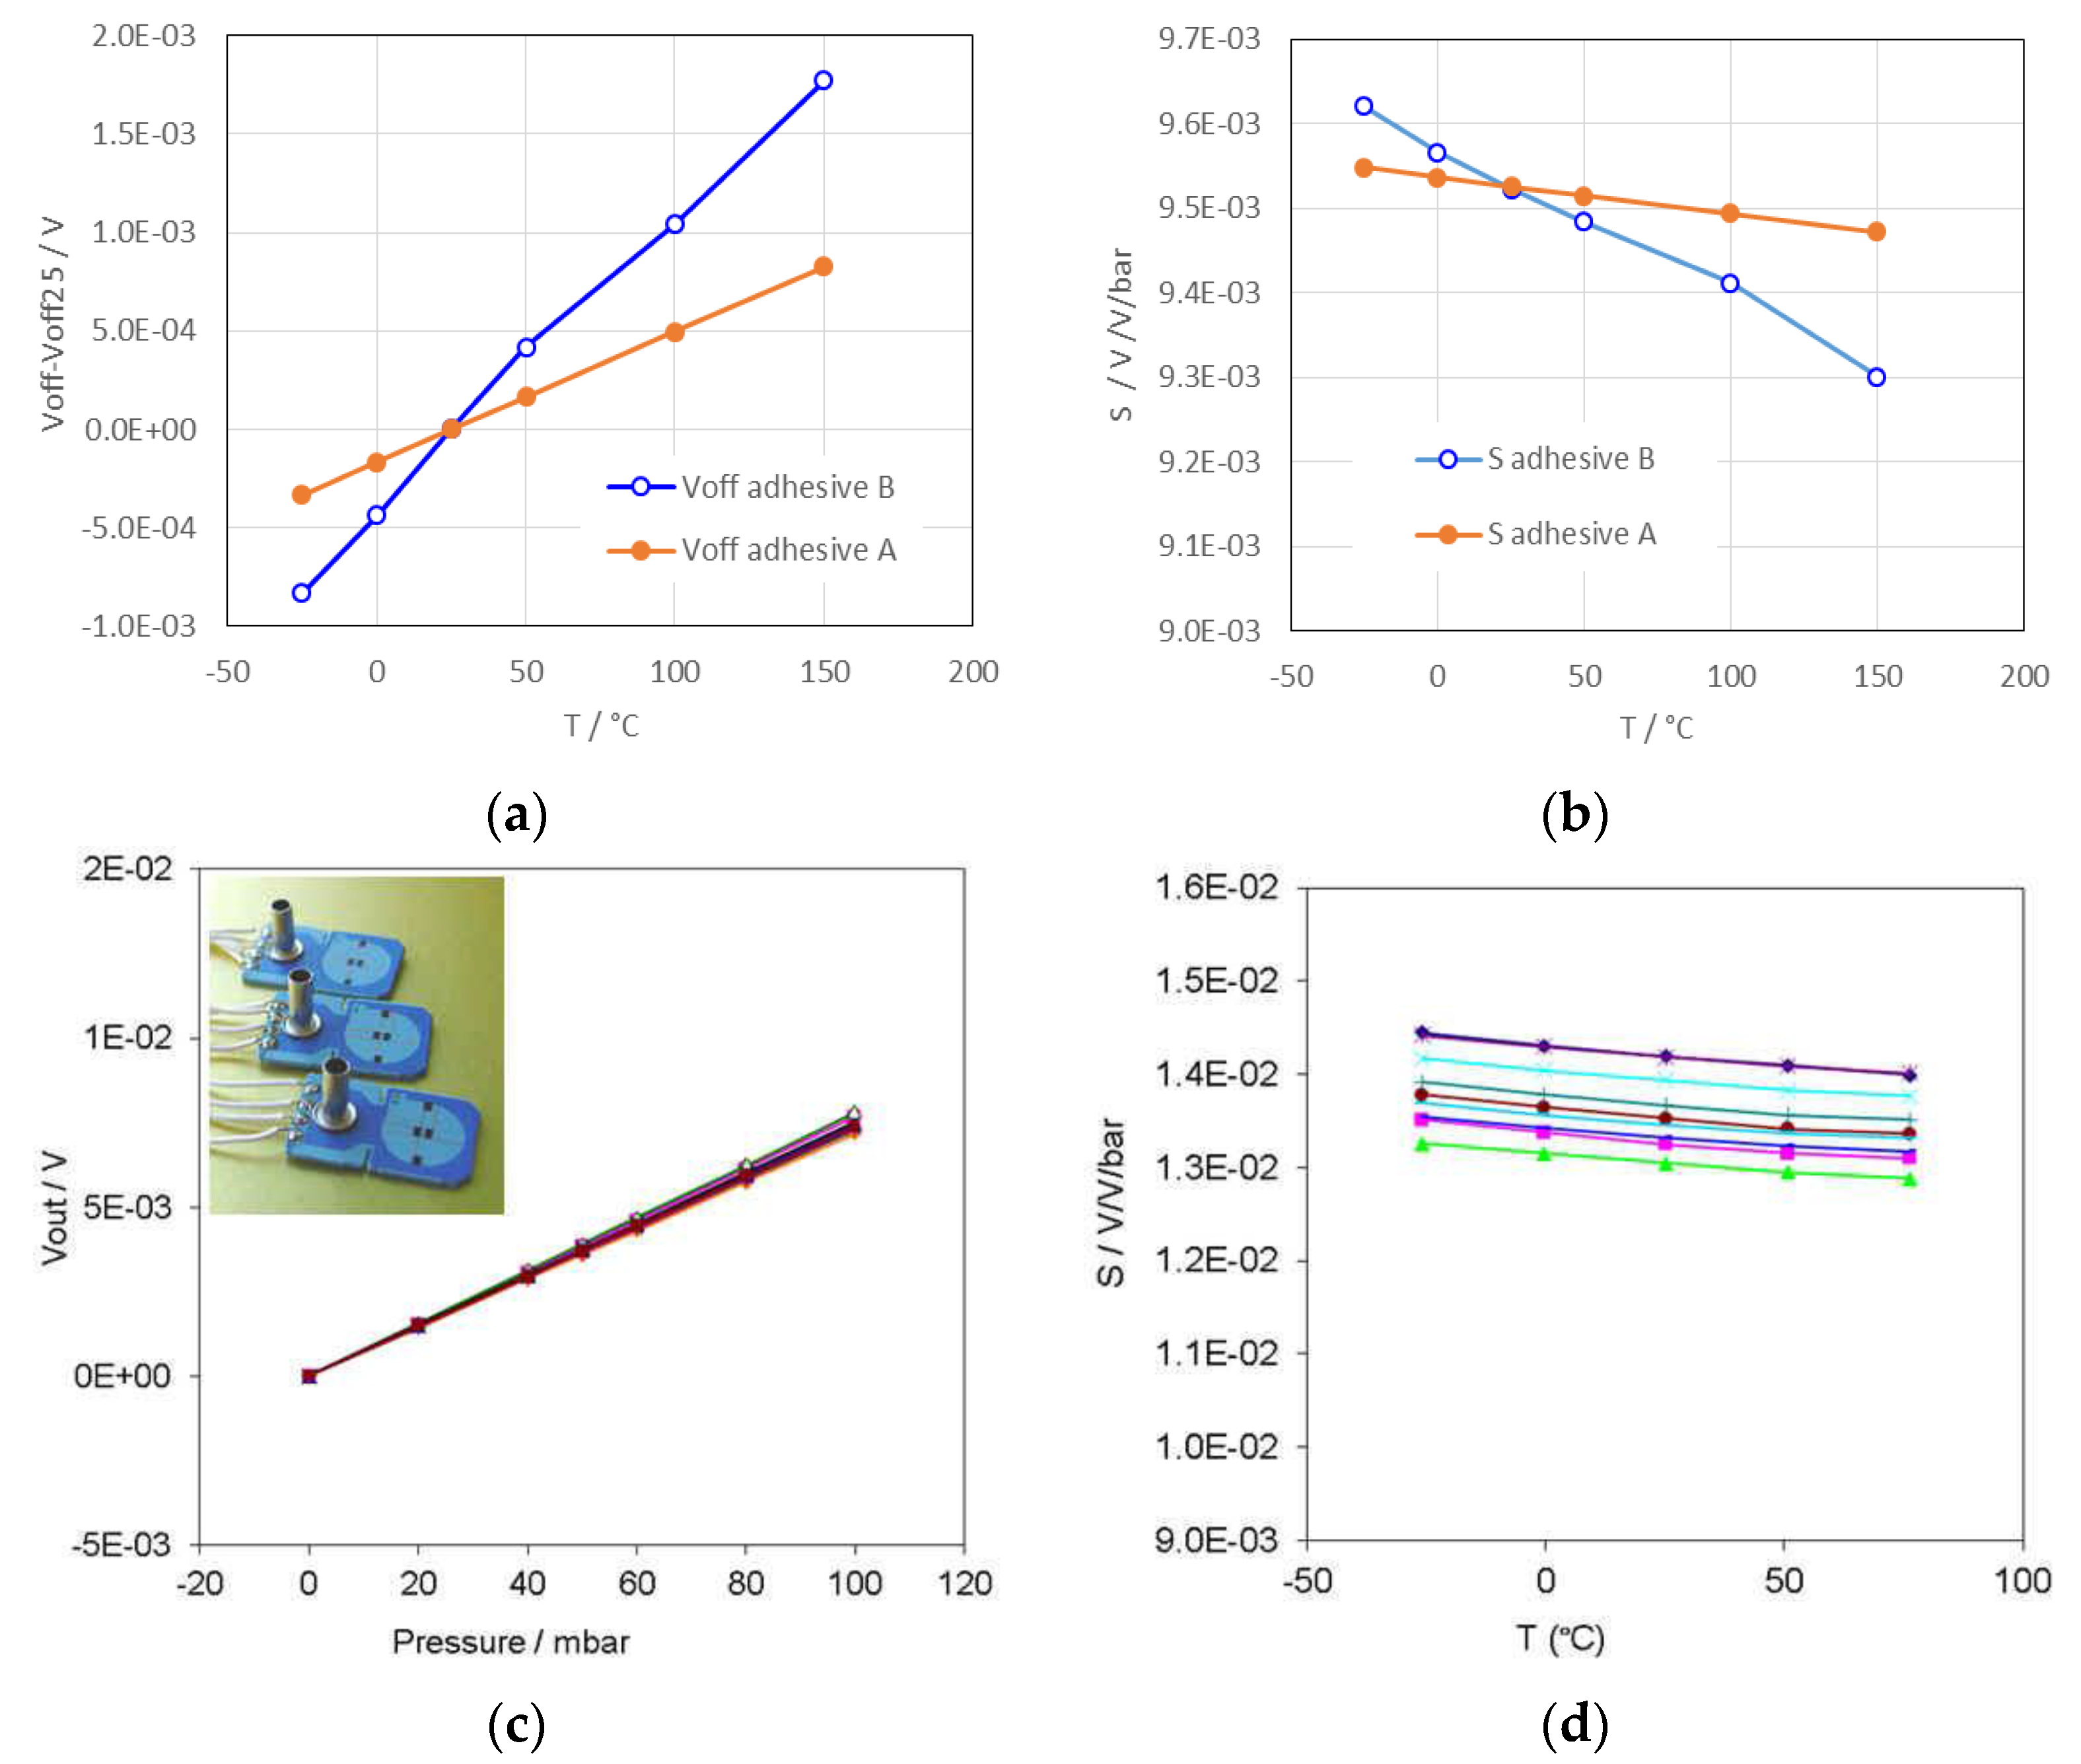
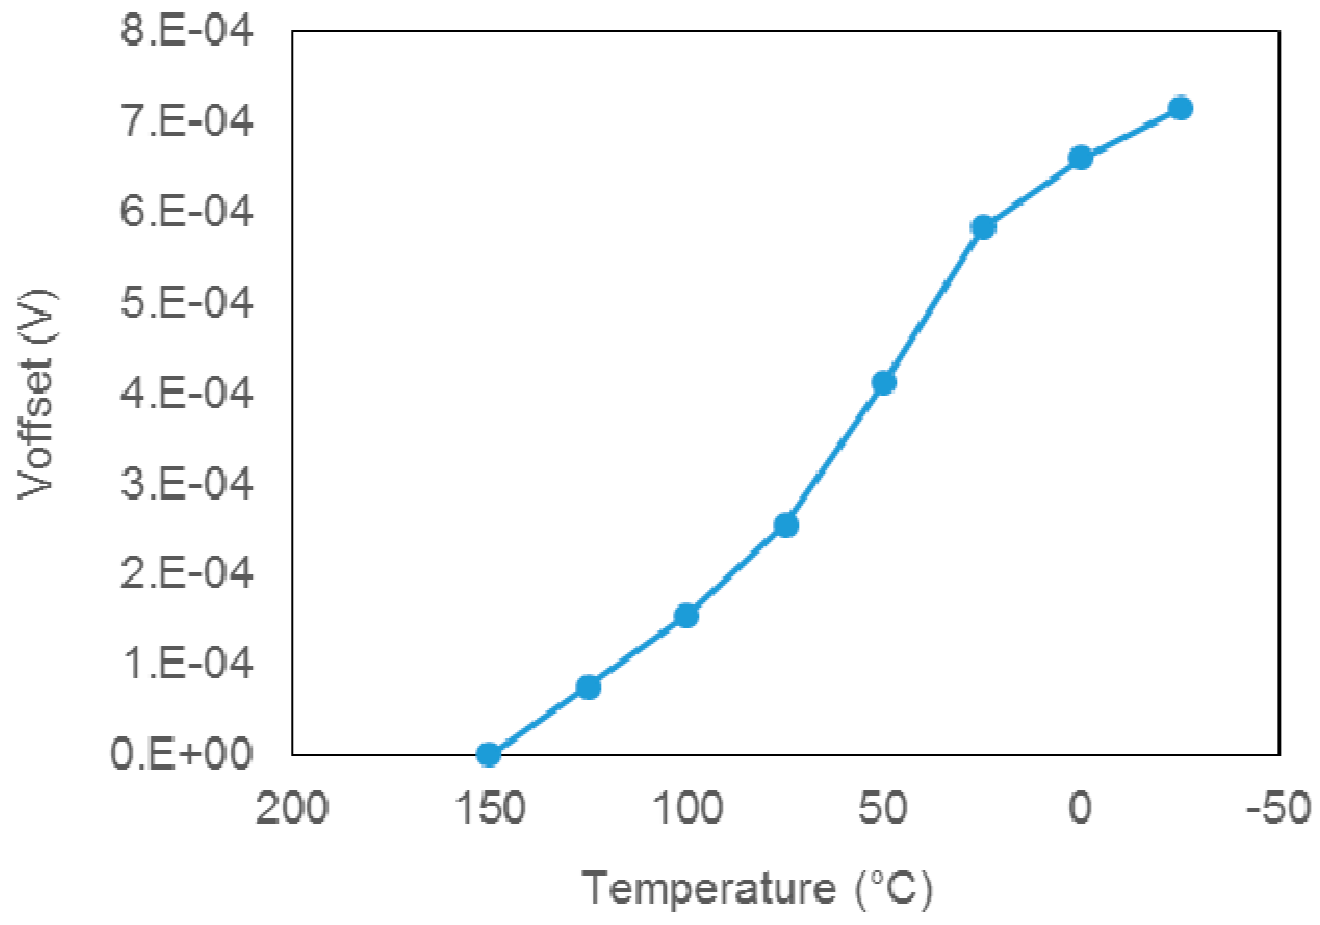
Voff and the response of the 0.1-bar sensor in the temperature range −25 °C to 125 °C;
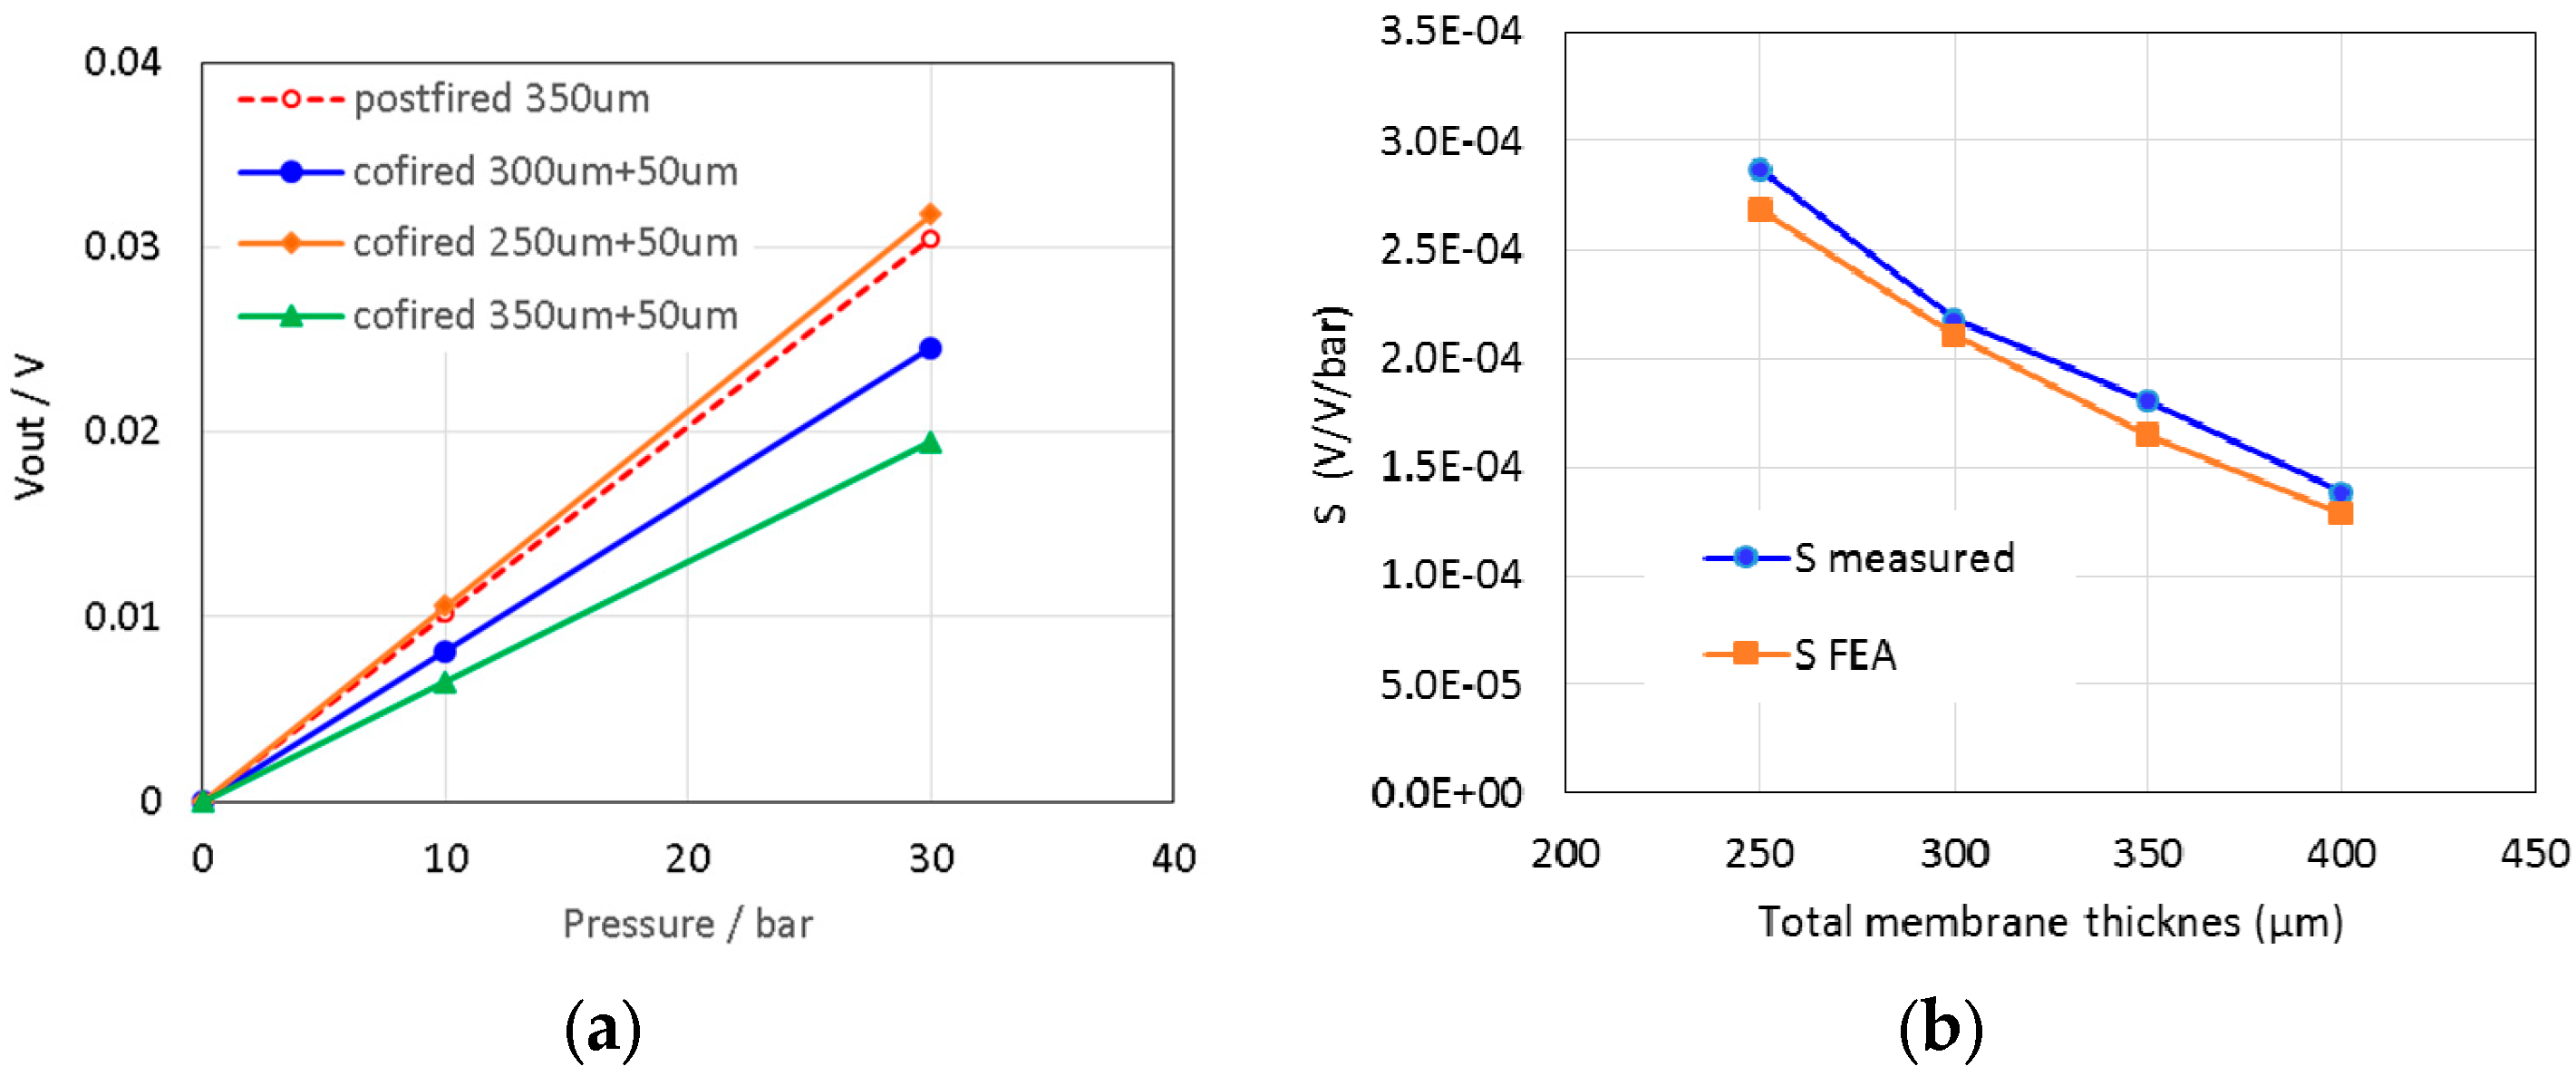
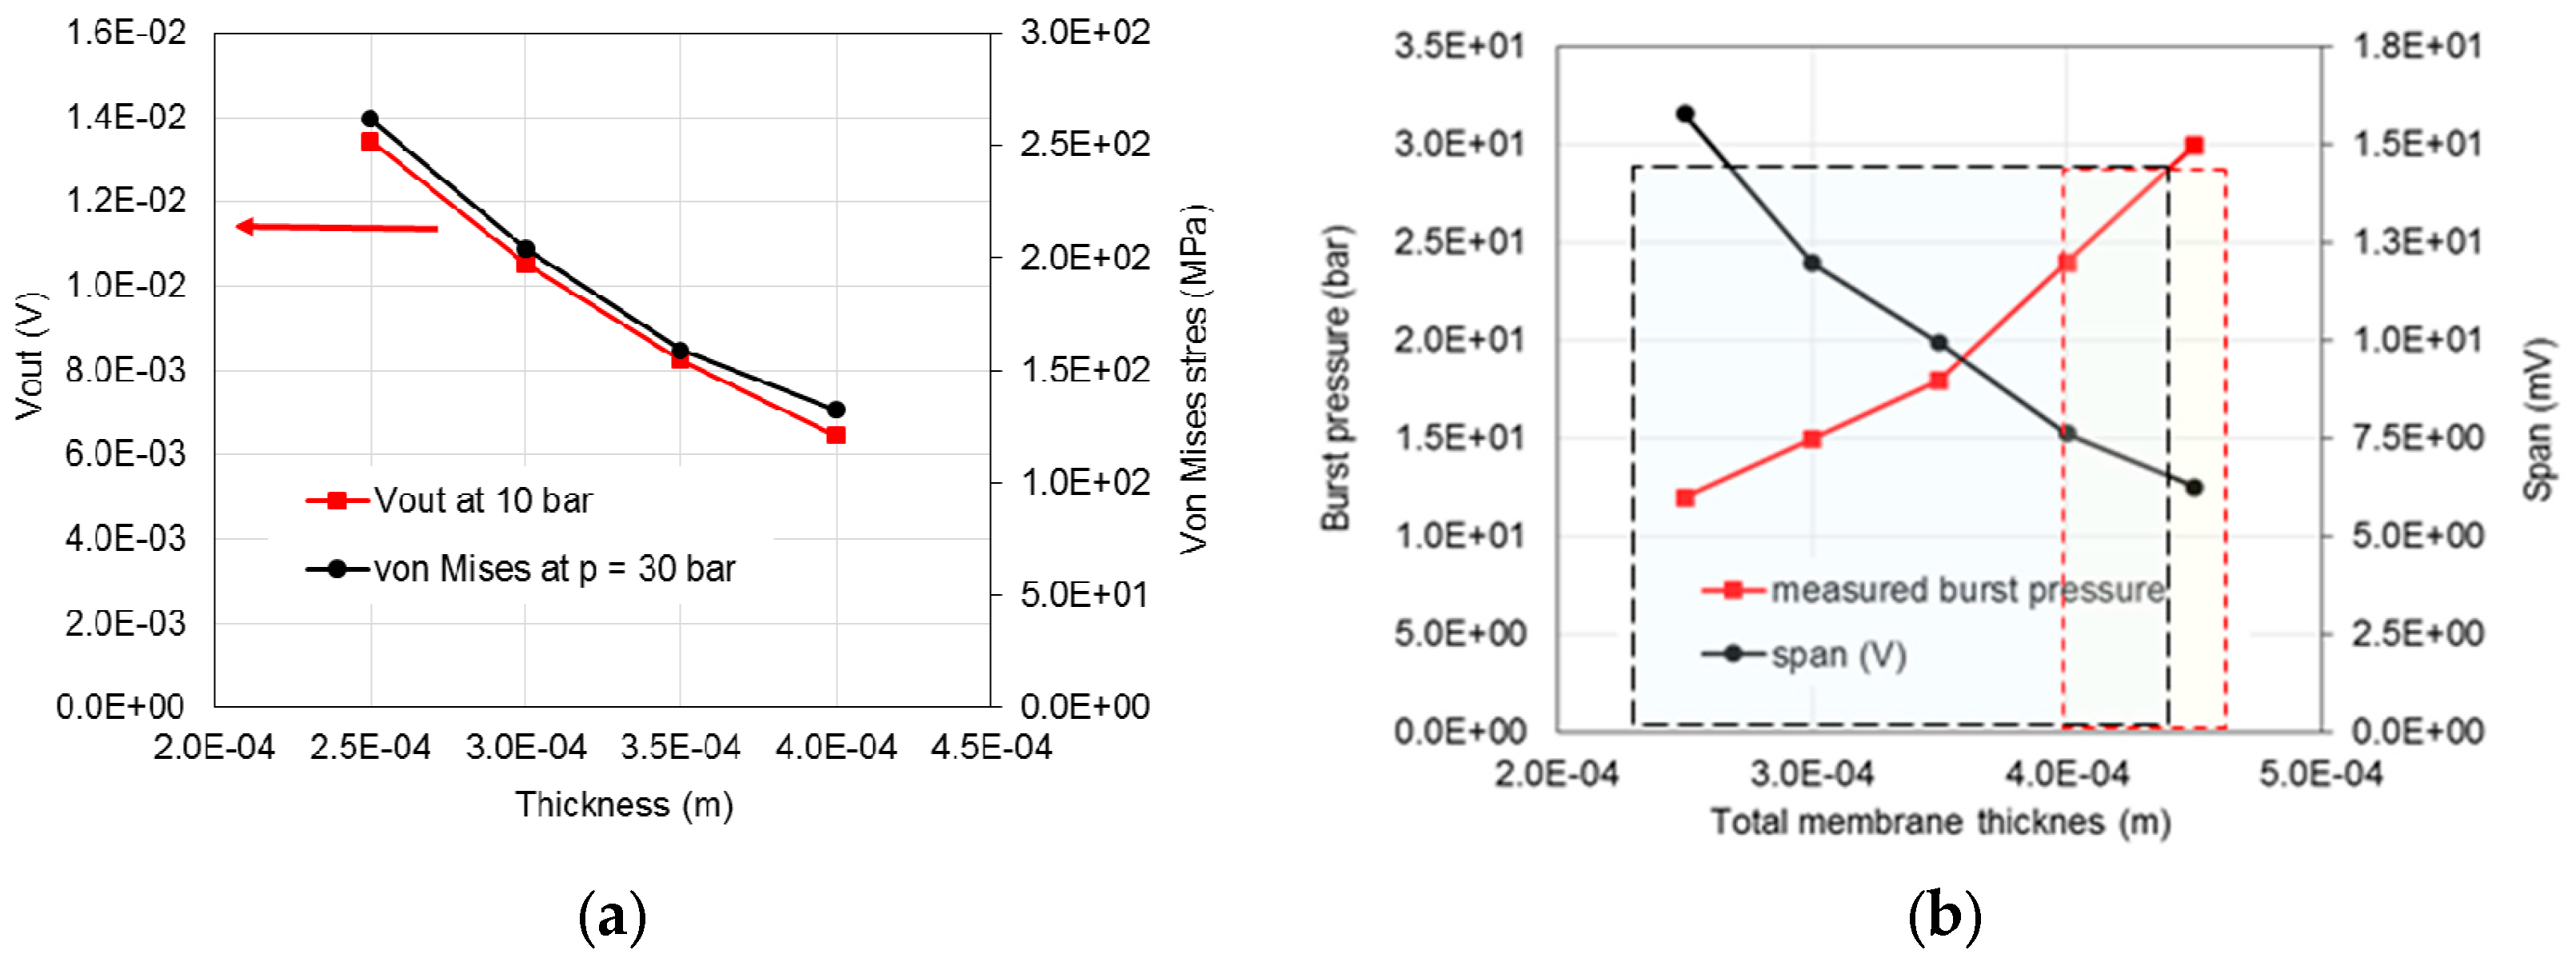
Changes in Voff and the sensitivity of 10-bar sensors induced by adhesive curing;
The residual von Mises stresses and burst pressure.

