
Design and Fabrication of a Real-Time Measurement System for the Capsaicinoid Content of Korean Red Pepper (Capsicum annuum L.) Powder by Visible and Near-Infrared Spectroscopy


Abstract
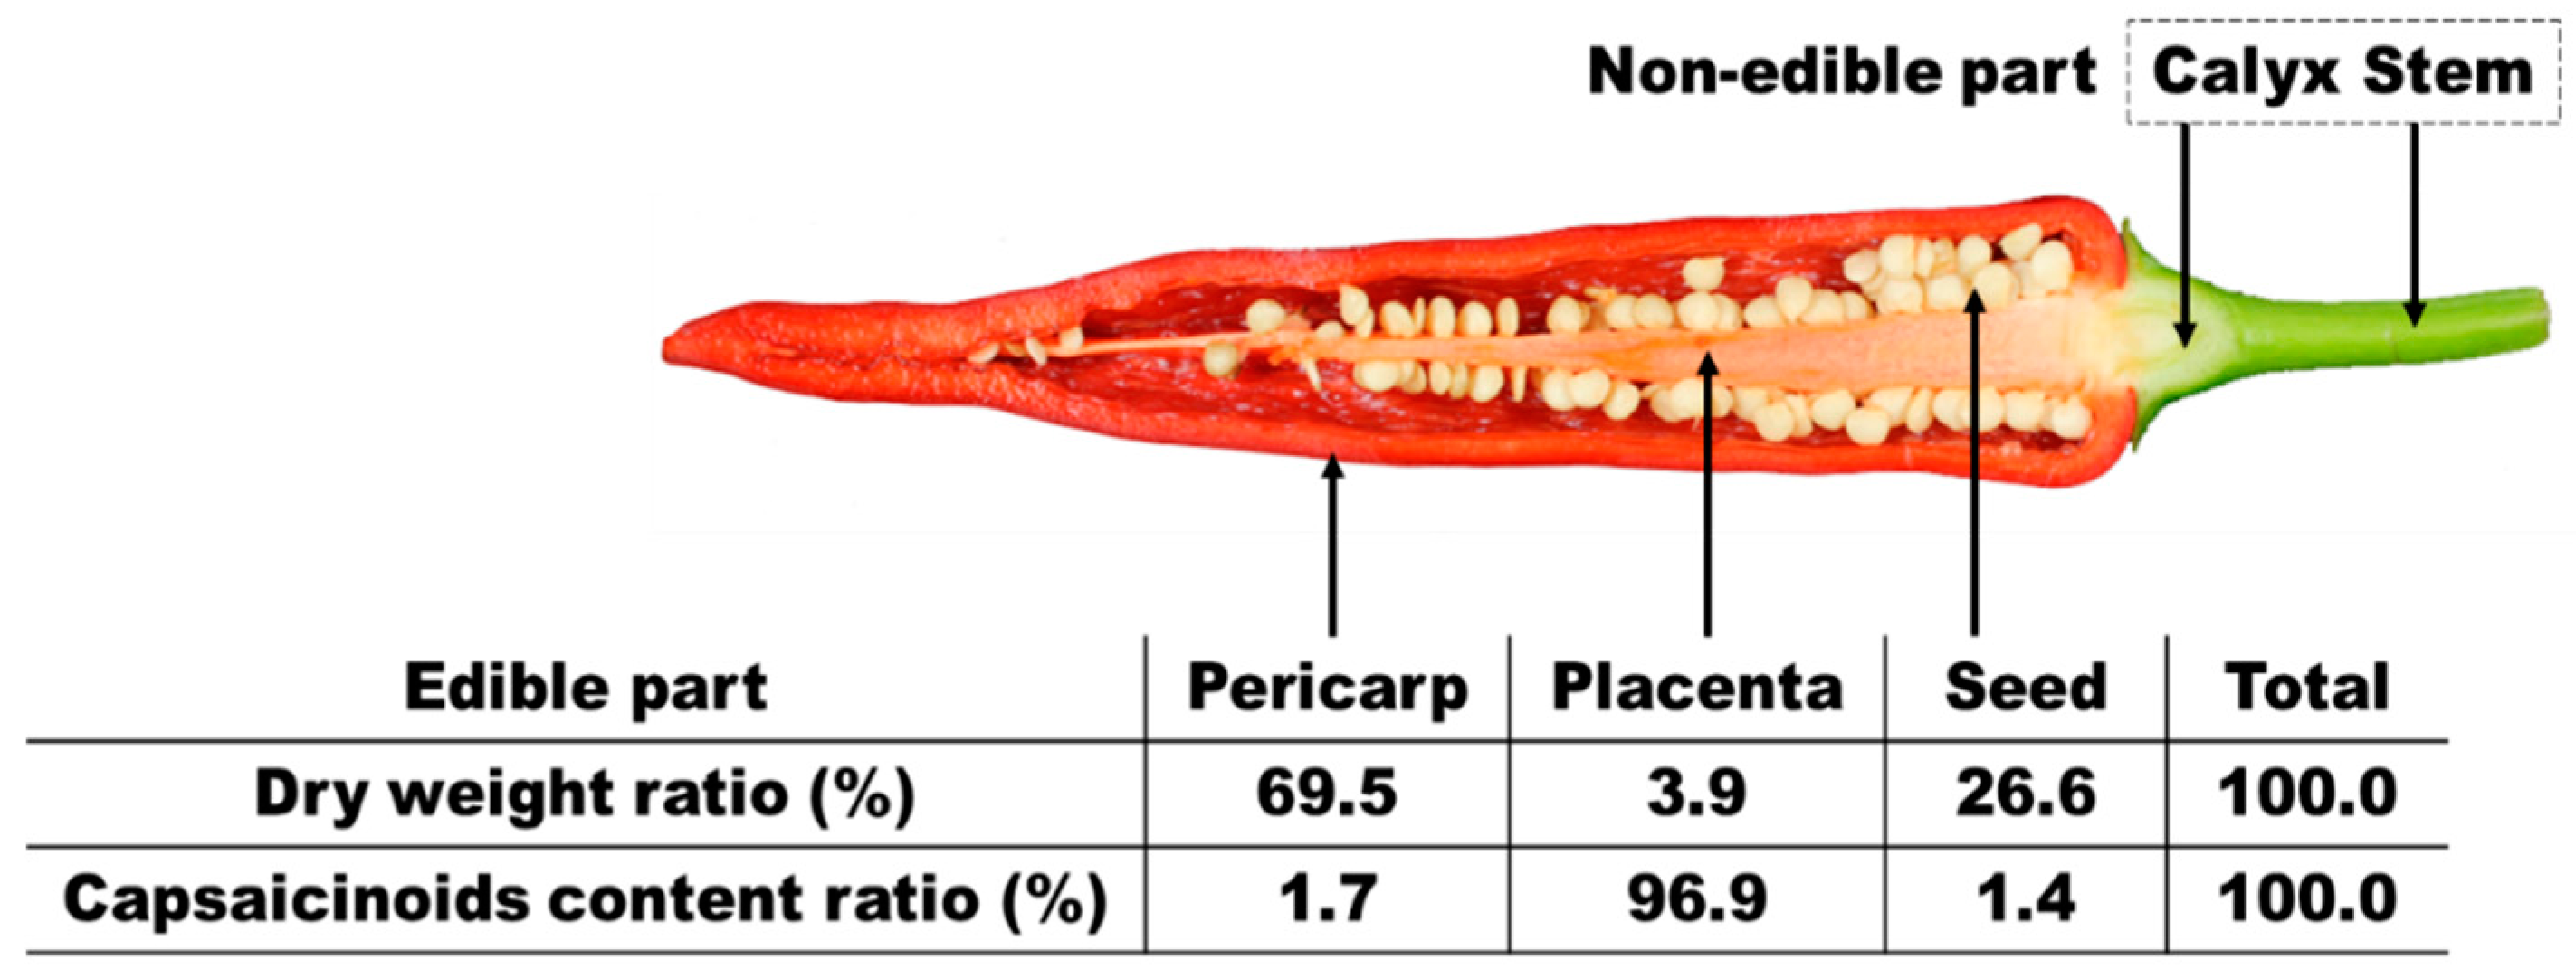
:1. Introduction
2. Design and Fabrication
2.1. System Design
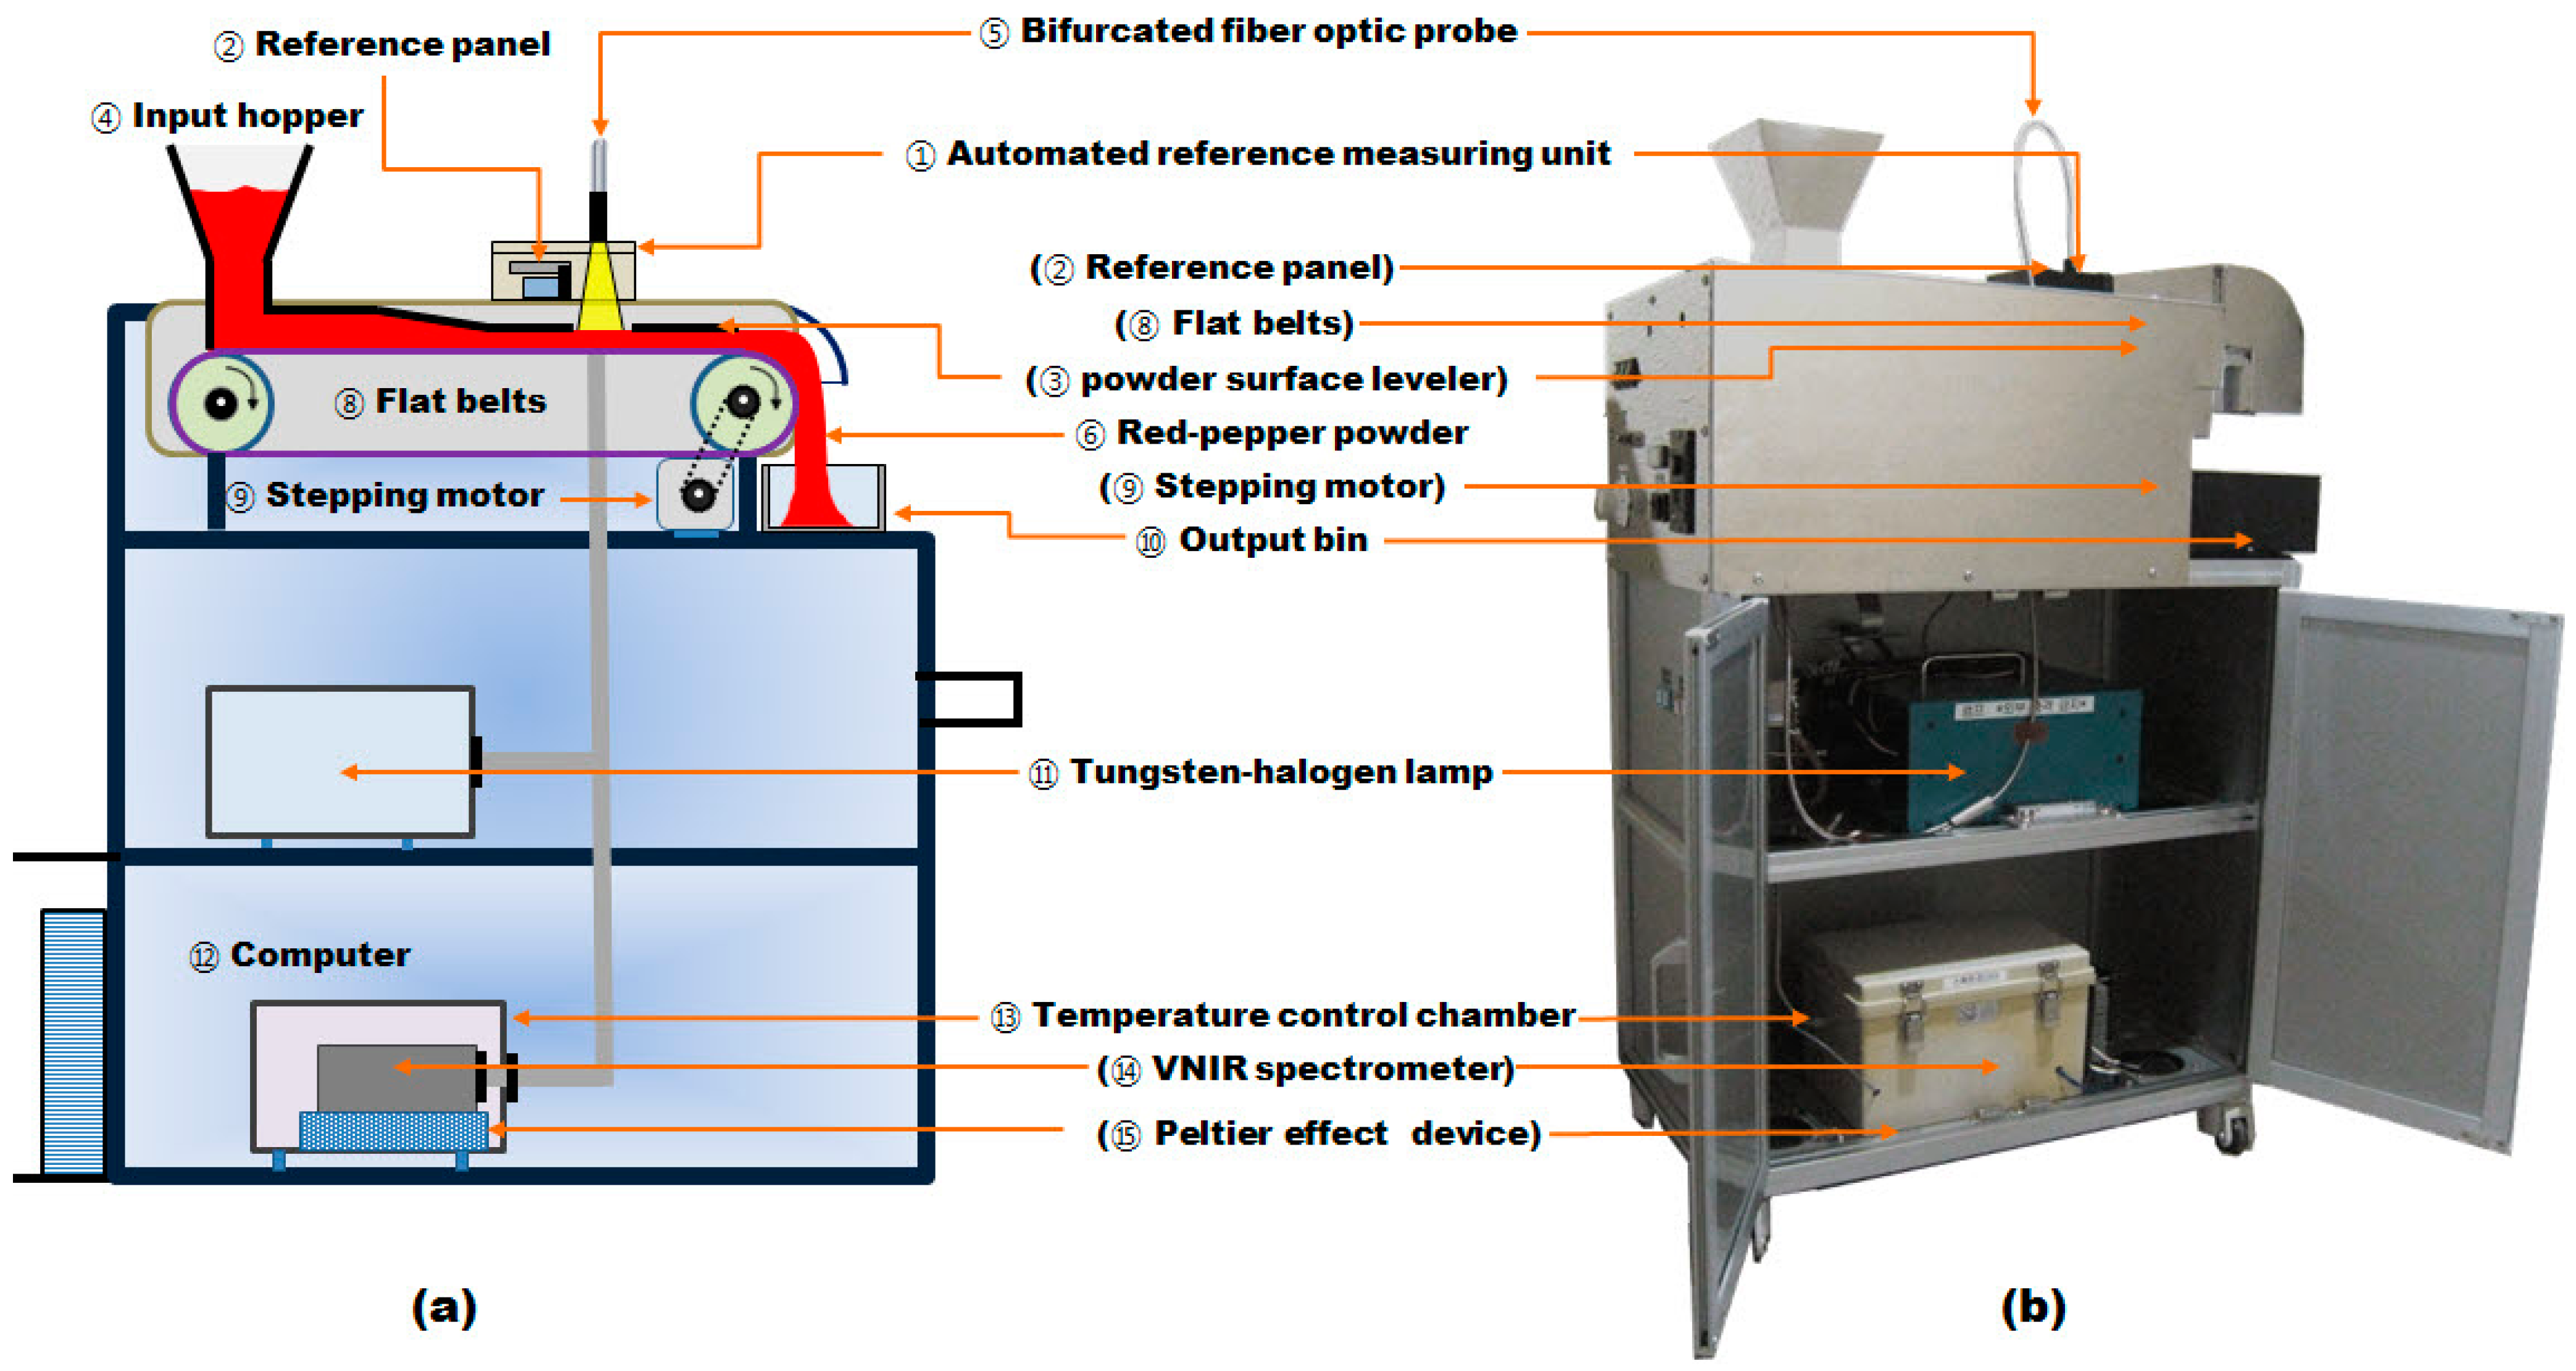
2.2. Critical Parts
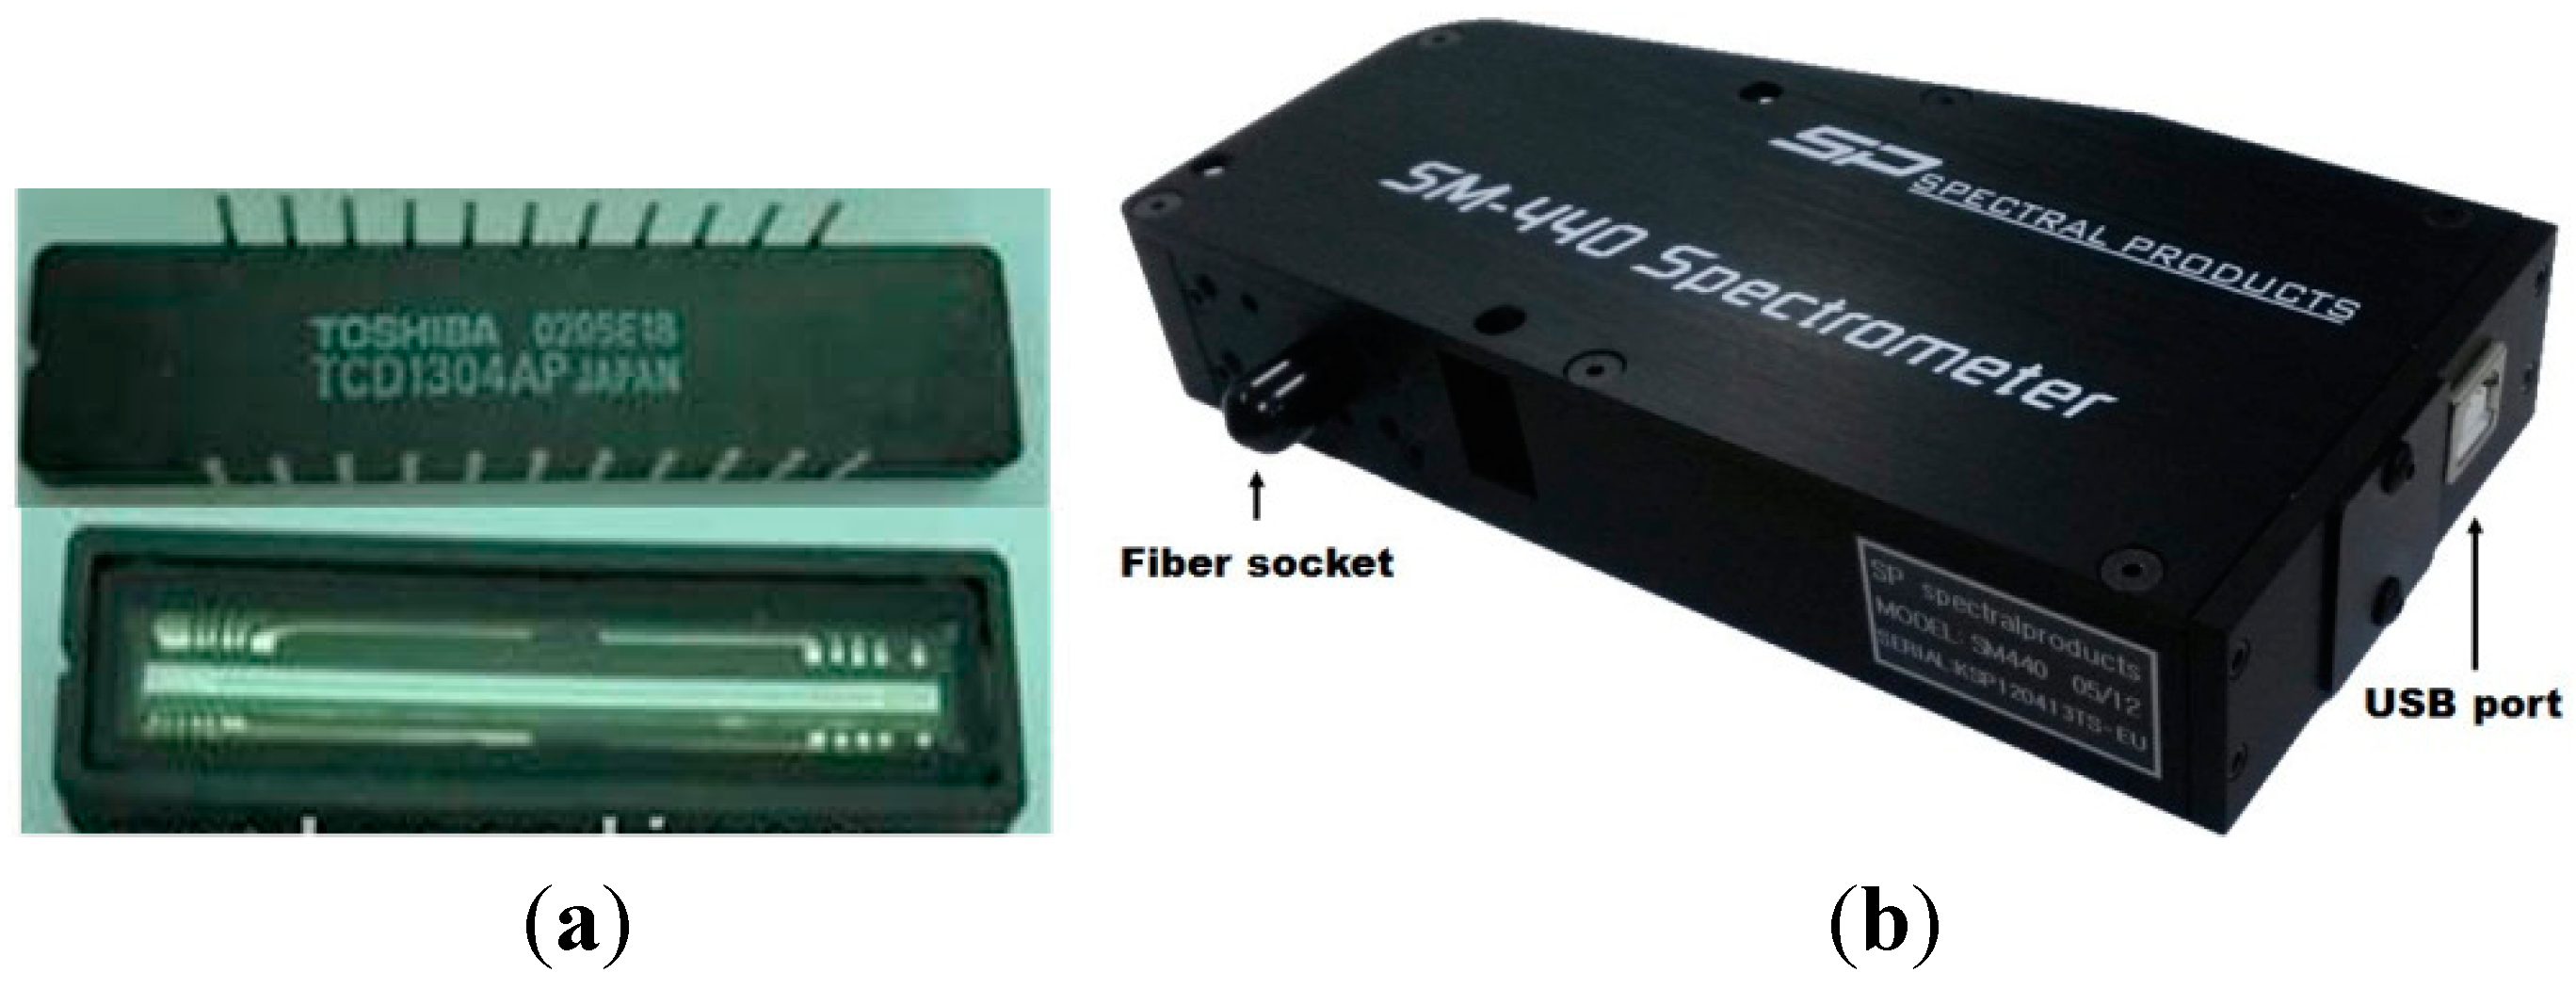
2.2.1. Visible and NIR Spectrometer

| Detector | Number of pixels: 3648 Sensing pixel size: 8 × 200 μm |
| Computer interface | USB 1.1/2.0 16 bit 500 kHz |
| Slit | 50 μm |
| Fiber coupler | SMA 905/FC standard |
| Spectral rage | 145–1176 nm |
| Dimensions | 142 × 70 × 22 nm |
| Weight | 408 g |

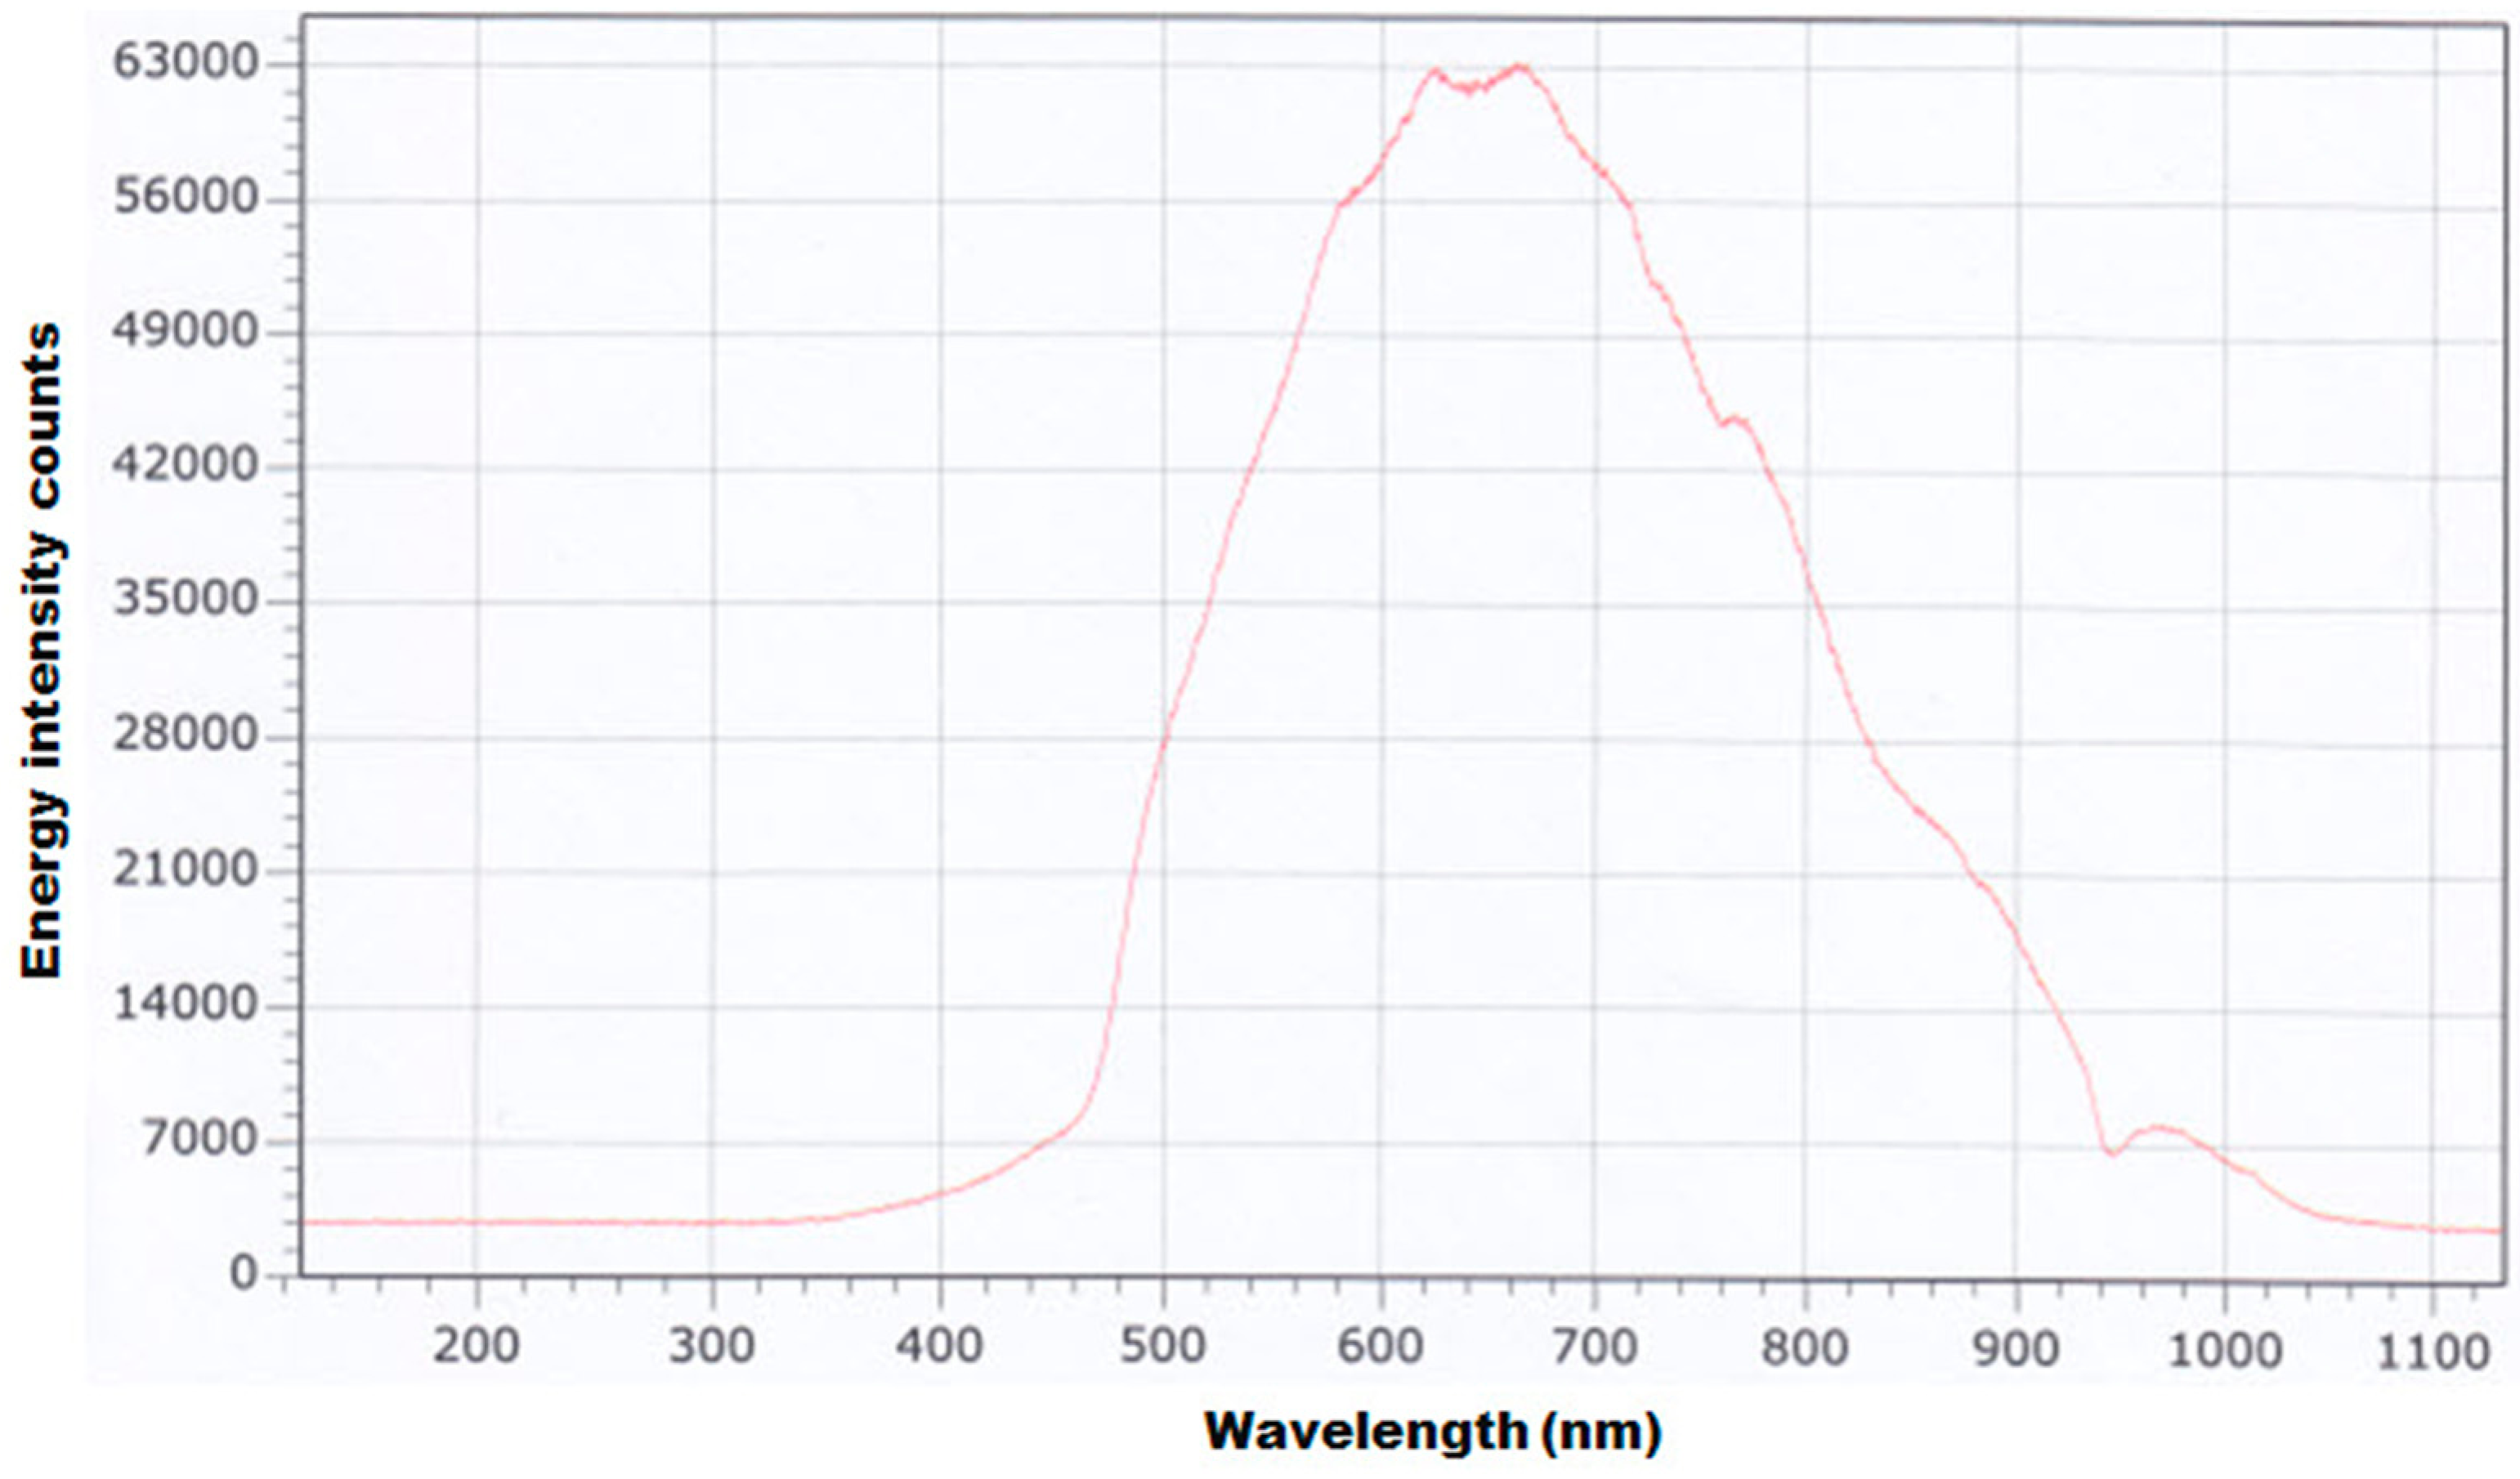
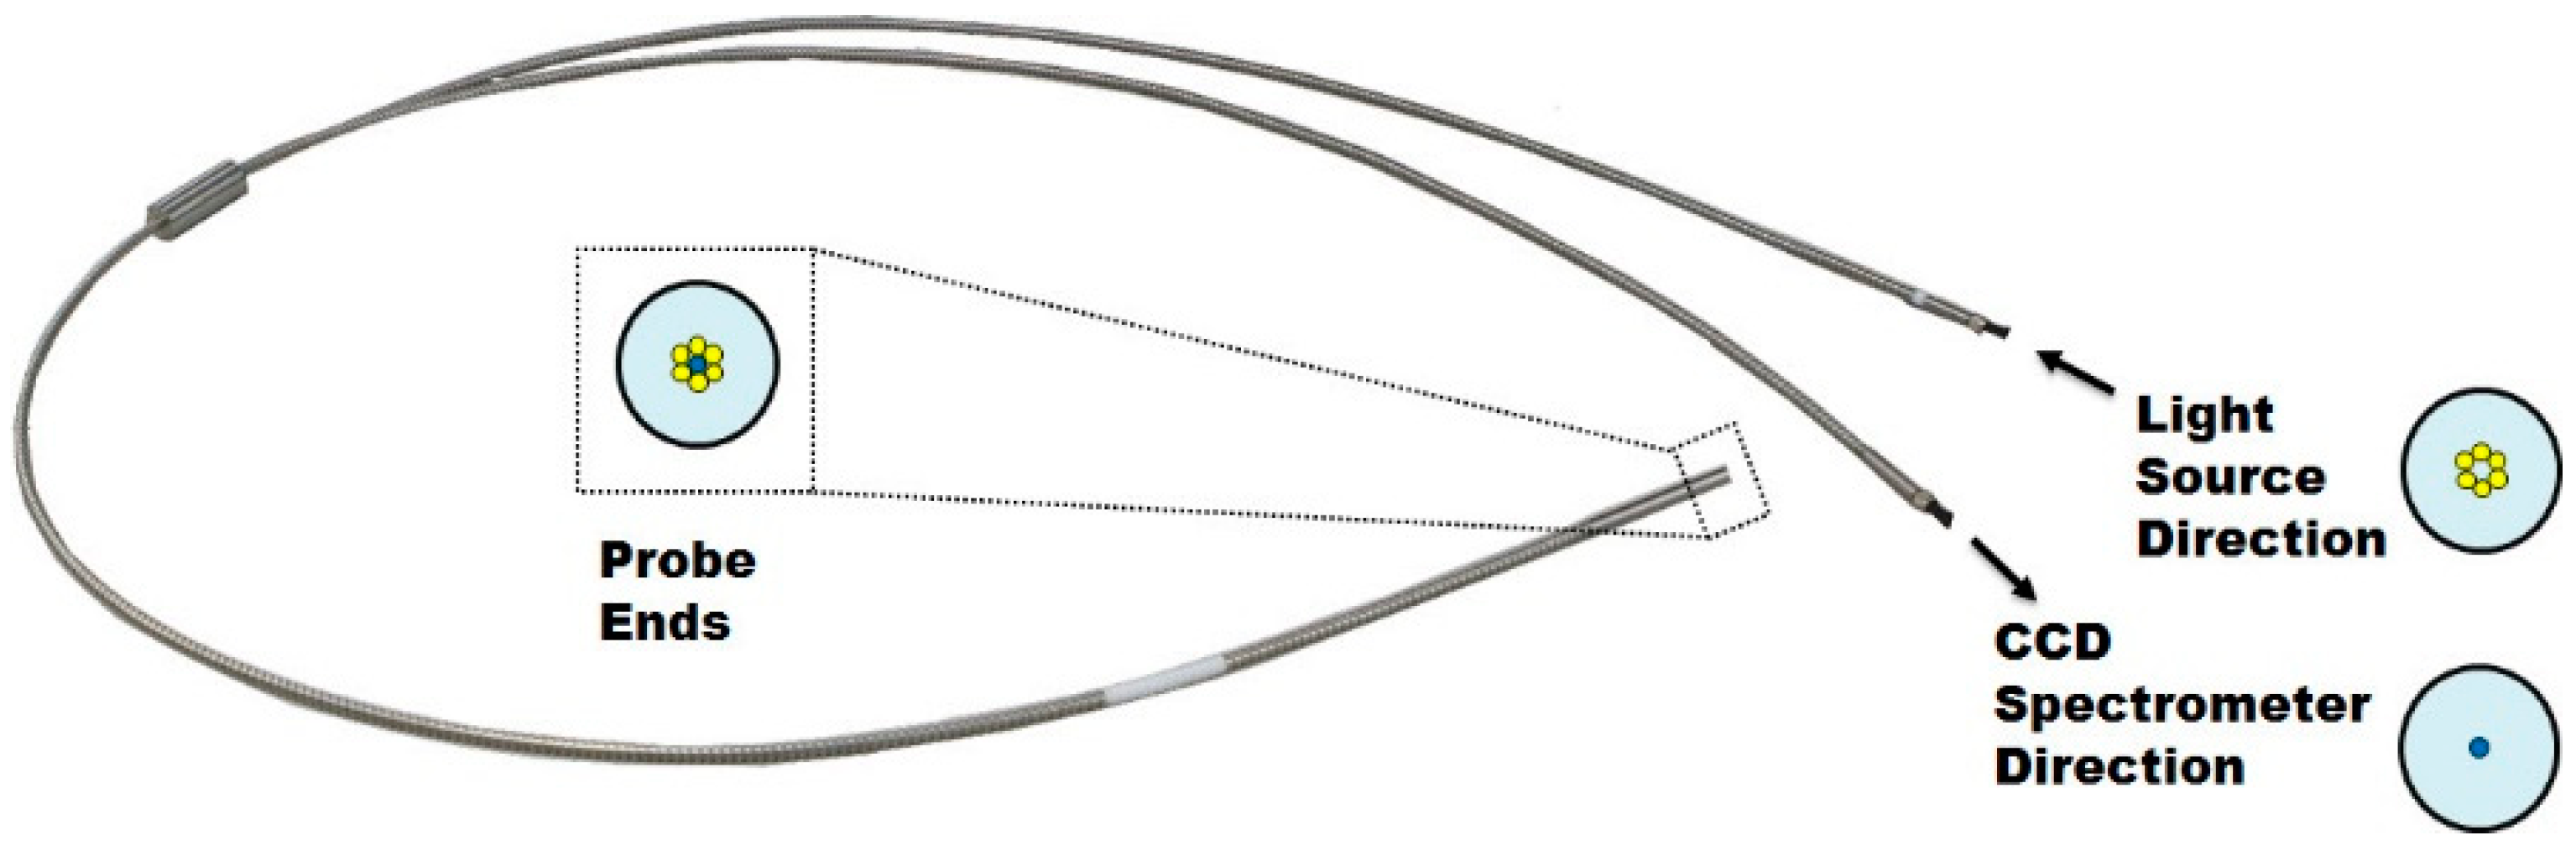
2.2.2. Light Source and Fiber Optic Probe

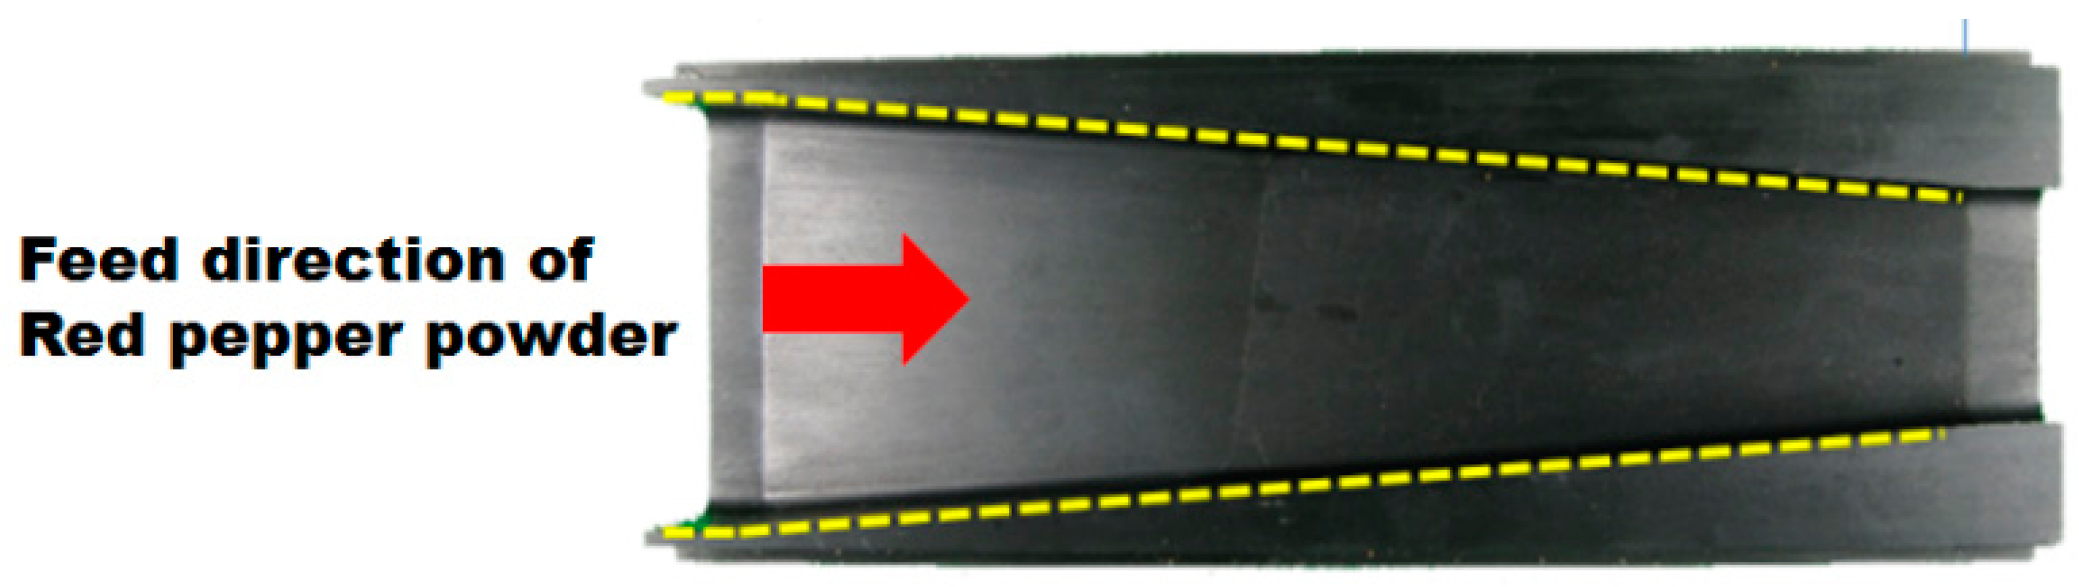
2.2.3. Powder Surface Leveler

2.2.4. Automated Reference Measuring Unit
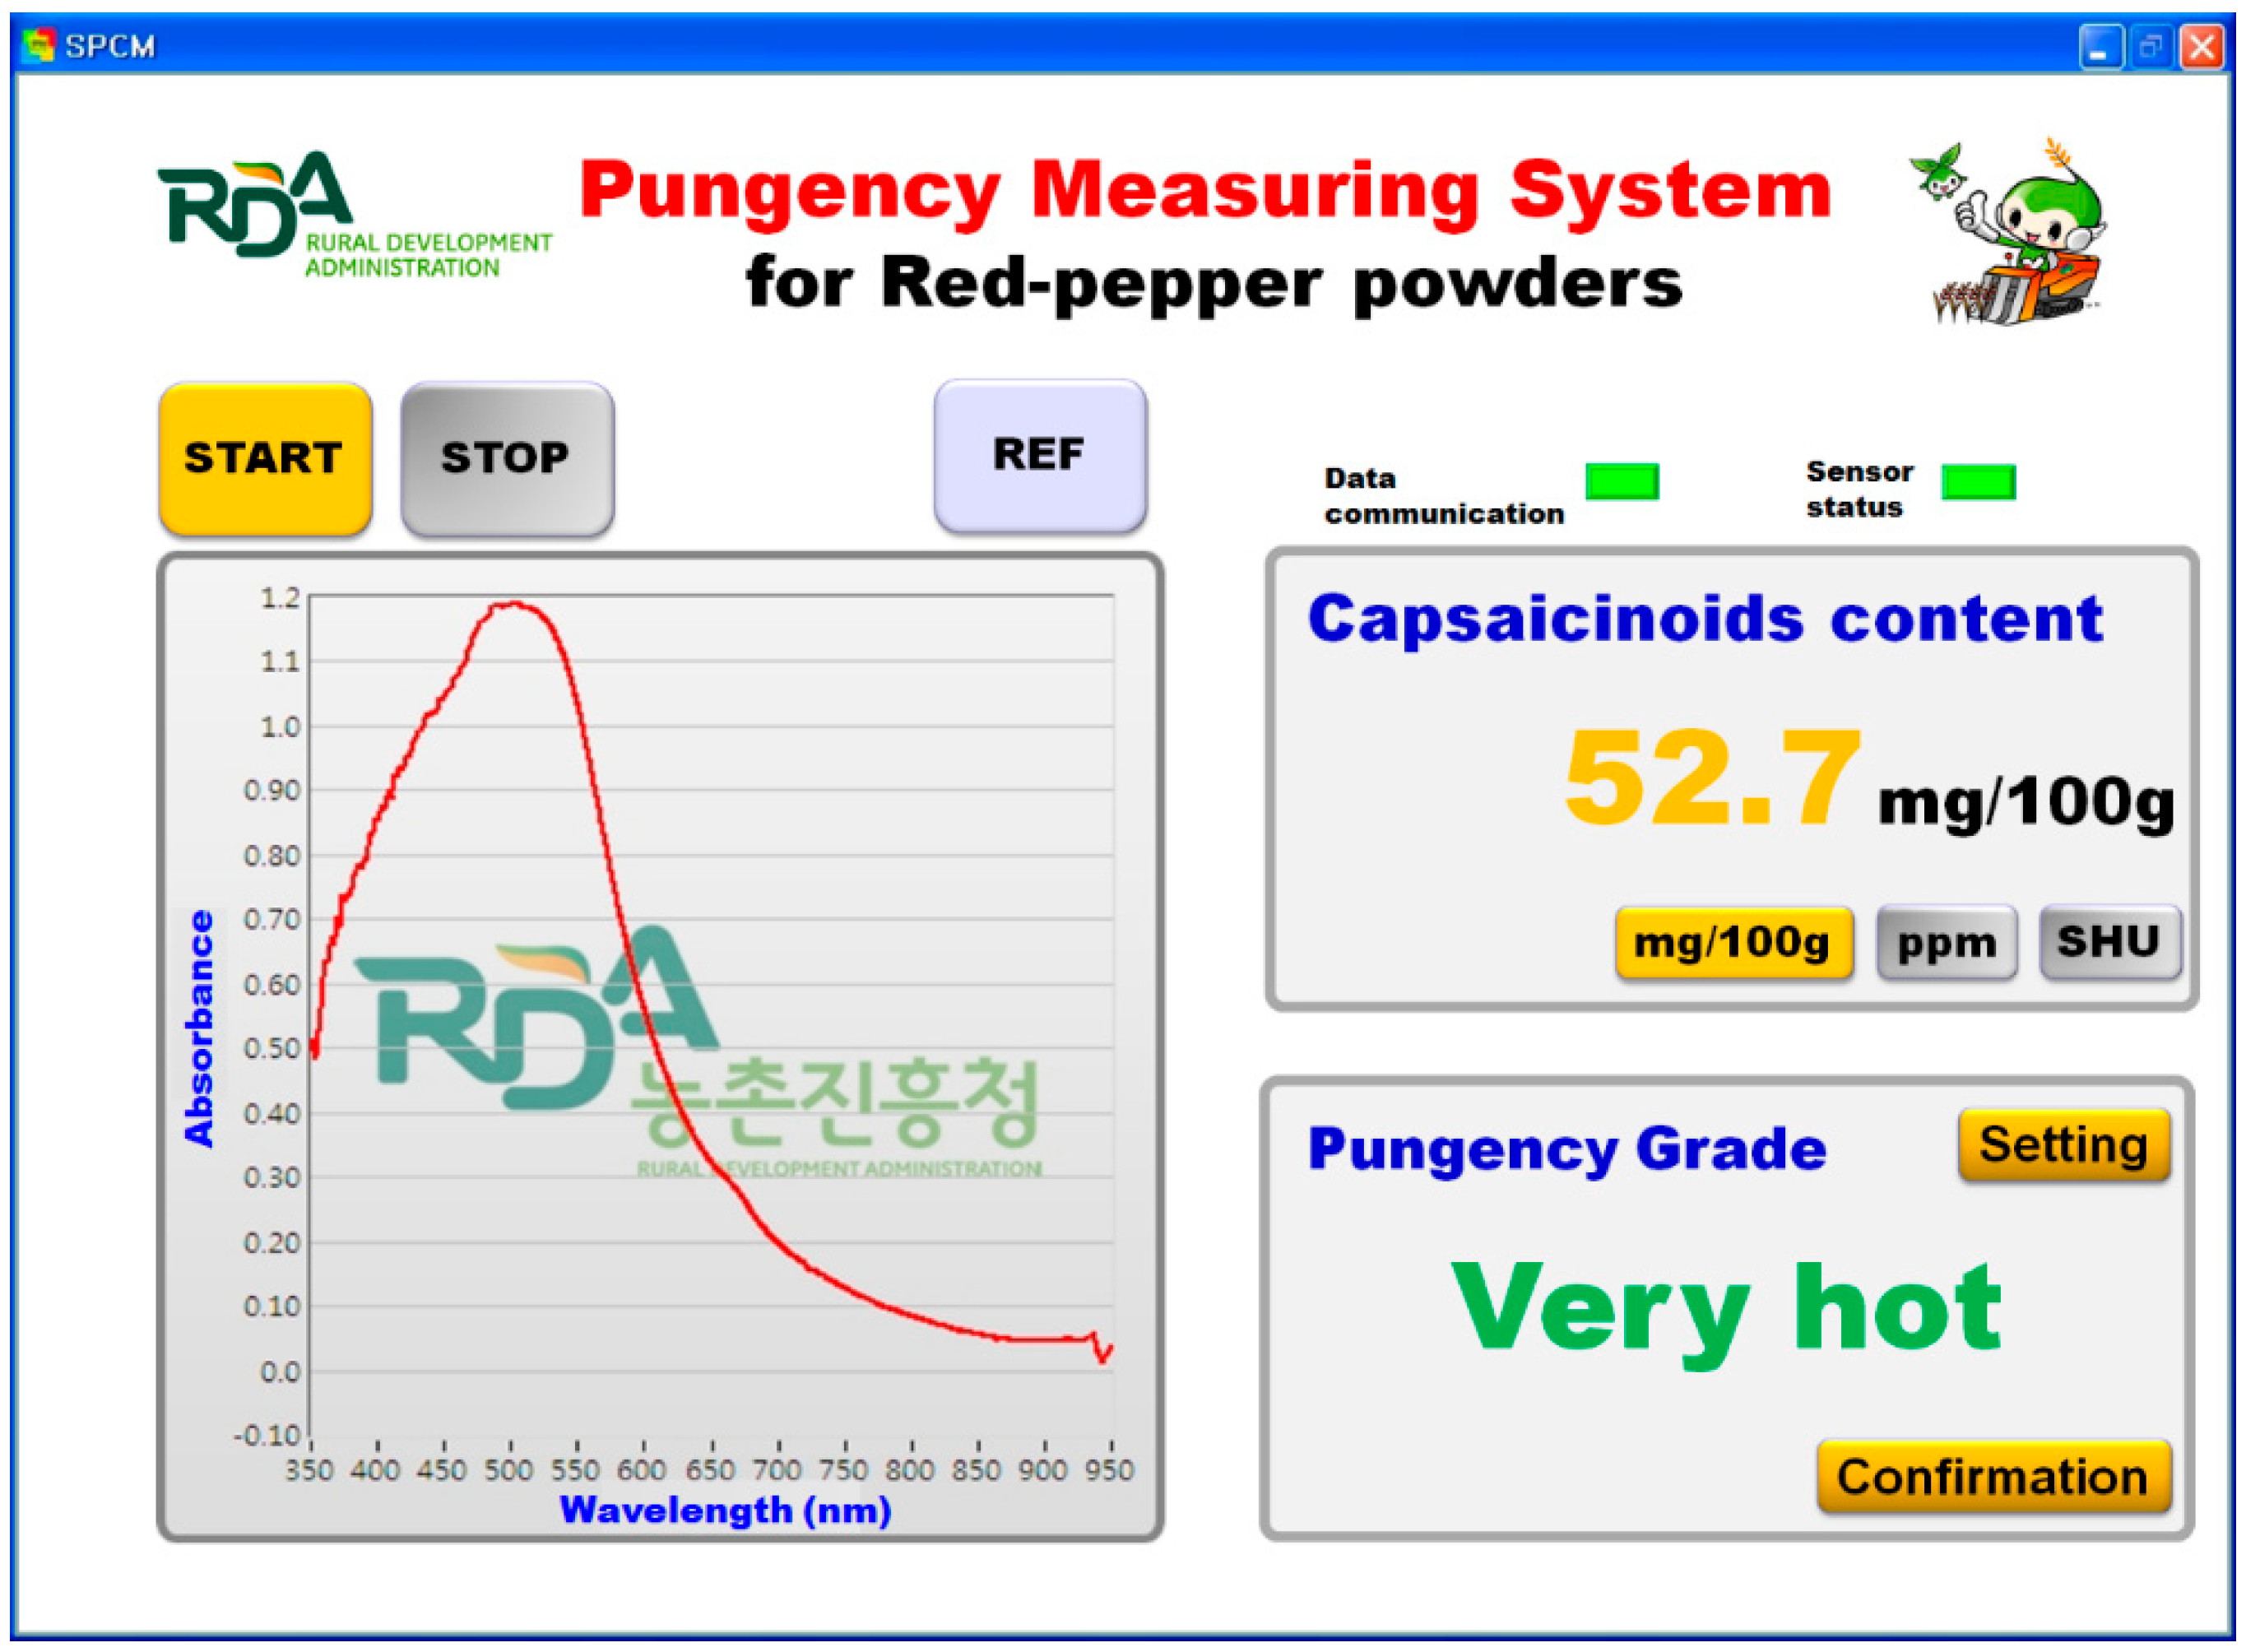
2.2.5. Interface Program
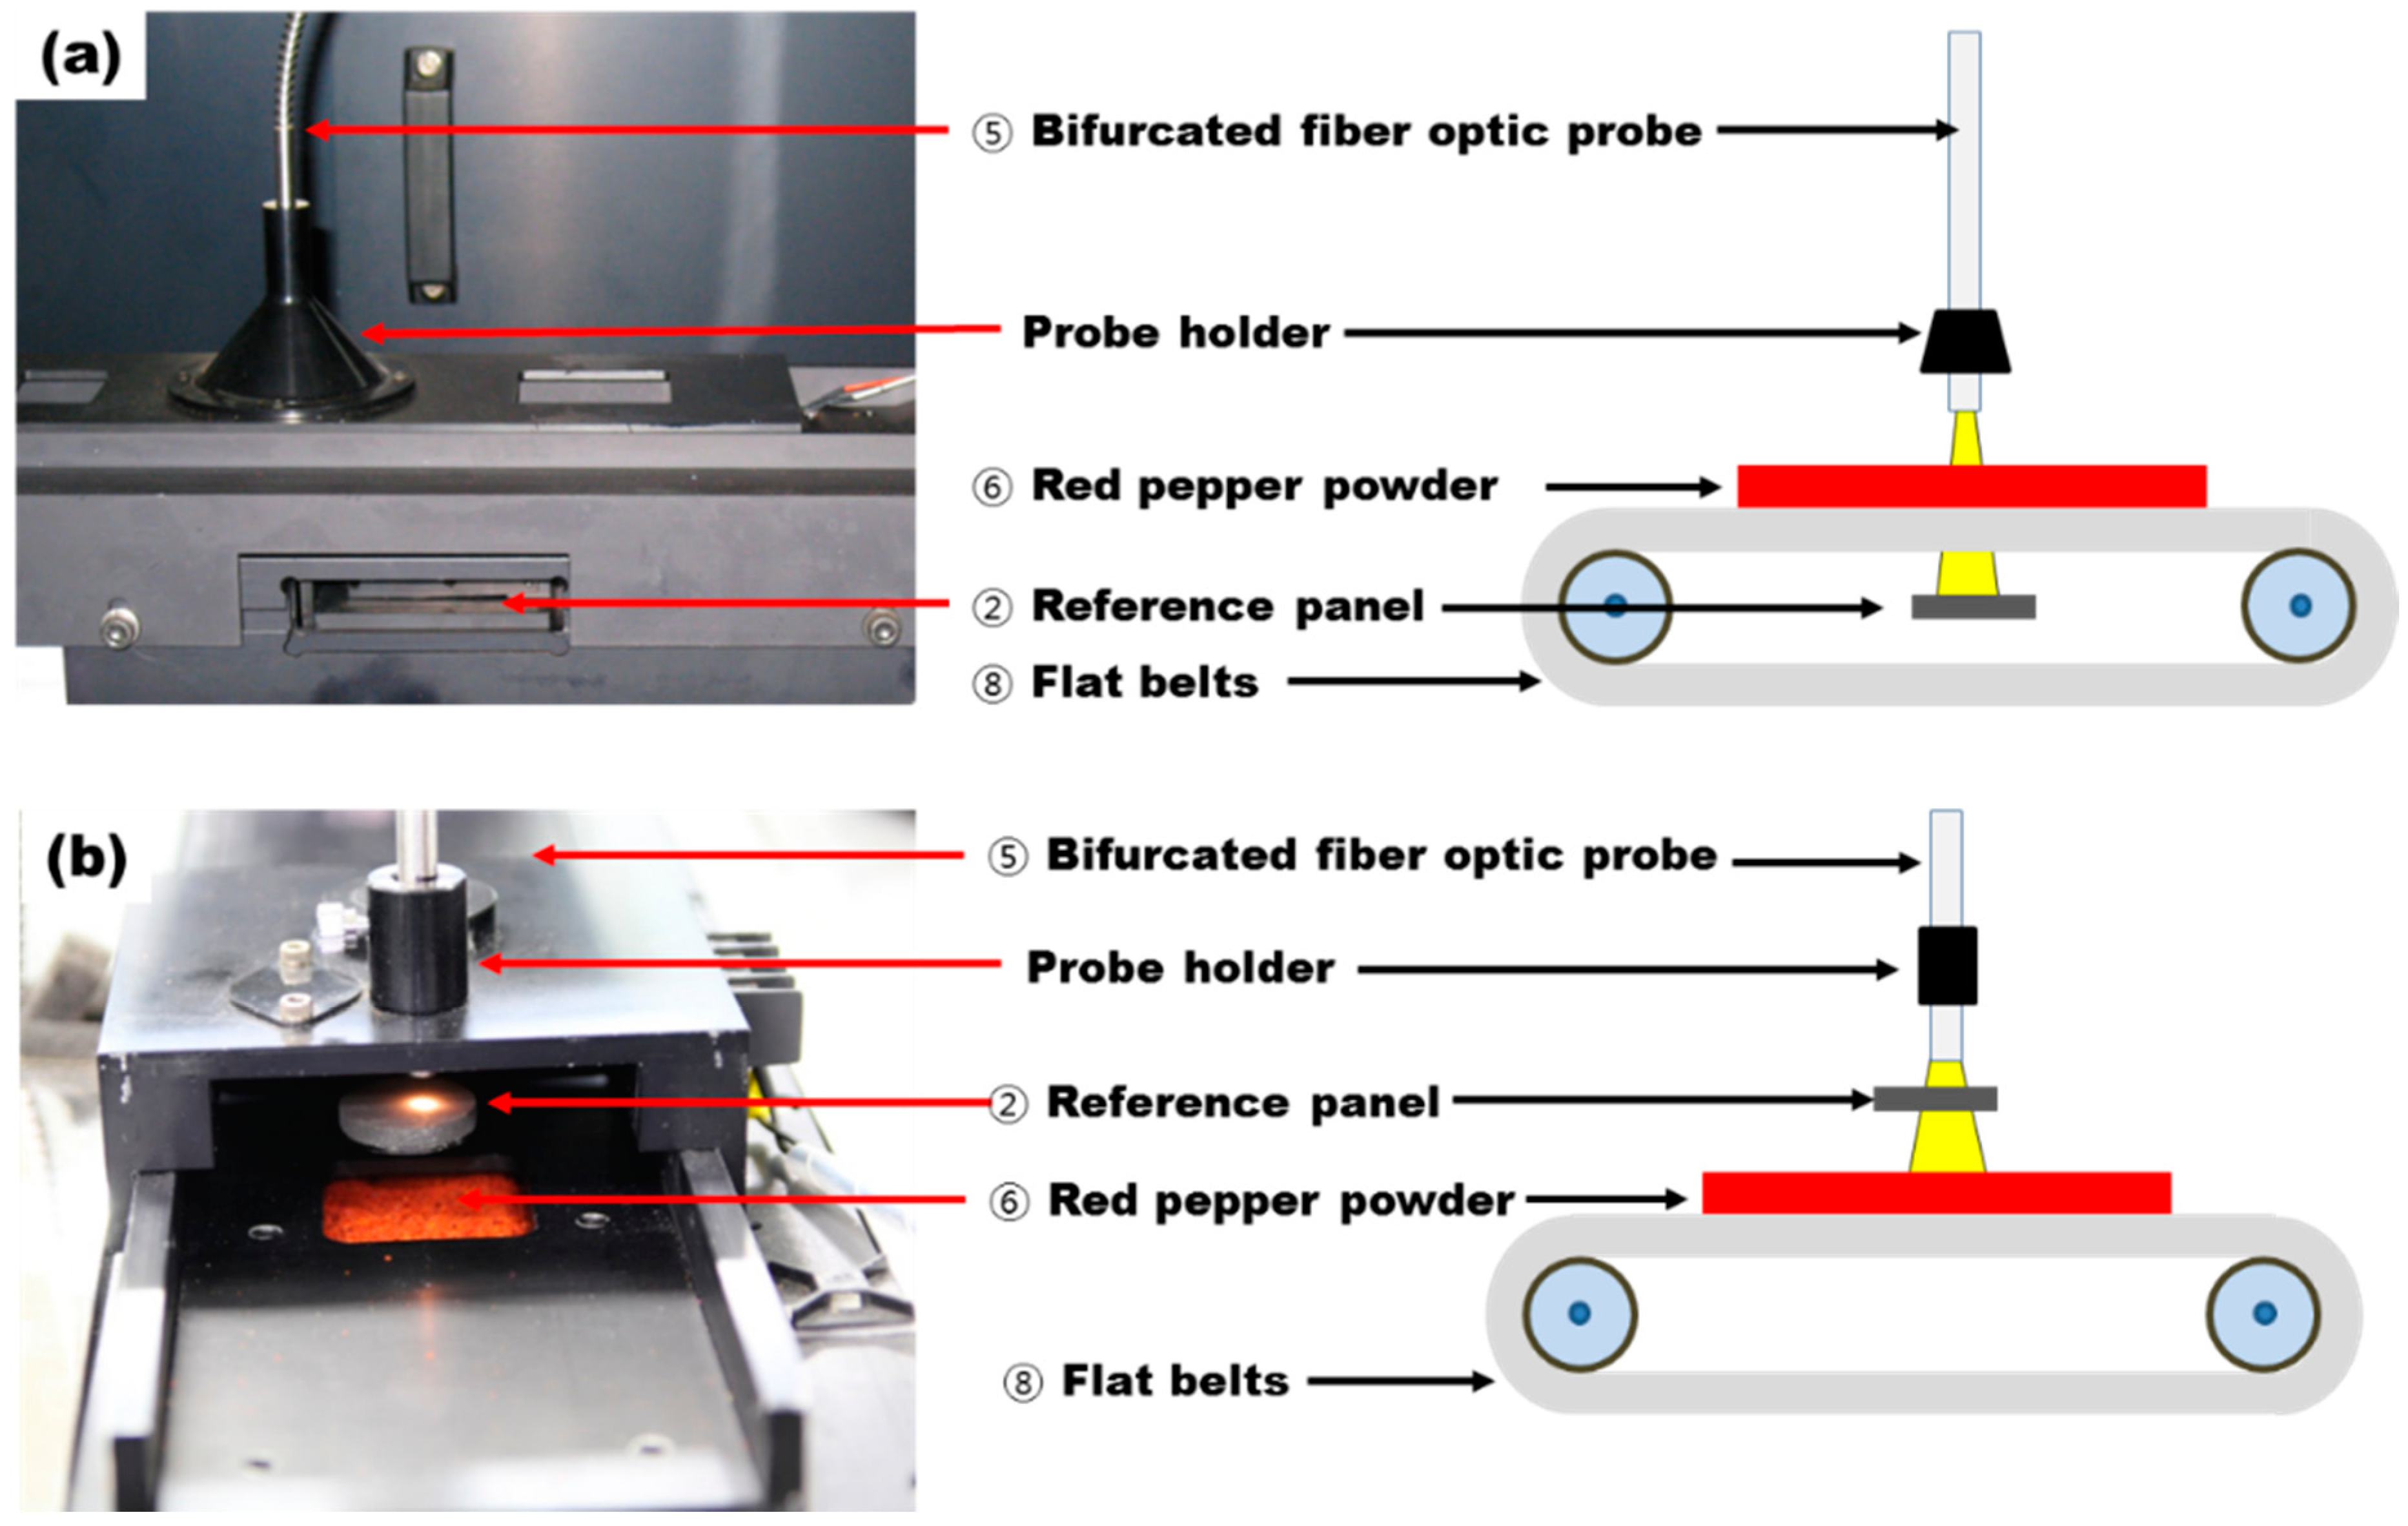
2.3. Integration of Components
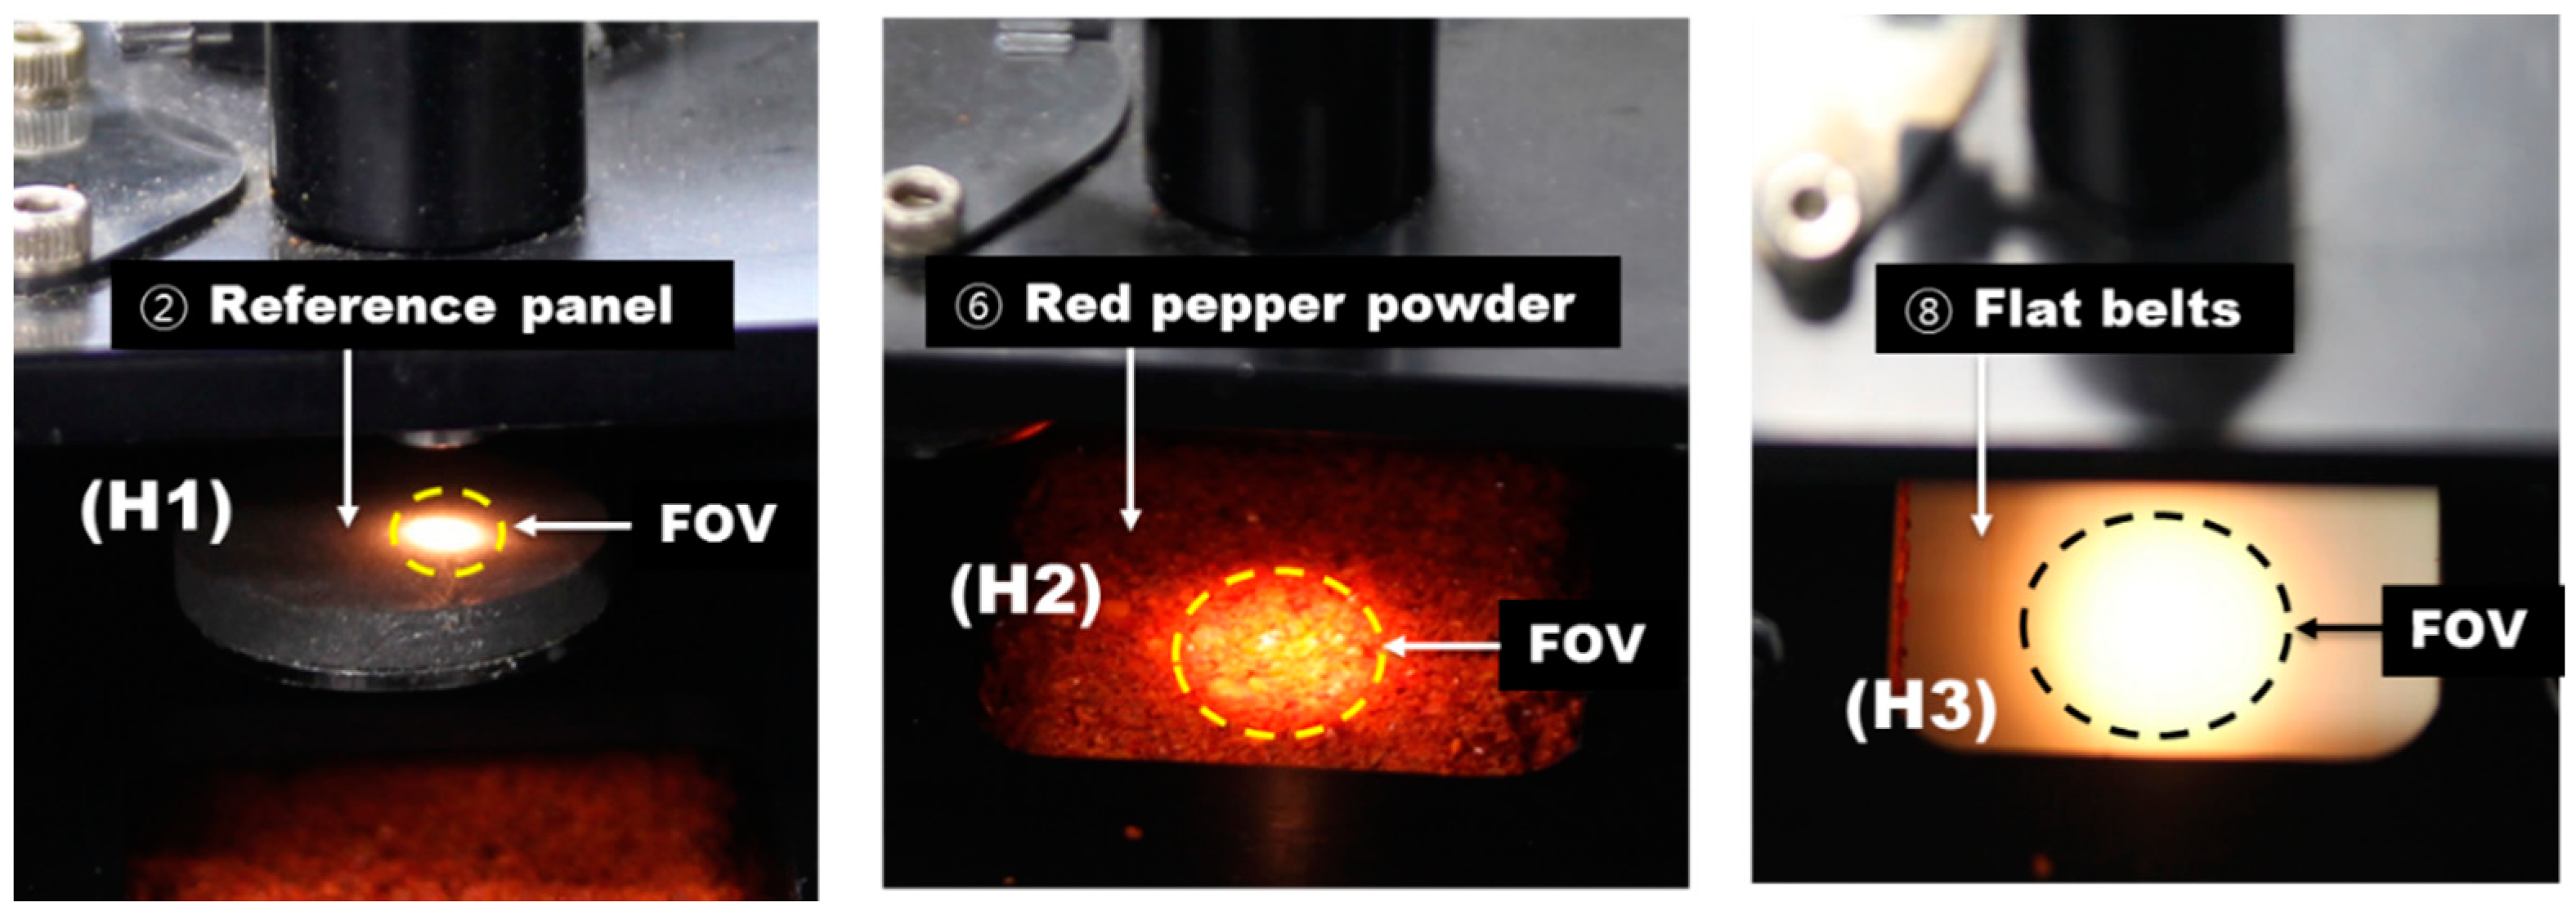
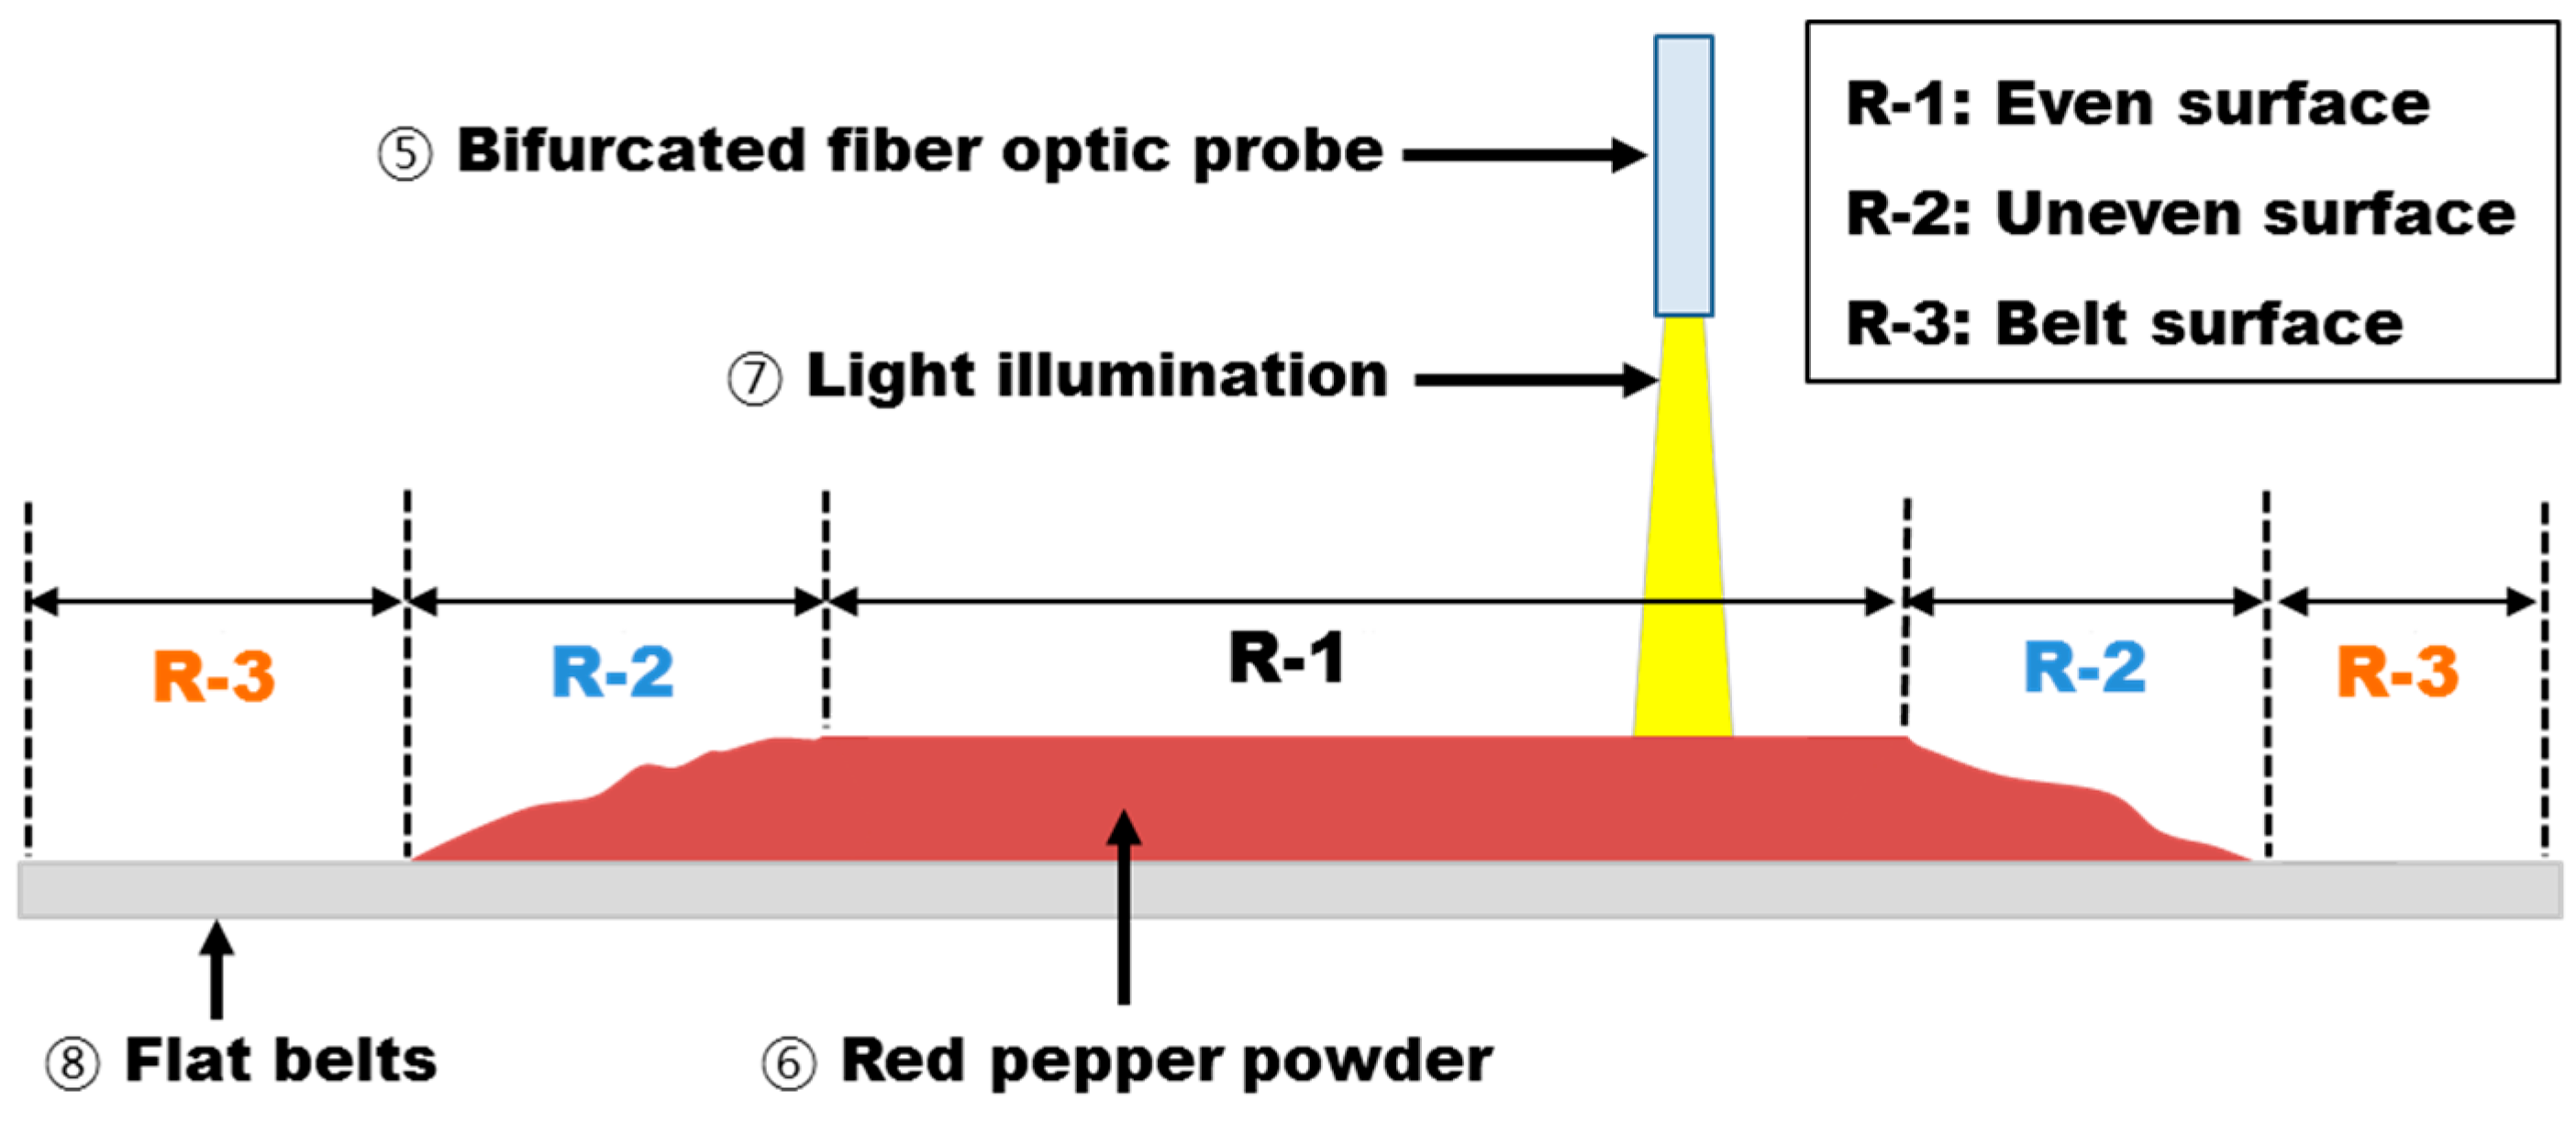
2.4. Experimental Setup
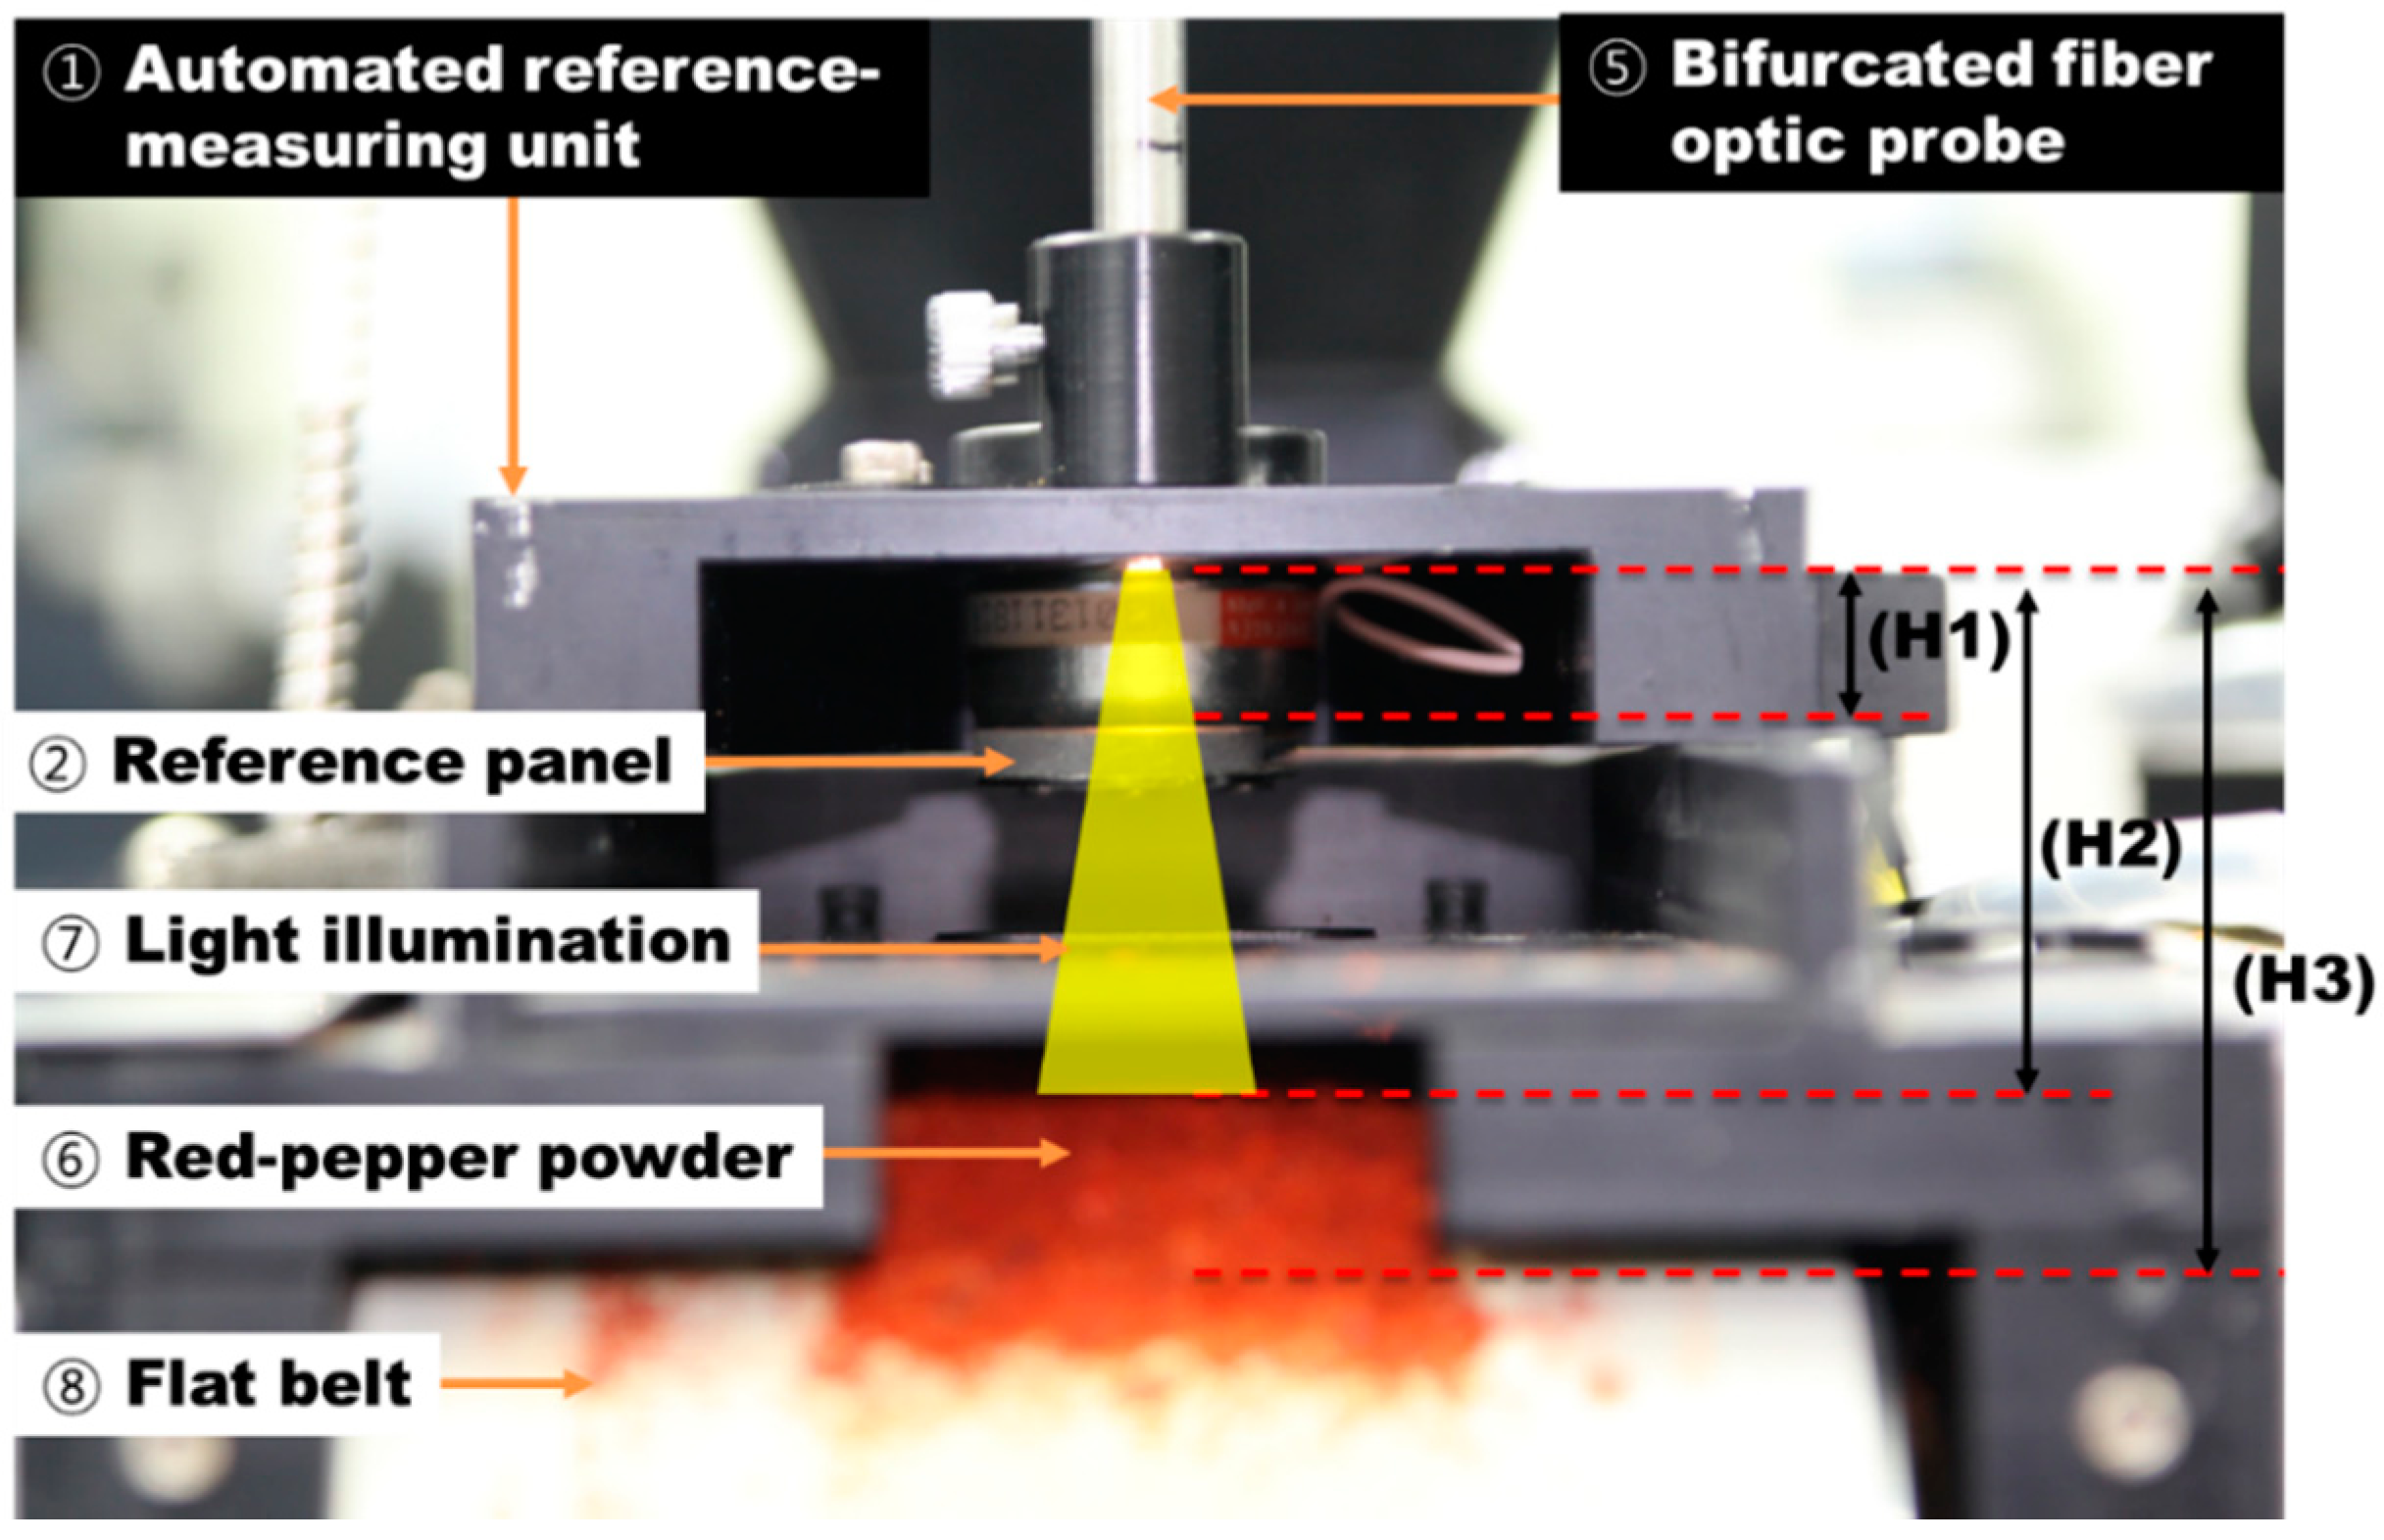

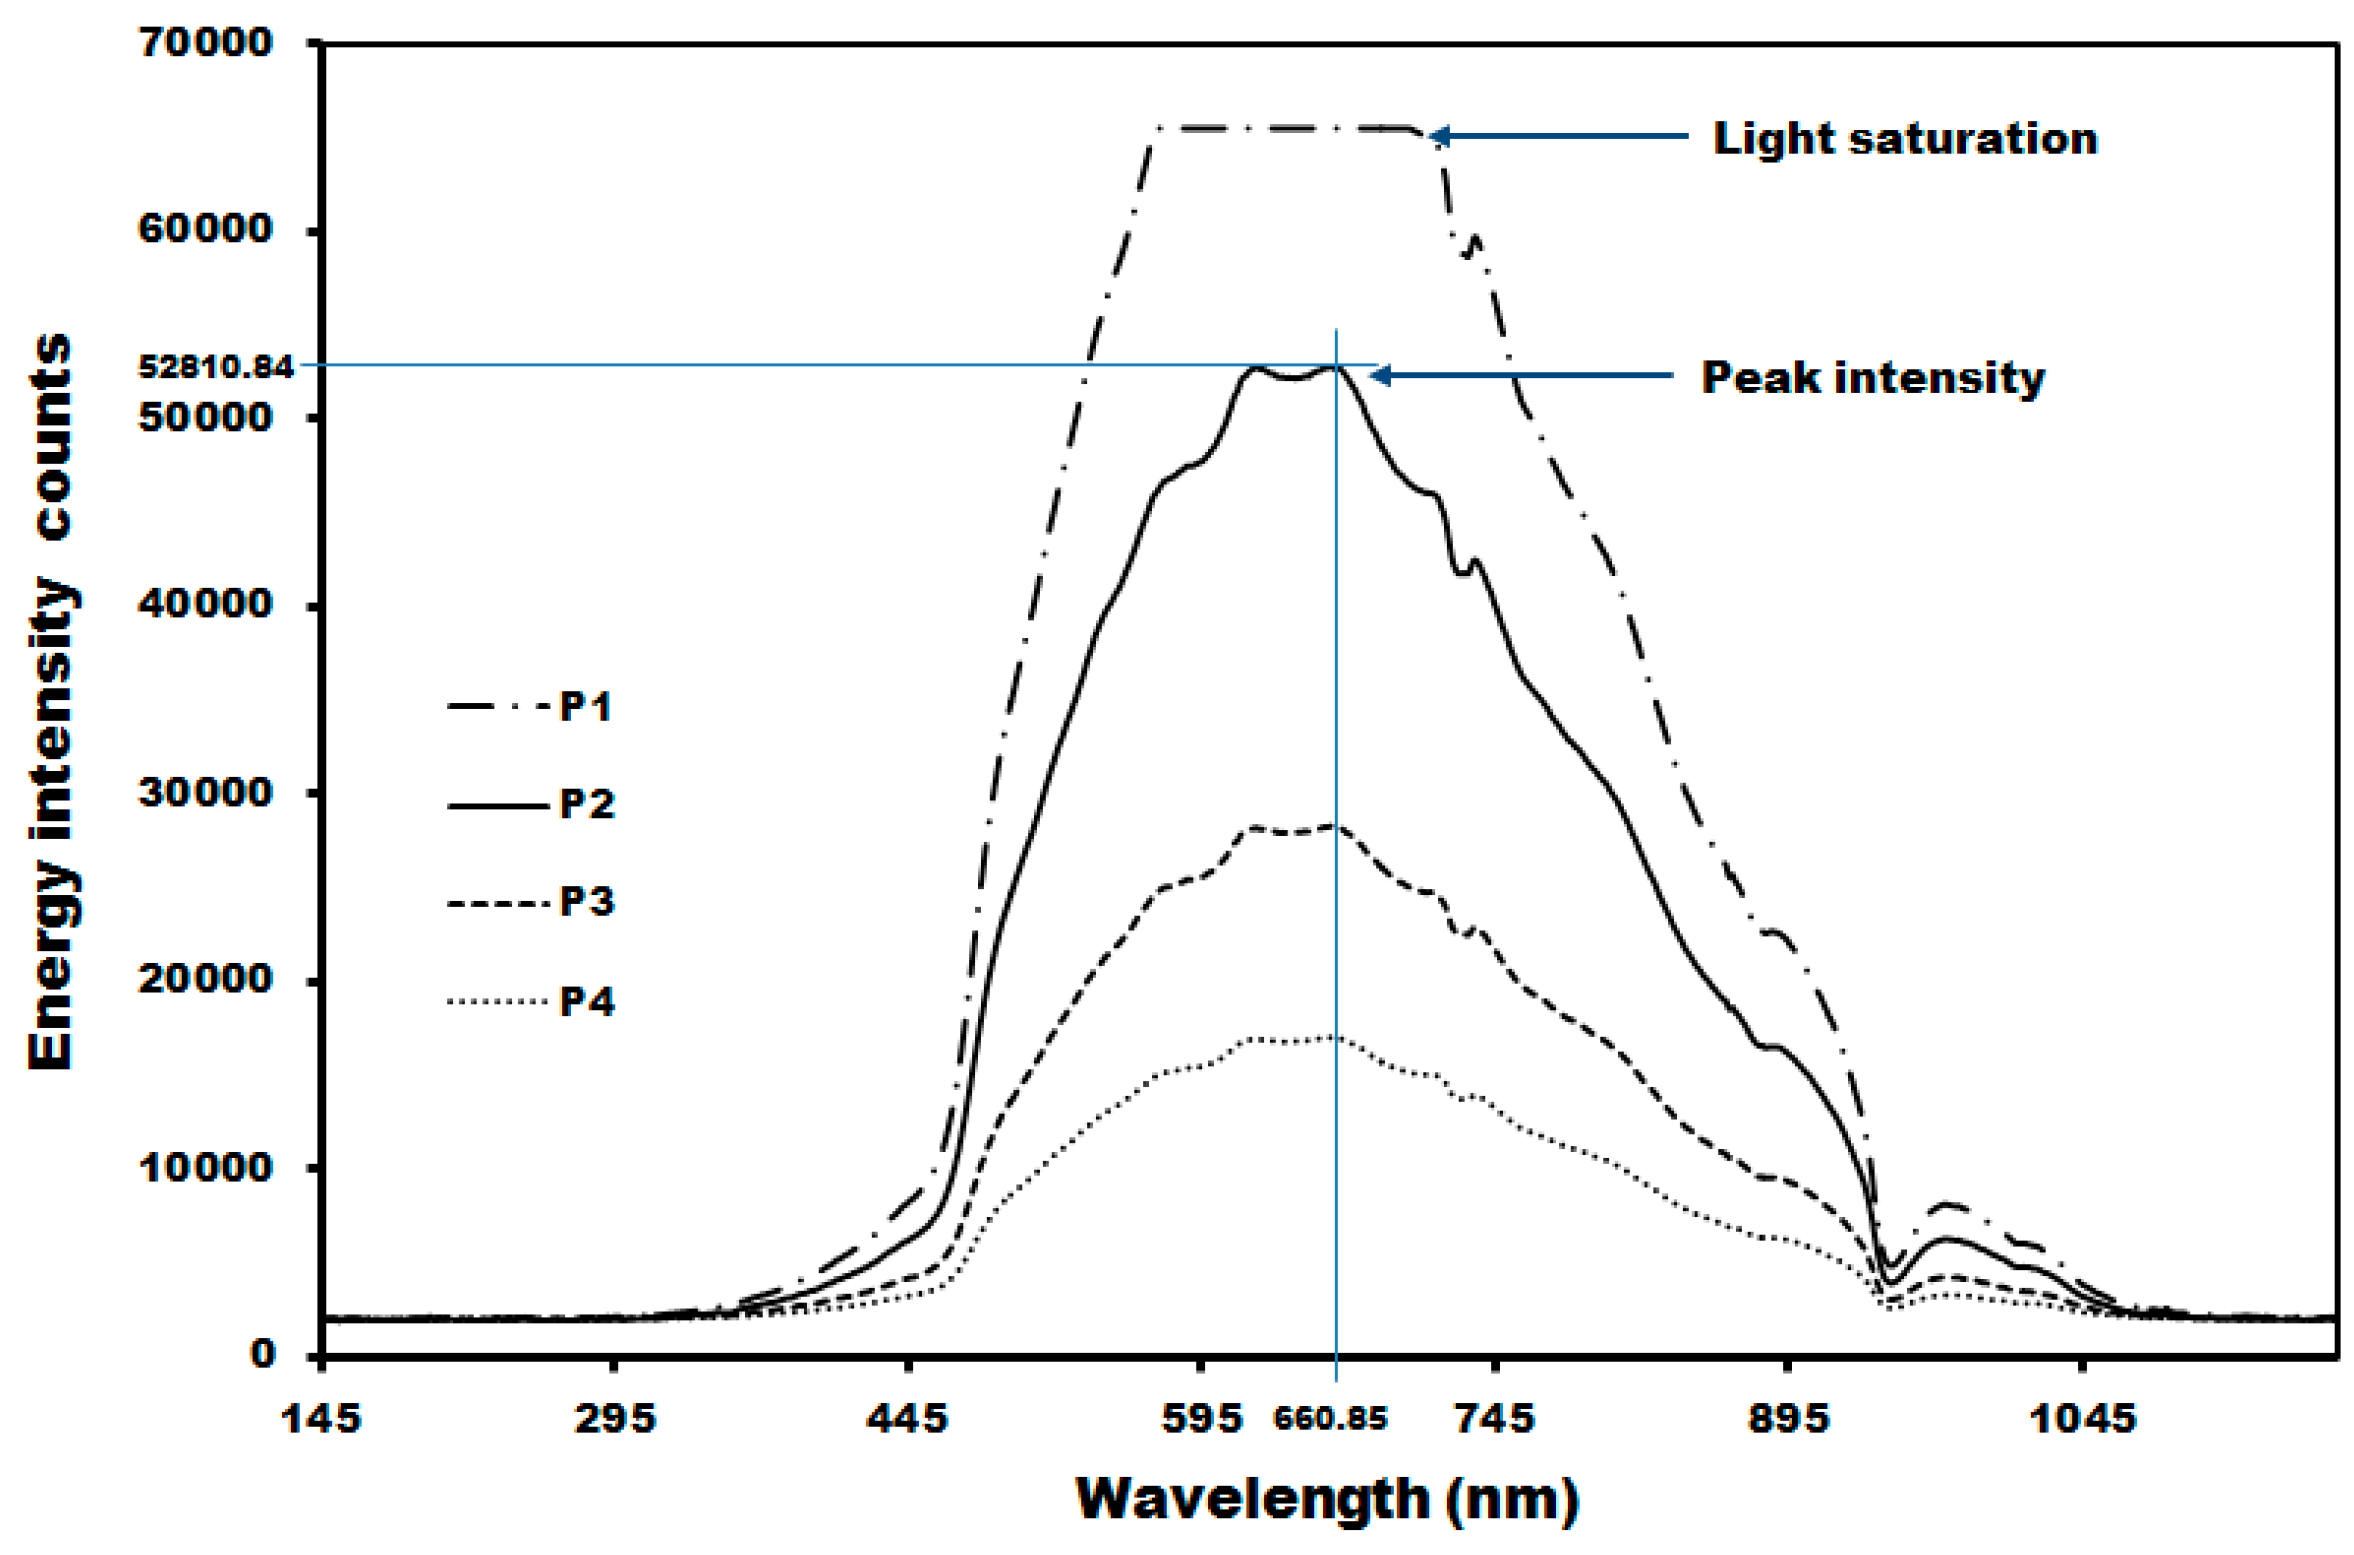
| Spectrum Types | Distance to Probe End | FOV (mm2) | Distances (mm) | Peak Intensity |
|---|---|---|---|---|
| P1 | H1 | 4.9 | 2 | 65,538 |
| H2 | 56.7 | 25 | ||
| H3 | 122.7 | 34 | ||
| P2 | H1 | 18.1 | 6 | 52,810 |
| H2 | 102.1 | 29 | ||
| H3 | 153.9 | 38 | ||
| P3 | H1 | 22.1 | 9 | 28,330 |
| H2 | 128.7 | 32 | ||
| H3 | 193.6 | 41 | ||
| P4 | H1 | 28.3 | 12 | 17,050 |
| H2 | 143.1 | 35 | ||
| H3 | 219.0 | 42 |

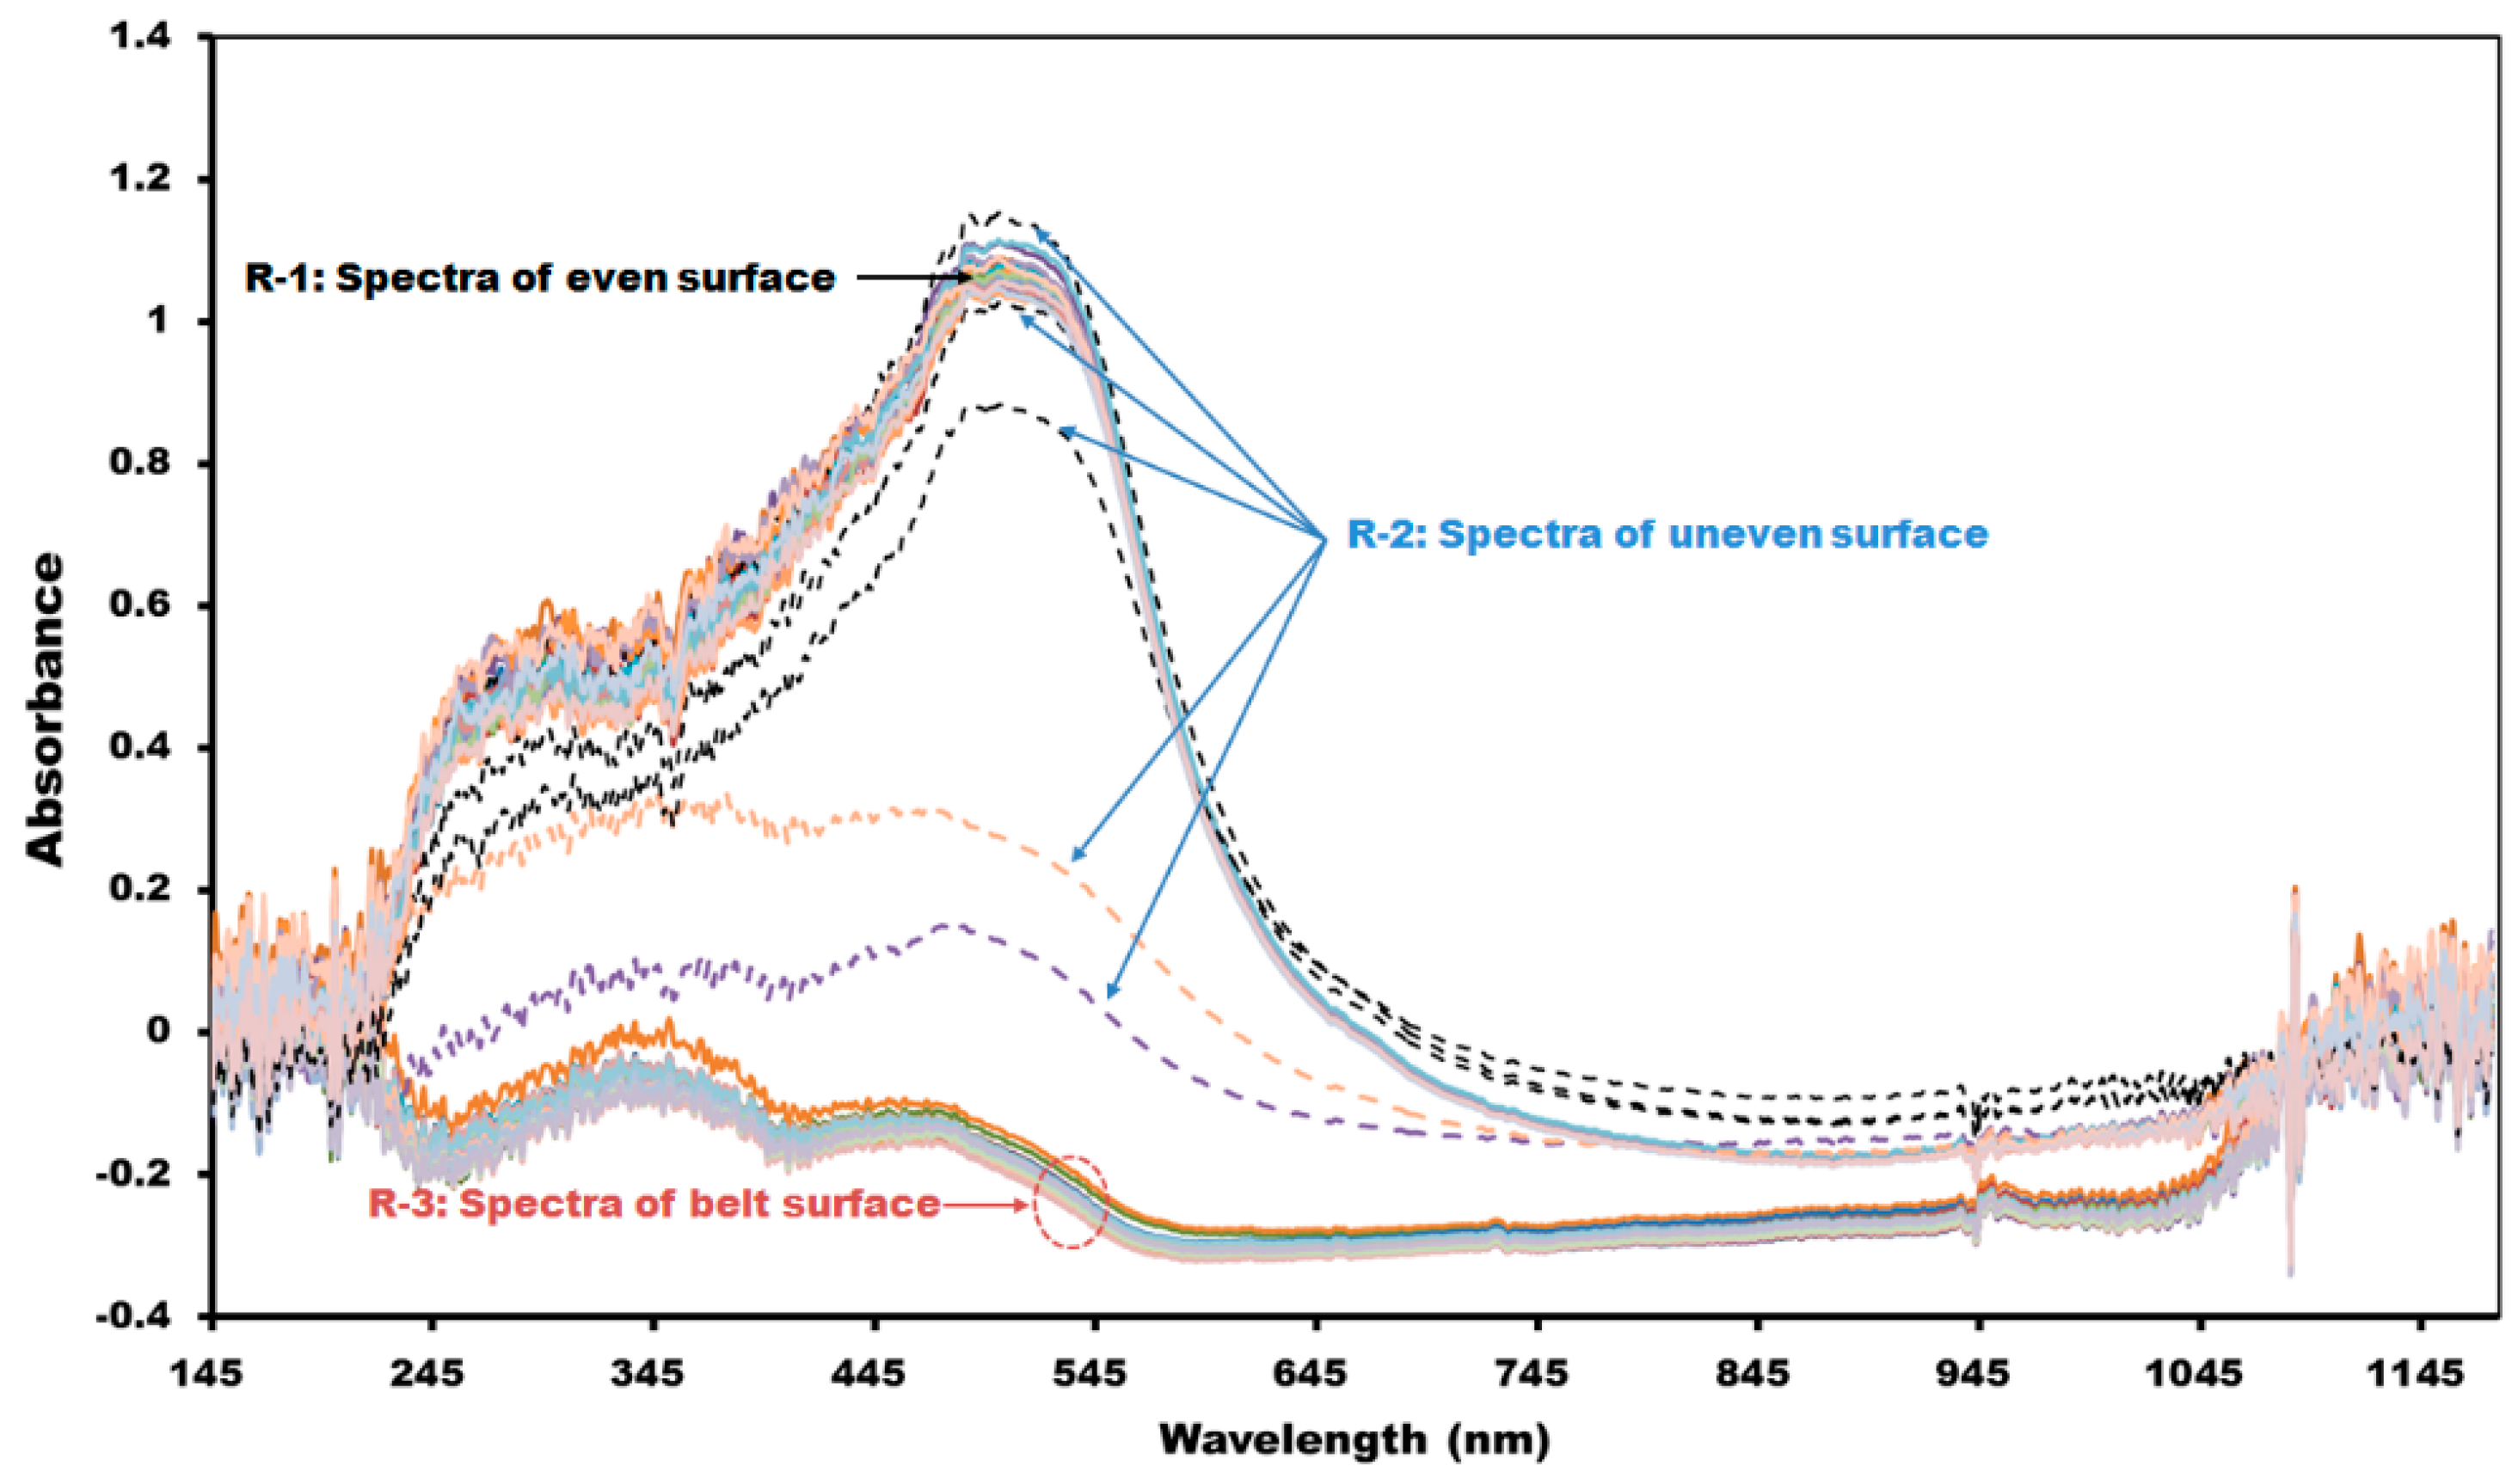
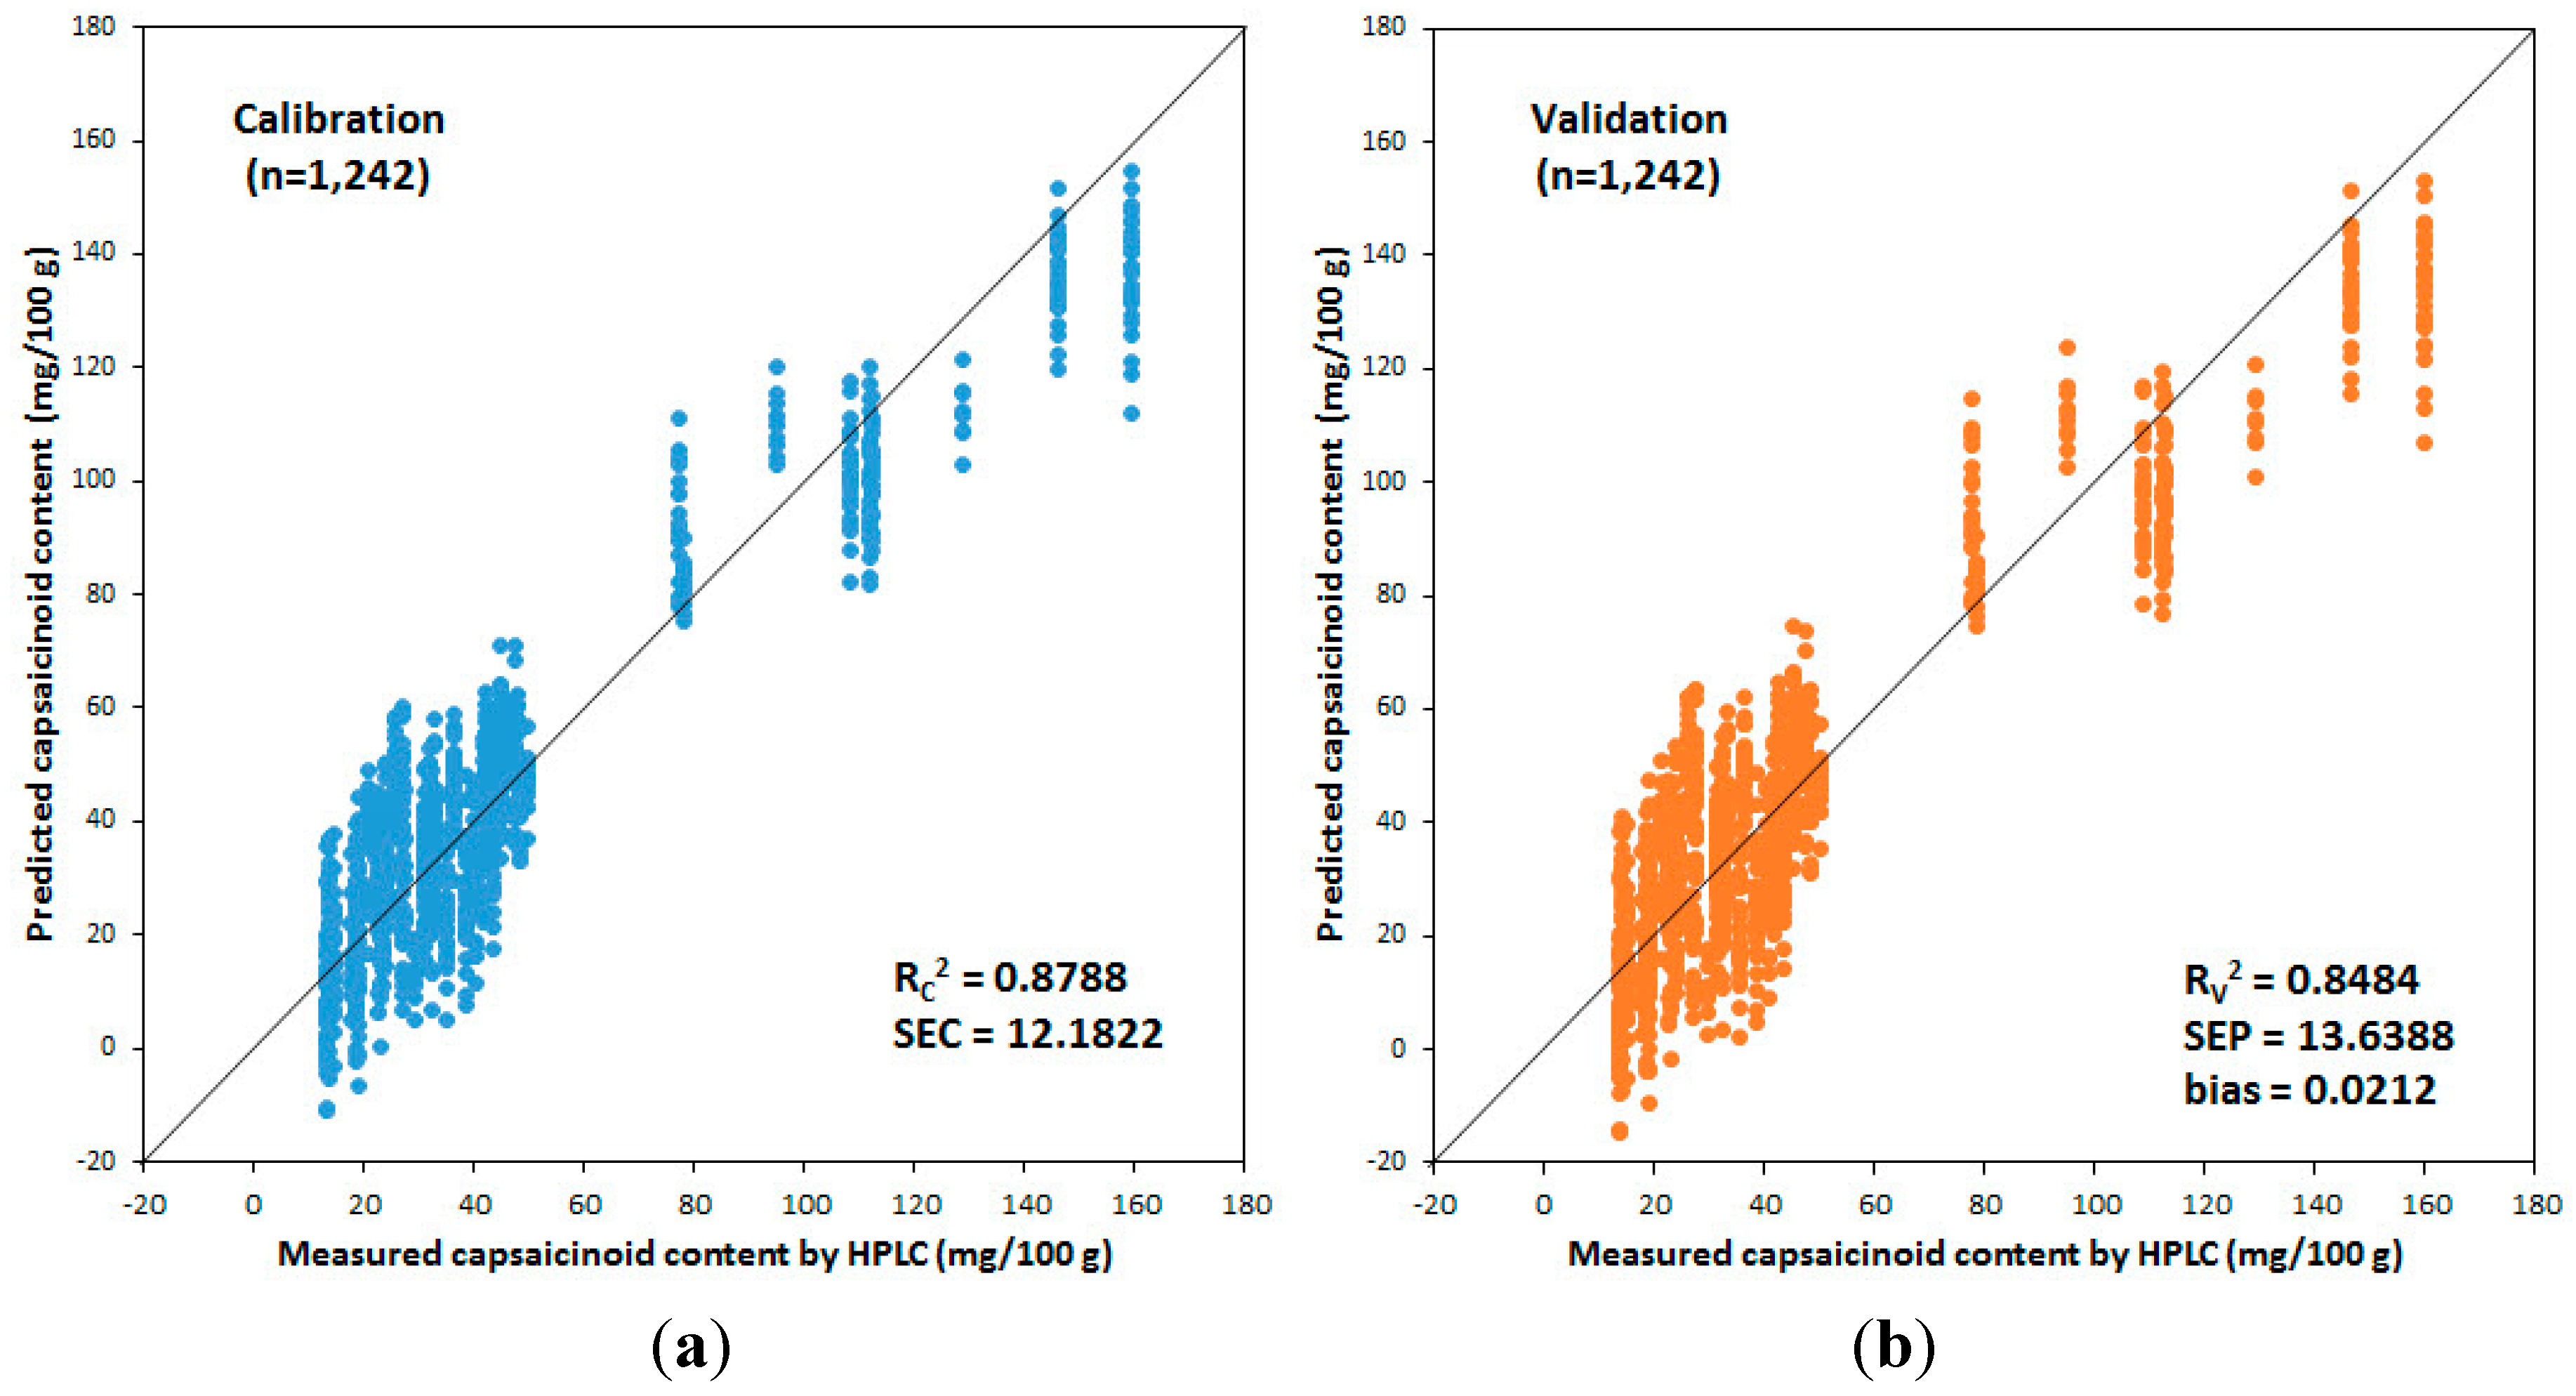
3. Experimental Results

4. Conclusions and Outlook
Acknowledgments
Author Contributions
Conflicts of Interest
References
- Sim, K.H.; Sil, H.Y. Antioxidant activities of red pepper (Capsicum annuum) pericarp and seed extracts. Int. J. Food Sci. Technol. 2008, 43, 1813–1823. [Google Scholar] [CrossRef]
- Lim, J.G.; Mo, C.Y.; Kim, G.Y.; Kang, S.W.; Lee, K.J.; Kim, M.S.; Moon, J.H. Non-destructive and Rapid Prediction of Moisture Content in Red Pepper (Capsicum annuum L.) Powder Using Near-infrared Spectroscopy and a Partial Least Squares Regression Model. J. Biosyst. Eng. 2014, 39, 184–193. [Google Scholar] [CrossRef]
- Hwang, S.W.; Oh, T.K. Hot channels in airways: Pharmacology of the vanilloidreceptor. Curr. Opin. Pharmacol. 2002, 2, 235–242. [Google Scholar] [CrossRef]
- Hoffman, P.G.; Lego, M.C.; Galetto, W.G. Separation and quantitation of red pepper major heat principles by reverse-phase high pressure liquid chromatography. J. Agric. Food Chem. 1983, 31, 1326–1330. [Google Scholar] [CrossRef]
- Bennett, D.J.; Kirby, G.W. Constitution and biosynthesis of capsaicin. J. Chem. Soc. C 1968. [Google Scholar] [CrossRef]
- Bernal, M.A.; Calderon, A.A.; Pedreno, M.A.; Muñoz, R.; Ros Barceló, A.; Merino de Caceres, F. Capsaicin oxidation by peroxidase from Capsicum annuum (variety Annuum) fruits. J. Agric. Food Chem. 1993, 41, 1041–1044. [Google Scholar] [CrossRef]
- Estrada, B.; Bernal, M.A.; Díaz, J.; Pomar, F.; Merino, F. Presence of capsicinoids in vegetative organs of Capsicum annum L. in relation to fruiting. J. Agric. Food Chem. 2002, 50, 1188–1191. [Google Scholar] [CrossRef] [PubMed]
- Scoville, W.L. Note Capsicum. J. Amer. Pharm. Assn. 1912, 1, 453–454. [Google Scholar] [CrossRef]
- Collins, M.D.; Wasmund, L.M.; Bosland, P.W. Improved method for quantifying capsaicinoids in capsicum using high-performance liquid chromatography. HortScience 1995, 30, 137–139. [Google Scholar]
- Rosmawani, M.; Musa, A.; Lee, Y.H. Chilli hotness determination based on optical capsaicin biosensor using stacked immobilisation technique. Sens. Actuators B Chem. 2014, 190, 593–600. [Google Scholar] [CrossRef]
- Kachoosangi, R.T.; Wildgoose, G.G.; Compton, R.G. Carbon Nanotube-Based Electrochemical Sensors for Quantifying the ‘heat’ of Chilli Peppers: The Adsorptive Stripping Voltammetric Determination of Capsaicin. Analyst 2008, 133, 888–895. [Google Scholar] [CrossRef] [PubMed]
- Peña-Alvarez, A.; Ramirez-Maya, E.; Alvarado-Suarez, L.A. Analysis of capsaicin and dihydrocapsaicin in peppers and pepper sauces by solid phase microextraction gas chromatography mass spectrometry. J. Chromatogr. A 2009, 1216, 2843–2847. [Google Scholar] [CrossRef] [PubMed]
- Barbero, G.F.; Palma, M.; Barroso, C.G. Pressurised liquid extraction of capsaicinoids from peppers. J. Agric. Food Chem. 2006, 54, 3231–3236. [Google Scholar] [CrossRef] [PubMed]
- Reilly, C.A.; Crouch, D.J.; Yost, G.S. Determination of capsaicin, dihydrocapsaicin, and nonivamide in self-defense weapons by liquid chromatography-mass spectrometry and liquid chromatography-tandem mass spectrometry. J. Chromatogr. A 2001, 912, 259–267. [Google Scholar] [CrossRef]
- Korel, F.; Bagdatlioglu, N.; Balaban, M.O.; Hisil, Y. Ground red peppers: Capsaicinoids content, scoville scores, and discrimination by an electronic nose. J. Agric. Food Chem. 2002, 50, 3257–3261. [Google Scholar] [CrossRef] [PubMed]
- Iwamoto, M.; Cho, R.K.; Uozumi, J.; Lino, K. Near infrared reflectance spectrum of red pepper and its applicability to determination of capsaicin content. Nippon Shokuhin Kogyo Gakkaishi 1984, 31, 120–125. [Google Scholar] [CrossRef]
- Cho, R.K.; Hong, J.H.; Kim, H.K.; Park, M.H. Rapid quality evaluation of dried red pepper by near-infrared spectroscopy. Korean J. Food Sci. Technol. 1990, 22, 675–680. [Google Scholar]
- Samson, C.S.; Tung-Liang, H.; Berke, T. Use of near infrared reflectance to measure capsaicinoids in pepper (Capsicum spp.). Capsicum Eggplant Newsl. 1997, 16, 56–59. [Google Scholar]
- Lee, W.M.; Hong, T.I.; Yoon, J.Y. Development of NIRS method to measure capsaisin content in pepper fruit. Korean J. Hort. Sci. Technol. 1995, 13, 322–323. [Google Scholar]
- Lee, S.M.; Kim, S.N.; Park, J.B.; Hwang, I.K. Prediction of Chemical Compositions for on Line Quality Measurement of Red Pepper Powder Using Near Infrared Reflectance Spectroscopy (NIRS). Food Sci. Biotechnol. 2005, 14, 280–285. [Google Scholar]
- Pandhair, V.; Sharma, S. Acumulation of capsaicin in seed, pericarp and placenta of Capsicum annuum L. fruit. J. Plant Biochem. Biotechn. 2008, 17, 23–27. [Google Scholar] [CrossRef]
- Caporaso, N.; Paduano, A.; Nicoletti, G.; Sacchi, R. Capsaicinoids, antioxidant activity, and volatile compounds in olive oil flavored with dried chili pepper (Capsicum annuum). Eur. J. Lipid Sci. Technol. 2013, 115, 1434–1442. [Google Scholar] [CrossRef]
- Sanatombi, K.; Sharma, G.J. Capsaicin content and pungency of different Capsicum spp. cultivars. Notulae Botanicae Horti Agrobotanici Cluj-Napoca 2008, 36, 89–90. [Google Scholar]
- Pandey, S.K.; Yadav, S.K.; Singh, V.K. An overview on Capsicum annuum L. J. Pharm. Sci. Technol. 2012, 2, 821–828. [Google Scholar]
- ASTA. Official Analytical Method of the American Spice Trade Association, 4th ed.; American Spice Trade Association: Englewood Cliffs, NJ, USA, 1997. [Google Scholar]
- Larraín, M.; Guesalaga, A.R; Agosin, E. A Multipurpose Portable Instrument for Determining Ripeness in Wine Grapes using NIR Spectroscopy. IEEE Trans. Instrum. Meas. 2008, 57, 294–302. [Google Scholar] [CrossRef]
© 2015 by the authors; licensee MDPI, Basel, Switzerland. This article is an open access article distributed under the terms and conditions of the Creative Commons Attribution license (http://creativecommons.org/licenses/by/4.0/).
Share and Cite
Lim, J.; Kim, G.; Mo, C.; Kim, M.S. Design and Fabrication of a Real-Time Measurement System for the Capsaicinoid Content of Korean Red Pepper (Capsicum annuum L.) Powder by Visible and Near-Infrared Spectroscopy. Sensors 2015, 15, 27420-27435. https://doi.org/10.3390/s151127420
Lim J, Kim G, Mo C, Kim MS. Design and Fabrication of a Real-Time Measurement System for the Capsaicinoid Content of Korean Red Pepper (Capsicum annuum L.) Powder by Visible and Near-Infrared Spectroscopy. Sensors. 2015; 15(11):27420-27435. https://doi.org/10.3390/s151127420
Chicago/Turabian StyleLim, Jongguk, Giyoung Kim, Changyeun Mo, and Moon S. Kim. 2015. "Design and Fabrication of a Real-Time Measurement System for the Capsaicinoid Content of Korean Red Pepper (Capsicum annuum L.) Powder by Visible and Near-Infrared Spectroscopy" Sensors 15, no. 11: 27420-27435. https://doi.org/10.3390/s151127420
APA StyleLim, J., Kim, G., Mo, C., & Kim, M. S. (2015). Design and Fabrication of a Real-Time Measurement System for the Capsaicinoid Content of Korean Red Pepper (Capsicum annuum L.) Powder by Visible and Near-Infrared Spectroscopy. Sensors, 15(11), 27420-27435. https://doi.org/10.3390/s151127420