1. Introduction
Data acquisition systems (DAQs) are the specialized pieces of hardware and software in charge of sampling real-world electrical signals and converting them into numerical values suitable for processing in digital computers. Most fields of science and engineering today require, at some point, the acquisition of analog or digital signals from different sensors, hence the transversal nature of DAQ applications. However, the specific requisites demanded of a DAQ system depend heavily on the specific experiment at hand, which explains the large number of different, mutually-incompatible commercial solutions. First of all, we could classify DAQs as [
1]: (i) computer-based systems, where the electronic boards can be connected to an existing computer via local buses, such as USB or PCI; (ii) instruments, such as oscilloscopes or spectrum analyzers, which may be connected to a computer or can operate autonomously; and (iii) specialized modular designs, such as National Instruments’ solution PXI [
2], where a computer-based controller acts as a host for interchangeable modules for specialized inputs or outputs. Each design has its own pros and cons. For example, Type (i) DAQs are typically more inexpensive than the rest, at the cost of not offering the most advanced features. In turn, it is common to find that the most stringent specifications are only achieved by Type (ii) DAQs, with a much higher cost. Finally, Type (iii) systems tend to offer a trade-off between the other two types.
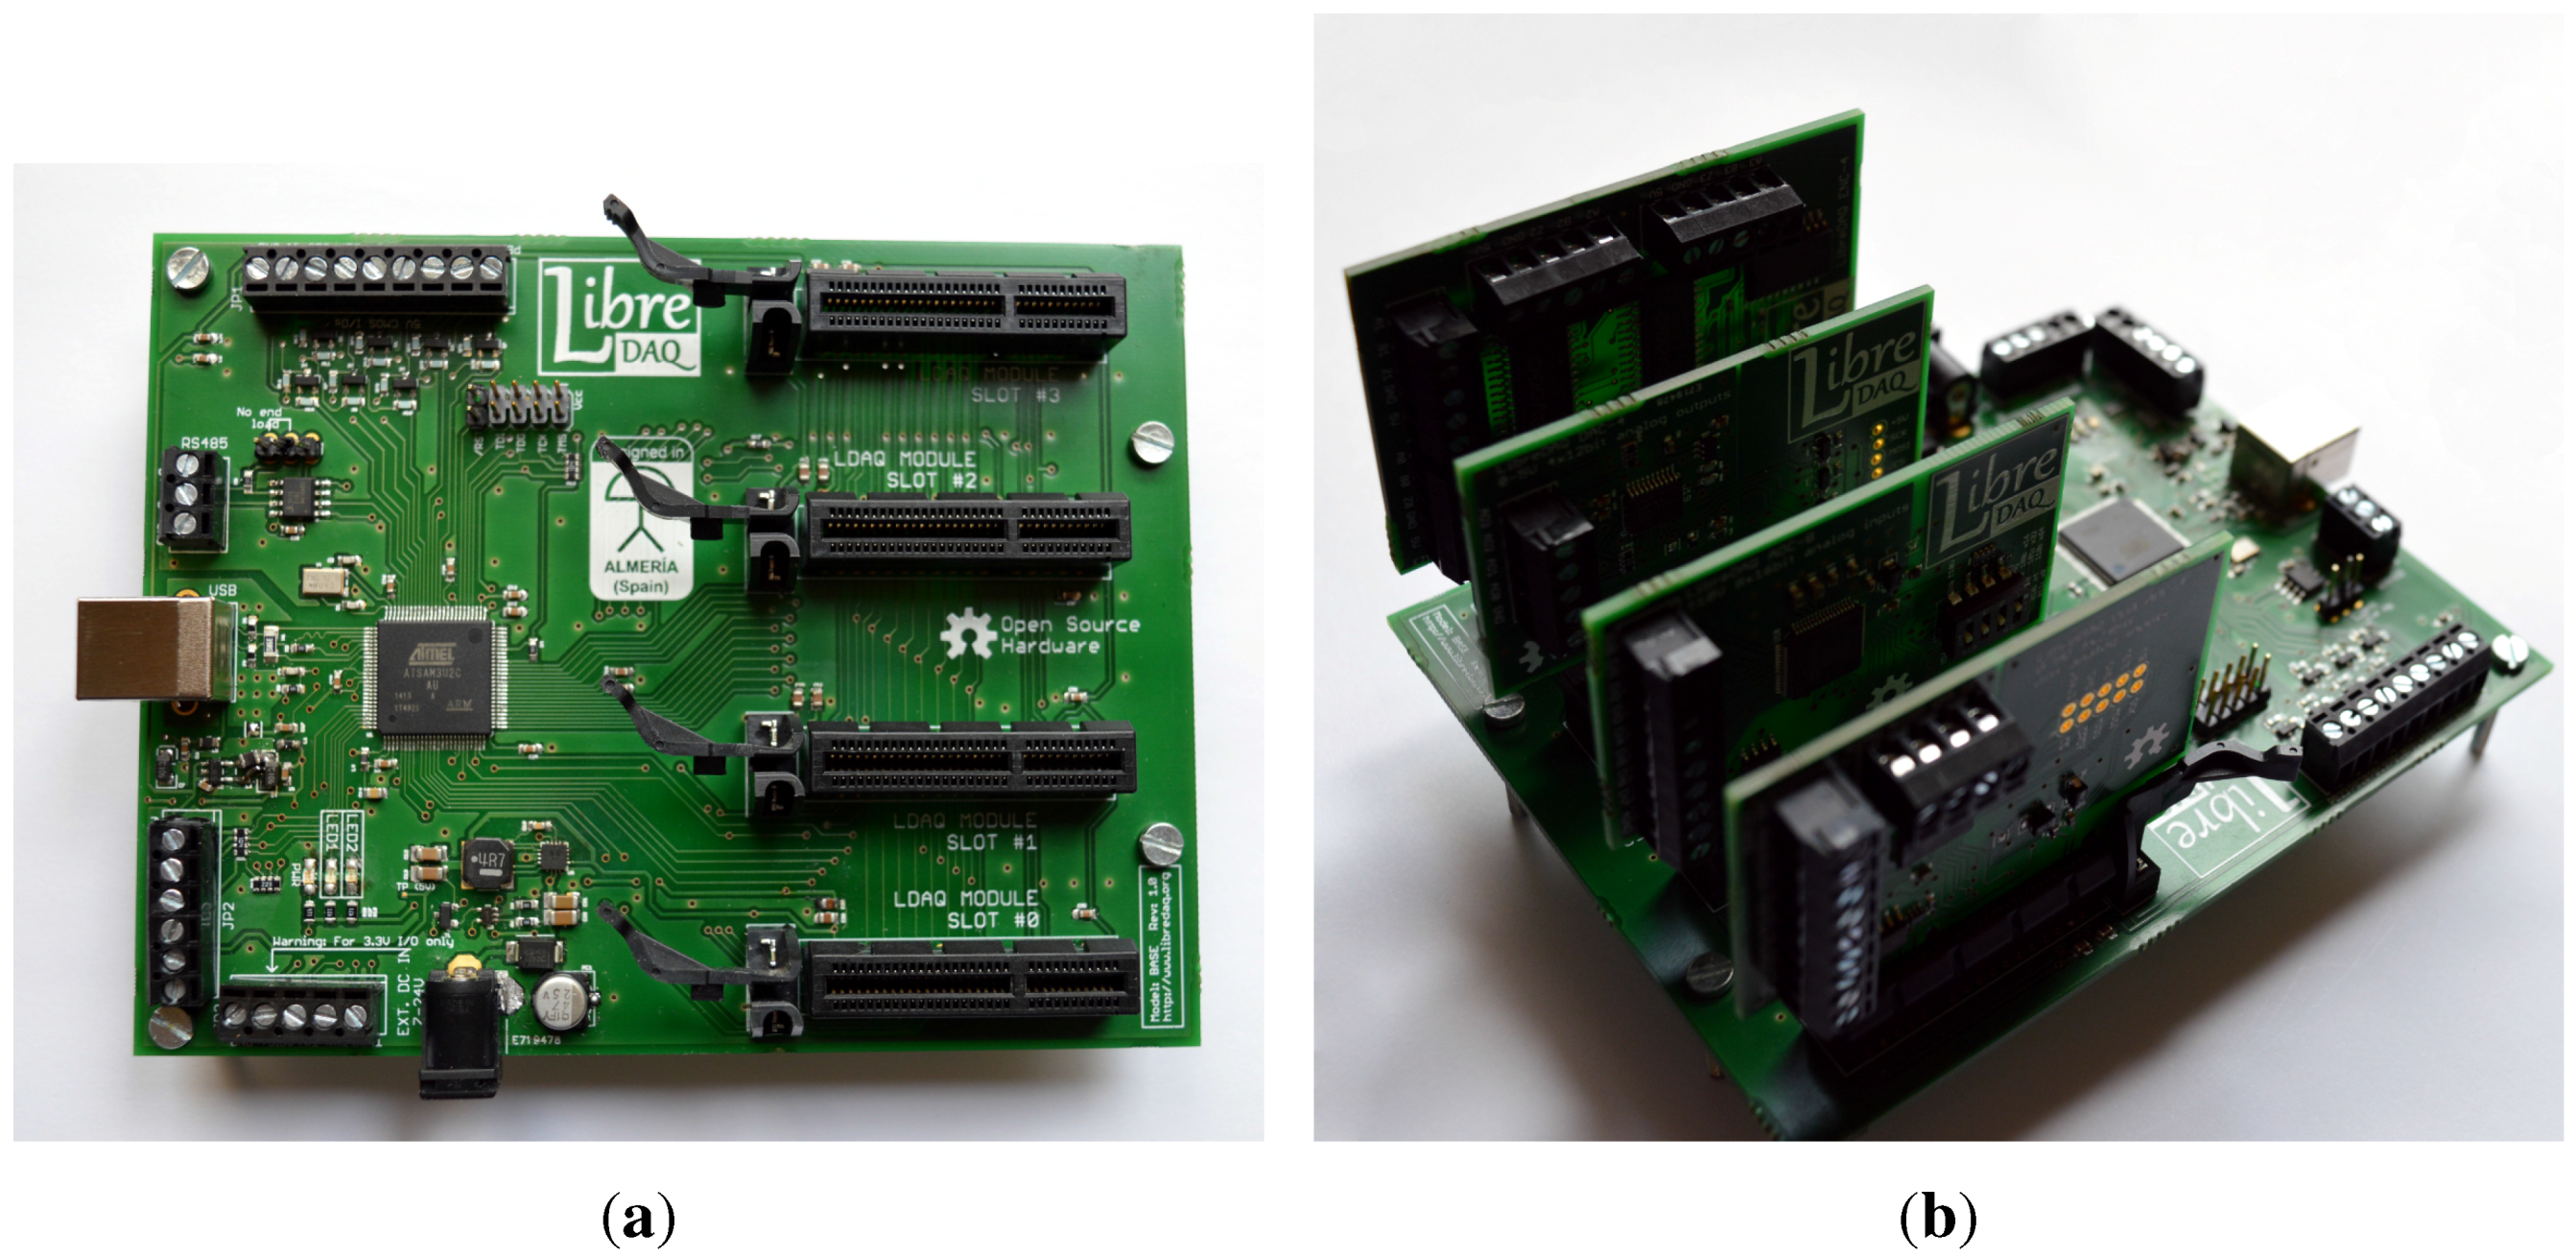
The DAQ proposed in this work belongs to the latter group; it is the first low-cost, modular DAQ proposed in the literature. Our modular DAQ architecture comprises a base board with four slots in which a set of interchangeable modules can be inserted (refer to
Figure 2), each one specifically designed for a particular kind of sensor or actuator. In the present work, modules will be described for two kinds of signals: analog voltage inputs and incremental quadrature encoder inputs. In our proposed platform, the number of inputs of each kind available in a DAQ can be increased by inserting multiple identical modules into the expansion slots. Before describing the proposal in detail, we will briefly review some previous related works found in the technical literature.
Regarding the specific target application of our system, which is performing multichannel vibration and impact tests in mechanical engineering, many other previous works describe DAQs for inertial units based on Microelectromechanical Systems (MEMS) technology, piezoelectric accelerometers and incremental quadrature encoders. For example, fatigue-induced crack diagnostics in gears is studied in [
3] by means of quadrature encoders read through off-the-shelf National Instruments DAQ boards. Only one sensor type is employed in those tests, hence the lack of discussion about the synchronization of different sensor types. In [
4], two biaxial MEMS accelerometers (ADXL210) are sampled with a commercial DAQ (Biomedical Monitoring BM42) at 1 kS/s, apparently without simultaneous sampling of all channels.
Some custom DAQ designs with low cost as the main priority have been also proposed. For example, [
5] presents a board based on a Microchip eight-bit microcontroller (PIC18F27J53) running at 12 MHz as a single-chip board, capable of 12-bit multiplexed analog input sampling. A similar design can be found in [
6], although an additional 22-bit Delta-Sigma Analog-To-Digital (ADC) chip (MCP3553) was incorporated for small signal acquisition. Another, much more elaborate proposal is Open DAQ [
1], designed with low cost as the primary goal and providing eight multiplexed analog inputs and one analog output. The board is built upon an Atmel AVR ATMEGA644 microcontroller, sufficient for relatively high sample rates (100 kS/s) in simple systems with only one ADC chip. Regarding DAQs suitable for distributed signal acquisition, fundamentally different approaches can be followed depending on the size of the area to cover and on whether the priorities are reliability, cost or synchronization accuracy. Despite using quartz crystals and Phase-Locked-Loops (PLLs) for clock generation, in practice, two computers will never run their internal clocks at exactly the same rate since clocks from different motherboards often have relatively large drifts. Example reports of realistic values for this drift are around 10 μs/s in [
7] and between 6 μS/s and 83 μS/s in [
8]. Hence the fundamental need to correct the clocks of computers sharing a network. As some representative examples of networked DAQs, in [
9], we can find a distributed DAQ system aimed at structural monitoring of constructions. Due to the large scale of a typical setup (hundreds of meters), that work proposes wireless radio communications between the sensing nodes, which synchronize their internal clocks following the Flooding Time Synchronization Protocol (FTSP) algorithm [
10] and achieving a worst-case synchronization of 1 ms. Such time errors are more than acceptable for studying vibrations of large mechanical structures whose fundamental frequencies are within the range of a few Hz. In [
11], wireless communications are also used to monitor structures, with analog signals being acquired at a rate of 50 S/s. Regarding cutting-edge experiments in physics, synchronization across sensors distributed all around the planet must often be ensured.
An example of such a system is the global network of optical magnetometers reported in [
12], where 16-bit analog signals are sampled at a maximum rate of 1 kS/s in stations that can be at any location on the planet. As is usual in these cases, the pulse-per-second (PPS) signal from a Global Positioning System (GPS) receiver [
7] is employed to correct the internal counters of a microcontroller to achieve a global synchronization better than ±200 ns. In the present work, we have not yet introduced the requirement of a GPS PPS signal, since the requisites of typical mechanical tests are not so demanding, but this could be done by modifying the firmware. See [
5] for a more comprehensive review of other custom DAQ systems.
Table 1.
Comparison of key features among other commercial and non-commercial USB DAQ devices, including their analog inputs (AI), digital inputs and outputs (DIO) and counter/timers ports (C/T).
Table 1.
Comparison of key features among other commercial and non-commercial USB DAQ devices, including their analog inputs (AI), digital inputs and outputs (DIO) and counter/timers ports (C/T).
| DAQ Model | Key Features |
|---|
| Advantech USB-4702-AE | 12-bit 10 kS/s ± 10 V 8 AI, 0–5 V 2 AO, 8 DI, 8 DO, 1 C/T 32-bit |
| Data Translation DT9812-10V | 12-bit 100 kS/s 8 AI, 2 AO, 16 DIO, 1 C/T |
| HYTEK iUSBDAQ U120816 | 12-bit 13 kS/s 0–4.096 V 8 AI, 16 DIO, 1 C/T 16-bit |
| LabJack U12 | 12-bit 1.2 kS/s ± 10 V 8 AI, 2 AO, 20 DIO, 1 C/T 32-bit |
| MC USB-1208FS-Plus | 12-bit 50 kS/s ± 10 V 8 AI, 16 DIO 0–5 V, 1 C/T 32-bit |
| NI USB-6008 | 12-bit 10 kS/s ± 10 V 8 AI, 2 AO 0–5 V, 12 DIO, 1 C/T 5MHz |
| Phidgets 8/8/8 | 12-bit 1 kS/s 0–5 V 8 AI, 16 DIO |
| PhidgetEncoder HS | 4 DIO, 4 C/T (max. pulse/s) |
| SimpleDAQ [5] | 12-bit 0–3.3 V 10 AI, 8 DIO |
| This work | 16-bit 50 kS/s ± 10 V 8-32 AI, 8 DIO, 2-8 C/T (max. pulse/s) |
To provide a comparison between the proposed modular platform and a representative selection of other similar off-the-shelf and non-commercial USB DAQ devices, we have summarized their key features in
Table 1. The cost of the selected devices is the range of $100–400. As can be seen in the table, the proposed DAQ has the potential to offer a better SNR in analog signal acquisition due to its superior resolution. In addition, only two other devices included in this comparison can offer a sample rate of 50 kS/s or above. Regarding quadrature decoder or counter inputs, only the application-specific PhidgetEncoder board offers a similar number of high-speed counters, though with a more limited maximum speed.
The rest of this article is structured as follows.
Section 2 gives a detailed description of our platform, including its hardware and firmware. Next, different tests and experimental validations are described in
Section 3 and finally some conclusions are outlined in
Section 4.
3. Experiments and Discussion
This section describes some of the tests that our prototype has undergone to validate its suitability. Experiments have been separated into four groups. First, we summarize some of the low-level tests aimed at verifying the different subsystems of the modular DAQ. Next, the synchronization accuracy of signals from different DAQ modules is demonstrated and contrasted with that of a commercial DAQ. The third experiment consists of a demonstration of the kind of datasets that can be grabbed in the mechanical system. Finally, we provide results for impact-test experiments, a highly-demanding experiment in the specific feature our DAQ was designed to meet, i.e., accurate synchronization of heterogeneous, quickly-changing signals.
3.1. Low-Level Testing
Firstly, our prototype underwent a series of standard electrical checks to ensure the proper working of the most basic subsystems: power input, voltage regulators, crystal oscillator,
etc. Next, increasingly complex firmware programs were tested to check the different ARM peripherals and the electrical connections in the boards. As an illustrative example,
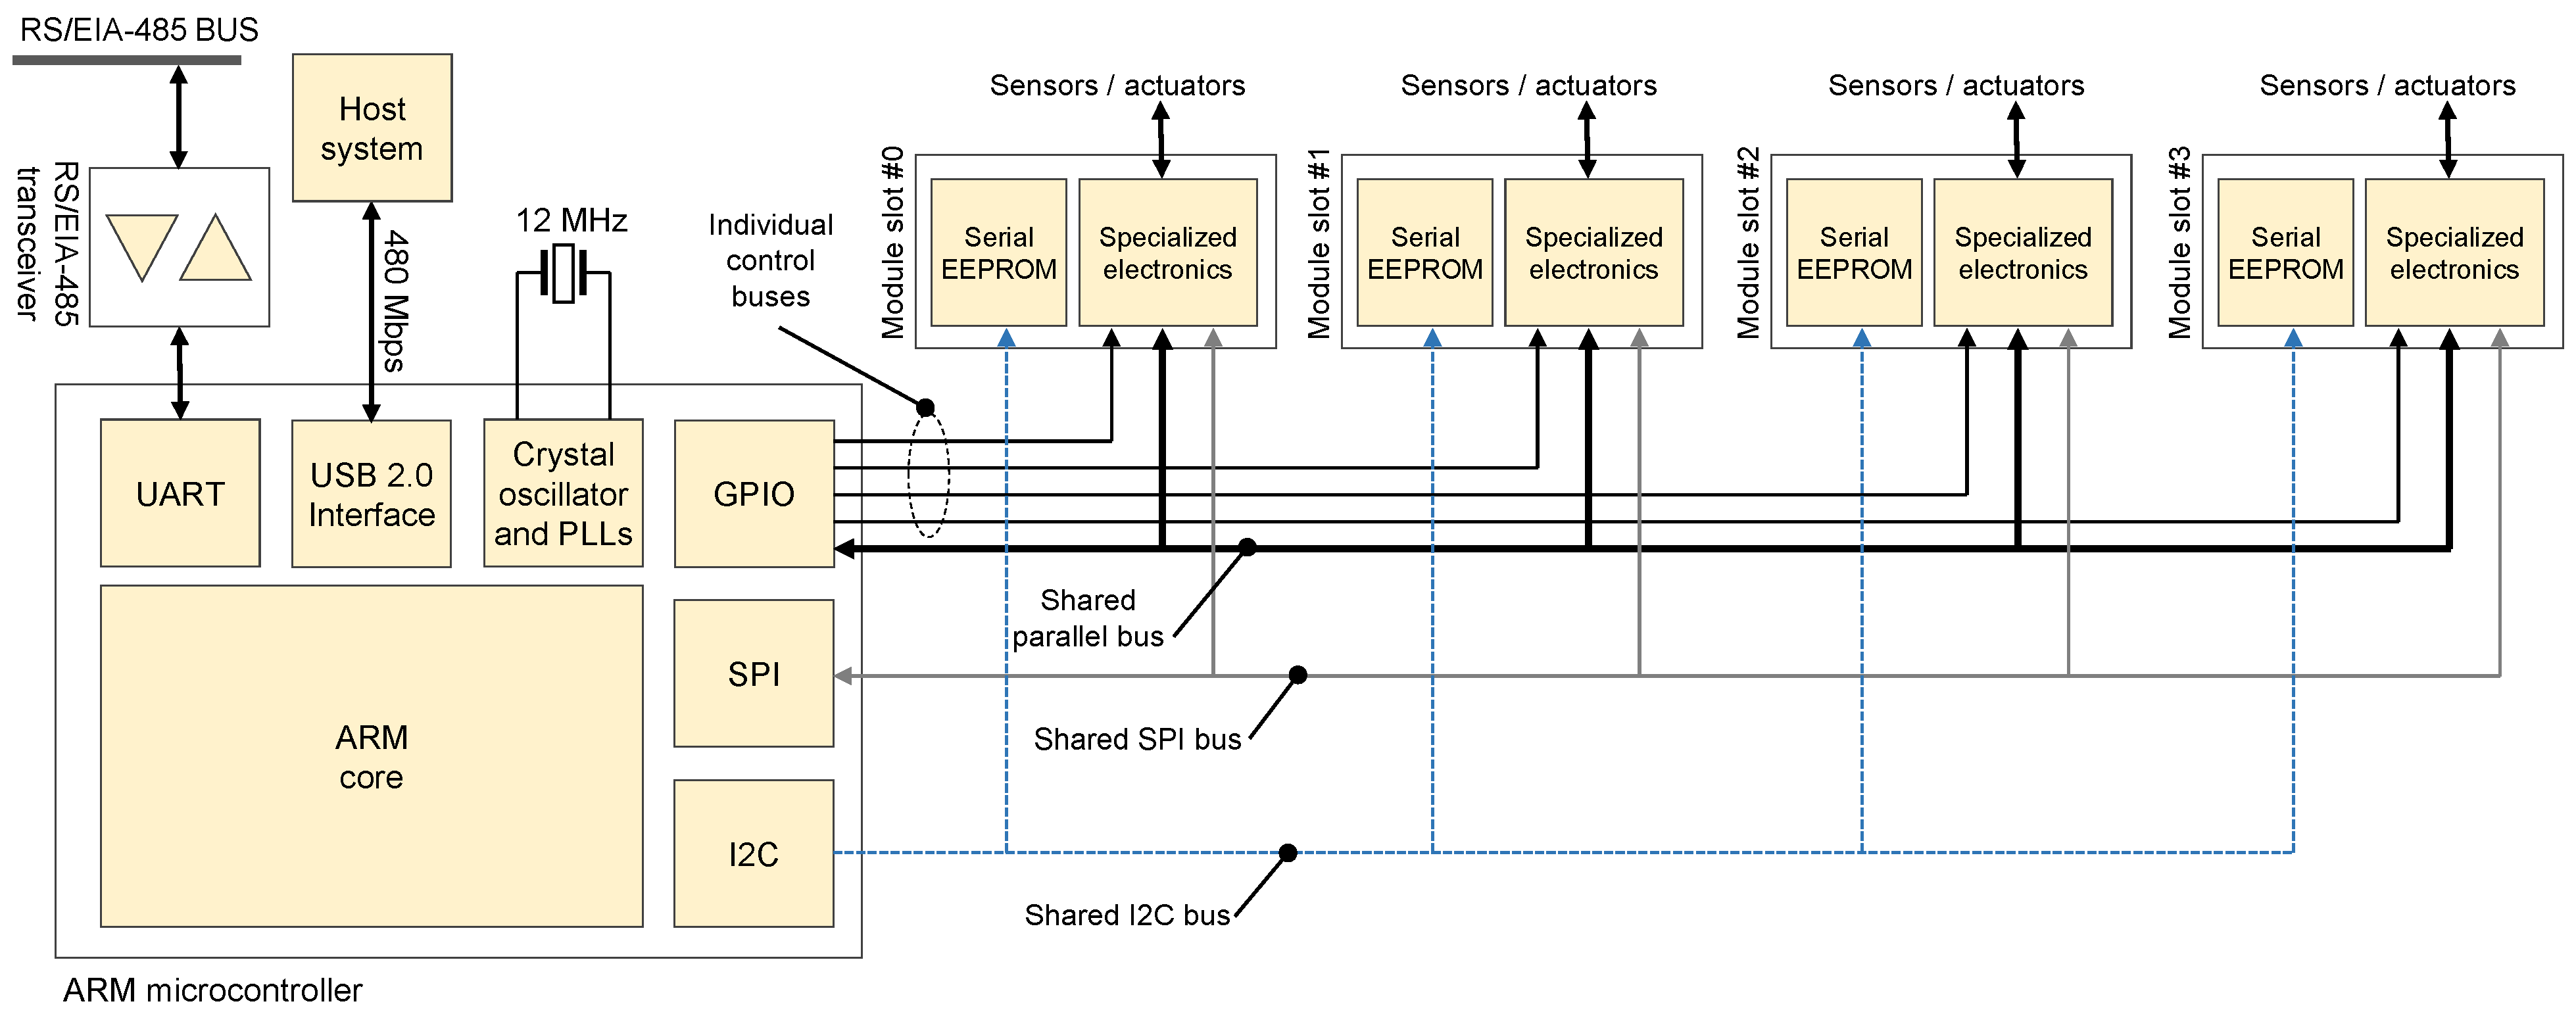
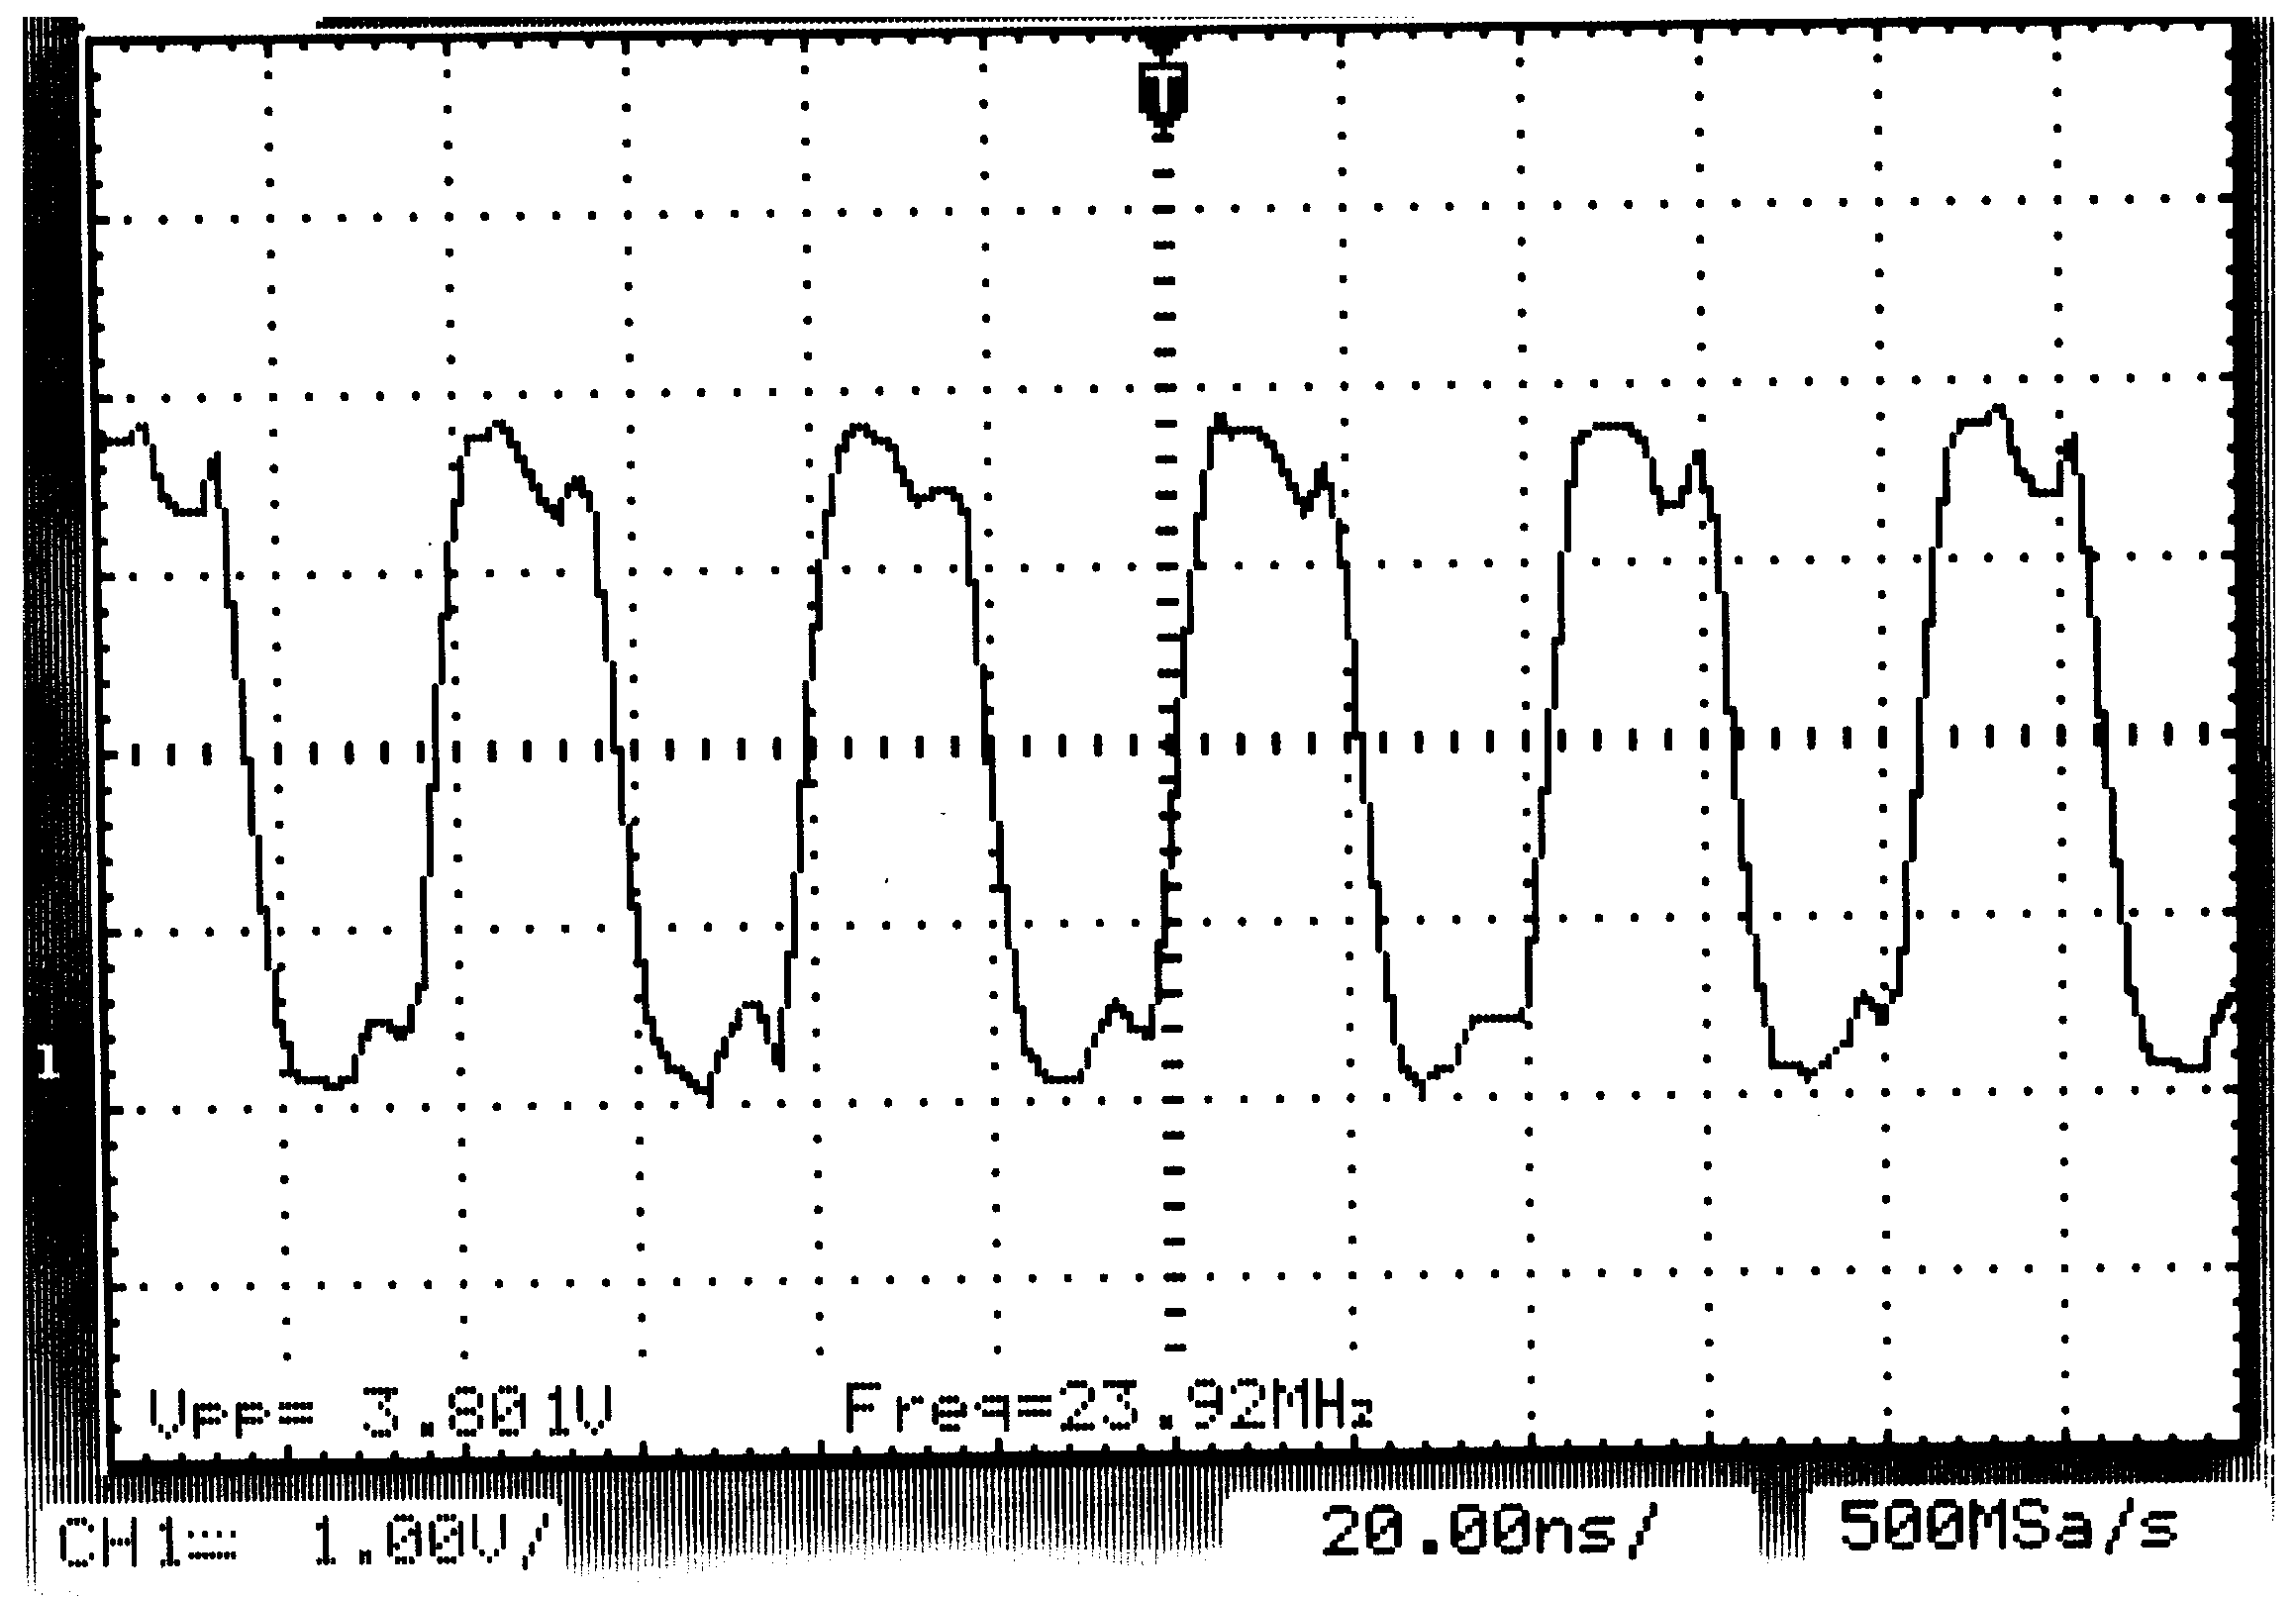
Figure 3 shows the output of the programmable clock generator used as a reference clock in the shared parallel bus (see
Figure 1). Due to the relatively long distance that this signal must travel and its tree-like distribution pattern from the core microcontroller toward each module slot, a series resistor was placed near the clock driver to reduce a number of undesirable effects, such as open-line reflections and interference emissions.
Figure 4.
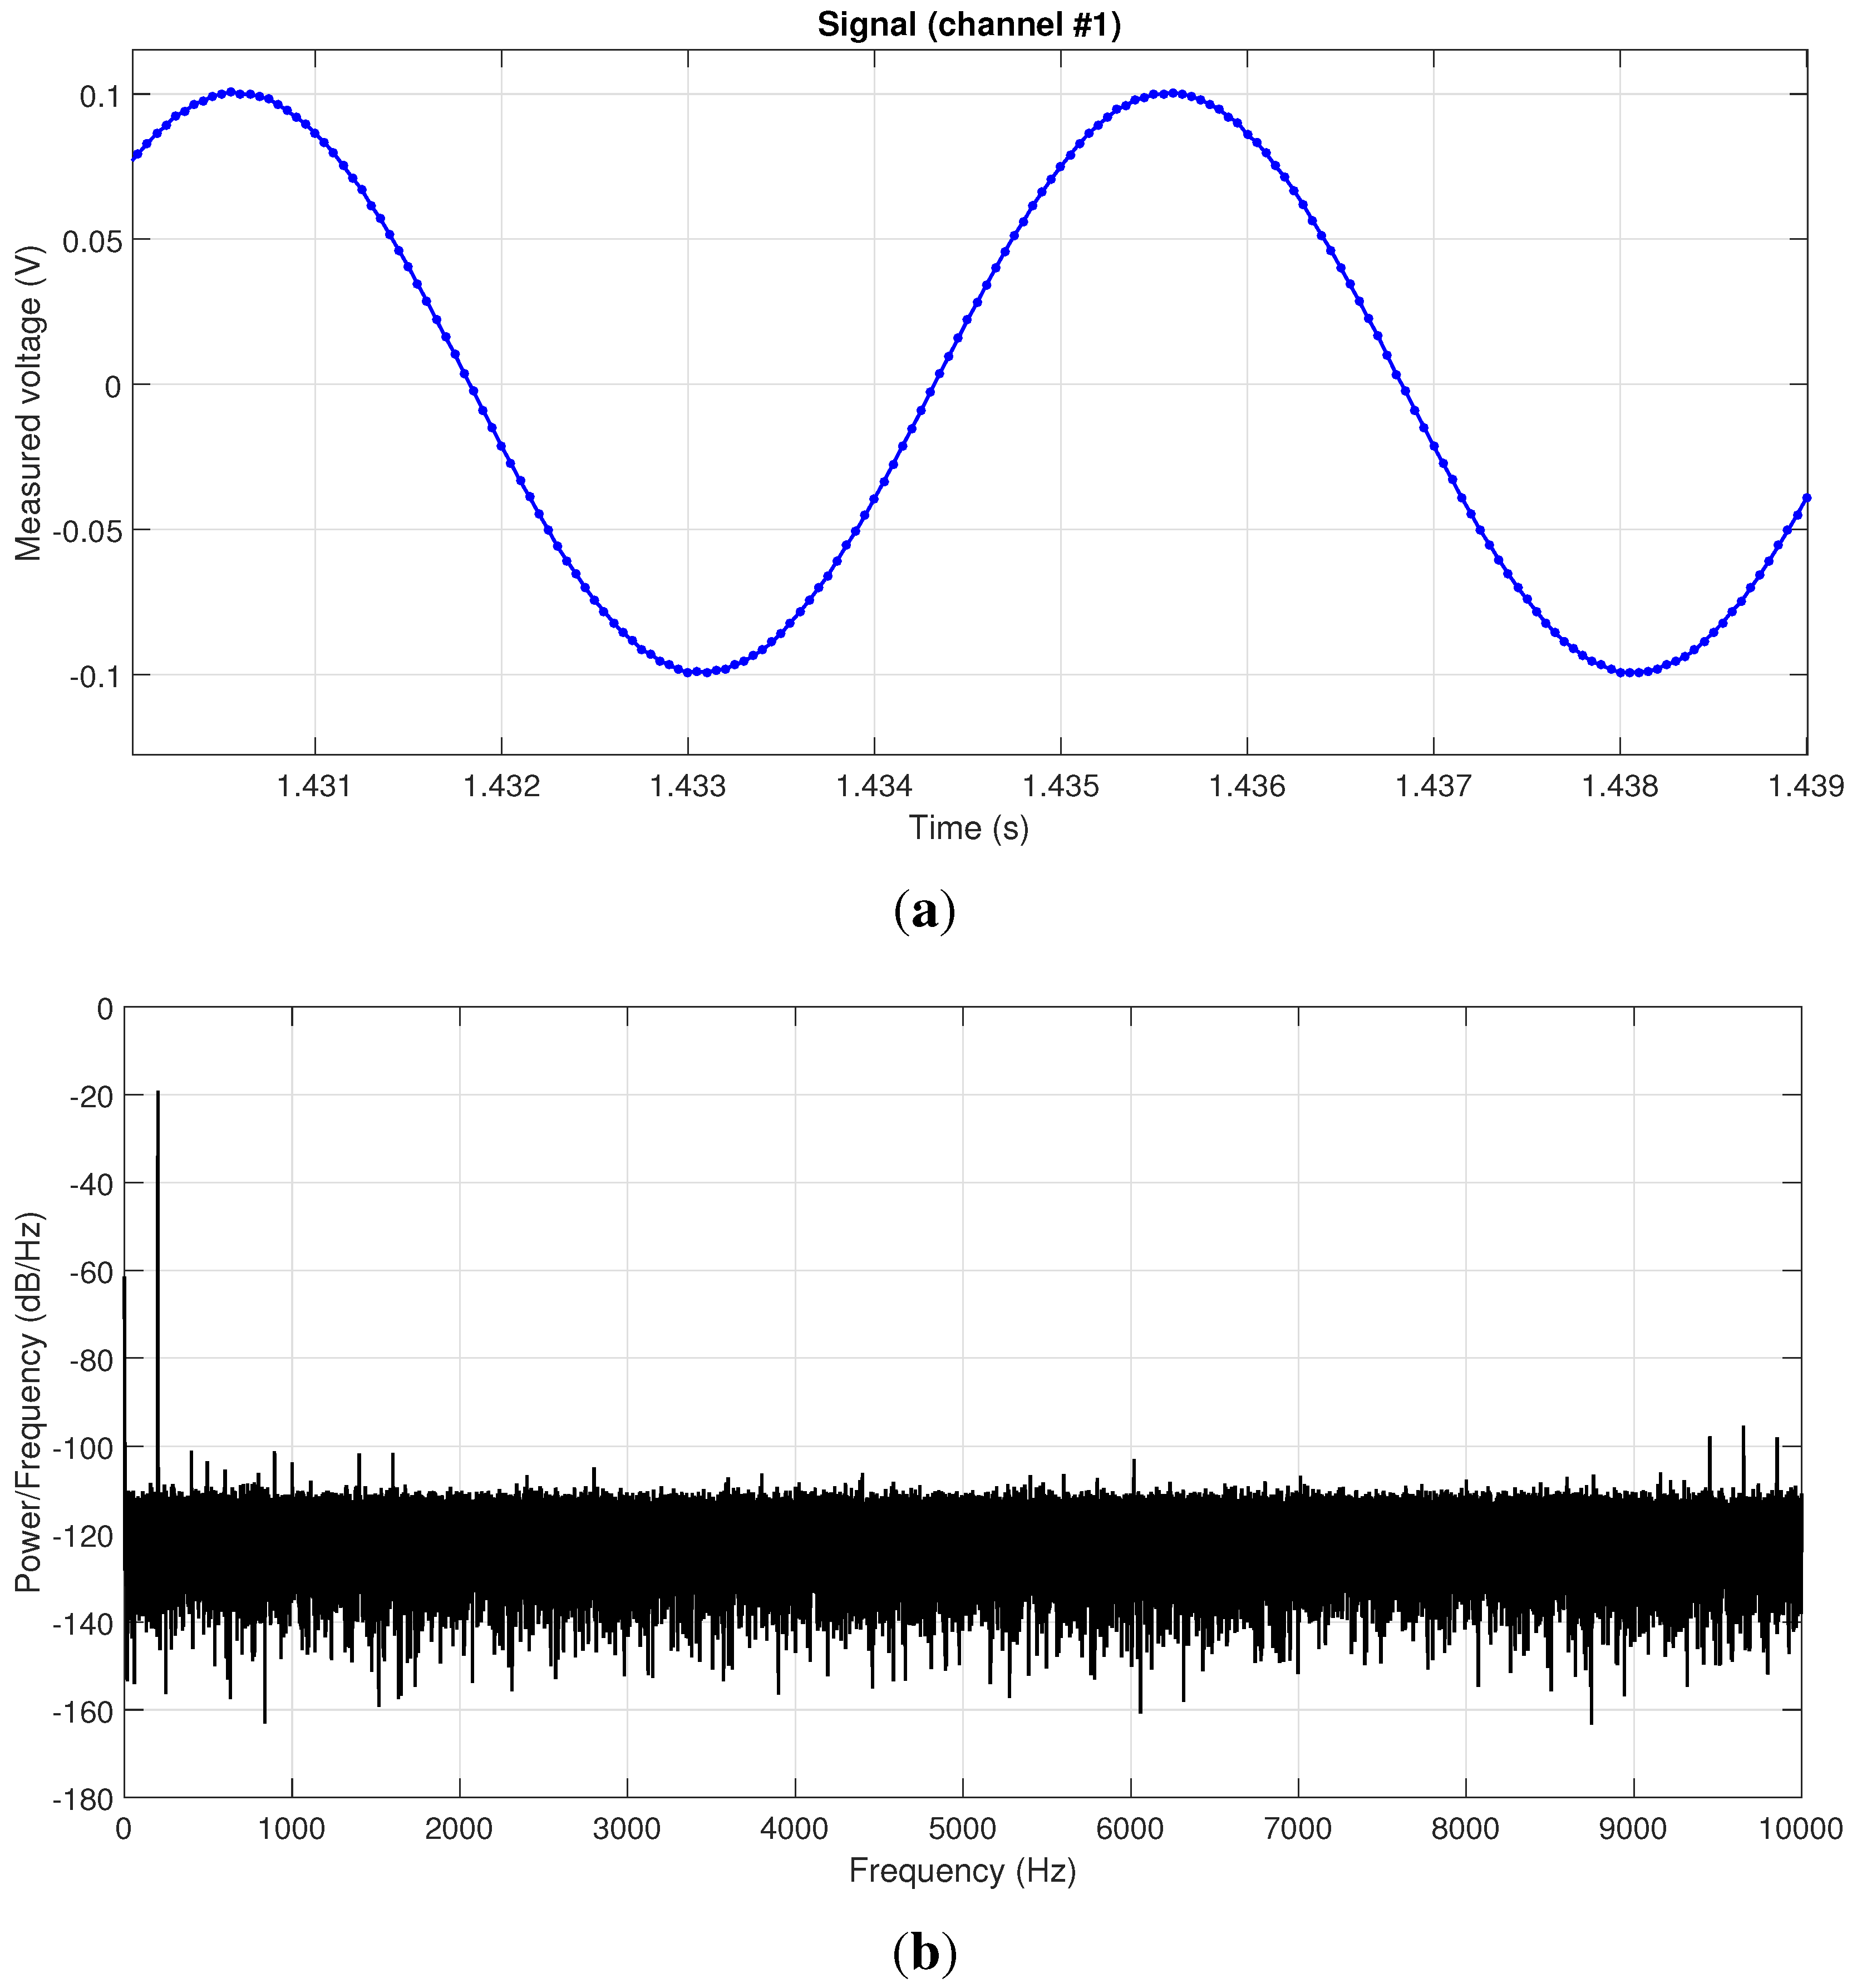
The results for a test consisting of feeding a 200 Hz sinusoidal signal into a 16-bit ADC DAQ module, are shown in (a) and (b) in the time and frequency domains (with Hanning windowing), respectively.
Figure 4.
The results for a test consisting of feeding a 200 Hz sinusoidal signal into a 16-bit ADC DAQ module, are shown in (a) and (b) in the time and frequency domains (with Hanning windowing), respectively.
Another key test was related to the validation of analog signal acquisition. A sinusoidal signal of 200 Hz and 200 mVpp was generated with an Agilent 33220a signal generator, then acquired with the entire pipeline of hardware ADC, firmware on the ARM microcontroller and recorded in a desktop computer with the public user API. The result is shown in the time domain in
Figure 4a. In order to verify the spectral quality of the acquired signal and discard artifacts, such that those caused by jitter are in the sampling frequency (refer to
Section 2.2), we also computed the power spectral density of the signal (using a Hanning window). The result, in
Figure 4b, demonstrates an excellent performance, with a very clean peak at 200 Hz, an average of a 90-dB Signal-to-Noise Ratio (SNR), with the theoretical prediction for an
N-bit ADC and a sinusoidal input being
.
Finally, the limits of the USB communication channel were explored by sending a continuous stream of data at the maximum attainable speed allowed by the microcontroller firmware. We found that, despite the instantaneous theoretical limit of 480 Mbps (60 MB/s) allowed by HS USB, the chosen microcontroller could sustain a constant rate of only ∼4 MB/s, which, however, is far above the requirements of our DAQ system and superior to the limit of ∼1 MB/s obtained with FS USB.
3.2. Interchannel Synchronization
In this experiment, we demonstrated the accurate synchronization claimed by our design between heterogeneous signals, namely an analog input and a digital quadrature channel. Here, the experimental setup included an optical quadrature encoder, whose shaft was moved manually at a non-constant speed. We investigated the accuracy of the synchronization attainable by our custom board in comparison to a commercial device, a National Instrument (NI) USB-6210, by reading the encoder quadrature channels ( and ) simultaneously through both devices’ quadrature decoders. Moreover, the channel was also recorded by both devices as an analog signal. By doing so, the timing of quadrature edges in the analog signals could be compared with increments at the output of quadrature decoder counters. The sampling rate was 25 kS/s for both analog and encoder counters in our device, and 5 kS/s in NI USB-6210 under LabVIEW. Following the recommendations by the technical service of National Instruments in response to the inquiries by the authors concerning how to achieve the most accurate time stamping in LabVIEW, we employed a high resolution relative seconds block and saved datasets in the vendor-specific Technical Data Management Streaming (TDMS) file format.
Ideally, we would expect counters to increase immediately (actually, a few nanoseconds afterward, depending on the frequency of the underlying digital logic clock, 125 ns for our design) after each quadrature rising and falling edge, due to the use of so-called “
” decoders, which increase their count four times with each full quadrature cycle. The experiments showed that counter changes in our device are precisely aligned (within one sample period,
) with those edges, as shown in
Figure 5a, where vertical dashed lines have been added for visual reference at the edges of each quadrature cycle. Notice how rising, as well as falling edges coincide with increments in the counter, while the other two increments per cycle correspond to the edges of the
channel, not shown in the figure. Such an accurate synchronization of events is clearly not present for the dataset captured with the commercial DAQ board, as can be seen by visual inspection of
Figure 5b. To make a quantitative comparison of the regularity of counter readings by both platforms, we also computed the delay between consecutive readings. Ideally, these delays should match the inverse of the nominal sampling frequency for each device, that is,
and
for our platform and NI USB-6210, respectively. However, it can be seen in
Figure 5c,d that an accurate sampling of encoder counters is achieved only with our device.
Figure 5.
One channel () from a quadrature encoder as an analog signal (blue) and increments in quadrature decoder counters (red) for both, our design (a) and a National Instrument USB-6210 board (b); For visual reference, we added vertical dashed lines marking the rising and falling edges of quadrature cycles. Vertical axes are not to scale; (c,d) Histograms of delays between the registration of counter values by each device. Refer to text for further details.
3.3. Mechanism Instrumentation
An initial practical evaluation of the proposed DAQ system was the acquisition of a multi-sensory dataset for a four-bar mechanism used as a testbed for state estimators, shown in
Figure 6 and already described in previous works [
15].
In short, the mechanism consists of a four-bar linkage comprising (i) a high-inertia disk made of iron operating as crank link, whose axle is connected to an optical quadrature encoder; (ii) a soft bar built in aluminum acting as connecting rod in which the first gyroscope is placed and (iii), a solid rod made of aluminum as rocker link, incorporating another identical gyroscope. In comparison to previous works, we have replaced two professional-grade XSens MTi Inertial Measurement Unit (IMU) with low-cost dual analog gyroscopes (LPY503AL). Then, the proposed DAQ is used to record the signals from the two gyroscopes in the connecting and rocker rods of the mechanism simultaneously to the orientation measured by the optical quadrature encoder. These datasets can be used as inputs to estimation algorithms in mechanical engineering, and it will be future study as a continuation of former works in [
16,
17]. Refer to
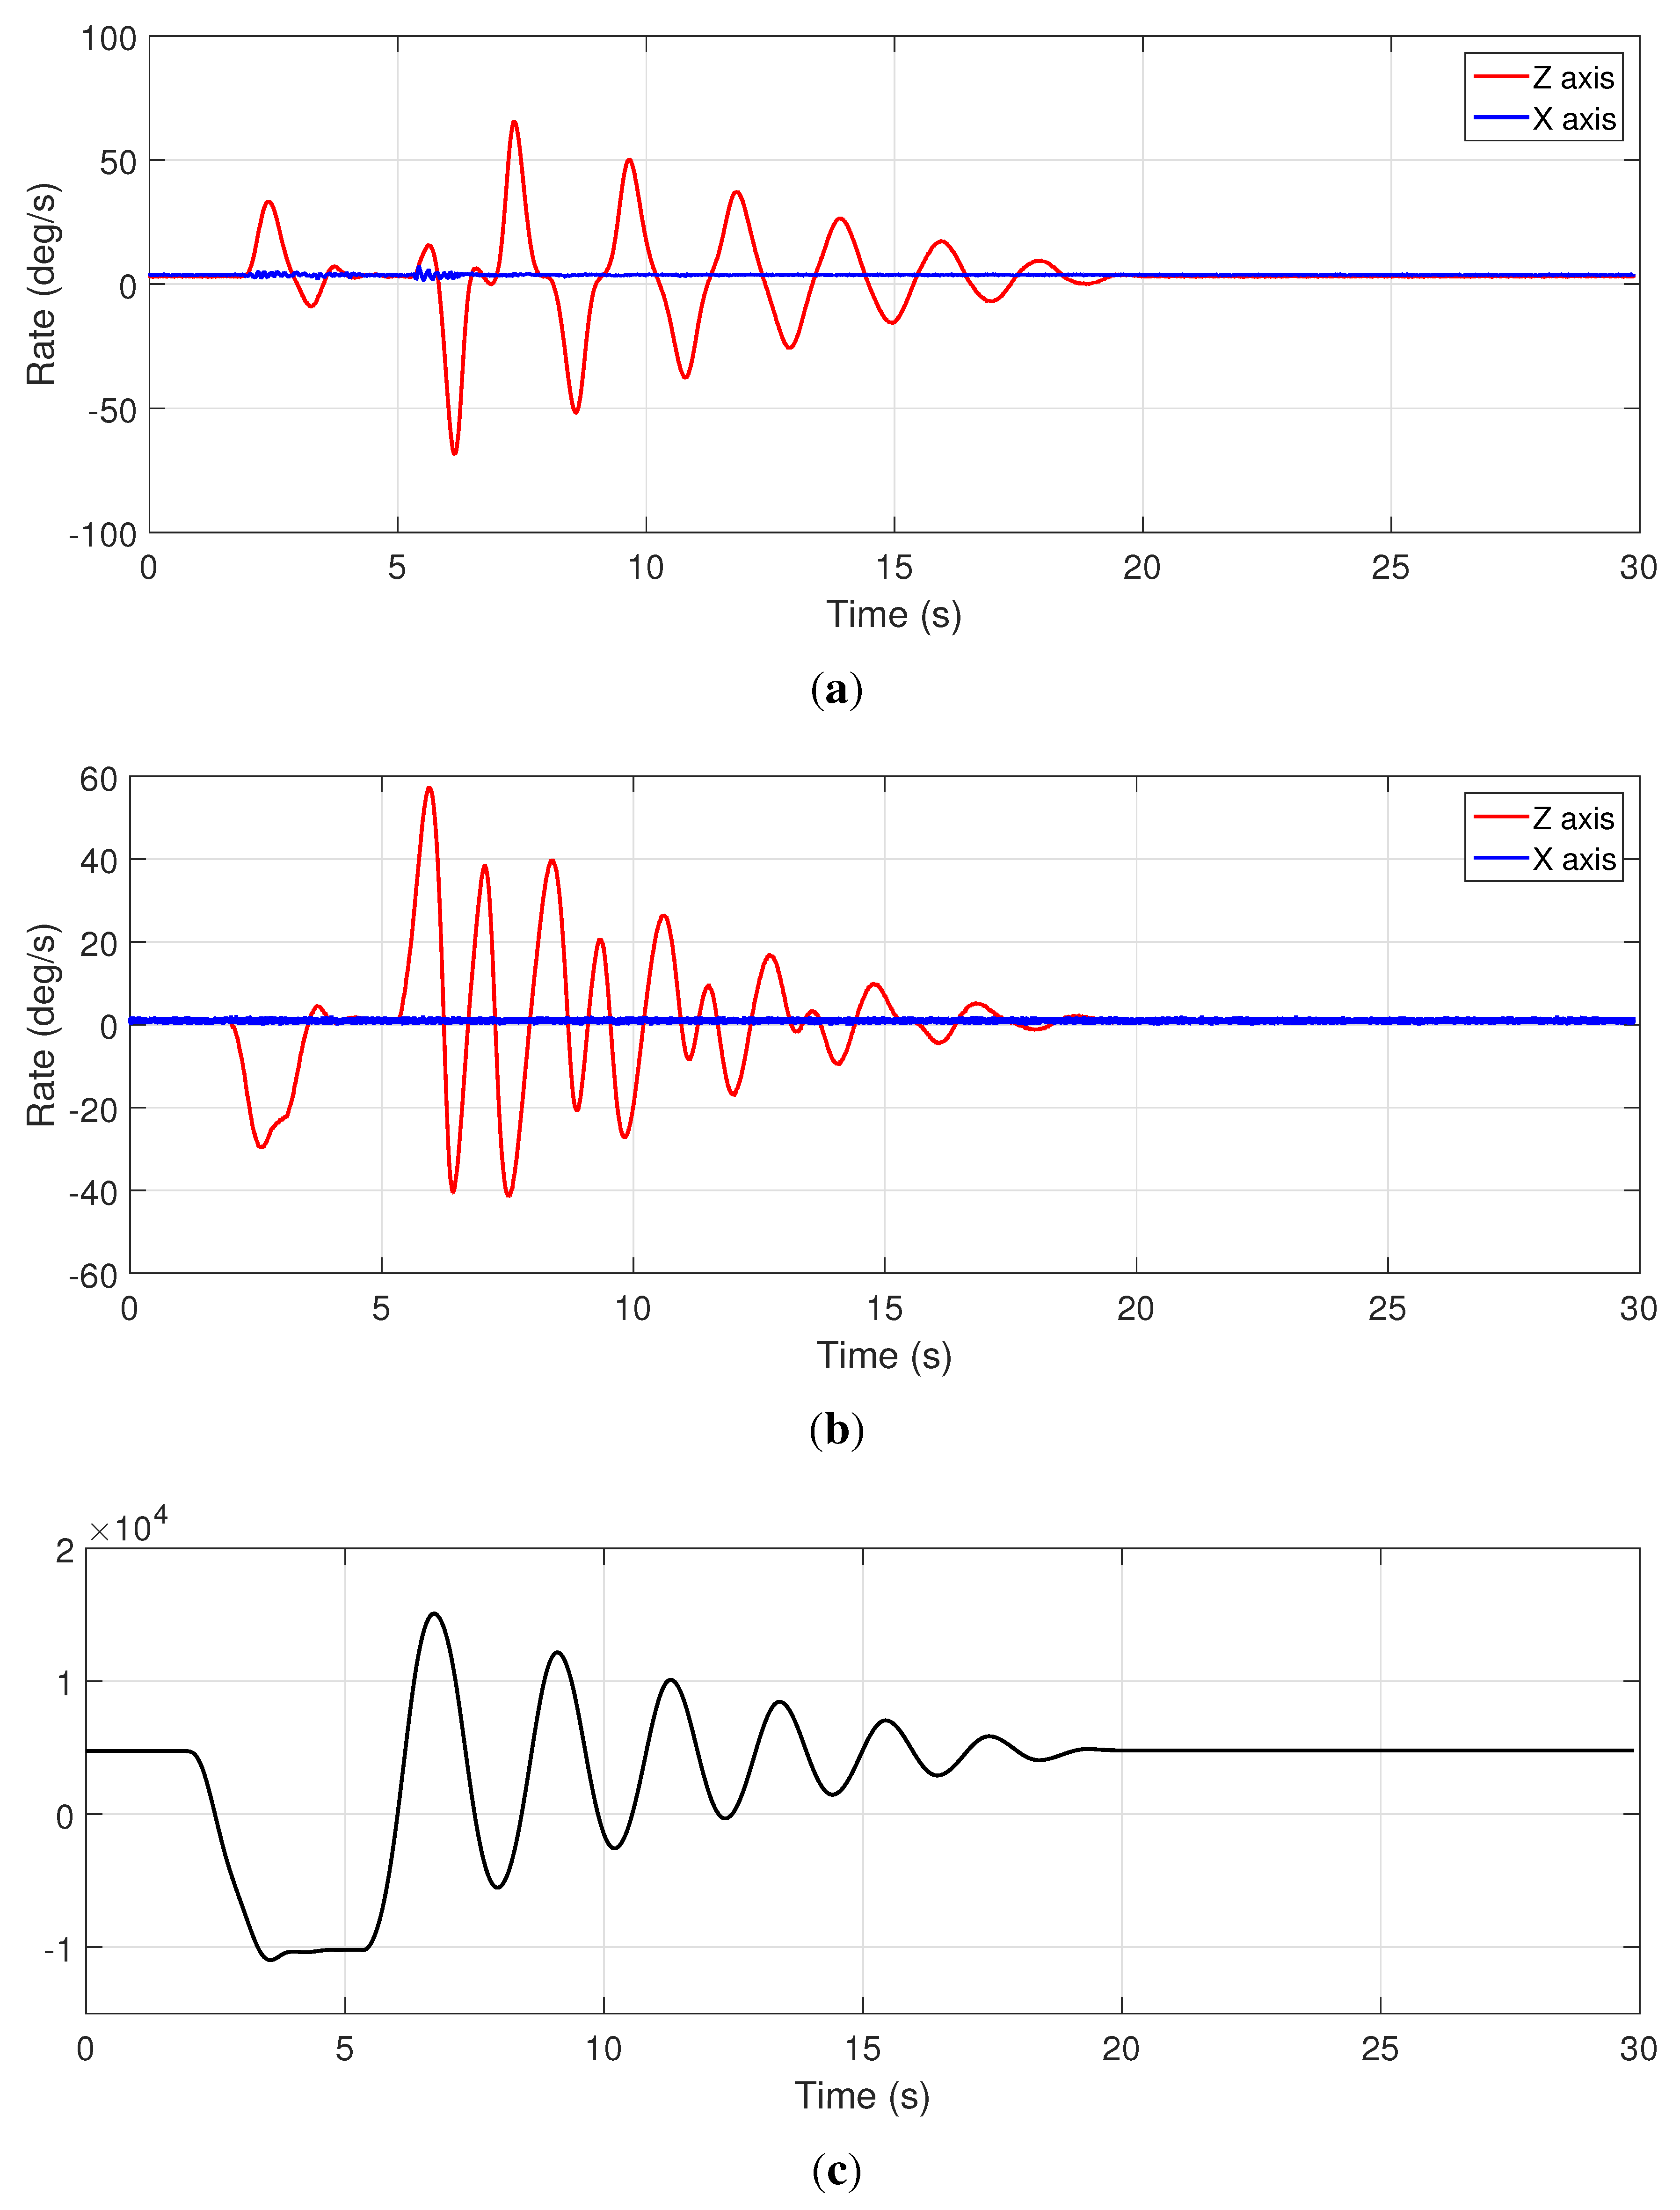
Figure 7 for a description of the acquired dataset, which shows an excellent synchronization of the different sensors, as can be visually assessed in a qualitatively way. During this experiment, the mechanism was manually moved out of its equilibrium configuration (around t = 2 s), then it is dropped (around t = 5 s) under the unique effect of its own weight and it starts oscillating until it stops due to friction. The next experiment is designed to test our device under much more rigorous conditions.
Figure 6.
(a) Four-bar mechanism testbed; (b) Detail of the gyroscope mounted in the connecting rod; (c) Detail of the crank and optical quadrature encoder assembly.
Figure 6.
(a) Four-bar mechanism testbed; (b) Detail of the gyroscope mounted in the connecting rod; (c) Detail of the crank and optical quadrature encoder assembly.
Figure 7.
Measurements for the mechanism tested with the proposed DAQ system. Gyroscope readings for the connecting and rocker rods are shown in (a,b), respectively; Since the mechanism is planar, gyroscopes aligned with the Z axis provide the most significant measurements; Incremental encoder data is shown in (c), in pulse units (the encoder generates pulses per revolution).
3.4. Impact Tests
Impacts represent events where changes in the dynamical state of the involved bodies happen in a very short time, hence becoming an excellent challenge to our DAQ aimed at measuring heterogeneous signals with a common reference clock.
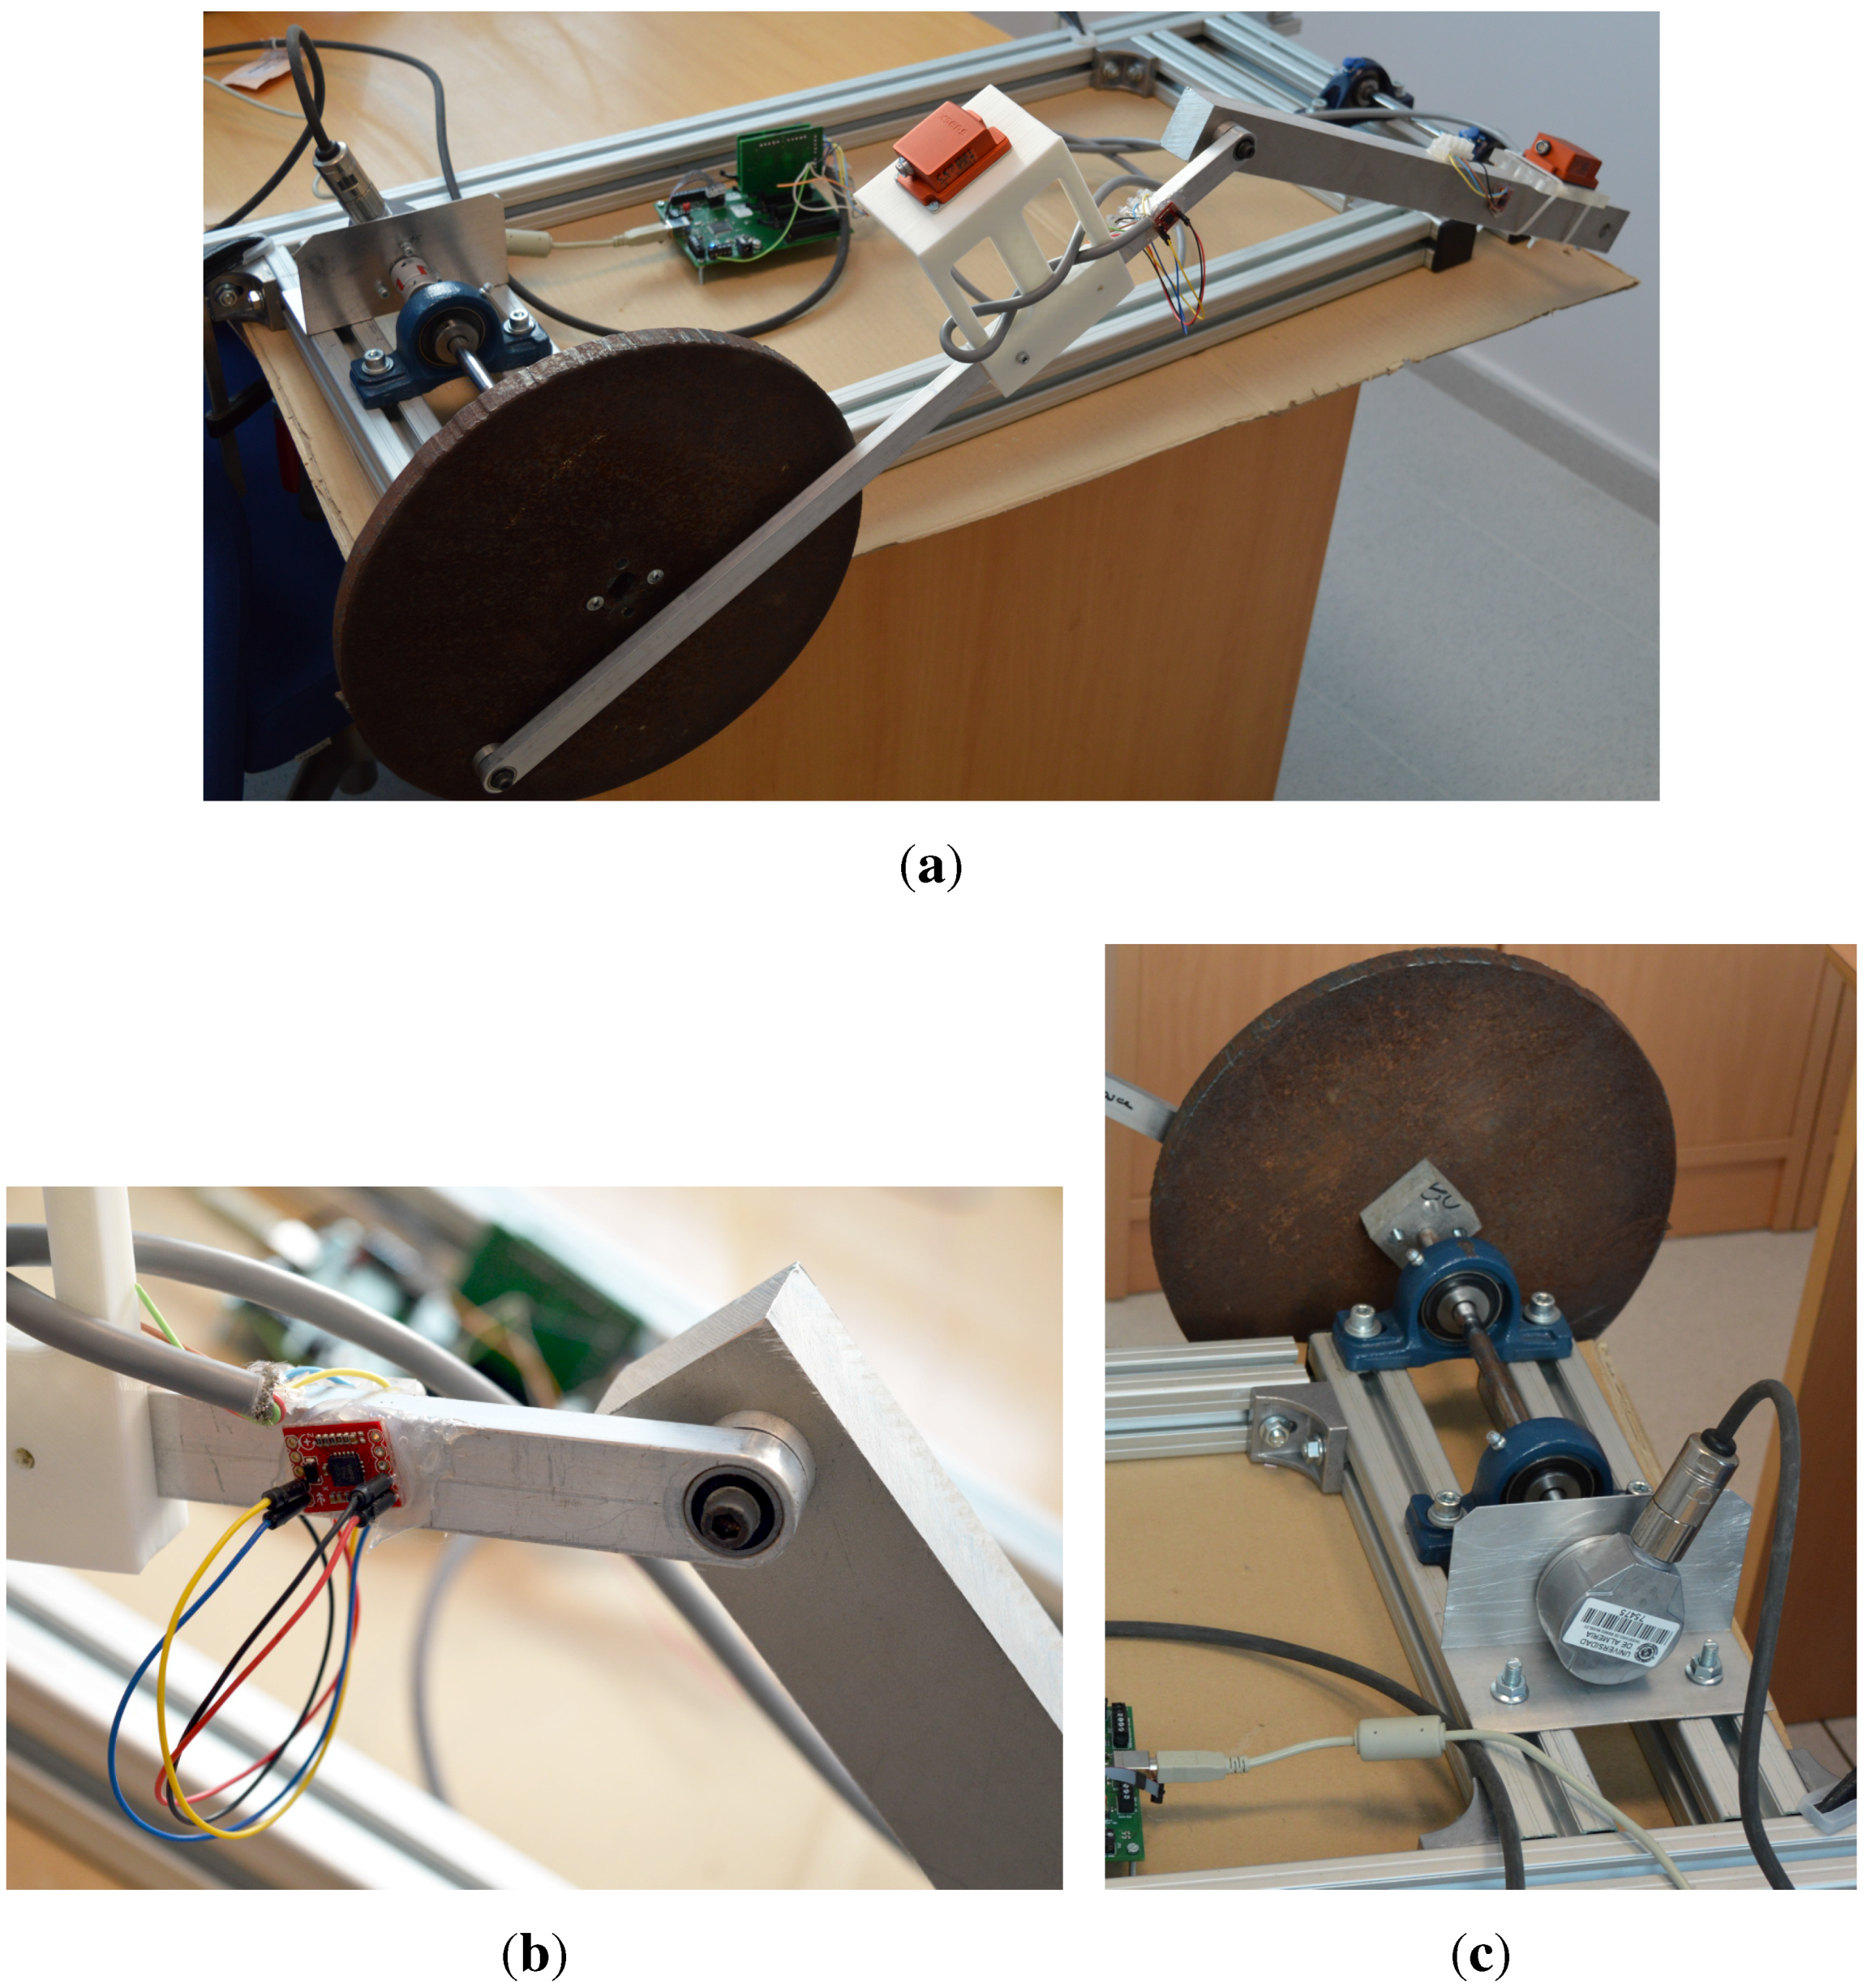
Figure 8.
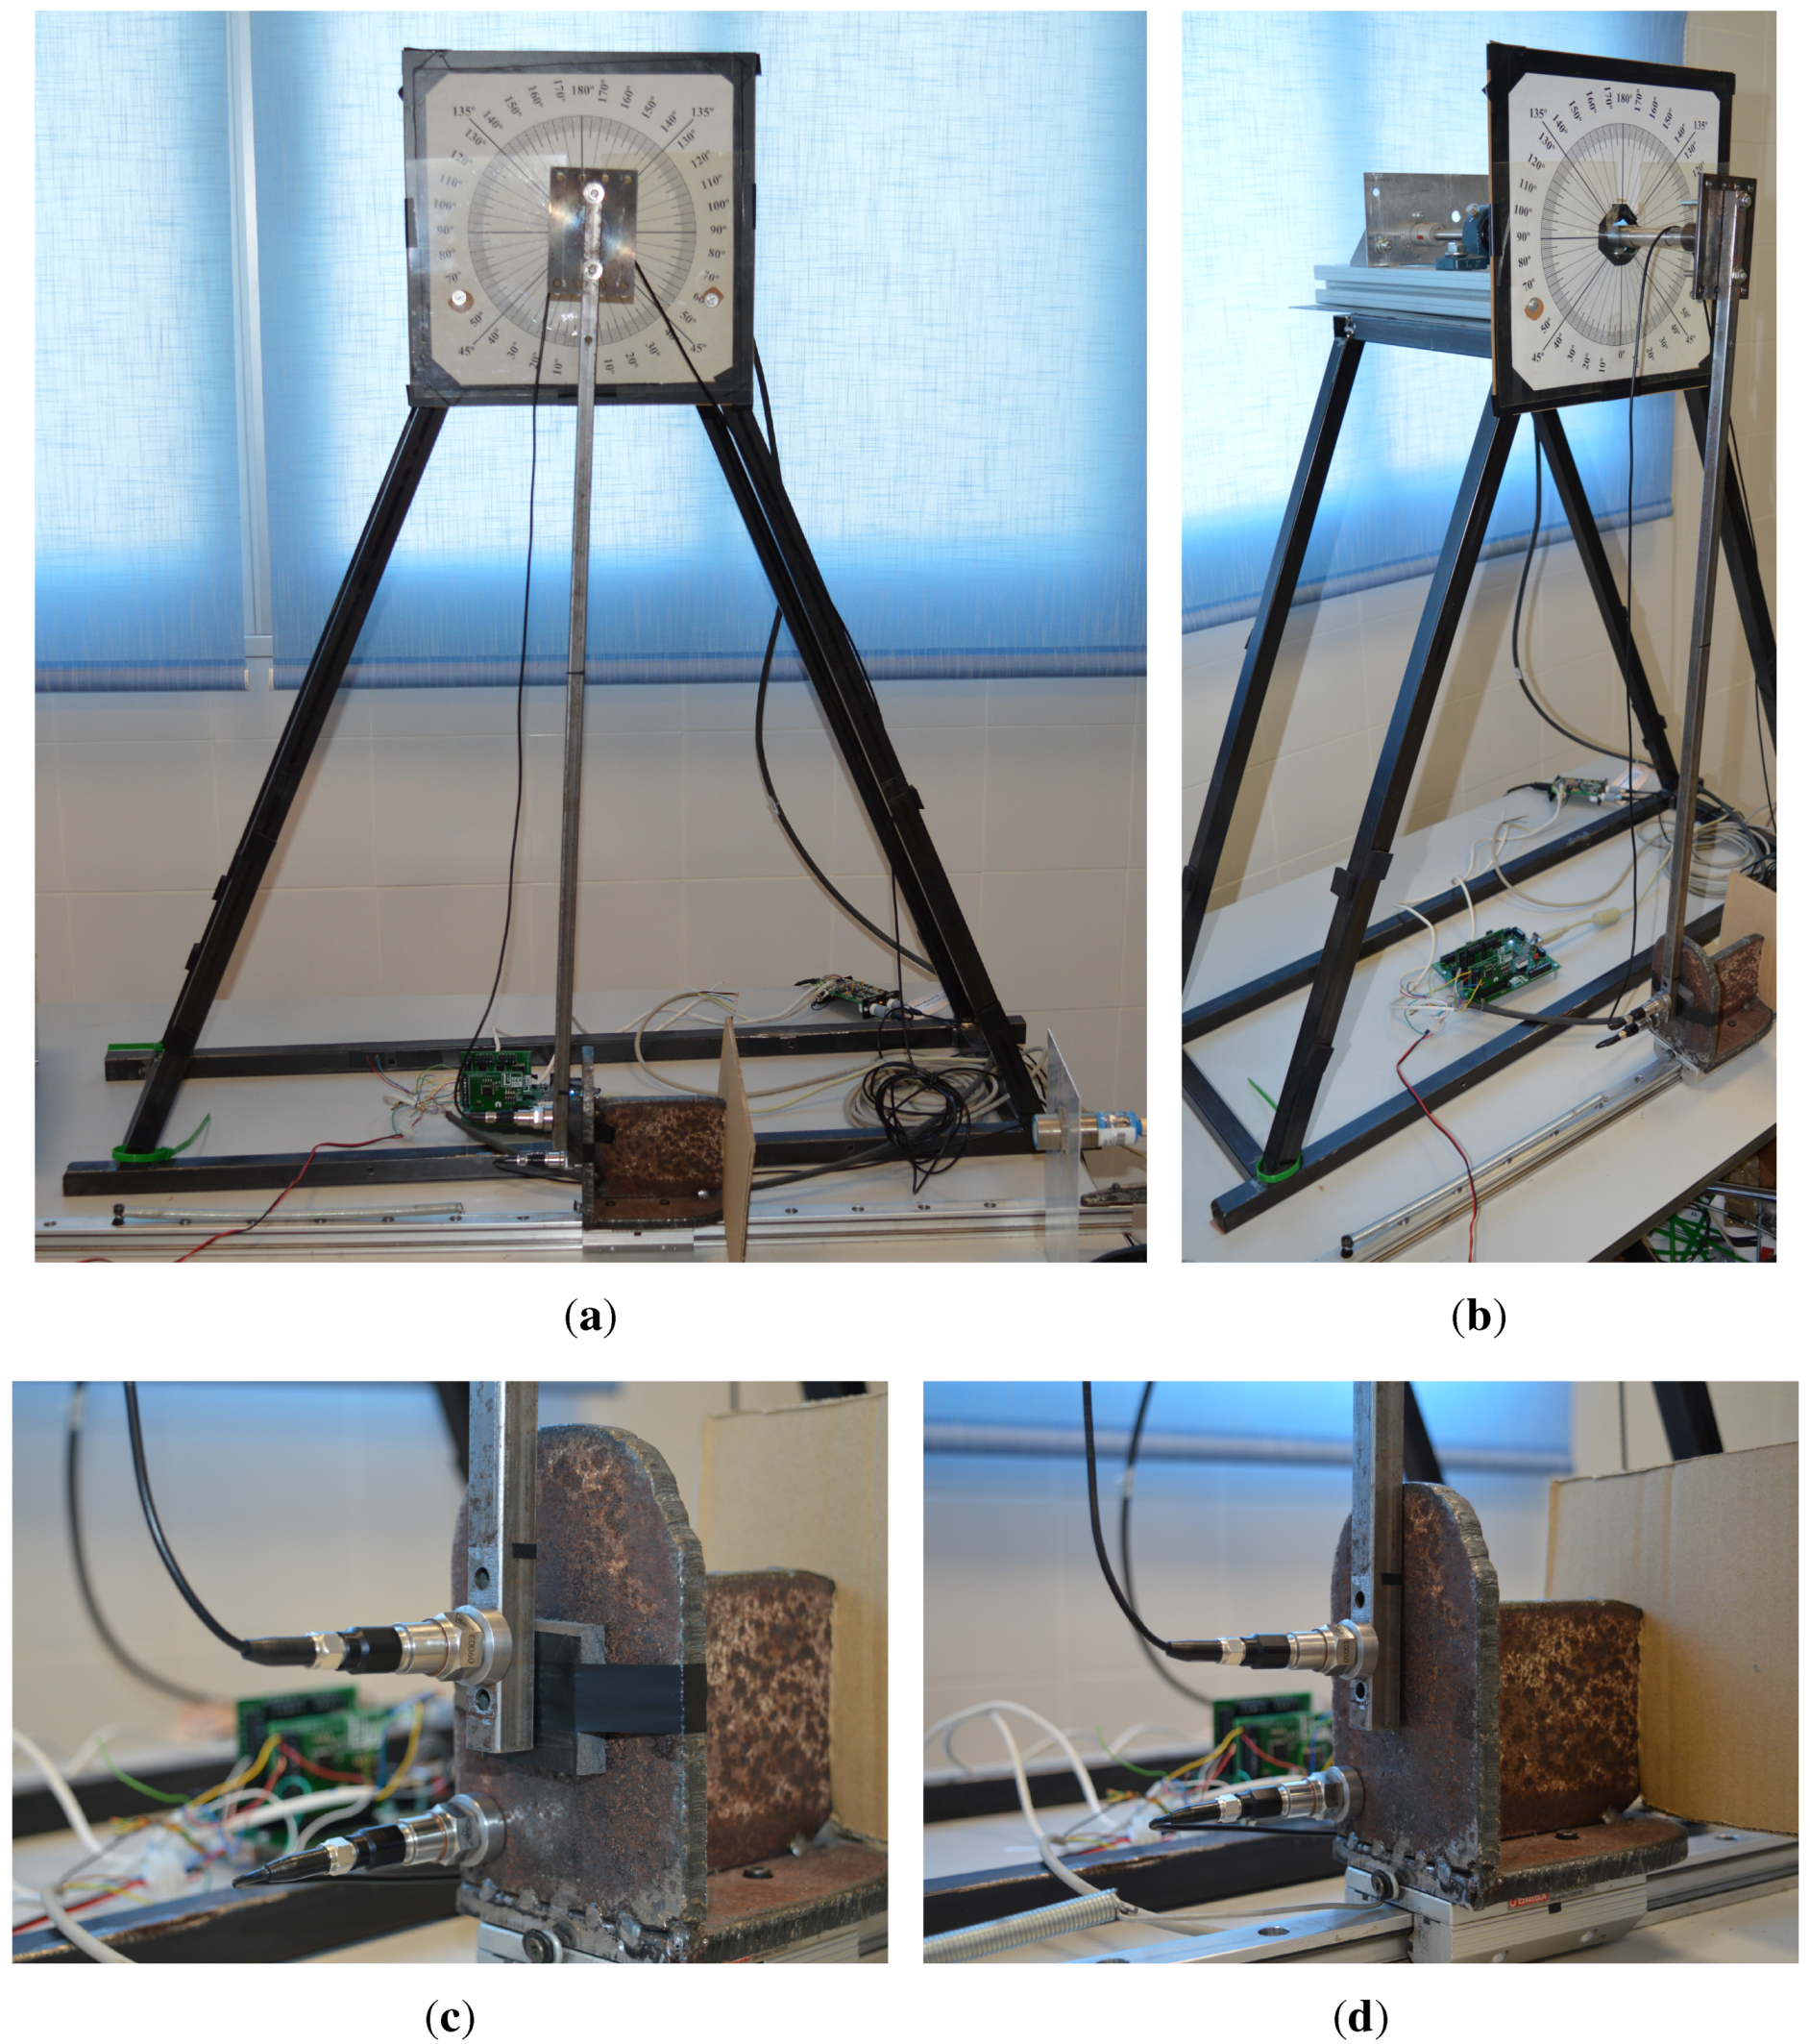
(a,b) Views of the impact testbed used in these experiments. The rigid rod is standing still in vertical position here, touching the mobile mass on a linear bearing at the bottom; (c) A close-up view of the two accelerometers, on the rod and the mass, with foam installed at the impact point; (d) The same view for the tests without protective foam.
Figure 8.
(a,b) Views of the impact testbed used in these experiments. The rigid rod is standing still in vertical position here, touching the mobile mass on a linear bearing at the bottom; (c) A close-up view of the two accelerometers, on the rod and the mass, with foam installed at the impact point; (d) The same view for the tests without protective foam.
The impact testbed used is shown in
Figure 8. It consists of a pendulum mechanism and a “dummy”. A horizontal axle, attached to an optical quadrature encoder, is firmly joined to a slender rod, which in the pictures is shown resting in its vertical (equilibrium) position. At the bottom, we can find a horizontal sliding mass (a “dummy” body), which is kept in place by means of a linear spring. Impact tests are performed by raising the rod (in the clockwise direction, as seen in the pictures), then dropping it in such a way that it hits the mass at the bottom. Depending on the mass of the rod and the “dummy”, their mechanical characteristics, and the covering material placed in the contact area, different phenomena can be observed at the instant of collision. The testbed was already described in previous works [
18], while analyzing safety issues in robot arm-human collisions. For more details, please see that work on this testbed.
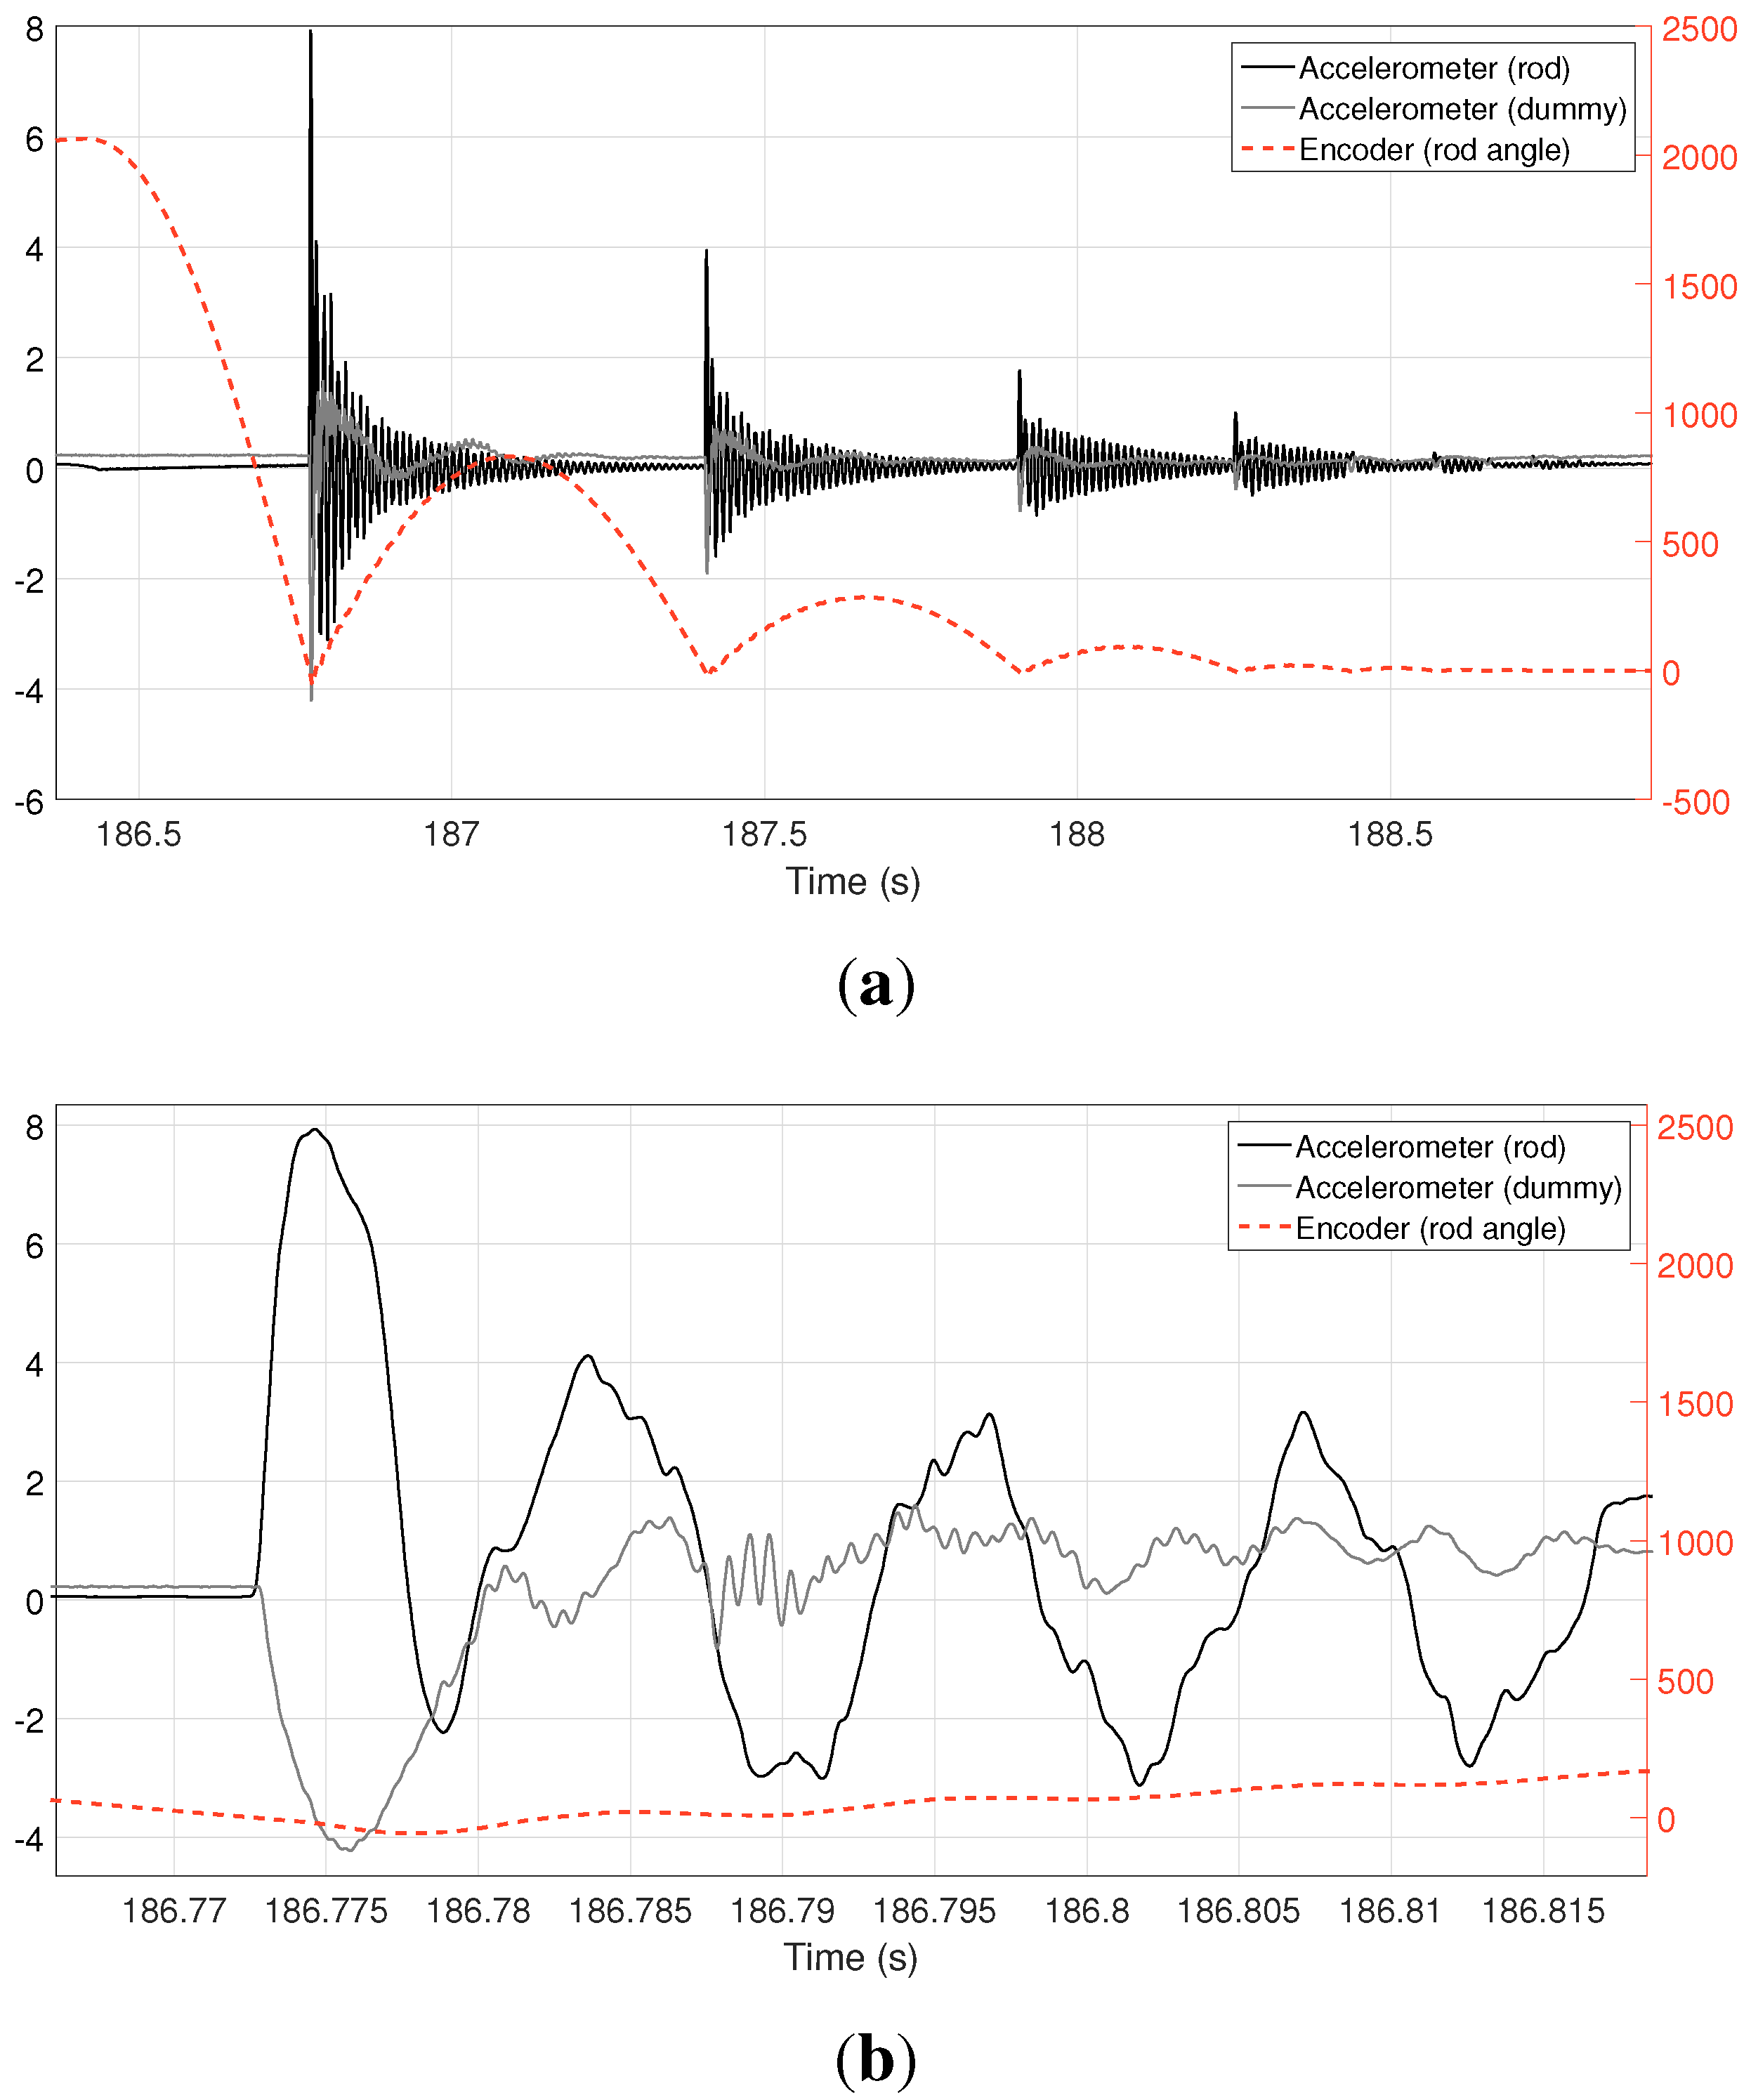
Figure 9.
(a) Overview and (b) close-up of the collision test. Left-hand vertical axis represents voltage for accelerometer readings (after signal conditioning), whereas the right-hand axis stands for pulse counts for the encoder attached to the rod axle.
Figure 9.
(a) Overview and (b) close-up of the collision test. Left-hand vertical axis represents voltage for accelerometer readings (after signal conditioning), whereas the right-hand axis stands for pulse counts for the encoder attached to the rod axle.
The sensors used in this experiment were two piezoelectric accelerometers, attached to the rod and to the “dummy” mobile mass at the bottom, and the quadrature encoder of the rod axle. Several tests were conducted using different material covers at the impact point, including a thick foam cover and no covering at all.
Figure 9 shows an overview of all of the acquired signals for the case of using the foam covering. The first impact is clearly seen at t = 186.77 s, with at least four more collisions caused by rebounds of the rod; refer to the rod angle, measured by the encoder and plotted as a dashed, red line. A close-up of the signals upon the first impact is shown in
Figure 9b, where it is obvious that a delay(∼2–5 ms) exists between the impact, as detected by the accelerometers, and the detection of any significant effect at the other end of the rod (see the encoder signal), probably caused by the elastic deflection of the rod due to its kinematic energy. Another expected outcome is the generation of a complex vibration pattern in both the rod and the dummy mass.
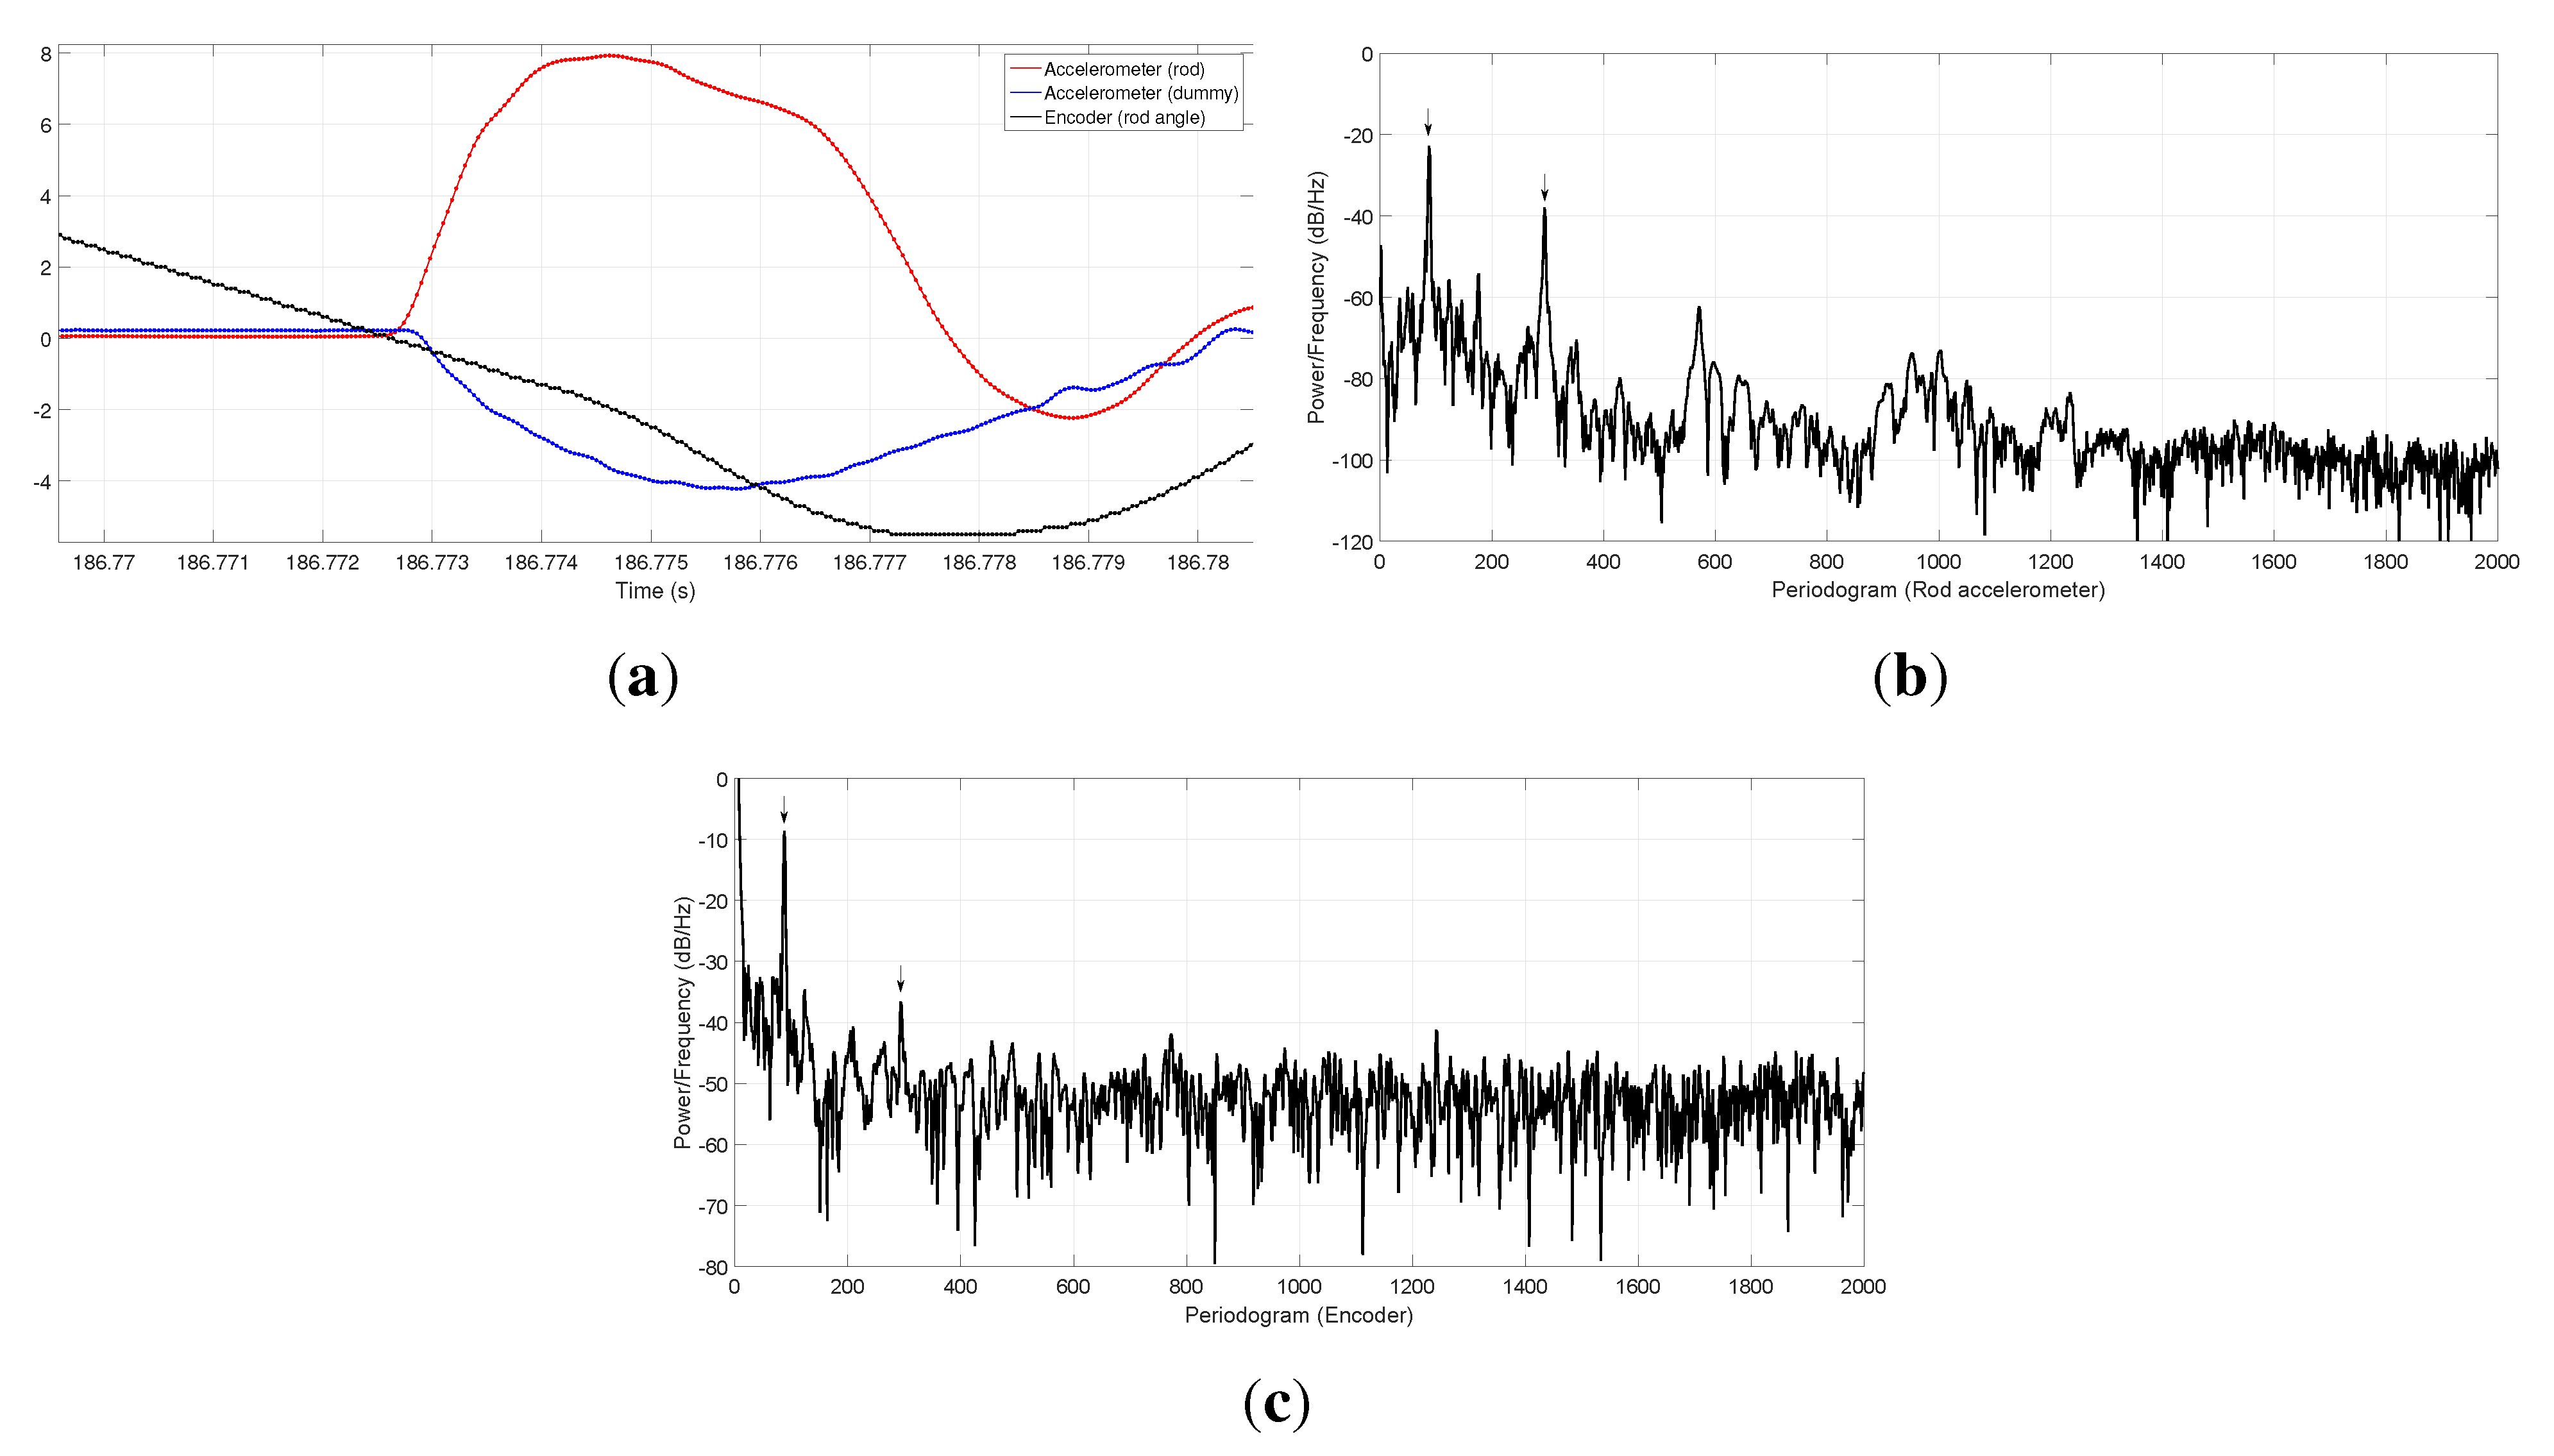
A notable observation allowed by the high sampling rate of our system is the experimental determination of the time required by the impact to reach, through the foam cover, the accelerometer in the “dummy” mass. Another close-up view of the instant of impact with even higher temporal resolution, shown in
Figure 10a, reveals a delay between the responses of both accelerometers. The rod seems to start noticing the impact at t = 186.772300 s, whereas the dummy response starts at t = 186.772820 s, giving a measured delay of ∼520
. Regarding the encoder data at the other end of the rod, the approximate constant velocity that can be appreciated during the last few milliseconds immediately before the collision is affected only about 2.74 ms after the impact, which could be explained again by the body elastic properties.
Figure 10.
(a) Signals at the instant of impact, with a more detailed time scale; (b) Spectral density of the rod accelerometer during one rod oscillation period after the impact; and (c) the same spectral density but computed from the optical encoder data.
Figure 10.
(a) Signals at the instant of impact, with a more detailed time scale; (b) Spectral density of the rod accelerometer during one rod oscillation period after the impact; and (c) the same spectral density but computed from the optical encoder data.
In addition to these time domain tests, the vibration spectrum of the rod after the impact has been determined by means of the power spectral density (PSD) of the signals from the rod accelerometer and the rod optical encoder, leading to the results shown in
Figure 10b,c, respectively. At least two clear fundamental frequencies are visible in both spectra, the first at 87.4 Hz in the accelerometer data (87.25 Hz for the encoder) and the second at 293.9 Hz in the accelerometer data (293.5 Hz for the encoder). These results are an important success, since they demonstrate the consistent sampling of heterogeneous signal types,
i.e., analog voltage values from the accelerometers and digital counters from quadrature decoders, the latter having a discrete nature (less resolution), hence a more reduced SNR than the former.


 and
and 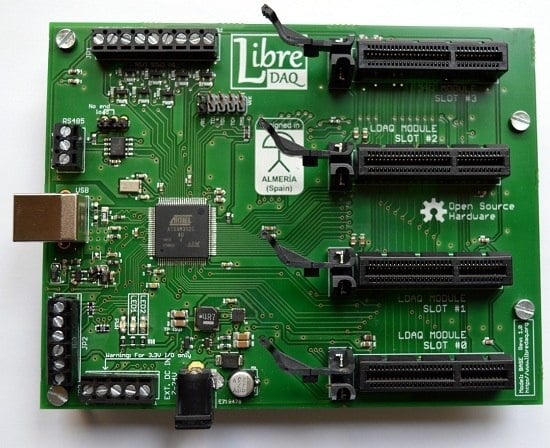
